
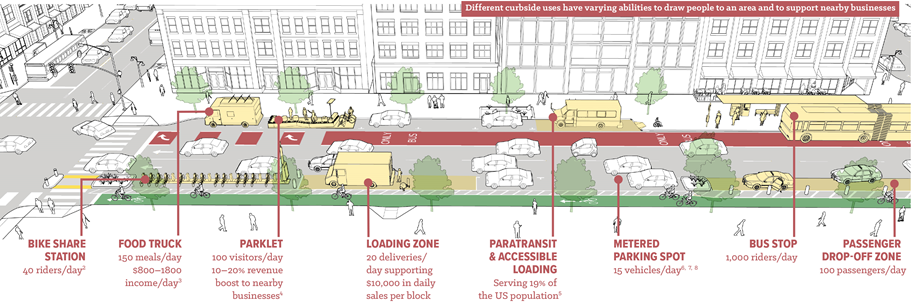
Increased demand on limited curbside space by a range of users, from ride-hailing vehicles to delivery trucks, micromobility services, and more, has exacerbated congestion and made it difficult for officials to balance multimodal needs for safe and efficient curbside access. A 2017 National Association of City Transportation Officials white paper highlights how cities can use the organizing principles of Complete Streets to prioritize transit to reduce congestion, enhance safety, and support multiple modes. In the Boston region, more municipalities are implementing Complete Streets policies and designs to improve access and safety for people walking, biking, and taking transit. The Boston Region Metropolitan Planning Organization’s (MPO) newly adopted Long-Range Transportation Plan, Destination 2040, increased the funding goal for the Complete Streets investment program from 29 percent to 45 percent to support more Complete Streets projects and include funding for dedicated bus lanes. In a previous study, the Central Transportation Planning Staff identified the highest priority bus corridors for dedicated bus lanes based on the rate of delay that bus riders encounter as a result of traffic congestion. The MPO’s recently released Future of the Curb report explores various conflicts arising from the new and increasingly competing demands for curb space access and potential solutions that have been implemented in cities across the country.
Accommodating Passenger Pickups and Drop-Offs
With ride-hail usage in Massachusetts rising 25 percent from 2017 to 2018 by 81.3 million rides, there is increasing demand for curb space for passenger pickup and drop-off. The Metropolitan Area Planning Council recently conducted a survey of ride-hail passengers and drivers and found that 59 percent of ride-hail trips in the Boston region would have been made by transit, by bike, on foot, or not at all if ride-hailing were not available. This increase in ride-hail trips, with little space allocated for pickups and drop-offs, results in drivers double-parking in travel lanes, bus stops, and bike lanes, jeopardizing the safety of other users and intensifying congestion.
To accommodate this need, officials in Washington, DC, piloted replacing parking near a popular dining and entertainment area with passenger pickup and drop-off zones. During the pilot, officials monitored crash rates, traffic flow, ride-hail and taxi dwell time, transit and bikeshare ridership, transit travel speeds, parking citation trends, and economic impacts. After a nine-month evaluation period, the zones were converted to permanent, all-day pickup and drop-off zones, and the program was expanded to five more locations across the city. In San Francisco, officials worked with Lyft to trial geofencing to consolidate pickup and drop-off locations within particularly congested areas.
Closer to home, the City of Boston is piloting designated pickup and drop-off spaces on Boylston Street near Fenway Park. Designated pickup and drop-off zones could prove effective at reducing congestion, improving safety, and increasing the ability of ride-hail drivers and passengers to access the curb.
Managing On-Street Parking
When on-street parking is provided for free or at a low cost, occupancy tends to be high and turnover is low, especially when spaces do not have time limits. By dynamically pricing parking, cities can encourage turnover, which will reduce the number of drivers cruising for parking and ensure a few spaces will be available. In April 2011, San Francisco implemented a dynamic pricing pilot project called SFpark. The results of the SFpark project found
- a 43 percent reduction in time spent searching for parking;
- a 23 percent reduction in parking citations;
- a 30 percent reduction in vehicle emissions from vehicles searching for parking; and
- a 30 percent reduction in vehicle-miles traveled in the pilot area.
A similar program implemented in Washington, DC, resulted in improved vehicle turnover, improved placard compliance, reduced incidence of double-parking, and increased meter revenues.
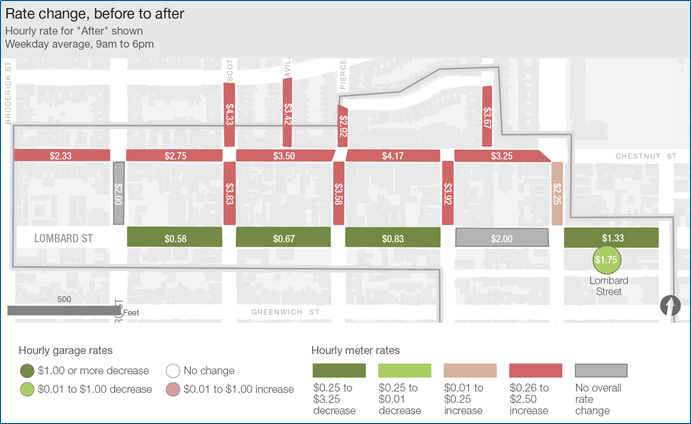
In the City of Boston, officials raised the hourly rate of street parking in Back Bay from $1.25 per hour to $3.75 per hour, and found that the instance of double-parking reduced by 14 percent, and illegal parking in commercial vehicle loading zones reduced by 33 percent.
Managing Commercial Vehicle Loading Activity
Commercial vehicles are an increasing source of congestion on city streets and at the curb. According to CityLab, commercial vehicles now account for seven percent of urban traffic. The increase in commercial activity is putting a strain on existing infrastructure, forcing some delivery drivers to double-park in travel lanes, block bike lanes and bus stops, or encroach on pedestrian space. This is described in the Boston Globe’s Spotlight Investigation, Seeing Red. A study in Seattle found that when observing curb activity at five downtown locations on weekdays during the business day, 40 percent of commercial vehicles parked in bus lanes, passenger pickup and drop-off zones, tow-away zones, or other no parking zones. Some cities are working to solve this conflict by monitoring existing loading space for occupancy and dwell times, identifying opportunities to create more loading space, and rethinking delivery systems.
The District Department of Transportation (DDOT) in Washington, DC, rolled out a program in 2015 that required commercial vehicle operators to obtain a daily or annual permit to park in commercial loading zones. DDOT found that
- double-parking and illegal U-turns decreased by 64 percent near the new loading zones;
- commercial vehicles spent an average of 7–11 minutes in each zone; and
- small scale on-demand deliveries were most frequent.
In Seattle, researchers are looking beyond parking and focusing on the time it takes to move from the truck, down the street, through the buildings and back (which researchers call “the final 50 feet”), finding that for every 20 minutes a commercial vehicle spends at the curb, 12 minutes are spent going door-to-door and floor-to-floor to deliver the goods. Researchers found that a shared locker system trial in a major downtown office tower reduced vehicle dwell times by 78 percent and eliminated failed first delivery attempts.
Key Takeaways
There are a number of ways to address the increasing and changing multimodal demands on curb space, such as:
- Prioritizing curb lanes: For instance, learning from the City of Seattle Flex Zone/Curb Use Priorities plan, where curbs are broken into six categories based on the community’s goals—mobility, access for people, access for commerce, activation, greening, and storage—city officials can shift the conversation away from removing parking and refocus it around community goals.
- Evaluating the curb: The value of a curb lane is more tangible when it is measured, and there are different ways to measure the curb depending on the curb’s function.
- Actively managing use: Officials should consider flexibility in curb lane designations and dynamic management systems because the demands on the curb from different users change throughout the day.
- Building on the success of others: Officials can learn from the successes of other cities and programs. Pilot projects, which are often delivered more quickly and at a lower cost, can give officials the flexibility to trial several solutions, collect and analyze data, and evaluate projects.
Ultimately, the curb lane of the future will need to be designated in a way that reflects a community’s goals, be measured in a way that is appropriate to those goals, and be actively managed and monitored to ensure the way it is being used supports those goals.
Follow Us
This study was presented at the MPO meeting on December 5, 2019. Read the full report and check out other MPO studies to learn more about this effort and how it fits into the bigger picture of measuring mobility and access in the region.
The federal fiscal year 2019 ended in September and with it, a year of research studies and technical work at the MPO. These studies are being presented to the MPO board and will be available on the MPO’s website in the coming months. Keep an eye out for the results of analyses on topics such as new metrics for roadway usage, updates to the MPO’s traffic volume charts, and an interactive application for assessing the pedestrian environment.
Stay informed on the release of new work by subscribing to our mailing list and following us on Twitter @BostonRegionMPO.