Executive Summary
Chapter 1: 3C Transportation Planning and the Boston Region Metropolitan Planning Organization
Chapter 2: The TIP Process
Chapter 3: Summary of Highway and Transit Programming
Chapter 4: Performance Analysis
Chapter 5: Determination of Air Qulaity Conformity
Chapter 6: Transportation Equity Performance
Certification of the Boston Region MPO Transportation Planning Process
Prepared by
The Central Transportation Planning Staff:
Staff to the Boston Region Metropolitan Planning Organization
Directed by the Boston Region Metropolitan Planning Organization,
which is composed of the
Meeting locations are accessible to people with disabilities and are near public transportation. Upon request (preferably two weeks in advance of the meeting), every effort will be made to provide accommodations such as assistive listening devices, materials in accessible formats and in languages other than English, and interpreters in American Sign Language and other languages. Please contact the MPO staff at 857.702.3700 (voice), 617.570.9193 (TTY), 617.570.9192 (fax), or eharvey@ctps.org.
The Boston Region Metropolitan Planning Organization (MPO) operates its programs, services, and activities in compliance with federal nondiscrimination laws including Title VI of the Civil Rights Act of 1964 (Title VI), the Civil Rights Restoration Act of 1987, and related statutes and regulations. Title VI prohibits discrimination in federally assisted programs and requires that no person in the United States of America shall, on the grounds of race, color, or national origin (including limited English proficiency), be excluded from participation in, denied the benefits of, or be otherwise subjected to discrimination under any program or activity that receives federal assistance. Related federal nondiscrimination laws administered by the Federal Highway Administration, Federal Transit Administration, or both, prohibit discrimination on the basis of age, sex, and disability. The Boston Region MPO considers these protected populations in its Title VI Programs, consistent with federal interpretation and administration. In addition, the Boston Region MPO provides meaningful access to its programs, services, and activities to individuals with limited English proficiency, in compliance with U.S. Department of Transportation policy and guidance on federal Executive Order 13166.
The Boston Region MPO also complies with the Massachusetts Public Accommodation Law, M.G.L. c 272 sections 92a, 98, 98a, which prohibits making any distinction, discrimination, or restriction in admission to, or treatment in a place of public accommodation based on race, color, religious creed, national origin, sex, sexual orientation, disability, or ancestry. Likewise, the Boston Region MPO complies with the Governor's Executive Order 526, section 4, which requires that all programs, activities, and services provided, performed, licensed, chartered, funded, regulated, or contracted for by the state shall be conducted without unlawful discrimination based on race, color, age, gender, ethnicity, sexual orientation, gender identity or expression, religion, creed, ancestry, national origin, disability, veteran's status (including Vietnam-era veterans), or background.
A complaint form and additional information can be obtained by contacting the MPO or at http://www.bostonmpo.org/mpo_non_discrimination. To request this information in a different language or in an accessible format, please contact
Title VI Specialist
Boston Region MPO
10 Park Plaza, Suite 2150
Boston, MA 02116
civilrights@ctps.org
By telephone:
857.702.3700(voice)
For people with hearing or speaking difficulties, connect through the state MassRelay service:
Relay Using TTY or Hearing Carry-over: 800.439.2370
Relay Using Voice Carry-over: 866.887.6619
Relay Using Text to Speech: 866.645.9870
For more information, including numbers for Spanish speakers, visit https://www.mass.gov/massrelay
Ethan Lapointe
TIP Manager, Central Transportation Planning Staff
10 Park Plaza, Suite 2150
Boston, MA 02116
857.702.3703 (voice)
For people with hearing or speaking difficulties, connect through the state MassRelay service:
Relay Using TTY or Hearing Carry-over: 800.439.2370
Relay Using Voice Carry-over: 866.887.6619
Relay Using Text to Speech: 866.645.9870
For more information, including numbers for Spanish speakers, visit https://www.mass.gov/massrelay
This document was funded in part through grants from the US Department of Transportation. Its contents do not necessarily reflect the official views or policies of the US Department of Transportation.
[SIGNED CERTIFICATION coming soon]
The Boston Region Metropolitan Planning Organization’s (MPO) five-year capital investment plan, the Federal Fiscal Years (FFYs) 2024–28 Transportation Improvement Program (TIP), is the near-term investment program for the region’s transportation system. Guided by the Boston Region MPO’s vision, goals, and objectives, the TIP prioritizes investments that preserve the current transportation system in a state of good repair, provide safe transportation for all modes, enhance livability, promote equity and sustainability, and improve mobility throughout the region. These investments fund arterial roadway and intersection improvements, maintenance and expansion of the public transit system, bicycle path construction, infrastructure improvements for pedestrians, and major highway reconstruction.
The Boston Region MPO is guided by a 22-member board with representatives of state agencies, regional organizations, and municipalities. Its jurisdiction extends roughly from Boston north to Ipswich, south to Marshfield, and west to municipalities along Interstate 495. Each year, the MPO conducts a process to decide how to spend federal transportation funds for capital projects. The Central Transportation Planning Staff (CTPS), which is the staff to the MPO, manages the TIP development process.
MPO staff coordinates the evaluation of project funding requests, proposes programming of current and new projects based on anticipated funding levels, supports the MPO board in developing a draft TIP document, and facilitates a public review of the draft before the MPO board endorses the final document.
The complete TIP program is available in Chapter 3 of this document and online at bostonmpo.org/tip. The TIP tables provide details of how funding is allocated to each programmed project and capital investment program. These tables are organized by federal fiscal year and are grouped by highway and transit programs.
The Highway Program of the TIP funds the priority transportation projects advanced by the Massachusetts Department of Transportation (MassDOT) and the cities and towns within the Boston region. The program is devoted primarily to preserving and modernizing the existing roadway network by reconstructing arterial roadways, resurfacing highways, and replacing bridges.
In Massachusetts, Federal-Aid Highway Program funding is apportioned by MassDOT, which allocates funding to Grant Anticipation Notes (GANs) payments, various statewide programs, and Regional Targets for the state’s MPOs. In the FFYs 2024–28 TIP, roadway, bridge, and bicycle and pedestrian programs account for nearly $2.4 billion in funding to the Boston region. The Regional Target funding provided to the MPOs may be programmed for projects at the discretion of each MPO, whereas MassDOT has discretion to propose its recommended projects for statewide programs, such as those related to bridge repairs and interstate highway maintenance.
The Transit Program of the TIP provides funding for projects and programs that address the capital needs prioritized by the three transit authorities in the region: the Massachusetts Bay Transportation Authority (MBTA), the Cape Ann Transportation Authority (CATA), and the MetroWest Regional Transit Authority (MWRTA). The Transit Program is predominantly dedicated to achieving and maintaining a state of good repair for all assets throughout the transit system.
The FFYs 2024–28 TIP includes $4.05 billion in transit investments by the transit authorities that will support state of good repair, modernize transit systems, and increase access to transit. Additionally, beginning in FFY 2025, the MPO will allocate $6.5 million of its annual Regional Target funds to its new Transit Modernization investment program. This program aims to build on the investments made through the Transit Program by using a portion of Highway Program funding to fulfill unmet transit project needs in the region. The MPO has already begun to fund discrete projects through this program prior to FFY 2025 based on a surplus of available funding in FFY 2024, as detailed below.
During FFYs 2024–28, the Boston Region MPO plans to fund 58 projects with its Regional Target funding. In total, 21 new projects were added to the MPO’s Regional Target Program during this TIP cycle. Details on these projects are available in Table ES-1.
Table ES-1
New Regional Target Projects Funded in the FFYs 2024–28 TIP
Project Name |
Municipality (Proponent) |
MPO Investment Program |
FFYs of Funding |
Regional Target Dollars Programmed in FFYs 2024–28 |
|
Malden—Spot Pond Brook Greenway |
Malden |
Bicycle Network and Pedestrian Connections |
2027 |
$4,858,127 |
|
Natick—Cochituate Rail Trail Extension, from MBTA station to Mechanic Street |
Natick |
Bicycle Network and Pedestrian Connections |
2028 |
$7,760,451 |
|
Westwood–Norwood—Reconstruction of Canton Street to University Drive, including rehabilitation of N-25-032=W-31-018 |
Westwood |
Complete Streets |
2027 |
$22,094,875 |
|
Boston—Bridge Preservation, B-16-066 (38D), Cambridge Street over MBTA |
Boston |
Complete Streets |
2026 |
$16,632,000 |
|
Wakefield—Comprehensive Downtown Main Street Reconstruction |
Wakefield |
Complete Streets |
2028 |
$16,581,200 |
|
MWRTA CatchConnect Microtransit Service Expansion Phase II |
MWRTA |
Community Connections |
2024–26 |
$380,477 |
|
Lynn—Broad Street Corridor Transit Signal Priority |
Lynn |
Community Connections |
2024 |
$297,800 |
|
Medford Bicycle Parking–Tier 1 |
Medford |
Community Connections |
2024 |
$29,600 |
|
Medford Bluebikes Expansion |
Medford |
Community Connections |
2024 |
$118,643 |
|
Canton Public Schools Bike Program |
Canton |
Community Connections |
2024 |
$22,500 |
|
Canton Center Bicycle Racks |
Canton |
Community Connections |
2024 |
$10,000 |
|
Boston Electric Bluebikes Adoption |
Boston |
Community Connections |
2024 |
$1,020,000 |
|
Cambridge Electric Bluebikes Adoption |
Cambridge |
Community Connections |
2024 |
$352,575 |
|
Acton Parking Management System |
Acton |
Community Connections |
2024 |
$15,000 |
|
|
Bikeshare State of Good Repair Set-Aside |
CTPS |
Community Connections |
2025–28 |
6,000,000 |
|
Everett—Targeted Multi-Modal and Safety Improvements on Route 16 |
MassDOT |
Intersection Improvements |
2027 |
$5,246,920 |
|
Chelsea—Targeted Safety Improvements and Related Work on Broadway, from Williams Street to City Hall Avenue |
MassDOT |
Intersection Improvements |
2025 |
$12,872,911 |
|
Jackson Square Station Accessibility Improvements |
MBTA |
Transit Modernization |
2024–25 |
$26,250,000 |
|
Rail Transformation Early Action Items—Reading Station and Wilbur Interlocking |
MBTA |
Transit Modernization |
2024 |
$14,000,000 |
|
Columbus Ave Bus Lane Phase II |
MBTA |
Transit Modernization |
2024 |
$11,750,000 |
|
Project Design Support Pilot |
CTPS |
Project Design Support Pilot |
2025 |
$4,000,000 |
|
Total |
N/A |
N/A |
N/A |
$150,293,079 |
|
Note: Funding amounts in this table include both federal and non-federal funds, including matching funds.
CTPS = Central Transportation Planning Organization. FFY = federal fiscal year. MPO = metropolitan planning organization. MWRTA = MetroWest Regional Transit Authority. N/A = not applicable. TIP = Transportation Improvement Program.
Source: Boston Region MPO.
Signed into law on November 15, 2021, the Bipartisan Infrastructure Law (BIL) is the five-year federal funding authorization for transportation projects and programs, replacing the Fixing America’s Surface Transportation (FAST) Act as the primary governing legislation for the TIP process. The BIL increased the amount of Regional Target funding available to the Boston Region MPO for the development of the FFYs 2024–28 TIP by approximately 20 percent from the funding levels in TIPs under the FAST Act, the last of which was the FFYs 2022–26 TIP.
The majority of the funding available for allocation by the MPO during the FFYs 2024–28 TIP cycle was in the fifth and final year of the TIP, FFY 2028. However, changes in project readiness for some projects created funding surpluses in the early years of the TIP, FFYs 2024 and 2025, and in FFY 2027. These surpluses were driven by programming delays for several projects already funded by the MPO. This dynamic led to a funding surplus in excess of $66.5 million in FFYs 2024 and 2025 and total funding availability of $202 million across all years of the TIP.
The MPO did not have any currently funded Regional Target projects that could be accelerated to make use of these funds, so the MPO worked with MassDOT and the MBTA to identify projects that could be funded in these fiscal years. Jointly, MassDOT and the MBTA brought more than a dozen projects to the MPO for consideration, from which the MPO selected four projects for funding in FFYs 2024 and 2025:
The MPO also selected two MassDOT projects for funding in FFY 2027:
These projects were not formally evaluated using the MPO’s project selection criteria prior to the MPO making draft funding decisions, as MPO staff did not have sufficient time to score the projects prior to the deadline for MPO decision-making. Despite not being scored, the projects generally align well with many of the MPO’s goals, including enhancing bicycle and pedestrian safety and access, and expanding the accessibility of and maintaining a state of good repair for the region’s transit system and critical roadways. Scoring information will be included for these projects when available.
Several other key decisions were made by the MPO in the drafting of the FFYs 2024–28 Regional Target Program, including the following:
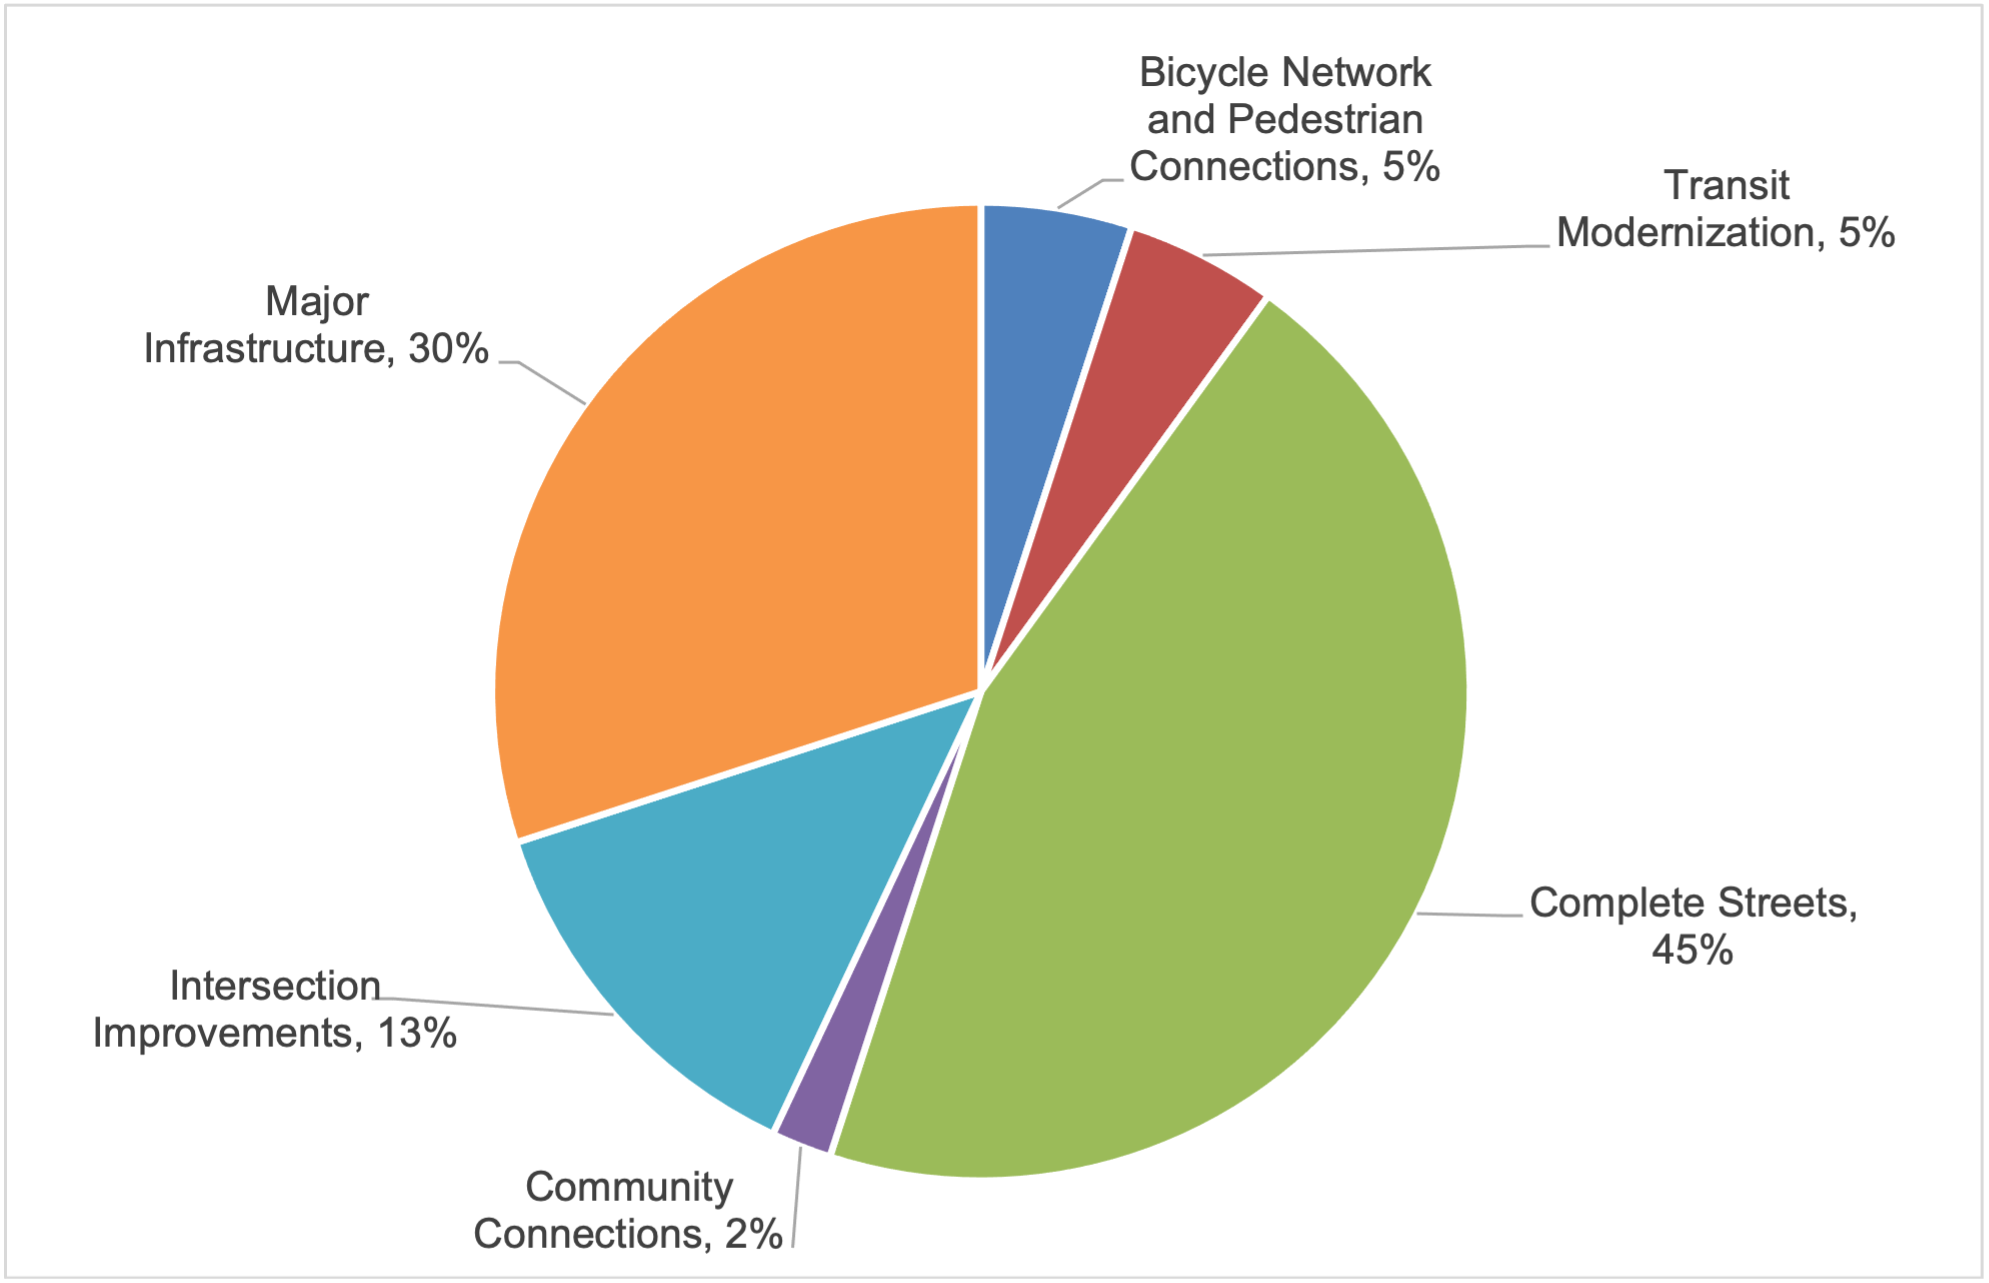
Figure ES-1 shows how the Regional Target funding for FFYs 2024–28 is distributed across the MPO’s investment programs. As the chart shows, the Boston Region MPO’s Regional Target Program is devoted primarily to enhancing mobility and safety for all travel modes through significant investments in Complete Streets projects. A large portion of the MPO’s funding also supports the modernization of key regional roadways and transit infrastructure through investments in Major Infrastructure and Transit Modernization projects. The MPO also elected to leave approximately $31.9 million unprogrammed, preferring to retain these funds for use in future TIP cycles in support of a more flexible overall program in the coming fiscal years.
Figure ES-1
FFYs 2024–28 TIP Regional Target Funding by MPO Investment Program

FFY = federal fiscal year. MPO = metropolitan planning organization. TIP = Transportation Improvement Program.
Source: Boston Region MPO.
In addition to the distribution of funding across the MPO’s investment programs listed above, Table ES-2 further details the number of projects and the allocation of funds across each program in the FFYs 2024–28 TIP. As noted in Figure ES-1, the MPO has programmed more than 95 percent of its available funding over five years. More details about every project funded through the MPO’s Regional Target Program are available in Chapter 3.
Table ES-2
FFYs 2024–28 Boston Region MPO Regional Target Investment Summary
MPO Investment Program |
Number of Projects |
Regional Target Dollars Programmed |
Bicycle Network and Pedestrian Connections |
6 |
$66,140,116 |
Community Connections (allocated to projects)* |
17 |
$11,529,796 |
Community Connections (not yet allocated to projects) |
N/A |
$8,334,827 |
Complete Streets* |
22 |
$328,884,130 |
Intersection Improvements |
5 |
$44,424,588 |
Major Infrastructure—Roadway |
3 |
$125,094,890 |
Transit Modernization (allocated to projects) |
4 |
$65,600,000 |
Transit Modernization (not yet allocated to projects) |
N/A |
$21,500,000 |
Unprogrammed |
N/A |
$26,036,440 |
Total |
57 |
$697,544,788 |
Note: Funding amounts in this table include both federal and non-federal funds, including matching funds.
* This includes $6 million in Bikeshare Support funding starting in FFY 2025.
**The $4 million Project Design Support Pilot in FFY 2025 is accounted for under this program.
FFY = federal fiscal year. MPO = metropolitan planning organization. N/A = not applicable.
Source: Boston Region MPO.
When making decisions about which projects to fund, the MPO considers how the allocation of funds to each investment program compares to the funding goals outlined in the MPO’s current Long-Range Transportation Plan (LRTP), Destination 2040. The funding goals for investment programs set forth in the LRTP reflect the types of projects the MPO seeks to fund to help it achieve its goals and objectives for the region, from enhancing safety for all users to promoting mobility and accessibility across the region. More information on the MPO’s goals and objectives is available in Chapter 1, and a comparison between LRTP investment program goals and program funding levels in the FFYs 2024–28 TIP is shown in Figure ES-2.
Figure ES-2
FFYs 2024–28 TIP: Regional Target Funding Levels Relative to LRTP Investment Program Goals

FFY = federal fiscal year. LRTP = Long-Range Transportation Plan. TIP = Transportation Improvement Program.
Source: Boston Region MPO.
The investments made in the FFYs 2024–28 TIP will be implemented in 38 cities and towns throughout the Boston region, ranging from dense inner core communities to developing suburbs further from the urban center. Figure ES-3 illustrates the distribution of Regional Target funding among the eight subregions within the Boston Region MPO’s jurisdiction, as defined by the Metropolitan Area Planning Council (MAPC). This figure also shows how the distribution of funds compares to key metrics for measuring the need for funding by subregion, including the percent of regional population, employment, and Federal-Aid roadway miles within each subregion.
Figure ES-3
FFYs 2024–28 TIP: Regional Target Funding Levels Relative to Key Indicators

Note: Unprogrammed funds and funds held for the MPO’s Transit Modernization and Community Connections Programs are not included in this figure.
FFY = federal fiscal year. MAGIC = Minuteman Advisory Group on Interlocal Coordination. MAPC = Metropolitan Area Planning Council. MetroWest = MetroWest Regional Collaborative. NSPC = North Suburban Planning Council. NSTF = North Shore Task Force. SSC = South Shore Coalition. SWAP = South West Advisory Committee. TIP = Transportation Improvement Program. TRIC = Three Rivers Interlocal Council.
Source: Boston Region MPO.
Additional information on the geographic distribution of Regional Target funding across the region, including a breakdown of funding by municipality, is included in Appendix D.
The TIP Highway Program was developed with the assumption that federal funding for the state would range between $709 million and $865 million annually over the next five years. These amounts include the funds that would be set aside initially by MassDOT as payments for the Accelerated Bridge Program and exclude required matching funds. The funding levels for the FFYs 2024–28 TIP’s Highway Program represent an increase of approximately two percent over those in the FFYs 2023–27 TIP.
The process of deciding how to use this federal funding in the Boston region follows several steps. First, MassDOT reserves funding for GANs debt service payments for the Accelerated Bridge Program; annual GANs payments range between $89 million and $134 million annually over the first three years of this TIP. GANs payments for the Accelerated Bridge Program are expected to conclude in FFY 2026.
The remaining Federal-Aid Highway Program funds are budgeted to support state and regional (i.e., MPO) priorities. In the FFYs 2024–28 TIP, $1.07 billion to $1.15 billion annually was available for programming statewide, including both federal dollars and the local match. MassDOT customarily provides the local match (which can also be provided by other entities); thus, projects are typically funded with 80 percent federal dollars and 20 percent state dollars, depending on the funding program. Costs for project design are borne by the proponent of the project.
Next, MassDOT allocates funding across the following funding categories:
Finally, once these needs have been satisfied, MassDOT allocates the remaining funding among the state’s 13 MPOs for programming. This discretionary funding for MPOs is suballocated by formula to determine the Regional Target amounts. The Boston Region MPO receives the largest portion of MPO funding in the state, with approximately 43 percent of Massachusetts’ Regional Target funds allocated to the region. MassDOT develops these targets in consultation with the Massachusetts Association of Regional Planning Agencies (MARPA). This TIP was programmed with the assumption that the Boston Region MPO will have between $129 million and $158 million annually for Regional Target amounts, which consist of federal funding and state funding for the local match.
Each MPO may decide how to prioritize its Regional Target funding. Given that the Regional Target funding is a subset of the Highway Program, the MPO typically programs the majority of funding for roadway projects; however, the MPO has flexed portions of its highway funding to the Transit Program for transit expansion projects and through its Transit Modernization and Community Connections Programs. The TIP Highway Program details the projects that will receive Regional Target funding from the Boston Region MPO and statewide infrastructure projects within the Boston region. Details on these investments are outlined in Chapter 3.
The Federal Transit Administration (FTA) allocates the funds programmed in the TIP Transit Program according to formula. The three regional transit authorities in the Boston Region MPO area that are recipients of these funds are the MBTA, CATA, and MWRTA. The MBTA, with its extensive transit program and infrastructure, is the recipient of the preponderance of the region’s federal transit funds.
As the current federal transportation legislation, the BIL allocates funding to transit projects through the following formula programs:
When determining which projects to fund through the Regional Target funding process, MPO members collaborate with municipalities, state agencies, members of the public, advocacy groups, and other stakeholders. The MPO board uses evaluation criteria in its project selection process to help identify and prioritize projects that advance progress on the MPO’s six goal areas:
Additionally, the MPO has established investment programs, which are designed to direct Regional Target funding towards MPO priority areas over the next 20 years, to help meet these goals. The investment programs are as follows:
Projects that the MPO selects to receive Regional Target funding through the TIP development process are included in one of the six investment programs listed above. More information on the MPO’s investment programs is available in Chapter 2.
The MPO incorporates performance-based planning and programming (PBPP) practices into its TIP development and other processes. These practices are designed to help direct MPO funds towards achieving specific outcomes for the transportation system. MPO investments directly relate to the PBPP framework and further the MPO’s goals and performance targets. With the development of the FFYs 2024-28 TIP, the MPO leveraged funding availability across all fiscal years to program new projects to address transit system reliability, traffic safety for all users, NHS bridge condition, and other priorities. The MPO will continue to closely link its performance targets, investment decisions, and monitoring and evaluation activities. More information on PBPP is available in Chapter 4 and Appendix A (Table A-2).
The outreach process begins early in the federal fiscal year. Cities and towns designate TIP contacts and begin developing a list of priority projects to be considered for federal funding, and the MPO staff asks the staff of cities and towns in the region to identify their priority projects. MPO staff compiles the project funding requests into a Universe of Projects, which is a list of all Bicycle Network and Pedestrian Connections, Complete Streets, Intersection Improvements, and Major Infrastructure projects identified as potential candidates to receive funding through the TIP.
Certain types of projects are not listed in the Universe at this time. Projects that would be candidates for funding from the MPO’s Community Connections Program are not included because all projects that apply for this program’s discrete application process are considered for funding. Also, Transit Modernization projects are not listed because the project intake process for this program is being developed. During the development of the FFYs 2024-28 TIP, the MPO engaged transit stakeholders to provide projects to utilize funding availability in FFYs 2024 and 2025, an exception to the process but a key step towards formalizing an intake strategy for the next FFYs 2025–29 TIP.
The Universe includes projects at varying levels of readiness, from those with significant engineering and design work complete to those still early in the conceptual or planning stage. MPO staff collects data on each project in the Universe so that the projects may be evaluated.
MPO staff evaluates projects based on how well they address the MPO’s goals. For MPO staff to conduct a complete project evaluation, Bicycle Network and Pedestrian Connections, Complete Streets, Intersection Improvements, and Major Infrastructure projects must have a functional design report or the project plans must include the level of detail defined in a functional design report, a threshold typically reached when a project nears the 25 percent design stage. To complete an evaluation for projects under consideration through the MPO’s Community Connections Program, project proponents must submit a completed application to MPO staff.
In response to significant cost increases in recent TIP cycles for projects already programmed for funding, the MPO board created a committee in the wake of the FFYs 2022–26 TIP cycle to further explore the causes of project cost increases and devise MPO policy changes to support more reliable project delivery. The TIP Project Cost Ad Hoc Committee began its work in June 2021 and advanced a set of policy recommendations to the full MPO board in September 2021. These changes were formally adopted by the MPO on November 4, 2021, and were in effect for the development of the FFYs 2024–28 TIP.
Among other changes, the MPO elected to codify its policy of requiring that project proponents submit 25 percent designs and obtain an updated cost estimate for their projects prior to being programmed in the TIP. While this new policy was formally in effect for the FFYs 2024–28 TIP cycle, the MPO desired to keep this threshold flexible in its first year of implementation, given that the policy was not adopted until after the start of TIP development.
The evaluation results for all projects are presented to the MPO board members for their consideration for programming in the TIP. Draft scores are shared directly with project proponents, at which point proponents are encouraged to review the scores and provide feedback so that MPO staff may make any warranted adjustments to arrive at accurate final results. Once proponents review their scores, final scoring results are posted on the MPO’s website where MPO members, municipal officials, and members of the public may review them.
An important step toward TIP programming takes place midway through the TIP development cycle at a meeting—referred to as TIP Readiness Day—that both MassDOT and MPO staff attend. At this meeting, MassDOT project managers provide updates about cost and schedule changes related to currently programmed projects. These cost and schedule changes must be taken into account as MPO staff helps the MPO board consider updates to the already programmed years of the TIP, as well as the addition of new projects in the outermost year of the TIP.
Among the other new policies advanced by the TIP Project Cost Ad Hoc Committee, the MPO board adopted a policy requiring proponents of projects that experienced a cost increase of 25 percent or more (for projects costing less than $10 million) or $2.5 million or more (for projects costing more than $10 million) to present to the MPO board on the reasons for these cost increases. The MPO would then compare these projects—at the new costs—to other projects and consider this cost-effectiveness evaluation when deciding whether or not to fund the projects at the higher costs. These cost changes are most often revealed through conversations between MassDOT staff and MPO staff during TIP Readiness Day, making this new policy especially relevant at this stage of TIP development.
Using the evaluation results and information about project readiness (i.e., the extent to which a project is fully designed and ready for construction), MPO staff prepares a recommendation or a series of programming scenarios for how to program the Regional Target funding in the TIP. Other considerations, such as whether a project was included in the LRTP, addresses an identified transportation need, or promotes distribution of transportation investments across the region, are also incorporated into these programming scenarios. The staff recommendation is always financially constrained—meaning, subject to available funding. There was approximately $698 million of Regional Target funding available to the Boston Region MPO for FFYs 2024–28. In this TIP cycle, the MPO board members discussed several scenarios for the Regional Target Program for highway projects and selected a preferred program in March 2023.
In addition to prioritizing the Regional Target funding, the MPO board reviews and endorses the statewide highway program that MassDOT recommends for programming. The board also reviews and endorses programming of funds for the MBTA’s, CATA’s, and MWRTA’s transit capital programs.
After selecting a preferred programming scenario, usually in late March, the MPO board votes to release the draft TIP for a 21-day public review period. The comment period typically begins in late April or early May, and during this time the MPO invites members of the public, municipal officials, and other stakeholders in the Boston region to review the proposed program and submit feedback. During the public review period, MPO staff hosts public meetings to discuss the draft TIP document and elicit additional comments.
After the public review period ends, the MPO board reviews all municipal and public comments and may change elements of the document or its programming. The MPO board then endorses the TIP and submits it to the Federal Highway Administration (FHWA) and the Federal Transit Administration (FTA) for approval. MassDOT incorporates the MPO-endorsed TIP into the State Transportation Improvement Program (STIP). The FHWA, FTA, and United States Environmental Protection Agency review the STIP for certification by September 30, the close of the federal fiscal year.
Even after the TIP has been finalized, administrative modifications, amendments, and adjustments often must be introduced because of changes in project schedules, project costs, funding sources, or available revenues. This may necessitate reprogramming a project in a different funding year or programming additional funds for a project.
Notices of administrative modifications and amendments are posted on the MPO’s website. If an amendment is necessary, the MPO notifies affected municipalities, stakeholders, and members of the public via email. The MPO typically holds a 21-day public review period before taking final action on an amendment. In extraordinary circumstances, the MPO may vote to shorten the public comment period to a minimum of 15 days. Administrative modifications and adjustments are minor and usually do not warrant a public review period.
Public engagement is an important aspect of the transportation planning process. Please visit bostonmpo.org for more information about the MPO, to view the entire TIP, and to submit your comments. You also may wish to sign up for email news updates and notices by visiting bostonmpo.org/subscribe and submitting your contact information. To request a copy of the TIP in accessible formats, please contact the MPO staff by any of the following means:
Mail: Boston Region MPO c/o CTPS MPO Activities Group, 10 Park Plaza, Suite 2150, Boston, MA 02116-3968
Telephone: 857.702.3700 (voice)
For people with hearing or speaking difficulties, connect through the state MassRelay service:
Email: publicinfo@ctps.org
The Executive Summary of the FFYs 2024–28 TIP is also available as a translation:
Chapter 1
3C Transportation Planning and the Boston Region Metropolitan Planning Organization
Decisions about how to allocate transportation funds in a metropolitan area are guided by information and ideas gathered from a broad group of people, including elected officials, municipal planners and engineers, transportation advocates, and interested residents. Metropolitan planning organizations (MPO) are the bodies responsible for providing a forum for this decision-making process. Each metropolitan area in the United States with a population of 50,000 or more, also known as an urbanized area, is required by federal legislation to establish an MPO, which decides how to spend federal transportation funds for capital projects and planning studies for the area.
The federal government regulates the funding, planning, and operation of the surface transportation system through the federal transportation program, which was enacted into law through Titles 23 and 49 of the United States Code. Section 134 of Title 23 of the Federal Aid Highway Act, as amended, and Section 5303 of Title 49 of the Federal Transit Act, as amended, require that urbanized areas conduct a transportation planning process, resulting in plans and programs consistent with the planning objectives of the metropolitan area, in order to be eligible for federal funds.
The most recent reauthorization of the federal surface transportation law is the Bipartisan Infrastructure Law (BIL), which has succeeded the Fixing America’s Surface Transportation (FAST) Act. The BIL sets policies related to metropolitan transportation planning, and requires that all MPOs carry out a continuing, comprehensive, and cooperative (3C) transportation planning process.
The Boston Region MPO is responsible for carrying out the 3C planning process in the Boston region. The MPO has established the following objectives for the process:
More information about the federal, state, and regional guidance governing the transportation planning process, and about the regulatory framework in which the MPO operates can be found in Appendix E.
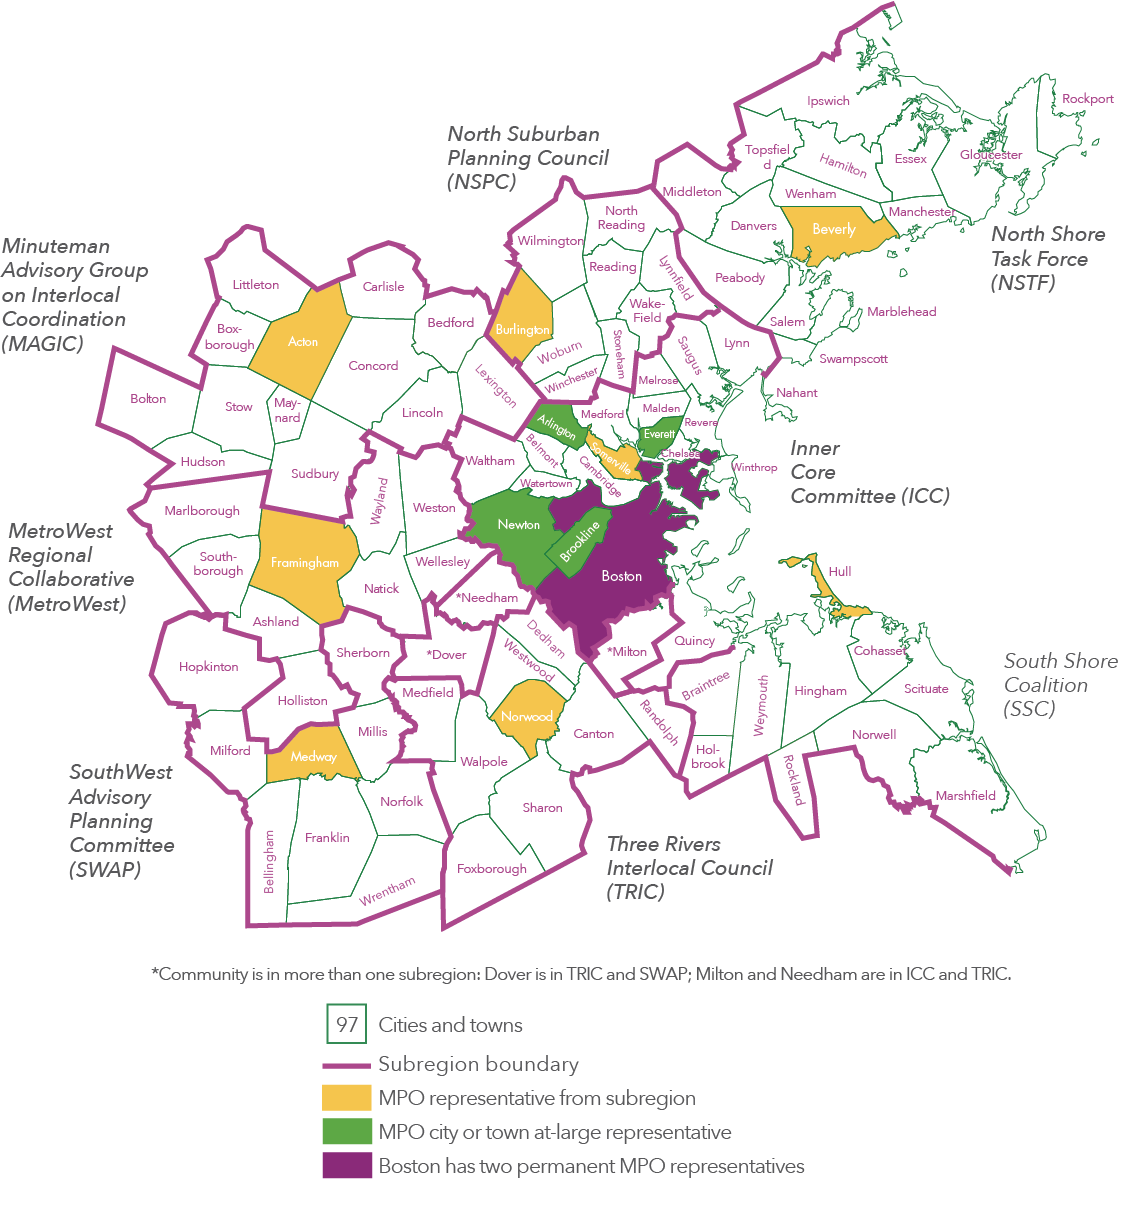
The Boston Region MPO’s planning area extends across 97 cities and towns from Boston north to Ipswich, south to Marshfield, and west to Interstate 495.
Figure 1-1 shows the map of the Boston Region MPO’s member municipalities.
Figure 1-1
Municipalities in the Boston Region
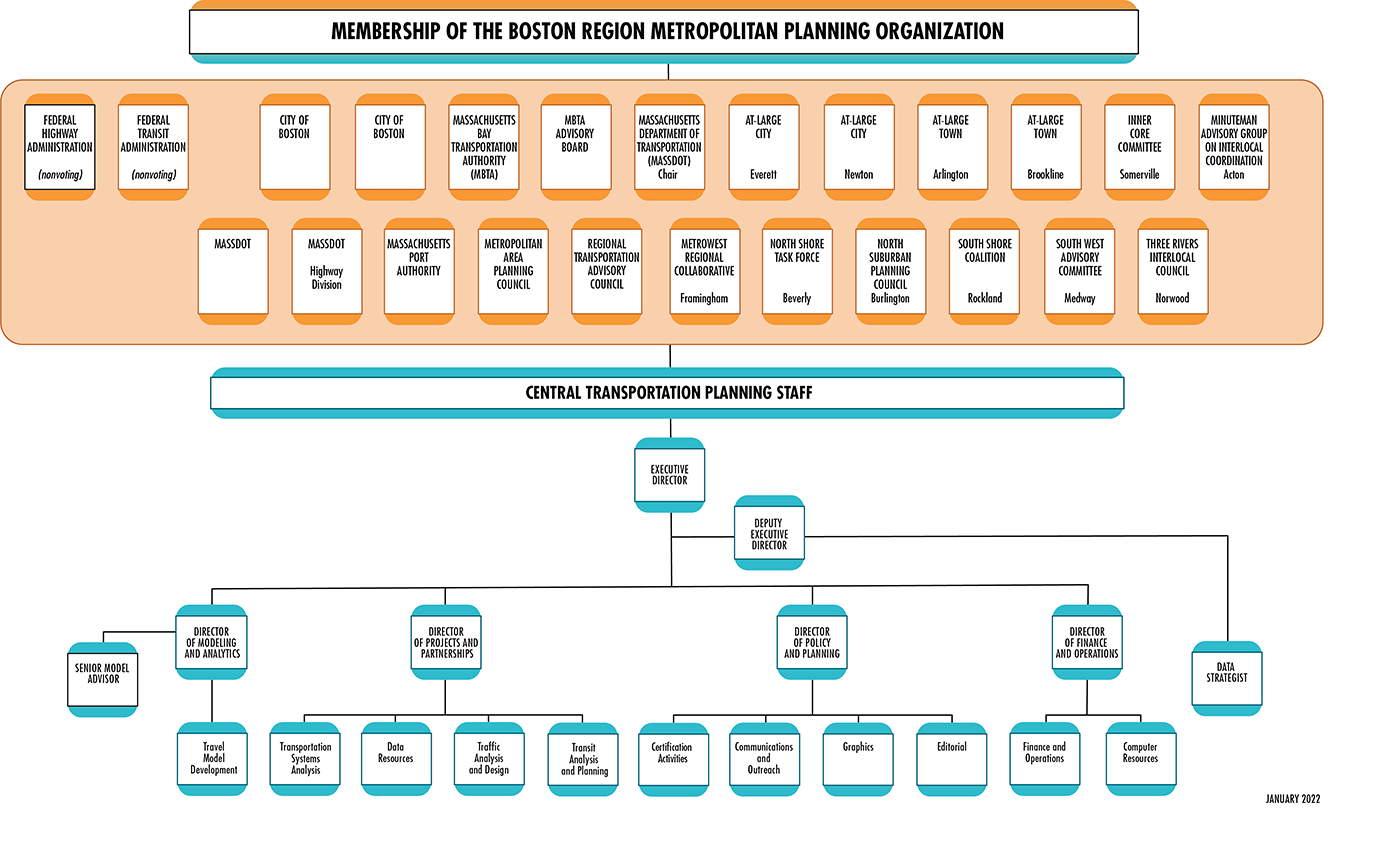
The MPO’s board comprises 22 voting members. Several state agencies, regional organizations, and the City of Boston are permanent voting members, while 12 municipalities are elected as voting members for three-year terms. Eight municipal members represent each of the eight subregions of the Boston region, and there are four at-large municipal seats. The Federal Highway Administration (FHWA) and Federal Transit Administration (FTA) participate on the MPO board as advisory (nonvoting) members. More details about the MPO’s permanent members can be found in Appendix F.
Figure 1-2 shows MPO membership and the organization of the Central Transportation Planning Staff, which serves as staff to the MPO.
Figure 1-2
Boston Region MPO Organizational Chart
The following paragraph is the MPO’s central vision statement, as adopted in Destination 2040, the MPO’s current Long-Range Transportation Plan (LRTP), which was adopted in August 2019.
The Boston Region MPO envisions a modern, well-maintained transportation system that supports a sustainable, healthy, livable, and economically vibrant region. To achieve this vision, the transportation system must be safe and resilient; incorporate emerging technologies; and provide equitable access, excellent mobility, and varied transportation options.
This vision statement takes into consideration the significant public input received during the drafting of the Needs Assessment for Destination 2040. This statement also reflects the MPO’s desire to emphasize the maintenance and resilience of the transportation system while supporting the MPO’s six core goals: Safety, System Preservation and Modernization, Capacity Management and Mobility, Clean Air and Sustainable Communities, Transportation Equity, and Economic Vitality. More information on the MPO’s vision, goals, and objectives for the transportation system is available in Figure 1-3.
The Boston Region MPO is in the process of developing Destination 2050, its next LRTP, which is expected to be completed in the summer of 2023. The updated vision, goals, and objectives created as part of Destination 2050 will not only guide the recommendations included in that plan, but also the development of future MPO Transportation Improvement Programs (TIP) and LRTPs. It was also considered when developing this UPWP. The following paragraph is the MPO’s vision statement as approved in February 2023.
The Boston Region Metropolitan Planning Organization envisions an equitable, pollution-free, and modern regional transportation system that gets people to their destinations safely, easily, and reliably, and that supports an inclusive, resilient, healthy, and economically vibrant Boston region.
As part of its 3C process, the Boston Region MPO annually produces the TIP and the Unified Planning Work Program (UPWP). These documents, along with the quadrennial LRTP, are referred to as certification documents and are required for the federal government to certify the MPO’s planning process. This federal certification is a prerequisite for the MPO to receive federal transportation funds. In addition to the requirement to produce the LRTP, TIP, and UPWP, the MPO must establish and conduct an inclusive public participation process, and maintain transportation models and data resources to support air quality conformity determinations and long- and short-range planning work and initiatives.
The following is a summary of each of the certification documents.
Figure 1-3
LRTP Goals and Objectives
| GOALS | OBJECTIVES |
| EQUITY | blank |
| Facilitate an inclusive and transparent transportation-planning process and make investments that eliminate transportation-related disparities borne by people in disadvantaged communities. | • Facilitate an inclusive and transparent engagement process with a focus on involving people in disadvantaged communities.* • Ensure that people have meaningful opportunities to share needs and priorities in a way that influences MPO decisions. • Eliminate harmful environmental, health, and safety effects of the transportation system on people in disadvantaged communities. • Invest in high-quality transportation options in disadvantaged communities to fully meet residents’ transportation needs. * Disadvantaged communities are those in which a significant portion of the population identifies as an MPO equity population—people who identify as minority, have limited English proficiency, are 75 years old or older or 17 years old or younger, or have a disability—or has low income. |
| SAFETY | blank |
| Achieve zero transportation-related fatalities and serious injuries and improve safety for all users of the transportation system. | • Eliminate fatalities, injuries, and safety incidents experienced by people who walk, bike, roll, use assistive mobility devices, travel by car, or take transit. • Prioritize investments that improve safety for the most vulnerable roadway users: people who walk, bike, roll, or use assistive mobility devices. • Prioritize investments that eliminate disparities in safety outcomes for people in disadvantaged communities. |
| MOBILITY AND RELIABILITY | blank |
| Support easy and reliable movement of people and freight. | • Enable people and goods to travel reliably on the region’s transit and roadway networks. • Prioritize investments that address disparities in transit reliability and frequency for people in disadvantaged communities. • Reduce delay on the region’s roadway network, emphasizing solutions that reduce single-occupancy-vehicle trips, such as travel demand management. • Prioritize investments that reduce delay on the region’s transit network. • Support reliable, safe travel by keeping roadways, bridges, transit assets, and other infrastructure in a state of good repair, and prioritize these investments in disadvantaged communities. • Modernize transit systems and roadway facilities, including by incorporating new technology that supports the MPO’s goals, such as electric-vehicle technologies. |
| ACCESS AND CONNECTIVITY | blank |
| Provide transportation options and improve access to key destinations to support economic vitality and high quality of life. | • Improve multimodal access to jobs, affordable housing, essential services, education, logistics sites, open space, and other key destinations. • Prioritizing transportation investments that support the region’s and the Commonwealth’s goals for housing production, land use, and economic growth. • Increase people’s access to transit, biking, walking, and other non-single-occupancy-vehicle transportation options to expand their travel choices and opportunities. • Prioritize investments that improve access to high quality, frequent transportation options that enable people in disadvantaged communities to easily get where they want to go. • Close gaps in walking, biking, and transit networks and support interorganizational coordination for seamless travel. • Remove barriers to make it easy for people of all abilities to use the transportation system, regardless of whether they walk, bike, roll, use assistive mobility devices, or take transit. |
| RESILIENCY | blank |
| Provide transportation that supports sustainable environments and enables people to respond and adapt to climate change and other changing conditions. | • Prioritize investments to make the region’s roadway and transit infrastructure more resilient and responsive to current and future climate hazards, particularly within areas vulnerable to increased heat and precipitation, extreme storms, winter weather, and sea level rise. • Prioritize resiliency investments in disadvantaged communities and in areas that bear disproportionate climate and environmental burdens. • Prioritize investments in transportation resiliency that improve emergency access and protect evacuation routes. • Prioritize investments that include nature-based strategies such as low-impact design, pavement reduction, and landscape buffers to reduce runoff and negative impacts to water resources, open space, and environmentally sensitive areas. |
| CLEAN AIR AND HEALTHY COMMUNITIES | blank |
| Provide transportation free of greenhouse gas emissions and air pollutants and that supports good health. | • Reduce transportation-related greenhouse gases, other air pollutants, and growth in vehicle-miles traveled by encouraging people and goods to move by non-single-occupancy-vehicle modes. • Support transit vehicle electrification and use of electric vehicles throughout the transportation system to reduce greenhouse gases and other air pollutants. • Prioritize investments that address air pollution and environmental burdens experienced by disadvantaged and vulnerable communities. • Support public health through investments in transit and active transportation options and by improving access to outdoor space and healthcare. |
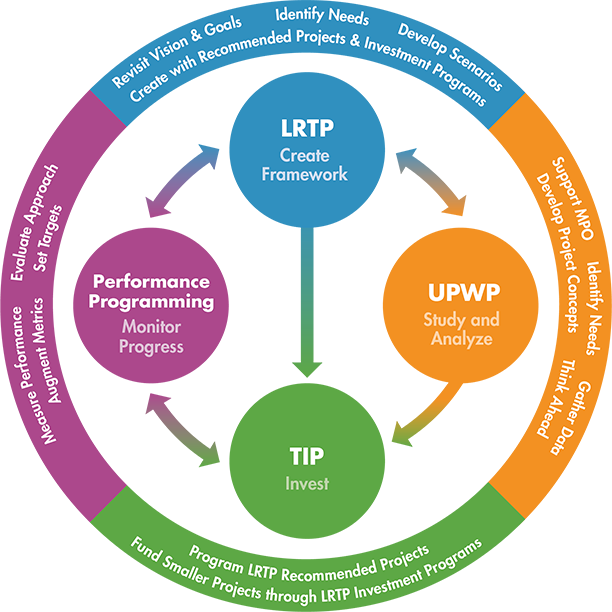
Figure 1-4 depicts the relationship between the three certification documents and the MPO’s performance-based planning and programming process, which is a means to monitor progress towards the MPO’s goals and to evaluate the MPO’s approach to achieving those goals.
Figure 1-4
Relationship between the LRTP, TIP, UPWP,
and Performance-Based Planning Process
Transportation improvements are part of the solution to many critical regional, state, national, and even global problems, such as traffic congestion, air pollution, fatalities and injuries on roadways, climate change, and environmental injustice. Therefore, one of the most important decisions a metropolitan planning organization (MPO) faces is deciding how to allocate limited funds for transportation projects and programs. Because there is not nearly enough funding available for all of the necessary and worthy projects that would address these problems, an MPO’s investment choices must be guided by policies that help identify the most viable and effective solutions.
The Boston Region MPO is guided by the policies in its Long-Range Transportation Plan (LRTP) and the MPO develops a Transportation Improvement Program (TIP) to prioritize the expenditure of federal funds on transportation projects. The MPO staff manages the development of both plans.
During the annual development process for the TIP, the MPO staff supports the MPO board by evaluating project funding requests from municipalities and state transportation agencies. The staff propose a range of alternative scenarios for the programming of new and ongoing projects, based on anticipated yearly funding levels, and work with the board to create a draft TIP document. The staff also facilitates a public involvement process that affords the public an opportunity to comment on proposed projects and review the draft TIP before the MPO board endorses the final document.
The first step in allocating federal transportation funds is the passage by the United States Congress of a multi-year act that establishes a maximum level of federal transportation funding per federal fiscal year (FFY). The establishment of this level of funding is referred to as an authorization. The most recent authorization act, the Bipartisan Infrastructure Law (BIL), was signed into law on November 15, 2021. The BIL governed the development of the FFYs 2024–28 TIP, including by establishing new formula funding levels, creating new and reauthorizing existing discretionary grant programs, and setting policy priorities. (More information on the impacts of the BIL on the development of the FFYs 2024–28 TIP is available throughout this report, with specific guidance on new BIL Planning Emphasis Areas available in Appendix E.)
After the authorization level has been established, the United States Department of Transportation annually allocates funding among the states according to various federal formulas. This allocation is referred to as an apportionment. The annual apportionment rarely represents the actual amount of federal funds that are ultimately committed to a state because of federally imposed limitations on spending in a given fiscal year, referred to as the obligation authority. In Massachusetts, TIPs are developed based on the estimated obligation authority.
The TIP Highway Program was developed with the assumption that federal funding for the state would range between $709 million and $865 million annually over the next five years. These amounts include the funds that would be set aside initially by MassDOT as payments for the Accelerated Bridge Program and exclude required matching funds. The funding levels for the FFYs 2024–28 TIP’s Highway Program represent an increase of approximately two percent over those in the FFYs 2023–27 TIP.
The process of deciding how to use this federal funding in the Boston region follows several steps. First, MassDOT reserves funding for GANs debt service payments for the Accelerated Bridge Program; annual GANs payments range between $89 million and $134 million annually over the first three years of this TIP. GANs payments for the Accelerated Bridge Program are expected to conclude in FFY 2026.
The remaining Federal-Aid Highway Program funds are budgeted to support state and regional (i.e., MPO) priorities. In the FFYs 2024–28 TIP, $1.07 billion to $1.15 billion annually was available for programming statewide, including both federal dollars and the local match. MassDOT customarily provides the local match (which can also be provided by other entities); thus, projects are typically funded with 80 percent federal dollars and 20 percent state dollars, depending on the funding program. Costs for project design are borne by the proponent of the project.
The Regional Targets are discretionary funds for MPOs, sub-allocated by formula to each metropolitan planning region. The Boston Region MPO receives about 43 percent of the total funds available statewide for Regional Targets. MassDOT developed the target formula for determining this distribution of funds in consultation with the Massachusetts Association of Regional Planning Agencies (MARPA).
Each MPO in the state can decide how to prioritize its Regional Target funding. Given that the Regional Target funding originates from the Federal-Aid Highway Program, the Boston Region MPO board typically programs the majority of its target funding on roadway projects; however, the MPO board has flexed portions of its TIP Highway Program funding to the TIP’s Transit Program, most notably when the MPO board provided funding in support of the Green Line Extension transit expansion project.
Additionally, this FFYs 2024–28 TIP includes an annual allotment of funding to the MPO’s Transit Modernization Program beginning in FFY 2025. This represents the MPO’s first formalized effort to flex Federal-Aid Highway funds to transit projects on a yearly basis, an affirmation of the regional goals to support multimodal transportation options in a meaningful way. More information on the MPO’s investment strategy is discussed later in this chapter.
During the next five years, the Boston Region MPO’s total Regional Target funding will be approximately $697 million, an average of $139.4 million per year. As with the overall increase in funding for the Highway Program from the BIL, the MPO’s Regional Target funds increased nearly nine percent per year in the FFYs 2024–28 TIP relative to the levels planned for in the development of the FFYs 2023–27 TIP. The increase in funding was driven by elevated target funding in FFY 2027 and 2028 resulting from the absence of GANs payments. Funding levels in FFYs 2024 through 2026 remain unchanged from the previous TIP. To decide how to spend its Regional Target funding, the MPO engages its 97 cities and towns in an annual TIP development process.
The Federal-Aid Highway Program dollars discussed in this chapter are delivered through several Federal Highway Administration (FHWA) funding programs, each of which has unique requirements. Table 2-1 lists the programs in the BIL that fund projects in the FFYs 2024–28 TIP.
Table 2-1
Federal Highway Administration Programs Applicable to the FFYs 2024–28 Transportation Improvement Program
BIL Program |
Eligible Uses |
Bridge Formula Program (BFP) |
Efforts to replace, rehabilitate, preserve, protect, and construct highway bridges |
Congestion Mitigation and Air Quality Improvement (CMAQ) |
A wide range of projects to reduce congestion and improve air quality in nonattainment and maintenance areas for ozone, carbon monoxide, and particulate matter |
Highway Safety Improvement Program (HSIP) |
Implementation of infrastructure-related highway safety improvements |
Metropolitan Planning |
Facilities that contribute to an intermodal transportation system, including intercity bus, pedestrian, and bicycle facilities |
National Electric Vehicle Infrastructure (NEVI) Program |
Projects that support the strategic deployment of electric vehicle (EV) charging infrastructure and establish an interconnected EV network to facilitate data collection, access, and reliability |
National Highway Freight Program (NHFP) |
Projects that improve the efficient movement of freight on the National Highway Freight Network |
National Highway Performance Program (NHPP) |
Improvements to interstate routes, major urban and rural arterials, connectors to major intermodal facilities, and the national defense network; replacement or rehabilitation of any public bridge; and resurfacing, restoring, and rehabilitating routes on the Interstate Highway System |
Surface Transportation Block Grant Program (STBGP) |
A broad range of surface transportation capital needs, including roads; transit, sea, and airport access; and vanpool, bicycle, and pedestrian facilities |
Transportation Alternatives Program (TAP) |
A set-aside from the STBGP that funds the construction of infrastructure-related projects (for example, sidewalk, crossing, and on-road bicycle facility improvements) |
Source: Federal Highway Administration.
Federal aid for public transit authorities is allocated by formula to urbanized areas (UZAs). MassDOT is the recipient of this federal aid in the Boston MA-NH-RI UZA. In UZAs with populations greater than 200,000, such as the Boston MA-NH-RI UZA, the distribution formula factors in passenger-miles traveled, population density, and other factors associated with each transit provider. The three regional transit authorities (RTAs) in the Boston Region MPO area are the Massachusetts Bay Transportation Authority (MBTA), MetroWest Regional Transit Authority (MWRTA), and Cape Ann Transportation Authority (CATA). The MBTA, with its extensive transit program and infrastructure, is the recipient of the preponderance of federal transit funds in the region.
The Federal Transit Administration (FTA) distributes funding to transit agencies through several different programs. As previously noted, the MPO also flexes some of its FHWA funding to FTA to support transit investments. Table 2-2 shows FTA programs in the BIL that support transit investments in the FFYs 2024–28 TIP.
Table 2-2
Federal Transit Administration Programs Applicable to the FFYs 2024–28 Transportation Improvement Program
BIL Program |
Eligible Uses |
Urbanized Area Formula Grants (Section 5307) |
Transit capital and operating assistance in urbanized areas |
Fixed Guideway/Bus (Section 5337) |
Replacement, rehabilitation, and other state-of-good-repair capital projects |
Bus and Bus Facilities (Section 5339) |
Capital projects to replace, rehabilitate, and purchase buses and related equipment, and to construct bus-related facilities |
Enhanced Mobility of Seniors and Individuals with Disabilities (Section 5310) |
Capital expenses that support transportation to meet the special needs of older adults and persons with disabilities |
Fixed-Guideway Capital Investment Grants (Section 5309) |
Grants for new and expanded rail, bus rapid transit, and ferry systems that reflect local priorities to improve transportation options in key corridors |
Source: Federal Transit Administration.
As mentioned previously, each MPO in the state can decide how to prioritize the Regional Target funding it receives through the processes established by FHWA and MassDOT. The Boston Region MPO’s LRTP defines the investment framework that informs the specific investment decisions made in the TIP by establishing
The MPO’s goals and objectives provide the foundation for the evaluation criteria the MPO board uses when selecting transportation projects to be funded with Regional Target dollars. MPO staff compares candidate projects’ characteristics to these criteria to evaluate whether individual projects can help the MPO advance its various goals. The criteria used to select projects for this TIP are based on the MPO’s goals and objectives, adopted as part of Destination 2040, which is the LRTP the MPO endorsed in August 2019. These goals and objectives are listed in Chapter 1.
In Destination 2040 and the prior LRTP, Charting Progress to 2040, the MPO strengthened the link between its spending and improvements to transportation performance by revising its investment programs to include a broader range of prospective projects. These investment programs focus on specific types of projects that the MPO expects will help achieve its goals and objectives for the transportation system. The MPO created these programs to give municipalities the confidence that if they design these types of projects the MPO will be willing to fund them through the TIP:
Figure 2-1 provides details about the Destination 2040 investment programs and their relationship to the MPO’s goals. When developing the FFYs 2023–27 TIP, the MPO allocated its Regional Target dollars to these investment programs by assigning them to projects that meet the investment programs’ criteria.
Figure 2-1
Destination 2040 Investment Programs
Funds projects to modernize intersection geometry and signalization to improve safety and mobility.
Improvements may include:
Funds projects that modernize roadways to improve safety and mobility for all users.
Improvements may include:
Funds projects that modernize transit infrastructure and promote the enhanced ridership, accessibility or resiliency of transit services.
Improvements may include:
Funds a variety of project types, including first- and last-mile solutions and other small, nontraditional transportation projects to enhance mobility and improve air quality.
Improvements may include:
Funds projects that enhance major arterials for all users and modernize or expand transit systems to increase capacity. Projects in this program cost more than $50 million; are on major roadways including Interstate Highways, Principal Arterial Freeways and Expressways, or all sections of roadways classified as Principal Arterial “Other” that have fully or partially controlled access; or add new connections to or extend the rail or fixed guideway transit network or the bus rapid transit network. Improvements may include
Funds projects to expand bicycle and pedestrian networks to improve safe access to transit, schools, employment centers, and shopping destinations.
Improvements may include:
S: Safety
SP: System Preservation and Modernization
CM: Capacity Management
CA: Clean Air/Sustainable Communities
TE: Transportation Equity
EV: Economic Vitality
The MPO has taken a clear stance that investing in transit is central to improving the region’s broader transportation system. Created in Destination 2040, the Transit Modernization Program represents a significant shift in the MPO’s investment strategy, as funding will be allocated to transit projects on an annual basis beginning in FFY 2025. In prior years, the MPO only funded transit projects on a one-off basis when funding was requested for specific projects in the region.
By creating the programming infrastructure to flex Regional Target highway funds to transit projects annually, the Boston Region MPO has established itself as a leader among MPOs nationally by crafting an investment strategy that is truly multimodal. During the development of Destination 2050, the next LRTP to be released in 2023, staff proposed a broadening of the Transit Modernization Program into a Transit Transformation Program starting in FFY 2029, in response to feedback from stakeholders at the MBTA and RTAs.2-1
The MPO funded multiple Transit Modernization projects in FFY 2024 and FFY 2025 to make use of funding surpluses. The MPO has also continued to reserve funding in the amount of $6.5 million in each fiscal year beginning in FFY 2025 for future allocation. The MPO will continue to work with municipalities and transit providers in the region to identify transit needs and determine the most effective use of this funding as this program commences with the FFYs 2025–2029 TIP. As with the Transit Modernization program, the MPO will continue to work with municipalities to develop and fund projects through the Complete Streets investment program. In Destination 2040, the MPO added dedicated bus lanes and climate resiliency measures to the types of projects supported by this program.
The MPO decided to increase the funding allocated to the Community Connections Program from $2 million to $2.5 million annually beginning in FFY 2023, as the MPO’s overall Regional Target funding increased with the passage of the Bipartisan Infrastructure Law in November 2021. In this FFYs 2024–28 TIP, the MPO built on the success of the first three rounds of the Community Connections Program, funding nine additional projects on top of the 25 projects funded in the previous three TIP cycles. A tenth line item for a Bikeshare Support Set-Aside was also added, which set aside $1 million in funding for Bikeshare in FFYs 2025 and 2026 and $2 million in FFYs 2026 and 2027. Funding for the Community Connections Program continues to be reserved in FFYs 2025–28 for allocation in future TIP cycles.
More information on the projects selected for funding in each of the MPO’s investment programs can be found in Chapter 3.
When creating investment program guidelines for Destination 2040, the MPO elected to decrease the amount of funding allocated to large-scale projects that would be included in its Major Infrastructure Program in order to focus a larger percentage of funding on lower cost, operations-and-maintenance projects. Such a funding mix will help the MPO address its goals and provide more opportunities for the MPO to distribute federal transportation dollars to projects throughout the region, as opposed to concentrating it on a few large-scale projects.
Early in the development of the FFYs 2022–26 TIP, the MPO reassessed its definition of Major Infrastructure projects, adopting a new definition through sequential votes on August 20, 2020, and October 1, 2020. This revised definition carried through to the development of the FFYs 2023–27 TIP and persists in the FFYs 2024-28 TIP. The MPO previously defined Major Infrastructure projects as those that cost more than $20 million or that add capacity to the transportation network. The MPO’s revised definition classifies Major Infrastructure projects as follows:
Under the MPO’s prior Major Infrastructure definition, the relatively low-cost threshold caused several large-scale Complete Streets projects to be classified as Major Infrastructure projects although they were local in nature. The changes outlined above are intended to focus the Major Infrastructure investment program on those projects that are of significant scale or that are truly important for the broader region. This allows the MPO to better compare projects when conducting project evaluations. Because the MPO considers the five-year distribution of TIP funds across its investment programs relative to the goals set forth in the LRTP (as shown in Figure 2-2), properly categorizing projects is a critical component of the MPO’s decision-making process. Funding allocation goals like these are some of the LRTP-based guidelines the MPO employs to ensure limited Regional Target funding is programmed in ways that best achieve the MPO’s goals for transportation in the region. As the MPO continues the development of its next LRTP, Destination 2050, it will assess the efficacy of each of its six investment programs to ensure these programs are structured to best support progress on the MPO’s goals and objectives for the region.
Figure 2-2
Destination 2040 Funding Goals by MPO Investment Program
Source: Boston Region MPO.
The MPO requires that project proponents submit 25 percent designs and obtain an updated cost estimate for their project prior to being programmed in the TIP. This standard was set by the MPO as part of a multi-pronged effort to reduce the prevalence of cost increases for projects that have already been selected for funding in the TIP.
MassDOT and the MBTA each update their rolling five-year Capital Investment Plans (CIP) on an annual basis. MassDOT’s CIP identifies priority roadway, bridge, and statewide infrastructure projects for the five MassDOT divisions and includes funding for specific transit projects such as the South Coast Rail. The MBTA’s CIP outlines the agency’s five-year investment strategy for transit projects in its service area. Both CIP processes use a similar framework that prioritizes funding according to statewide strategic goals for the transportation system. Reliability is the top priority for MassDOT and the MBTA, followed by modernization and then expansion. Both agencies have created investment programs for their respective CIPs that relate to these strategic goals and allocate funding to these programs in ways that emphasize their priority. These goals and investment programs are as follows:
The MPO applies its investment framework when developing the TIP. The MPO board’s process for selecting projects to receive Regional Target funding relies on evaluation criteria to help identify and prioritize projects that advance the MPO’s goals. The criteria are based on the MPO’s goals and objectives outlined in the LRTP. All projects are required to show consistency with the LRTP and other statewide and regional plans. Other considerations include the readiness of a project for construction and municipal support for the project. Background information about the TIP project evaluation process is presented in Appendix A.
In the wake of the adoption of Destination 2040 in August 2019, the MPO began the process of revising the TIP evaluation criteria to enhance alignment with the MPO’s updated goals, objectives, and investment programs. These new criteria were adopted by the MPO on October 1, 2020, and were employed during the project selection process for the FFYs 2022–26 , 2023–27, and 2024-28 TIPs. The final criteria were the result of a 15-month process that engaged nearly 1,100 members of the public through surveys and focus groups. This process also prioritized the inclusion of significant direct input from MPO members, which was gathered from more than a dozen presentations, discussions, and focus groups. The outcomes of this process are discussed further in the Project Evaluation section on the following pages.
Because of the limitations on in-person gatherings caused by the COVID-19 pandemic, a vast majority of the surveys, focus groups, and presentations discussed above were conducted virtually, with participation options both online and over the telephone. These virtual engagement opportunities allowed MPO staff to pursue new ways of building relationships with members of the public and other key stakeholders in the region. Given the increase in access to the TIP criteria revision process afforded by these virtual events, MPO staff intend to develop a hybrid outreach model that would support both in-person and virtual engagement.
In addition to the process outlined above, which focused on developing new criteria for five of the MPO’s investment programs (Bicycle Network and Pedestrian Connections, Complete Streets, Intersection Improvements, Major Infrastructure, and Transit Modernization), the MPO also adjusted the project selection criteria used to evaluate and fund projects through the Community Connections Program in the FFYs 2022–26 and 2023–27 TIPs. These revisions were made based on the lessons learned by MPO staff through the pilot round of this program, which took place during the FFYs 2021–25 TIP cycle. MPO staff made no further revisions in the development of the FFYs 2024-28 TIP. More information on these criteria is available in the Project Evaluation section of this chapter, as well as in Appendix A.
The TIP development process begins early in the federal fiscal year when cities and towns in the region designate staff as TIP contacts and begin developing a list of priority projects to be considered for federal funding. Each fall, the MPO staff asks these TIP contacts to identify their city or town’s priority projects and then MPO staff elicits input from interested parties and members of the general public.
These discussions on municipalities’ priority projects mark the start of a robust dialogue between MPO staff and project proponents that continues through the duration of the TIP cycle. As noted above, these conversations have been taking place virtually because of the COVID-19 pandemic. In November of 2022, MPO staff held two virtual workshops for municipalities in the region to develop an understanding of the TIP process. MPO staff provided additional one-on-one virtual office hours throughout the fall for proponents to ask more detailed questions about advancing specific projects for funding, with several office hour sessions booked for this purpose during the early stages of developing the FFYs 2024–28 TIP.
Once project proponents have decided to pursue federal funding, they must begin the formal project initiation process. All new Bicycle Network and Pedestrian Connections, Complete Streets, Intersection Improvements, and Major Infrastructure projects must be initiated with the MassDOT Highway Division before they can be considered for programming in the TIP. MassDOT details this process on its project initiation webpage, mass.gov/info-details/massdot-highway-initiating-a-project. To be considered for programming, proponents of Community Connections projects must submit an application for funding directly to MPO staff, as these projects do not need to be initiated by MassDOT.
The MPO staff compiles project funding requests for projects into a Universe of Projects list, which consists of all identified projects being advanced for possible funding in the Bicycle Network and Pedestrian Connections, Complete Streets, Intersection Improvements, and Major Infrastructure investment programs. The Universe includes projects that are at advanced stages of project design, those that are undergoing preliminary engineering and design, and projects still in the conceptual planning stage. Those projects that are active municipal priorities and that are feasibly ready to be programmed in the current TIP cycle continue forward into the MPO’s project evaluation process. Projects that are not ready for programming remain in the Universe for consideration in future TIP cycles. A project Universe is not developed for Community Connections projects, as all eligible projects within this program will be considered for funding during the TIP cycle in which project proponents apply.
The MPO staff uses its project evaluation criteria to logically and transparently evaluate and select projects for programming in the TIP that advance the MPO’s vision for transportation in the region. This process favors projects that support the following goals:
As noted previously, the MPO undertook a process of revising the TIP evaluation criteria prior to the launch of the FFYs 2022–26 TIP to enhance the alignment between the TIP project selection process and the MPO’s updated goals, objectives, and investment programs outlined in Destination 2040. In terms of the overall structure of the criteria, this process resulted in the following outcomes:
In addition to these broader structural changes, a number of updates were made to individual criteria to better accomplish the MPO’s goals in the LRTP:
Several other changes were made to the project evaluation criteria, which are detailed in Appendix A. The point distributions by MPO investment program and LRTP goal area are also available in Figure 2-4. Projects scored using both sets of criteria are programmed in each of these four investment programs in the FFYs 2024–28 TIP, so both sets of criteria are referenced throughout this document.
Though many of the adjustments listed above were in development prior to the onset of the COVID-19 pandemic, the emerging lessons from this event reinforced the importance of emphasizing criteria that award points to projects that invest in walking, bicycling, and transit infrastructure. Also, the need for new criteria that more directly address existing disparities in health and transportation access for minorities and low-income households has been put into stark relief throughout the pandemic. While the MPO did not elect to rescore any currently programmed projects with these new criteria, the revised criteria will be employed in coming TIP cycles to support the funding of transportation projects that address the issues highlighted by the COVID-19 pandemic.
Prior to the FFYs 2022–26 TIP cycle, the MPO also undertook a parallel process to update its evaluation criteria for the smaller-scale, first- and last-mile projects considered for funding through the Community Connections Program. These adjustments were based on the lessons learned from the pilot round of this program during the FFYs 2021–25 TIP cycle. In these revisions, MPO staff created a more focused set of criteria that better aligned with the types of projects pursuing funding through this program. Revisions to the Community Connections criteria addressed the discrepancies between capital and operating projects, as the pilot criteria more heavily favored operating projects. These adjustments resulted in more balanced scores that better reflected the goals of the program when implemented for the FFYs 2022–26 TIP cycle. More information on the scoring areas for these criteria is available in Figure 2-3, and all criteria are available in Appendix A. Projects scored using both sets of criteria are programmed in the Community Connections Program in the FFYs 2024–28 TIP, so both sets of criteria are referenced throughout this document.
Figure 2-3
TIP Project Evaluation Criteria: Point Distribution for Community Connections Projects
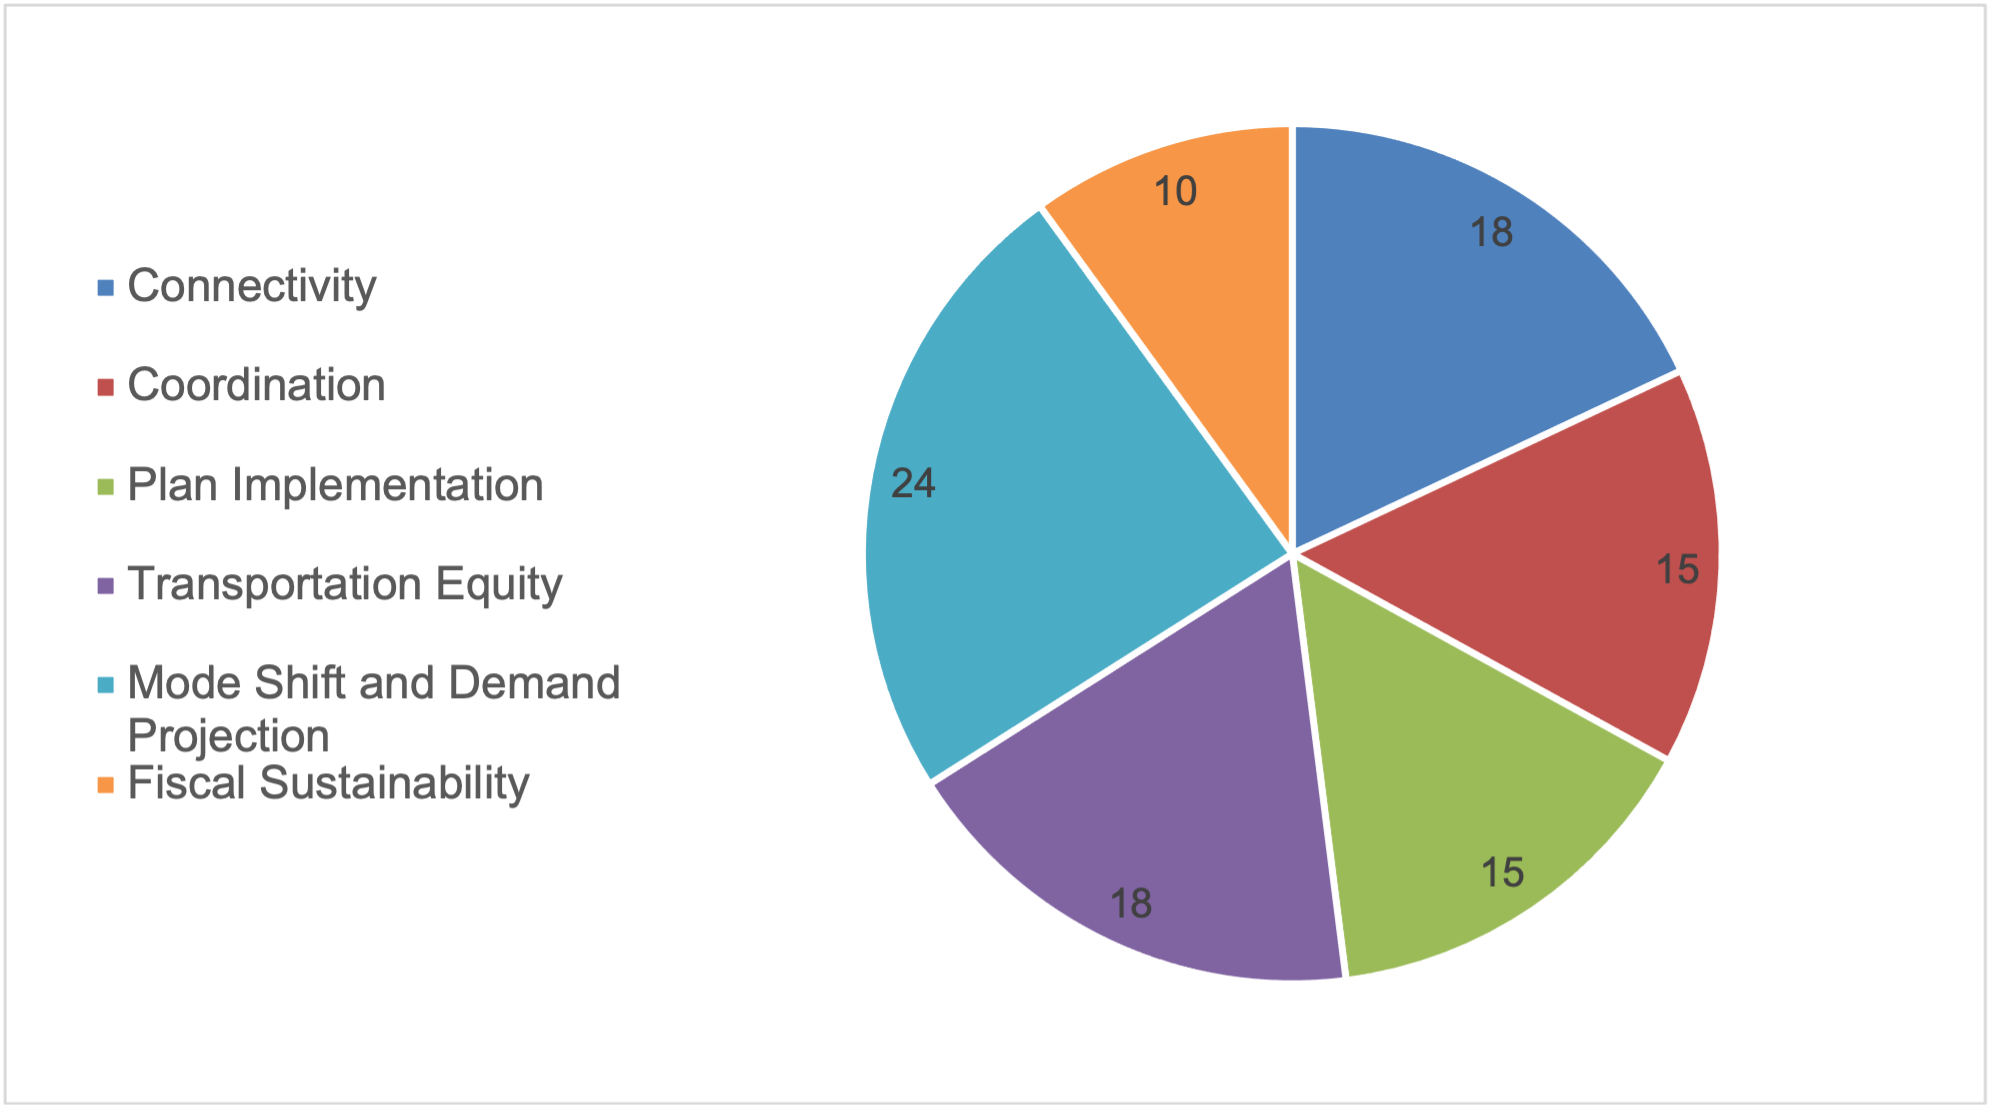
Source: Boston Region MPO
Figure 2-4
TIP Project Evaluation Criteria: Point Distributions by Project Type
(All Other Investment Programs)
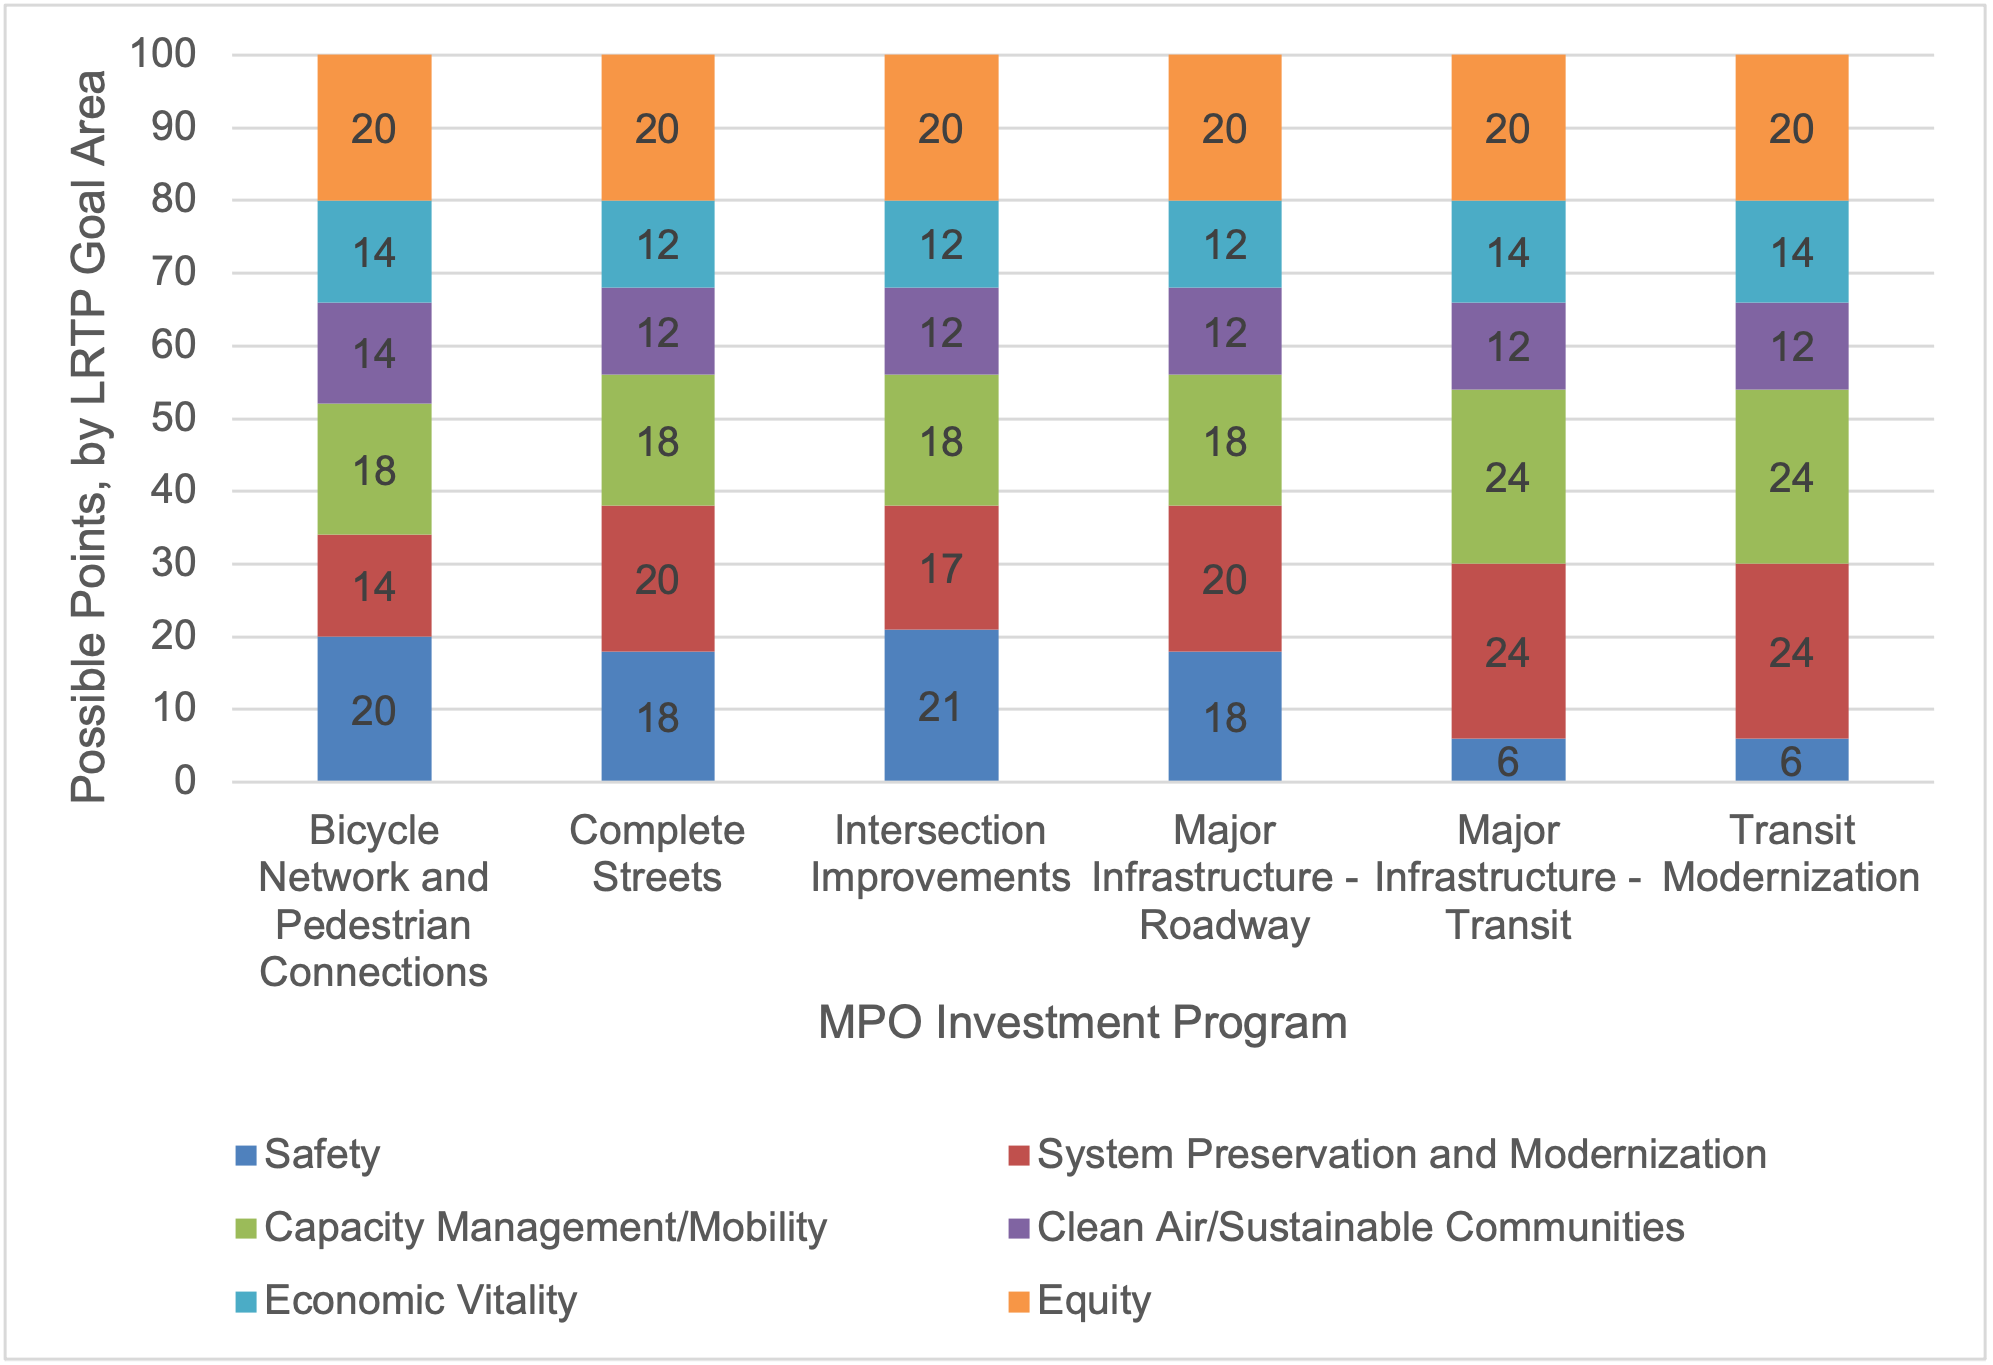
Source: Boston Region MPO.
In order for the MPO staff to conduct a complete project evaluation, each project proponent must provide enough information so that staff can meaningfully apply the evaluation criteria. Bicycle Network and Pedestrian Connections, Complete Streets, Intersection Improvements, and Major Infrastructure projects must have submitted 25 percent design plans to MassDOT, or its plans must include the level of detail defined in a functional design report. (See MassDOT’s Project Development and Design Guide for information about the contents of a functional design report. This guide is available at mass.gov/lists/design-guides-and-manuals.) For Community Connections projects, proponents must submit a complete application to the MPO, including required supporting documentation such as budget sheets, letters of support from partner entities, and work estimates.
After MPO staff have completed an initial round of project scoring, draft scores are distributed to project proponents for their review. The MPO’s goal is to fairly and accurately assess all projects, making this review a critical component of the TIP process. Proponents are encouraged to submit feedback to MPO staff on their scores if they feel any criteria have been applied inaccurately. Proponents are also encouraged to submit additional supporting documentation on their projects if doing so would help clarify or correct any elements of the draft scoring. MPO staff take all proponent feedback into consideration and make any warranted adjustments to project scores before considering the evaluation process final and preparing the scores for presentation to the MPO.
For more details about the criteria used to score projects and project evaluation results for projects considered for programming in this TIP, see Appendix A.
On TIP Readiness Day, MPO staff meets with members of the MassDOT Highway Division and Office of Transportation Planning to review cost and schedule changes related to currently programmed projects, which are undergoing design review, permitting, and right-of-way acquisition. The MPO board then considers these updated project construction costs and changes to the expected dates for construction advertisement when making decisions about changes to TIP programming. These changes have an impact on the ability of the MPO to program its target funds for new projects in the five-year TIP.
Between the development of the FFYs 2021–25 TIP and the FFYs 2022–26 TIP, more than half of the projects programmed by the MPO experienced cost increases, many of which represented significant increases in percentage terms or in absolute cost. These changes placed severe limitations on the MPO’s ability to consider new projects for funding during the FFYs 2022–26 TIP cycle. As a partner to MassDOT’s Highway Division and Office of Transportation Planning, the MPO recognizes its role in supporting the on-time and on-budget delivery of projects by proponents. For this reason, the MPO board created a committee in the wake of the FFYs 2022–26 TIP cycle to further explore the causes of project cost increases and devise MPO policy changes to support more reliable project delivery by all parties.
The TIP Project Cost Ad Hoc Committee began its work in June 2021 and advanced a set of policy recommendations to the full MPO board in September 2021. These changes were formally adopted by the MPO on November 4, 2021, and went into effect for the development of the FFYs 2023–27 TIP. In addition to the requirement that project proponents submit 25 percent design plans and obtain an updated cost estimate for their project prior to obtaining funding in the TIP, the committee’s work resulted in several other policy changes. Most notably, the MPO board adopted a policy that proponents of any projects that experienced a cost increase of 25 percent or greater (for projects less than $10 million in cost) or of greater than $2.5 million (for projects more than $10 million in cost) would be required to present to the MPO board on the reasons for these cost increases. The MPO would then compare this project—at its new cost—to other projects based on a cost-effectiveness evaluation before making a decision on whether or not to fund the project at its higher cost. These cost changes are most often revealed through conversations between MassDOT staff and MPO staff during TIP Readiness Day, making this policy especially relevant at this stage of TIP development.
More information on the work of the TIP Project Cost Ad Hoc Committee is available in Chapter 3.
Using the evaluation scores and information gathered about project readiness (when a project likely would be fully designed and ready for advertisement) and cost, staff prepares possible TIP project programming scenarios for the MPO’s consideration. When developing these scenarios, MPO staff also considers whether a project was programmed in the LRTP, LRTP-based guidelines for allocating funds to different programs or project types, the distribution of investments across the region, and availability of sufficient funding. The MPO staff gather feedback from board members, project proponents, and the public to inform a final staff recommendation, which is then presented to the MPO for approval before it is included in the draft TIP for public review.
Given the significant increase in Regional Target funding in the FFYs 2024-28 TIP resulting from the passage of the BIL, the MPO selected 21 projects for funding during this TIP cycle, including the following:
In total, the MPO allocated more than $150 million in this TIP cycle to projects not previously funded in the Regional Target program. More information on the projects funded in the FFYs 2024–28 TIP is available in Chapter 3.
As discussed above, the selection of transit, bridge, and statewide infrastructure projects for programming in the TIP draws primarily from the CIPs produced by MassDOT and the MBTA. These agencies evaluate projects for inclusion in CIP programs using criteria established by the independent Project Selection Advisory Council (PSAC). The following criteria from the PSAC process guide project evaluation:
Projects that receive the highest priority are those that meet each agency’s goals for maintaining and improving the overall condition and reliability of the system; modernizing the system to make it safer and more accessible and to accommodate growth; and expanding and diversifying transportation options for communities. These project-prioritization processes may also reflect other planning initiatives, such as Focus40, the MBTA’s 25-year investment plan, or MassDOT’s modal plans. More information on regulatory and planning guidance governing TIP project prioritization is available in Appendix E. Once project prioritization is complete, programming decisions are made based on these evaluations and information regarding project readiness, program sizing, and existing asset management plans.
As discussed previously, the transit element of the TIP also includes the Federal-Aid Programs of the other two RTAs in the region, CATA and MWRTA. Once selection processes are complete for all four agencies, these agencies submit their lists of bridge and roadway projects, bicycle and pedestrian improvements, statewide infrastructure items, and transit capital projects to the MPO for review.
The MPO board considers the project evaluation results and staff recommendation when prioritizing projects for Regional Target funding. The board also considers public comments, the regional importance of projects, and other factors. In addition to prioritizing the Regional Target funding, the MPO board reviews MassDOT’s proposed statewide highway programming and the proposed capital programs for the MBTA, CATA, and MWRTA before voting to release a draft TIP for public review.
The MPO board votes to release the draft document for public review and invites members of the public, municipal and elected officials, and other stakeholders in the Boston region to review the proposed TIP. The MPO staff hosts outreach events during the public review period to elicit comments on the draft document. (See Appendix C for a full list of public comments submitted on the draft TIP.)
After the public review period ends, the MPO staff and board review all public comments, and the board may change the programming or the document as appropriate before endorsing the TIP. MassDOT staff incorporates the MPO-endorsed TIP into the State Transportation Improvement Program (STIP) and submits it to the FHWA and FTA for approval. The FHWA, FTA, and US Environmental Protection Agency review the STIP and certify it by September 30, the end of the federal fiscal year.
The TIP is a dynamic program that may be amended and adjusted throughout the year. Administrative modifications and amendments are often introduced because of changes in project status (advertisement readiness), project cost, project design scope, or available revenue. An amendment is a revision that requires public review and a demonstration of fiscal constraint.
Consistent with federal guidelines, the Boston Region MPO must release an amendment if there is (1) a change in project cost of $500,000 or more for projects valued at $5 million or less, or (2) a change of 10 percent or more of the project cost for projects valued greater than $5 million. TIP amendments are also released if there is a proposal to add or remove a project from the TIP or if the programming year of a project is changed. Cost changes that are less than the above threshold amounts may be considered in the form of administrative modifications or adjustments, which must still undergo MPO board action for approval. Administrative modifications or adjustments are also undertaken in the event that a project’s funding source changes. Although a public review period is not required for administrative modifications or adjustments, one may be offered at the MPO board’s discretion.
Regardless of the nature of an amendment, all proposed TIP amendments are presented in a public setting at an MPO meeting, and details are posted on the MPO’s website, bostonmpo.org. Public notices are distributed through the MPO’s email contact list, which members of the public may join by signing up on the MPO’s website. Municipal staff who are TIP contacts at the affected municipalities and the public are notified of pending amendments at the start of an amendment’s public review period.
A history of TIP Amendments can be found at https://www.ctps.org/tip.
Notices of draft TIP amendments include a summary of the amendment’s contents, dates of the public review period, contact information for submitting a comment to the MPO, and the date, time, and location that the MPO will vote on that amendment. Municipal representatives and members of the public are invited to submit written or oral testimony at the MPO meetings at which amendments are discussed or voted upon.
The MPO typically holds a 21-day public review period before taking final action on an amendment. In extraordinary circumstances, the MPO may vote to shorten the public review period to a minimum of 15 days. These circumstances are detailed in the MPO’s Public Engagement Plan.
The MPO’s website is the best place to find current information about the TIP. All changes to the draft TIP and changes to the endorsed TIP, such as amendments and modifications that have been approved by the MPO, are available on the TIP webpage, bostonmpo.org/tip.
Comments or questions about the draft TIP materials may be submitted directly to the MPO staff via the website, email, or US mail, or voiced at MPO meetings and other public MPO events.
2-1 The Community Connections Program was formerly referred to as the Community Transportation/Parking/Clean Air and Mobility Program when it was originally created in the MPO’s 2015 LRTP, Charting Progress to 2040.
Chapter 3—Highway and Transit Programming
The Transportation Improvement Program (TIP) tables included in this chapter present a listing of all the projects and programs funded with federal highway and transit aid in the Boston region during federal fiscal years (FFYs) 2024–28. These funding tables are also included as part of the State Transportation Improvement Program (STIP).
Table 3-1 presents a summary of the Boston Region Metropolitan Planning Organization’s (MPO) share of Regional Target funds from the Federal-Aid Highway Program. The allocation of these funds is constrained by projections of available federal aid. As shown in Table 3-1, the MPO has programmed much of the available discretionary funds within the limits of projected funding for highway funding programs. As such, the FFYs 2024–28 TIP Regional Target Program complies with financial constraint requirements.
Table 3-1
Boston Region MPO Regional Target Program
Funding Summary
|
FFY 2024 |
FFY 2025 |
FFY 2026 |
FFY 2027 |
FFY 2028 |
Total |
Regional Target Obligation Authority |
$130,647,095 |
128,427,689 |
$125,285,687 |
$155,132,142 |
$158,052,175 |
$697,544,788 |
Regional Target Funds Programmed |
$126,991,048 |
$125,975,489 |
$124,667,241 |
$144,006,044 |
$149,868,526 |
$671,508,348 |
Regional Target Funds Unprogrammed |
$3,656,047 |
$2,452,200 |
$618,446 |
$11,126,098 |
$8,183,649 |
$26,036,440 |
Source: Boston Region MPO.
As discussed in Chapter 2, the signing of the Bipartisan Infrastructure Law (BIL), on November 15, 2021, increased the amount of Regional Target funding available to the Boston Region MPO for the development of the FFYs 2024–28 TIP by approximately nine percent from the funding levels in the FFYs 2023–27 TIP. The projects selected by the MPO for funding for the first time in the FFYs 2024–28 TIP are listed in Table 3-2.
During the development of the FFYs 2024–28 TIP, the MPO had significant amounts of funding available to program for each fiscal year. This surplus was driven by programming delays for nine projects.
Projects already programmed in the TIP to receive Regional Target funds could not be accelerated, so the MPO worked with the Massachusetts Department of Transportation (MassDOT) and the Massachusetts Bay Transportation Authority (MBTA) to identify other projects that could be funded in these fiscal years. Jointly, MassDOT and the MBTA presented more than a dozen projects to the MPO for consideration, from which the MPO selected five projects for funding in FFYs 2024 and 2025:
The MPO also selected one MassDOT project for funding in FFY 2027:
The MPO staff has not yet evaluated these projects using the MPO’s project selection criteria because of time constraints associated with the MPO board’s deadlines for making decisions about project funding. However, these projects generally align well with many of the MPO’s goals, including enhancing bicycle and pedestrian safety and access, and expanding the accessibility of and maintaining a state of good repair for the region’s transit system and critical roadways. Scoring information for these projects will be included in the TIP when it is available.
Table 3-2
New Regional Target Projects Funded in the FFYs 2024–28 TIP
Project Name |
Municipality (Proponent) |
MPO Investment Program |
FFYs of Funding |
Regional Target Dollars Programmed in FFYs 2024–28 |
||||
Malden—Spot Pond Brook Greenway |
Malden |
Bicycle Network and Pedestrian Connections |
2027 |
$4,858,127 |
||||
Natick—Cochituate Rail Trail Extension, from MBTA Station to Mechanic Street |
Natick |
Bicycle Network and Pedestrian Connections |
2028 |
$7,760,451 |
||||
Westwood–Norwood—Reconstruction of Canton Street to University Drive, including Rehabilitation of N-25-032=W-31-018 |
Westwood |
Complete Streets |
2028 |
$22,094,875 |
||||
Boston—Bridge Preservation, B-16-066 (38D), Cambridge Street over MBTA |
Boston |
Complete Streets |
2026 |
$16,632,000 |
||||
Wakefield—Comprehensive Downtown Main Street Reconstruction |
Wakefield |
Complete Streets |
2028 |
$16,581,200 |
||||
MWRTA CatchConnect Microtransit Service Expansion Phase 2 |
MWRTA |
Community Connections |
2024–26 |
$380,477 |
||||
Lynn—Broad Street Corridor Transit Signal Priority |
Lynn |
Community Connections |
2024 |
$297,800 |
|
|||
Medford Bicycle Parking–Tier 1 |
Medford |
Community Connections |
2024 |
$29,600 |
|
|||
Medford Bluebikes Expansion |
Medford |
Community Connections |
2024 |
$118,643 |
|
|||
Canton Public Schools Bike Program |
Canton |
Community Connections |
2024 |
$22,500 |
|
|||
Canton Center Bicycle Racks |
Canton |
Community Connections |
2024 |
$10,000 |
|
|||
Boston Electric Bluebikes Adoption |
Boston |
Community Connections |
2024 |
$1,020,000 |
|
|||
Cambridge Electric Bluebikes Adoption |
Cambridge |
Community Connections |
2024 |
$352,575 |
|
|||
Acton Parking Management System |
Acton |
Community Connections |
2024 |
$15,000 |
|
|||
Everett—Targeted Multi-Modal and Safety Improvements on Route 16 |
MassDOT |
Intersection Improvements |
2027 |
$5,246,920 |
|
|||
Chelsea—Targeted Safety Improvements and Related Work on Broadway, from Williams Street to City Hall Avenue |
MassDOT |
Intersection Improvements |
2025 |
$6,315,013 |
|
|||
Jackson Square Station Accessibility Improvements |
MBTA |
Transit Modernization |
2024–25 |
$26,250,000 |
|
|||
Rail Transformation Early Action Items—Reading Station and Wilbur Interlocking |
MBTA |
Transit Modernization |
2024 |
$14,000,000 |
|
|||
Columbus Avenue Bus Lanes Phase 2 |
MBTA |
Transit Modernization |
2024 |
$11,750,000 |
|
|||
Bikeshare State of Good Repair Set-Aside |
CTPS |
Community Connections |
2025–28 |
$6,000,000 |
|
|||
Project Design Support Pilot |
CTPS |
Project Design Support Pilot |
2025 |
$4,000,000 |
|
|||
Total |
N/A |
N/A |
N/A |
$150,293,079 |
|
|||
Note: Funding amounts in this table include both federal and non-federal funds, including matching funds.
*Funding in this table represents the first year of funding, with additional funding anticipated to be allocated to these projects by the Boston Region MPO in future fiscal years.
CTPS = Central Transportation Planning Staff. FFY = federal fiscal year. MassDOT = Massachusetts Department of Transportation. MBTA = Massachusetts Bay Transportation Authority. MWRTA = MetroWest Regional Transit Authority. N/A = not applicable. TIP = Transportation Improvement Program.
Source: Boston Region MPO.
In addition to the project selection, several other key decisions were made by the MPO in the drafting of the FFYs 2024–28 Regional Target Program:
Additional details of the specific projects programmed with Regional Target funding are shown in Section 1A of each annual element of the TIP tables (Table 3-7). The other sections in Table 3-7 (Sections 1B, 2A, 2B, 2C, and 3B) list the following:
Tables 3-8, 3-9, 3-10, and 3-11 list the federally funded transit projects and programs in the Boston region that the MBTA, MetroWest Regional Transit Authority (MWRTA), and Cape Ann Transportation Authority (CATA) plan to undertake.
Detailed descriptions of projects funded through both the Regional Target and statewide portions of the Highway Program follow the tables. The descriptions note the evaluation scores (for MPO-funded projects), project proponents, and funding details. The pages are organized alphabetically by the municipality in which each project is located.
This section summarizes the investments made by the Boston Region MPO, MassDOT, MBTA, CATA, and MWRTA that are documented in the FFYs 2024–28 TIP. Table 3-3 shows the Boston Region MPO’s investments of Regional Target funding—including both the number of projects and the dollar amount—by investment program. These investments are aimed at making progress towards the MPO’s goals for the region, including enhancing safety for all users, preserving and modernizing the transportation system, promoting mobility and reducing congestion, supporting clean air and sustainability, ensuring all have equitable access to the transportation system, and fostering economic vitality in the region through investments in transportation.
The MPO’s Regional Target Program increased in size by approximately $52 million between the FFYs 2023–27 TIP and the FFYs 2024–28 TIP to a total program size of more than $697 million.
Table 3-3
FFYs 2024–28 Boston Region MPO Regional Target Investment Summary
MPO Investment Program |
Number of Projects |
Regional Target Dollars Programmed |
Bicycle Network and Pedestrian Connections |
6 |
$66,140,116 |
Community Connections (allocated to projects)* |
17 |
$11,529,796 |
Community Connections (not yet allocated to projects) |
N/A |
$8,334,827 |
Complete Streets** |
22 |
$328,884,131 |
Intersection Improvements |
5 |
$44,424,588 |
Major Infrastructure—Roadway |
3 |
$125,094,890 |
Transit Modernization (allocated to projects) |
4 |
$65,600,000 |
Transit Modernization (not yet allocated to projects) |
N/A |
$21,500,000 |
Unprogrammed |
N/A |
$26,036,440 |
Total |
57 |
$697,544,788 |
Note: Funding amounts in this table include both federal and non-federal funds, including matching funds.
* This figure includes $6 million in BikeShare Support funding starting in FFY 2025.
**The $4 million Project Design Support Pilot in FFY 2025 is accounted for under this program
FFY = federal fiscal year. MPO = metropolitan planning organization. N/A = not applicable.
Source: Boston Region MPO.
Table 3-4 shows MassDOT’s FFYs 2024–28 TIP investments—including both the number of projects or programs and the dollar amount—organized by MassDOT program. MassDOT’s investments are distributed across a variety of programs and will support bridge and pavement improvements, roadway improvements and reconstruction, new bicycle and pedestrian infrastructure, and safety improvements. More details on these investments are available on the project description pages in the second section of this chapter.
As detailed above for the MPO’s Regional Target Program, the BIL significantly increased the funding available to MassDOT for programming projects in the statewide Highway Program. Most notably, the BIL’s Bridge Formula Program allowed MassDOT to increase the funding allocated to federal-aid bridge projects. Furthermore, FFY 2026 represents the conclusion of grant anticipation notes (GANS) payments for MassDOT’s Accelerated Bridge Program (ABP). As this program winds down, the passage of the 2021 Massachusetts Transportation Bond Bill and the new federal funding available through the BIL has allowed for the creation of MassDOT’s Next Generation Bridge Program (NGBP).
Like the ABP, the NGBP leverages state bonding capacity to accelerate the rehabilitation and replacement of critical or structurally deficient bridges across Massachusetts. In the FFYs 2024–28 TIP, 15 bridge projects are funded by MassDOT through the NGBP using state bond bill funds. These projects are shown in the TIP as debt payments on these bonds, which will use future federal formula funding.
Continued funding from the BIL supports increased investment across MassDOT’s other programs in the FFYs 2024–28 TIP, including the Bicycle and Pedestrian Program, the Intersection Improvements Program, the Interstate and Non-Interstate Pavement Programs, the Roadway Reconstruction Program, and the Safety Improvements Program. MassDOT’s Highway Program has increased by more than $1.1 billion between the FFYs 2023–27 TIP and the FFYs 2024–28 TIP to a total program size of more than $3.1 billion over five years.
Table 3-4
FFYs 2024–28 MassDOT Highway Program Investment Summary
MassDOT Program |
Number of Projects |
MassDOT Dollars Programmed |
Bicycle and Pedestrian |
8 |
$46,668,222 |
Federal-Aid Bridge Program |
27 |
$544,133,685 |
Next Generation Bridge Program |
15 |
$553,337,190 |
Earmarks or Discretionary Grants* |
4 |
$94,623,709 |
Intersection Improvements |
10 |
$33,530,370 |
Interstate Pavement |
5 |
$98,117,990 |
Non-Interstate Pavement |
6 |
$98,281,156 |
Roadway Reconstruction |
12 |
$233,829,517 |
Safety Improvements |
8 |
$49,121,035 |
Safe Routes to School |
10 |
$13,258,486 |
Non-Federal Aid (NFA) |
1 |
$80,040,000 |
Total |
111 |
$1,587,058,890 |
Note: Funding amounts in this table include both federal and non-federal funds, including matching funds.
* Three projects receiving earmark funding are also receiving funding through other sources: Project 607977—Interstates 90/495 Interchange Reconstruction—is funded through MassDOT’s Roadway Reconstruction and NFA Programs; Project 605313—Natick Bridge Replacement over Route 9 and Interchange Improvements—is funded through MassDOT’s Bridge On-System NHS NB Program; and Project 608436—Ashland Rehabilitation and Rail Crossing Improvements on Cherry Street—is funded through MassDOT’s Railroad Crossings Program. Each project is counted in the tally for each funding category but is only counted once in the total number of projects funded.
Table 3-5 shows the MBTA’s programs and associated FFYs 2024–28 TIP funding amounts. Additional details on the MBTA’s programs and projects are in Tables 3-8 and 3-9. The MBTA’s capital program is substantially similar between FFYs 2023–27 TIP and the FFYs 2024–28 TIP, increasing from a total program size of $3.93 billion to $3.99 billion. Investments made through these programs allow the MBTA to continue to maintain and modernize its infrastructure in support of the agency’s role as the largest transit provider in the Commonwealth of Massachusetts.
The MBTA caters to a wide range of needs, serving the Boston region with commuter rail, light rail, subway, fixed-route bus, and paratransit services. The MBTA prioritizes projects that keep the existing transit system in a state of good repair, including the purchase of new rolling stock, accessibility and resiliency improvements to stations, the rehabilitation of bridges and tunnels, and the replacement of tracks and signals to support system-wide reliability. Limited system expansion projects are also undertaken through the MBTA’s federal capital program. Further information on how the MBTA’s investments support system safety and condition is available in Chapter 4.
Table 3-5
FFYs 2024–28 MBTA Transit Program Investment Summary
Federal Transit Administration Program |
MBTA Program |
MBTA Dollars Programmed |
Section 5307: Urbanized Area Formula Grants |
Bridge and Tunnel Program |
$131,173,545 |
Section 5307: Urbanized Area Formula Grants |
Revenue Vehicle Program |
$599,990,395 |
Section 5307: Urbanized Area Formula Grants |
Signals/Systems Upgrade Program |
$288,413,826 |
Section 5307: Urbanized Area Formula Grants |
Stations and Facilities Program |
$229,532,339 |
Section 5337: Fixed Guideway/Bus Funds |
Bridge and Tunnel Program |
$480,612,299 |
Section 5337: Fixed Guideway/Bus Funds |
Revenue Vehicle Program |
$202,087,490 |
Section 5337: Fixed Guideway/Bus Funds |
Signals/Systems Upgrade Program |
$169,438,086 |
Section 5337: Fixed Guideway/Bus Funds |
Stations and Facilities Program |
$640,577,274 |
Section 5339: Bus and Bus Facilities Funds |
Bus Program |
$39,560,430 |
Other Federal Funds |
Positive Train Control* |
$469,150,000 |
Other Federal Funds |
RRIF/TIFIA Financing Program† |
$737,500,000 |
Total |
N/A |
$3,988,035,684 |
Note: Federal Transit Administration formula funds (Sections 5307, 5337 and 5339) are based on estimated apportionments for FFYs 2024–28. These apportionments include additional funding to be made available through the Bipartisan Infrastructure Law, based on current estimates. TIP programs and projects are based on a preliminary draft Capital Investment Plan (CIP) as of April 2022. Adjustments will be made to federal projects and budgets as the CIP process is finalized. Funding amounts in this table include both federal and non-federal funds, including matching funds.
* Positive Train Control investments are funded with RRIF funds.
† RRIF/TIFIA financing program funding is an initial estimate and will be refined as projects are identified and loans are finalized with the Build America Bureau.
FFY = federal fiscal year. N/A = not applicable. RRIF = Railroad Rehabilitation and Improvement Financing. TIFIA = Transportation Infrastructure Finance and Innovation Act. TIP = Transportation Improvement Program.
Sources: MBTA and the Boston Region MPO.
Table 3-6 summarizes CATA and MWRTA investments included in the FFYs 2024–28 TIP, and more information is available on each agency’s investments in Tables 3-10 and 3-11. Though the MBTA provides commuter rail service to the Cape Ann communities of Rockport and Gloucester, CATA provides additional paratransit and fixed-route bus services to these communities and to Danvers, Peabody, Ipswich, Essex, and Beverly. CATA’s federal capital program supports its role in providing critical transportation alternatives to residents and visitors of the area, including through the replacement of buses, the modernization of facilities, and the maintenance of assets.
MWRTA similarly complements MBTA commuter rail service, operating fixed-route bus, on-demand microtransit, and commuter shuttle services to a number of communities in the MetroWest subregion. MWRTA’s federal capital program supports this mission by funding vehicle replacements, station and facility maintenance and improvements, and operating assistance for paratransit services, among other efforts. Other projects funded in MWRTA’s 2024–28 TIP include the electrification of the agency’s paratransit fleet and investments in technology to support travel training and customer service efforts.
Overall, the program size for CATA is substantially similar in the FFYs 2024–28 TIP to its figures in the FFYs 2023–27 TIP, while the program size for MWRTA increased by a greater amount. These agencies collectively received an approximately $9.7 million increase in funding levels in this TIP for a total program size of more than $65.3 million.
Table 3-6
FFYs 2024–28 CATA and MWRTA Transit Program Investment Summary
Regional Transit Authority |
Federal Transit Administration Program |
RTA Dollars Programmed |
CATA |
Section 5307: Urbanized Area Formula Funding |
$1,895,000 |
CATA |
State Transportation Bond Capital Assistance |
$4,182,500 |
CATA |
Municipal and Local Assessments |
$356,250 |
MWRTA |
Section 5307: Urbanized Area Formula Funding |
$14,557,400 |
MWRTA |
Section 5339: Bus and Bus Facilities |
$3,221,344 |
MWRTA |
State Transportation Bond Capital Assistance |
$7,361,432 |
MWRTA |
Other Federal |
$28,784,470 |
MWRTA |
Other Non-Federal |
$5,000,000 |
Total |
N/A |
$65,358,396 |
Note: Funding amounts in this table include both federal and non-federal funds, including matching funds.
CATA = Cape Ann Transportation Authority. FFY = federal fiscal year. MWRTA = Metro West Regional Transit Authority. N/A = not applicable. RTA = regional transit administration
Sources: CATA, MWRTA, and the Boston Region MPO.
Tables 3-7 through 3-11 build on the summary tables listed above by detailing investments made through both the Highway and Transit Programs by project, program, and funding year.
Table 3-7
FFYs 2024-28 TIP Highway Programming
| STIP: 2024 - 2028 (D) | ||||||||||||
| Year | MassDOT Project ID | MPO | Municipality | MassDOT Project Description | District | Funding Source | Adjusted TFPC | Total Programmed Funds | Federal Funds | Non-Federal Funds | ||
| Federal Fiscal Year 2024 | $555,232,715 | $277,338,132 | $277,894,583 | |||||||||
| Section 1A / Regionally Prioritized Projects | $126,991,048 | $102,342,838 | $24,648,210 | |||||||||
| Bridge On-system NHS | $21,851,750 | $17,481,400 | $4,370,350 | |||||||||
| 2024 | 110980 | Boston Region | Multiple | NEWTON- WESTON- BRIDGE REHABILITATION, N-12-010=W-29-005, COMMONWEALTH AVENUE (ROUTE 30) OVER THE CHARLES RIVER | 6 | NHPP-PEN | $21,851,750 | $21,851,750 | $17,481,400 | $4,370,350 | ||
| Roadway Reconstruction | $42,150,471 | $34,470,377 | $7,680,094 | |||||||||
| 2024 | 603739 | Boston Region | Wrentham | WRENTHAM- CONSTRUCTION OF ROUTE I-495/ROUTE 1A RAMPS | 5 | HSIP | $17,994,890 | $4,500,000 | $4,050,000 | $450,000 | ||
| 2024 | 603739 | Boston Region | Wrentham | WRENTHAM- CONSTRUCTION OF ROUTE I-495/ROUTE 1A RAMPS | 5 | STBG | $17,994,890 | $12,494,890 | $9,995,912 | $2,498,978 | ||
| 2024 | 603739 | Boston Region | Wrentham | WRENTHAM- CONSTRUCTION OF ROUTE I-495/ROUTE 1A RAMPS | 5 | TAP | $17,994,890 | $1,000,000 | $800,000 | $200,000 | ||
| 2024 | 606226 | Boston Region | Boston | BOSTON- RECONSTRUCTION OF RUTHERFORD AVENUE, FROM CITY SQUARE TO SULLIVAN SQUARE | 6 | NHPP | $197,759,449 | $0 | $0 | $0 | ||
| 2024 | 606226 | Boston Region | Boston | BOSTON- RECONSTRUCTION OF RUTHERFORD AVENUE, FROM CITY SQUARE TO SULLIVAN SQUARE | 6 | STBG | $197,759,449 | $0 | $0 | $0 | ||
| 2024 | 606226 | Boston Region | Boston | BOSTON- RECONSTRUCTION OF RUTHERFORD AVENUE, FROM CITY SQUARE TO SULLIVAN SQUARE | 6 | TAP | $197,759,449 | $0 | $0 | $0 | ||
| 2024 | 607777 | Boston Region | Watertown | WATERTOWN- REHABILITATION OF MOUNT AUBURN STREET (ROUTE 16) | 6 | CMAQ | $27,899,345 | $1,000,000 | $800,000 | $200,000 | ||
| 2024 | 607777 | Boston Region | Watertown | WATERTOWN- REHABILITATION OF MOUNT AUBURN STREET (ROUTE 16) | 6 | STBG | $27,899,345 | $2,494,249 | $1,995,399 | $498,850 | ||
| 2024 | 608007 | Boston Region | Multiple | COHASSET- SCITUATE- CORRIDOR IMPROVEMENTS AND RELATED WORK ON JUSTICE CUSHING HIGHWAY (ROUTE 3A), FROM BEECHWOOD STREET TO HENRY TURNER BAILEY ROAD | 5 | HSIP | $15,496,957 | $3,000,000 | $2,700,000 | $300,000 | ||
| 2024 | 608007 | Boston Region | Multiple | COHASSET- SCITUATE- CORRIDOR IMPROVEMENTS AND RELATED WORK ON JUSTICE CUSHING HIGHWAY (ROUTE 3A), FROM BEECHWOOD STREET TO HENRY TURNER BAILEY ROAD | 5 | STBG | $15,496,957 | $11,869,554 | $9,495,643 | $2,373,911 | ||
| 2024 | 608007 | Boston Region | Multiple | COHASSET- SCITUATE- CORRIDOR IMPROVEMENTS AND RELATED WORK ON JUSTICE CUSHING HIGHWAY (ROUTE 3A), FROM BEECHWOOD STREET TO HENRY TURNER BAILEY ROAD | 5 | TAP | $15,496,957 | $627,403 | $501,922 | $125,481 | ||
| 2024 | 609054 | Boston Region | Littleton | LITTLETON- RECONSTRUCTION OF FOSTER STREET | 3 | CMAQ | $5,164,375 | $1,500,000 | $1,200,000 | $300,000 | ||
| 2024 | 609054 | Boston Region | Littleton | LITTLETON- RECONSTRUCTION OF FOSTER STREET | 3 | STBG | $5,164,375 | $2,664,375 | $2,131,500 | $532,875 | ||
| 2024 | 609054 | Boston Region | Littleton | LITTLETON- RECONSTRUCTION OF FOSTER STREET | 3 | TAP | $5,164,375 | $1,000,000 | $800,000 | $200,000 | ||
| Bicycle and Pedestrian | $7,556,704 | $6,045,363 | $1,511,341 | |||||||||
| 2024 | 609211 | Boston Region | Peabody | PEABODY- INDEPENDENCE GREENWAY EXTENSION | 4 | CMAQ | $7,524,204 | $3,524,204 | $2,819,363 | $704,841 | ||
| 2024 | 609211 | Boston Region | Peabody | PEABODY- INDEPENDENCE GREENWAY EXTENSION | 4 | TAP | $7,524,204 | $4,000,000 | $3,200,000 | $800,000 | ||
| 2024 | S12805 | Boston Region | Canton | CANTON PUBLIC SCHOOLS BIKE PROGRAM | 6 | CMAQ | $22,500 | $22,500 | $18,000 | $4,500 | ||
| 2024 | S12806 | Boston Region | Canton | CANTON CENTER BICYCLE RACKS | 6 | CMAQ | $10,000 | $10,000 | $8,000 | $2,000 | ||
| Transit Grant Program | $2,549,479 | $2,039,583 | $509,896 | |||||||||
| 2024 | S12114 | Boston Region | Canton | ROYALL STREET SHUTTLE | CMAQ | $534,820 | $148,542 | $118,834 | $29,708 | |||
| 2024 | S12124 | Boston Region | Multiple | COMMUNITY CONNECTIONS PROGRAM | CMAQ | $8,334,827 | $0 | $0 | $0 | |||
| 2024 | S12694 | Boston Region | Newton | NEWMO MICROTRANSIT SERVICE EXPANSION | 6 | CMAQ | $890,574 | $268,246 | $214,597 | $53,649 | ||
| 2024 | S12697 | Boston Region | Watertown | PLEASANT STREET SHUTTLE SERVICE EXPANSION | 6 | CMAQ | $1,002,198 | $335,434 | $268,347 | $67,087 | ||
| 2024 | S12699 | Boston Region | Stoneham | STONEHAM SHUTTLE SERVICE | 4 | CMAQ | $796,817 | $261,439 | $209,151 | $52,288 | ||
| 2024 | S12803 | Boston Region | Medford | MEDFORD - BICYCLE PARKING (TIER 1) | 4 | CMAQ | $29,600 | $29,600 | $23,680 | $5,920 | ||
| 2024 | S12804 | Boston Region | Medford | MEDFORD - BLUEBIKES EXPANSION | 4 | CMAQ | $118,643 | $118,643 | $94,914 | $23,729 | ||
| 2024 | S12818 | Boston Region | Acton | ACTON PARKING MANAGEMENT SYSTEM | 3 | CMAQ | $15,000 | $15,000 | $12,000 | $3,000 | ||
| 2024 | S12823 | Boston Region | Boston | BOSTON - ELECTRIC BLUEBIKES ADOPTION | 6 | CMAQ | $1,020,000 | $1,020,000 | $816,000 | $204,000 | ||
| 2024 | S12824 | Boston Region | Cambridge | CAMBRIDGE - ELECTRIC BLUEBIKES ADOPTION | 6 | CMAQ | $352,575 | $352,575 | $282,060 | $70,515 | ||
| Flex to FTA | $52,882,644 | $42,306,115 | $10,576,529 | |||||||||
| 2024 | S12700 | Boston Region | Multiple | CATA ON DEMAND MICROTRANSIT SERVICE EXPANSION | 4 | CMAQ | $813,291 | $265,065 | $212,052 | $53,013 | ||
| 2024 | S12701 | Boston Region | Multiple | MWRTA CATCHCONNECT MICROTRANSIT SERVICE EXPANSION | 3 | CMAQ | $450,163 | $149,425 | $119,540 | $29,885 | ||
| 2024 | S12703 | Boston Region | Multiple | MONTACHUSETT RTA MICROTRANSIT SERVICE | 3 | CMAQ | $1,316,061 | $430,354 | $344,283 | $86,071 | ||
| 2024 | S12705 | Boston Region | Lynn | LYNN STATION IMPROVEMENTS PHASE II | 4 | STBG | $48,100,000 | $13,600,000 | $10,880,000 | $2,720,000 | ||
| 2024 | S12802 | Boston Region | Lynn | LYNN - BROAD STREET CORRIDOR TRANSIT SIGNAL PRIORITY | 4 | CMAQ | $297,800 | $297,800 | $238,240 | $59,560 | ||
| 2024 | S12807 | Boston Region | Multiple | MWRTA CATCHCONNECT MICROTRANSIT EXPANSION PHASE 2 | 3 | CMAQ | $380,477 | $140,000 | $112,000 | $28,000 | ||
| 2024 | S12819 | Boston Region | Boston | JACKSON SQUARE STATION ACCESSIBILITY IMPROVEMENTS | 6 | CMAQ | $26,250,000 | $12,250,000 | $9,800,000 | $2,450,000 | ||
| 2024 | S12821 | Boston Region | Multiple | RAIL TRANSFORMATION - EARLY ACTION ITEMS - READING STATION AND WILBUR INTERLOCKING | 4 | CMAQ | $14,000,000 | $14,000,000 | $11,200,000 | $2,800,000 | ||
| 2024 | S12822 | Boston Region | Boston | COLUMBUS AVENUE BUS LANES PHASE 2 | 6 | CMAQ | $11,750,000 | $11,750,000 | $9,400,000 | $2,350,000 | ||
| Section 1B / Earmark or Discretionary Grant Funded Projects | $126,391,302 | $112,872,525 | $13,518,777 | |||||||||
| Bridge On-System NHS NB | $25,769,762 | $20,615,810 | $5,153,952 | |||||||||
| 2024 | 605313 | Boston Region | Natick | NATICK- BRIDGE REPLACEMENT, N-03-020, ROUTE 27 (NORTH MAIN STREET) OVER ROUTE 9 (WORCESTER STREET) AND INTERCHANGE IMPROVEMENTS | 3 | HIP-BR | $75,677,350 | $16,879,931 | $13,503,945 | $3,375,986 | ||
| 2024 | 606902 | Boston Region | Boston | BOSTON- BRIDGE REPLACEMENT, B-16-181, WEST ROXBURY PARKWAY OVER MBTA | 6 | HIP-BR | $8,889,831 | $8,889,831 | $7,111,865 | $1,777,966 | ||
| Earmark Discretionary | $84,714,980 | $79,531,468 | $5,183,512 | |||||||||
| 2024 | 605313 | Boston Region | Natick | NATICK- BRIDGE REPLACEMENT, N-03-020, ROUTE 27 (NORTH MAIN STREET) OVER ROUTE 9 (WORCESTER STREET) AND INTERCHANGE IMPROVEMENTS | 3 | CRRSAA | $75,677,350 | $58,797,419 | $58,797,419 | $0 | ||
| 2024 | 607977 | Boston Region | Multiple | HOPKINTON- WESTBOROUGH- RECONSTRUCTION OF I-90/I-495 INTERCHANGE | 3 | HIP | $300,942,837 | $0 | $0 | $0 | ||
| 2024 | 607977 | Boston Region | Multiple | HOPKINTON- WESTBOROUGH- RECONSTRUCTION OF I-90/I-495 INTERCHANGE | 3 | HIP-BR | $300,942,837 | $25,917,561 | $20,734,049 | $5,183,512 | ||
| Bridge On-system Non-NHS NB | $3,635,960 | $2,908,768 | $727,192 | |||||||||
| 2024 | 608522 | Boston Region | Middleton | MIDDLETON- BRIDGE REPLACEMENT, M-20-003, ROUTE 62 (MAPLE STREET) OVER IPSWICH RIVER | 4 | HIP-BR | $3,635,960 | $3,635,960 | $2,908,768 | $727,192 | ||
| Bridge Systematic Maintenance NB | $12,270,600 | $9,816,480 | $2,454,120 | |||||||||
| 2024 | 613196 | Boston Region | Burlington | BURLINGTON- LYNNFIELD- WAKEFIELD- WOBURN- BRIDGE PRESERVATION OF 10 BRIDGES CARRYING I-95 | 4 | HIP-BR | $3,999,600 | $3,999,600 | $3,199,680 | $799,920 | ||
| 2024 | 613209 | Boston Region | Boston | BOSTON- BRIDGE PRESERVATION, B-16-236 (39M, 39P, 39U, 39W, 39Y), 5 BRIDGES CARRYING STATE ROUTE 1A (EAST BOSTON EXPRESSWAY NB/SB) AND RAMPS | 6 | HIP-BR | $6,525,000 | $6,525,000 | $5,220,000 | $1,305,000 | ||
| 2024 | 613211 | Boston Region | Medford | MEDFORD- BRIDGE PRESERVATION OF 10 BRIDGES CARRYING I-93 | 4 | HIP-BR | $1,746,000 | $1,746,000 | $1,396,800 | $349,200 | ||
| Section 2A / State Prioritized Reliability Projects | $129,160,689 | $23,362,907 | $105,797,782 | |||||||||
| Bridge On-system NHS | $90,404,329 | $0 | $90,404,329 | |||||||||
| 2024 | 606496 | Boston Region | Boston | BOSTON- BRIDGE REHABILITATION, B-16-052, BOWKER OVERPASS OVER MASS PIKE, MBTA/CSX, & IPSWICH STREET AND RAMPS (BINS 4FD, 4FG, 4FE, 4FF & 4FJ) | 6 | NGBP | $90,404,329 | $90,404,329 | $0 | $90,404,329 | ||
| Bridge On-system Non-NHS | $12,538,835 | $0 | $12,538,835 | |||||||||
| 2024 | 606901 | Boston Region | Boston | BOSTON- BRIDGE REPLACEMENT, B-16-109, RIVER STREET BRIDGE OVER MBTA/AMTRAK | 6 | NGBP | $12,538,835 | $12,538,835 | $0 | $12,538,835 | ||
| Bridge Off-system | $2,328,651 | $1,862,921 | $465,730 | |||||||||
| 2024 | 609438 | Boston Region | Canton | CANTON- BRIDGE REPLACEMENT, C-02-042, REVERE COURT OVER WEST BRANCH OF THE NEPONSET RIVER | 6 | STBG-BR-Off | $2,328,651 | $2,328,651 | $1,862,921 | $465,730 | ||
| Interstate Pavement | $23,888,874 | $21,499,987 | $2,388,887 | |||||||||
| 2024 | 612034 | Boston Region | Woburn | WOBURN- INTERSTATE PAVEMENT PRESERVATION AND RELATED WORK ON I-95 | 4 | NHPP-I | $7,849,699 | $7,849,699 | $7,064,729 | $784,970 | ||
| 2024 | 612048 | Boston Region | Waltham | WALTHAM- INTERSTATE MAINTENANCE AND RELATED WORK ON I-95 | 4 | NHPP-I | $16,039,175 | $16,039,175 | $14,435,258 | $1,603,918 | ||
| Section 2B / State Prioritized Modernization Projects | $43,066,512 | $38,759,861 | $4,306,651 | |||||||||
| Intersection Improvements | $15,386,886 | $13,848,197 | $1,538,689 | |||||||||
| 2024 | 607342 | Boston Region | Milton | MILTON- INTERSECTION IMPROVEMENTS AT ROUTE 28 (RANDOLPH AVENUE) & CHICKATAWBUT ROAD | 6 | HSIP | $9,112,736 | $9,112,736 | $8,201,462 | $911,274 | ||
| 2024 | 608562 | Boston Region | Somerville | SOMERVILLE- SIGNAL AND INTERSECTION IMPROVEMENT ON I-93 AT MYSTIC AVENUE AND MCGRATH HIGHWAY (TOP 200 CRASH LOCATION) | 4 | VUS | $7,452,168 | $2,500,000 | $2,250,000 | $250,000 | ||
| 2024 | 608562 | Boston Region | Somerville | SOMERVILLE- SIGNAL AND INTERSECTION IMPROVEMENT ON I-93 AT MYSTIC AVENUE AND MCGRATH HIGHWAY (TOP 200 CRASH LOCATION) | 4 | HSIP | $7,452,168 | $3,774,150 | $3,396,735 | $377,415 | ||
| Roadway Reconstruction | $27,679,626 | $24,911,663 | $2,767,963 | |||||||||
| 2024 | 607977 | Boston Region | Multiple | HOPKINTON- WESTBOROUGH- RECONSTRUCTION OF I-90/I-495 INTERCHANGE | 3 | NHPP-I | $300,942,837 | $16,000,000 | $14,400,000 | $1,600,000 | ||
| 2024 | 607977 | Boston Region | Multiple | HOPKINTON- WESTBOROUGH- RECONSTRUCTION OF I-90/I-495 INTERCHANGE | 3 | NFP-I | $300,942,837 | $11,679,626 | $10,511,663 | $1,167,963 | ||
| Section 2C / State Prioritized Expansion Projects | $0 | $0 | $0 | |||||||||
| Bicycle and Pedestrian | $0 | $0 | $0 | |||||||||
| 2024 | 611982 | Boston Region | Medford | MEDFORD- SHARED USE PATH CONNECTION AT THE ROUTE 28/WELLINGTON UNDERPASS | 4 | CMAQ | $4,560,833 | $0 | $0 | $0 | ||
| Section 3B / Non-Federal Aid Funded | $129,623,164 | $0 | $129,623,164 | |||||||||
| Bridge On-system NHS | $90,404,329 | $0 | $90,404,329 | |||||||||
| 2024 | 606496 | Boston Region | Boston | BOSTON- BRIDGE REHABILITATION, B-16-052, BOWKER OVERPASS OVER MASS PIKE, MBTA/CSX, & IPSWICH STREET AND RAMPS (BINS 4FD, 4FG, 4FE, 4FF & 4FJ) | 6 | NGBP | $90,404,329 | $90,404,329 | $0 | $90,404,329 | ||
| Bridge On-system Non-NHS | $12,538,835 | $0 | $12,538,835 | |||||||||
| 2024 | 606901 | Boston Region | Boston | BOSTON- BRIDGE REPLACEMENT, B-16-109, RIVER STREET BRIDGE OVER MBTA/AMTRAK | 6 | NGBP | $12,538,835 | $12,538,835 | $0 | $12,538,835 | ||
| NFA | $26,680,000 | $0 | $26,680,000 | |||||||||
| 2024 | 607977 | Boston Region | Multiple | HOPKINTON- WESTBOROUGH- RECONSTRUCTION OF I-90/I-495 INTERCHANGE | 3 | NFA | $300,942,837 | $26,680,000 | $0 | $26,680,000 | ||
| STIP: 2024 - 2028 (D) | ||||||||||||
| Year | MassDOT Project ID | MPO | Municipality | MassDOT Project Description | District | Funding Source | Adjusted TFPC | Total Programmed Funds | Federal Funds | Non-Federal Funds | ||
| Federal Fiscal Year 2025 | $495,072,137 | $209,847,964 | $285,224,173 | |||||||||
| Section 1A / Regionally Prioritized Projects | $125,975,489 | $102,160,356 | $23,815,134 | |||||||||
| Roadway Reconstruction | $78,662,949 | $63,530,359 | $15,132,590 | |||||||||
| 2025 | 605168 | Boston Region | Hingham | HINGHAM- IMPROVEMENTS ON ROUTE 3A FROM OTIS STREET/COLE ROAD INCLUDING SUMMER STREET AND ROTARY; ROCKLAND STREET TO GEORGE WASHINGTON BOULEVARD. | 5 | STBG | $15,018,900 | $13,518,900 | $10,815,120 | $2,703,780 | ||
| 2025 | 605168 | Boston Region | Hingham | HINGHAM- IMPROVEMENTS ON ROUTE 3A FROM OTIS STREET/COLE ROAD INCLUDING SUMMER STREET AND ROTARY; ROCKLAND STREET TO GEORGE WASHINGTON BOULEVARD. | 5 | TAP | $15,018,900 | $1,500,000 | $1,200,000 | $300,000 | ||
| 2025 | 605743 | Boston Region | Ipswich | IPSWICH- RESURFACING & RELATED WORK ON CENTRAL & SOUTH MAIN STREETS | 4 | STBG | $11,728,698 | $0 | $0 | $0 | ||
| 2025 | 605743 | Boston Region | Ipswich | IPSWICH- RESURFACING & RELATED WORK ON CENTRAL & SOUTH MAIN STREETS | 4 | TAP | $11,728,698 | $0 | $0 | $0 | ||
| 2025 | 606226 | Boston Region | Boston | BOSTON- RECONSTRUCTION OF RUTHERFORD AVENUE, FROM CITY SQUARE TO SULLIVAN SQUARE | 6 | NHPP | $197,759,449 | $0 | $0 | $0 | ||
| 2025 | 606226 | Boston Region | Boston | BOSTON- RECONSTRUCTION OF RUTHERFORD AVENUE, FROM CITY SQUARE TO SULLIVAN SQUARE | 6 | STBG | $197,759,449 | $0 | $0 | $0 | ||
| 2025 | 606226 | Boston Region | Boston | BOSTON- RECONSTRUCTION OF RUTHERFORD AVENUE, FROM CITY SQUARE TO SULLIVAN SQUARE | 6 | TAP | $197,759,449 | $0 | $0 | $0 | ||
| 2025 | 606453 | Boston Region | Boston | BOSTON- IMPROVEMENTS ON BOYLSTON STREET, FROM INTERSECTION OF BROOKLINE AVENUE & PARK DRIVE TO IPSWICH STREET | 6 | CMAQ | $8,665,052 | $5,000,000 | $4,000,000 | $1,000,000 | ||
| 2025 | 606453 | Boston Region | Boston | BOSTON- IMPROVEMENTS ON BOYLSTON STREET, FROM INTERSECTION OF BROOKLINE AVENUE & PARK DRIVE TO IPSWICH STREET | 6 | STBG | $8,665,052 | $2,851,808 | $2,281,446 | $570,362 | ||
| 2025 | 606453 | Boston Region | Boston | BOSTON- IMPROVEMENTS ON BOYLSTON STREET, FROM INTERSECTION OF BROOKLINE AVENUE & PARK DRIVE TO IPSWICH STREET | 6 | TAP | $8,665,052 | $813,244 | $650,595 | $162,649 | ||
| 2025 | 608051 | Boston Region | Wilmington | WILMINGTON- RECONSTRUCTION ON ROUTE 38 (MAIN STREET), FROM ROUTE 62 TO THE WOBURN C.L. | 4 | CMAQ | $23,731,429 | $2,200,000 | $1,760,000 | $440,000 | ||
| 2025 | 608051 | Boston Region | Wilmington | WILMINGTON- RECONSTRUCTION ON ROUTE 38 (MAIN STREET), FROM ROUTE 62 TO THE WOBURN C.L. | 4 | HSIP | $23,731,429 | $1,000,000 | $900,000 | $100,000 | ||
| 2025 | 608051 | Boston Region | Wilmington | WILMINGTON- RECONSTRUCTION ON ROUTE 38 (MAIN STREET), FROM ROUTE 62 TO THE WOBURN C.L. | 4 | STBG | $23,731,429 | $20,531,429 | $16,425,143 | $4,106,286 | ||
| 2025 | 609252 | Boston Region | Lynn | LYNN- REHABILITATION OF ESSEX STREET | 4 | CMAQ | $19,698,640 | $10,500,000 | $8,400,000 | $2,100,000 | ||
| 2025 | 609252 | Boston Region | Lynn | LYNN- REHABILITATION OF ESSEX STREET | 4 | HSIP | $19,698,640 | $4,000,000 | $3,600,000 | $400,000 | ||
| 2025 | 609252 | Boston Region | Lynn | LYNN- REHABILITATION OF ESSEX STREET | 4 | STBG | $19,698,640 | $5,198,640 | $4,158,912 | $1,039,728 | ||
| 2025 | 609257 | Boston Region | Everett | EVERETT- RECONSTRUCTION OF BEACHAM STREET | 4 | HSIP | $10,548,928 | $1,000,000 | $900,000 | $100,000 | ||
| 2025 | 609257 | Boston Region | Everett | EVERETT- RECONSTRUCTION OF BEACHAM STREET | 4 | STBG | $10,548,928 | $7,648,928 | $6,119,142 | $1,529,786 | ||
| 2025 | 609257 | Boston Region | Everett | EVERETT- RECONSTRUCTION OF BEACHAM STREET | 4 | TAP | $10,548,928 | $1,900,000 | $1,520,000 | $380,000 | ||
| 2025 | S12820 | Boston Region | BIKESHARE SUPPORT SET ASIDE | STBG | $6,000,000 | $1,000,000 | $800,000 | $200,000 | ||||
| Intersection Improvements | $1,978,080 | $1,582,464 | $395,616 | |||||||||
| 2025 | 605857 | Boston Region | Norwood | NORWOOD- INTERSECTION IMPROVEMENTS @ ROUTE 1 & UNIVERSITY AVENUE/EVERETT STREET | 5 | CMAQ | $28,699,272 | $0 | $0 | $0 | ||
| 2025 | 605857 | Boston Region | Norwood | NORWOOD- INTERSECTION IMPROVEMENTS @ ROUTE 1 & UNIVERSITY AVENUE/EVERETT STREET | 5 | HSIP | $28,699,272 | $0 | $0 | $0 | ||
| 2025 | 605857 | Boston Region | Norwood | NORWOOD- INTERSECTION IMPROVEMENTS @ ROUTE 1 & UNIVERSITY AVENUE/EVERETT STREET | 5 | NHPP | $28,699,272 | $0 | $0 | $0 | ||
| 2025 | 605857 | Boston Region | Norwood | NORWOOD- INTERSECTION IMPROVEMENTS @ ROUTE 1 & UNIVERSITY AVENUE/EVERETT STREET | 5 | STBG | $28,699,272 | $0 | $0 | $0 | ||
| 2025 | 608067 | Boston Region | Woburn | WOBURN- INTERSECTION RECONSTRUCTION AT ROUTE 3 (CAMBRIDGE ROAD) & BEDFORD ROAD AND SOUTH BEDFORD STREET | 4 | CMAQ | $1,978,080 | $1,978,080 | $1,582,464 | $395,616 | ||
| Railroad Crossings | $742,315 | $742,315 | $0 | |||||||||
| 2025 | 608436 | Boston Region | ASHLAND- REHABILITATION AND RAIL CROSSING IMPROVEMENTS ON CHERRY STREET | 3 | RRHE | $1,222,315 | $742,315 | $742,315 | $0 | |||
| Safety Improvements | $6,315,013 | $5,683,512 | $631,501 | |||||||||
| 2025 | 609532 | Boston Region | Chelsea | CHELSEA- TARGETED SAFETY IMPROVEMENTS AND RELATED WORK ON BROADWAY, FROM WILLIAMS STREET TO CITY HALL AVENUE | 6 | HSIP | $6,315,013 | $6,315,013 | $5,683,512 | $631,501 | ||
| Bicycle and Pedestrian | $15,777,132 | $12,621,706 | $3,155,426 | |||||||||
| 2025 | 610544 | Boston Region | Peabody | PEABODY- MULTI-USE PATH CONSTRUCTION OF INDEPENDENCE GREENWAY AT I-95 AND ROUTE 1 | 4 | CMAQ | $15,777,132 | $5,500,000 | $4,400,000 | $1,100,000 | ||
| 2025 | 610544 | Boston Region | Peabody | PEABODY- MULTI-USE PATH CONSTRUCTION OF INDEPENDENCE GREENWAY AT I-95 AND ROUTE 1 | 4 | STBG | $15,777,132 | $7,277,132 | $5,821,706 | $1,455,426 | ||
| 2025 | 610544 | Boston Region | Peabody | PEABODY- MULTI-USE PATH CONSTRUCTION OF INDEPENDENCE GREENWAY AT I-95 AND ROUTE 1 | 4 | TAP | $15,777,132 | $3,000,000 | $2,400,000 | $600,000 | ||
| Flex to FTA | $16,913,405 | $13,530,724 | $3,382,681 | |||||||||
| 2025 | S12113 | Boston Region | TRANSIT MODERNIZATION PROGRAM | CMAQ | $21,500,000 | $2,000,000 | $1,600,000 | $400,000 | ||||
| 2025 | S12700 | Boston Region | Multiple | CATA ON DEMAND MICROTRANSIT SERVICE EXPANSION | 4 | CMAQ | $813,291 | $214,776 | $171,821 | $42,955 | ||
| 2025 | S12701 | Boston Region | Multiple | MWRTA CATCHCONNECT MICROTRANSIT SERVICE EXPANSION | 3 | CMAQ | $450,163 | $159,488 | $127,590 | $31,898 | ||
| 2025 | S12703 | Boston Region | Multiple | MONTACHUSETT RTA MICROTRANSIT SERVICE | 3 | CMAQ | $1,316,061 | $406,641 | $325,313 | $81,328 | ||
| 2025 | S12807 | Boston Region | Multiple | MWRTA CATCHCONNECT MICROTRANSIT EXPANSION PHASE 2 | 3 | CMAQ | $380,477 | $132,500 | $106,000 | $26,500 | ||
| 2025 | S12819 | Boston Region | Boston | JACKSON SQUARE STATION ACCESSIBILITY IMPROVEMENTS | 6 | CMAQ | $26,250,000 | $14,000,000 | $11,200,000 | $2,800,000 | ||
| Transit Grant Program | $1,586,595 | $1,269,276 | $317,319 | |||||||||
| 2025 | S12124 | Boston Region | Multiple | COMMUNITY CONNECTIONS PROGRAM | CMAQ | $8,334,827 | $942,804 | $754,243 | $188,561 | |||
| 2025 | S12694 | Boston Region | Newton | NEWMO MICROTRANSIT SERVICE EXPANSION | 6 | CMAQ | $890,574 | $209,663 | $167,730 | $41,933 | ||
| 2025 | S12697 | Boston Region | Watertown | PLEASANT STREET SHUTTLE SERVICE EXPANSION | 6 | CMAQ | $1,002,198 | $228,939 | $183,151 | $45,788 | ||
| 2025 | S12699 | Boston Region | Stoneham | STONEHAM SHUTTLE SERVICE | 4 | CMAQ | $796,817 | $205,189 | $164,151 | $41,038 | ||
| Roadway Improvements | $4,000,000 | $3,200,000 | $800,000 | |||||||||
| 2025 | S12825 | Boston Region | Multiple | BOSTON MPO REGION - FFY2025 PROJECT DESIGN PILOT | Multiple | STBG | $4,000,000 | $4,000,000 | $3,200,000 | $800,000 | ||
| Section 1B / Earmark or Discretionary Grant Funded Projects | $34,984,926 | $28,083,941 | $6,900,985 | |||||||||
| Earmark Discretionary | $30,480,000 | $24,480,000 | $6,000,000 | |||||||||
| 2025 | 607977 | Boston Region | Multiple | HOPKINTON- WESTBOROUGH- RECONSTRUCTION OF I-90/I-495 INTERCHANGE | 3 | HIP | $300,942,837 | $0 | $0 | $0 | ||
| 2025 | 607977 | Boston Region | Multiple | HOPKINTON- WESTBOROUGH- RECONSTRUCTION OF I-90/I-495 INTERCHANGE | 3 | HIP-BR | $300,942,837 | $30,000,000 | $24,000,000 | $6,000,000 | ||
| 2025 | 608436 | Boston Region | ASHLAND- REHABILITATION AND RAIL CROSSING IMPROVEMENTS ON CHERRY STREET | 3 | HPP-100 | $1,222,315 | $480,000 | $480,000 | $0 | |||
| Bridge On-system Non-NHS NB | $4,504,926 | $3,603,941 | $900,985 | |||||||||
| 2025 | 608197 | Boston Region | Boston | BOSTON- BRIDGE REHABILITATION, B-16-107, CANTERBURY STREET OVER AMTRAK RAILROAD | 6 | HIP-BR | $4,504,926 | $4,504,926 | $3,603,941 | $900,985 | ||
| Section 2A / State Prioritized Reliability Projects | $159,642,391 | $43,187,022 | $116,455,369 | |||||||||
| Bridge On-system NHS | $81,232,390 | $23,120,374 | $58,112,016 | |||||||||
| 2025 | 604564 | Boston Region | Maynard | MAYNARD- BRIDGE REPLACEMENT, M-10-004, ROUTE 62 (MAIN STREET) OVER THE ASSABET RIVER | 3 | NGBP | $6,036,680 | $6,036,680 | $0 | $6,036,680 | ||
| 2025 | 607684 | Boston Region | Braintree | BRAINTREE- BRIDGE REPLACEMENT, B-21-017, WASHINGTON STREET (ST 37) OVER MBTA/CSX RAILROAD | 6 | NGBP | $7,695,470 | $7,695,470 | $0 | $7,695,470 | ||
| 2025 | 608703 | Boston Region | Wilmington | WILMINGTON- BRIDGE REPLACEMENT, W-38-029 (2KV), ST 129 LOWELL STREET OVER I 93 | 4 | NHPP-PEN | $16,592,888 | $16,592,888 | $13,274,310 | $3,318,578 | ||
| 2025 | 610776 | Boston Region | Cambridge | CAMBRIDGE- SUPERSTRUCTURE REPLACEMENT, C-01-031, US ROUTE 3/ROUTE 16/ROUTE 2 OVER MBTA REDLINE | 6 | NHPP-PEN | $6,604,208 | $6,604,208 | $5,283,366 | $1,320,842 | ||
| 2025 | 610782 | Boston Region | Multiple | DANVERS- MIDDLETON- BRIDGE REPLACEMENT, D-03-009=M-20-005, ANDOVER STREET (SR 114) OVER IPSWICH RIVER | 4 | NHPP-PEN | $5,703,371 | $5,703,371 | $4,562,697 | $1,140,674 | ||
| 2025 | 612028 | Boston Region | Stoneham | STONEHAM- DECK REPLACEMENT & SUPERSTRUCTURE REPAIRS, S-27-006 (2L2), (ST 28) FELLSWAY WEST OVER I-93 | 4 | NGBP | $3,120,000 | $3,120,000 | $0 | $3,120,000 | ||
| 2025 | 612182 | Boston Region | Newton | NEWTON- BRIDGE REPLACEMENT, N-12-040, BOYLSTON STREET OVER GREEN LINE D | 6 | NGBP | $15,206,778 | $15,206,778 | $0 | $15,206,778 | ||
| 2025 | 612184 | Boston Region | Revere | REVERE- BRIDGE REPLACEMENT, R-05-015, REVERE BEACH PARKWAY OVER BROADWAY | 4 | NGBP | $20,272,995 | $20,272,995 | $0 | $20,272,995 | ||
| Non-Interstate Pavement | $21,696,726 | $17,357,381 | $4,339,345 | |||||||||
| 2025 | 608498 | Boston Region | Multiple | QUINCY- WEYMOUTH- BRAINTREE- RESURFACING AND RELATED WORK ON ROUTE 53 | 6 | NHPP | $6,635,050 | $6,635,050 | $5,308,040 | $1,327,010 | ||
| 2025 | 609399 | Boston Region | Randolph | RANDOLPH- RESURFACING AND RELATED WORK ON ROUTE 28 | 6 | NHPP | $7,194,377 | $7,194,377 | $5,755,502 | $1,438,875 | ||
| 2025 | 610722 | Boston Region | Multiple | ACTON- BOXBOROUGH- LITTLETON- PAVEMENT PRESERVATION ROUTE 2 | 3 | NHPP | $7,867,299 | $7,867,299 | $6,293,839 | $1,573,460 | ||
| Bridge On-system Non-NHS | $53,326,690 | $0 | $53,326,690 | |||||||||
| 2025 | 608952 | Boston Region | Chelsea | CHELSEA- BRIDGE SUPERSTRUCTURE REPLACMENT C-09-013, WASHINGTON AVENUE, CARTER STREET & COUNTY ROAD/ROUTE 1 | 6 | NGBP | $20,438,134 | $20,438,134 | $0 | $20,438,134 | ||
| 2025 | 612173 | Boston Region | Bellingham | BELLINGHAM- BRIDGE REPLACEMENT, B-06-022, MAPLE STREET OVER I-495 | 3 | NGBP | $14,270,687 | $14,270,687 | $0 | $14,270,687 | ||
| 2025 | 612178 | Boston Region | Natick | NATICK- BRIDGE REPLACEMENT, N-03-010, SPEEN STREET OVER RR MBTA/CSX | 3 | NGBP | $6,722,582 | $6,722,582 | $0 | $6,722,582 | ||
| 2025 | 612196 | Boston Region | Braintree | BRAINTREE- BRIDGE REPLACEMENT, B-21-067, JW MAHER HIGHWAY OVER MONATIQUOT RIVER | 6 | NGBP | $11,895,287 | $11,895,287 | $0 | $11,895,287 | ||
| Bridge Off-system | $3,386,585 | $2,709,268 | $677,317 | |||||||||
| 2025 | 609467 | Boston Region | Multiple | HAMILTON- IPSWICH- SUPERSTRUCTURE REPLACEMENT, H-03-002=I-01-006, WINTHROP STREET OVER IPSWICH RIVER | 4 | STBG-BR-Off | $3,386,585 | $3,386,585 | $2,709,268 | $677,317 | ||
| Section 2B / State Prioritized Modernization Projects | $34,141,530 | $30,025,295 | $4,116,235 | |||||||||
| Intersection Improvements | $0 | $0 | $0 | |||||||||
| 2025 | 607342 | Boston Region | Milton | MILTON- INTERSECTION IMPROVEMENTS AT ROUTE 28 (RANDOLPH AVENUE) & CHICKATAWBUT ROAD | 6 | HSIP | $9,112,736 | $0 | $0 | $0 | ||
| Roadway Reconstruction | $30,619,271 | $27,207,488 | $3,411,783 | |||||||||
| 2025 | 607977 | Boston Region | Multiple | HOPKINTON- WESTBOROUGH- RECONSTRUCTION OF I-90/I-495 INTERCHANGE | 3 | NHPP-I | $300,942,837 | $9,000,000 | $8,100,000 | $900,000 | ||
| 2025 | 607977 | Boston Region | Multiple | HOPKINTON- WESTBOROUGH- RECONSTRUCTION OF I-90/I-495 INTERCHANGE | 3 | NFP-I | $300,942,837 | $18,120,711 | $16,308,640 | $1,812,071 | ||
| 2025 | 609516 | Boston Region | Burlington | BURLINGTON- IMPROVEMENTS AT I-95 (ROUTE 128)/ROUTE 3 INTERCHANGE | 4 | NHPP | $3,498,560 | $3,498,560 | $2,798,848 | $699,712 | ||
| Safe Routes to School | $3,522,259 | $2,817,807 | $704,452 | |||||||||
| 2025 | 609531 | Boston Region | Arlington | ARLINGTON- STRATTON SCHOOL IMPROVEMENTS (SRTS) | 4 | TAP | $1,302,209 | $1,302,209 | $1,041,767 | $260,442 | ||
| 2025 | 611997 | Boston Region | Newton | NEWTON- HORACE MANN ELEMENTARY SCHOOL IMPROVEMENTS (SRTS) | 6 | TAP | $861,238 | $861,237 | $688,990 | $172,247 | ||
| 2025 | 612001 | Boston Region | Medford | MEDFORD- MILTON FULLER ROBERTS ELEMENTARY SCHOOL (SRTS) | 4 | TAP | $1,020,484 | $1,020,484 | $816,387 | $204,097 | ||
| 2025 | 612100 | Boston Region | Revere | REVERE- IMPROVEMENTS AT BEACHMONT VETERANS ELEMENTARY (SRTS) | 4 | TAP | $338,329 | $338,329 | $270,663 | $67,666 | ||
| Section 2C / State Prioritized Expansion Projects | $7,989,188 | $6,391,350 | $1,597,838 | |||||||||
| Bicycle and Pedestrian | $7,989,188 | $6,391,350 | $1,597,838 | |||||||||
| 2025 | 610680 | Boston Region | Natick | NATICK- LAKE COCHITUATE PATH | 3 | CMAQ | $3,428,355 | $3,428,355 | $2,742,684 | $685,671 | ||
| 2025 | 611982 | Boston Region | Medford | MEDFORD- SHARED USE PATH CONNECTION AT THE ROUTE 28/WELLINGTON UNDERPASS | 4 | CMAQ | $4,560,833 | $4,560,833 | $3,648,666 | $912,167 | ||
| Section 3B / Non-Federal Aid Funded | $132,338,613 | $0 | $132,338,613 | |||||||||
| Bridge On-system NHS | $52,331,923 | $0 | $52,331,923 | |||||||||
| 2025 | 604564 | Boston Region | Maynard | MAYNARD- BRIDGE REPLACEMENT, M-10-004, ROUTE 62 (MAIN STREET) OVER THE ASSABET RIVER | 3 | NGBP | $6,036,680 | $6,036,680 | $0 | $6,036,680 | ||
| 2025 | 607684 | Boston Region | Braintree | BRAINTREE- BRIDGE REPLACEMENT, B-21-017, WASHINGTON STREET (ST 37) OVER MBTA/CSX RAILROAD | 6 | NGBP | $7,695,470 | $7,695,470 | $0 | $7,695,470 | ||
| 2025 | 612028 | Boston Region | Stoneham | STONEHAM- DECK REPLACEMENT & SUPERSTRUCTURE REPAIRS, S-27-006 (2L2), (ST 28) FELLSWAY WEST OVER I-93 | 4 | NGBP | $3,120,000 | $3,120,000 | $0 | $3,120,000 | ||
| 2025 | 612182 | Boston Region | Newton | NEWTON- BRIDGE REPLACEMENT, N-12-040, BOYLSTON STREET OVER GREEN LINE D | 6 | NGBP | $15,206,778 | $15,206,778 | $0 | $15,206,778 | ||
| 2025 | 612184 | Boston Region | Revere | REVERE- BRIDGE REPLACEMENT, R-05-015, REVERE BEACH PARKWAY OVER BROADWAY | 4 | NGBP | $20,272,995 | $20,272,995 | $0 | $20,272,995 | ||
| NFA | $26,680,000 | $0 | $26,680,000 | |||||||||
| 2025 | 607977 | Boston Region | Multiple | HOPKINTON- WESTBOROUGH- RECONSTRUCTION OF I-90/I-495 INTERCHANGE | 3 | NFA | $300,942,837 | $26,680,000 | $0 | $26,680,000 | ||
| Bridge On-system Non-NHS | $53,326,690 | $0 | $53,326,690 | |||||||||
| 2025 | 608952 | Boston Region | Chelsea | CHELSEA- BRIDGE SUPERSTRUCTURE REPLACMENT C-09-013, WASHINGTON AVENUE, CARTER STREET & COUNTY ROAD/ROUTE 1 | 6 | NGBP | $20,438,134 | $20,438,134 | $0 | $20,438,134 | ||
| 2025 | 612173 | Boston Region | Bellingham | BELLINGHAM- BRIDGE REPLACEMENT, B-06-022, MAPLE STREET OVER I-495 | 3 | NGBP | $14,270,687 | $14,270,687 | $0 | $14,270,687 | ||
| 2025 | 612178 | Boston Region | Natick | NATICK- BRIDGE REPLACEMENT, N-03-010, SPEEN STREET OVER RR MBTA/CSX | 3 | NGBP | $6,722,582 | $6,722,582 | $0 | $6,722,582 | ||
| 2025 | 612196 | Boston Region | Braintree | BRAINTREE- BRIDGE REPLACEMENT, B-21-067, JW MAHER HIGHWAY OVER MONATIQUOT RIVER | 6 | NGBP | $11,895,287 | $11,895,287 | $0 | $11,895,287 | ||
| STIP: 2024 - 2028 (D) | ||||||||||||
| Year | MassDOT Project ID | MPO | Municipality | MassDOT Project Description | District | Funding Source | Adjusted TFPC | Total Programmed Funds | Federal Funds | Non-Federal Funds | ||
| Federal Fiscal Year 2026 | $505,966,124 | $394,371,383 | $111,594,741 | |||||||||
| Section 1A / Regionally Prioritized Projects | $124,667,241 | $100,565,496 | $24,101,746 | |||||||||
| Roadway Reconstruction | $64,435,864 | $52,098,691 | $12,337,173 | |||||||||
| 2026 | 605743 | Boston Region | Ipswich | IPSWICH- RESURFACING & RELATED WORK ON CENTRAL & SOUTH MAIN STREETS | 4 | STBG | $11,728,698 | $4,971,338 | $3,977,070 | $994,268 | ||
| 2026 | 605743 | Boston Region | Ipswich | IPSWICH- RESURFACING & RELATED WORK ON CENTRAL & SOUTH MAIN STREETS | 4 | TAP | $11,728,698 | $730,738 | $584,590 | $146,148 | ||
| 2026 | 606226 | Boston Region | Boston | BOSTON- RECONSTRUCTION OF RUTHERFORD AVENUE, FROM CITY SQUARE TO SULLIVAN SQUARE | 6 | NHPP | $197,759,449 | $0 | $0 | $0 | ||
| 2026 | 606226 | Boston Region | Boston | BOSTON- RECONSTRUCTION OF RUTHERFORD AVENUE, FROM CITY SQUARE TO SULLIVAN SQUARE | 6 | STBG | $197,759,449 | $0 | $0 | $0 | ||
| 2026 | 606226 | Boston Region | Boston | BOSTON- RECONSTRUCTION OF RUTHERFORD AVENUE, FROM CITY SQUARE TO SULLIVAN SQUARE | 6 | TAP | $197,759,449 | $0 | $0 | $0 | ||
| 2026 | 608045 | Boston Region | Milford | MILFORD- REHABILITATION ON ROUTE 16, FROM ROUTE 109 TO BEAVER STREET | 3 | HSIP | $9,758,201 | $1,500,000 | $1,350,000 | $150,000 | ||
| 2026 | 608045 | Boston Region | Milford | MILFORD- REHABILITATION ON ROUTE 16, FROM ROUTE 109 TO BEAVER STREET | 3 | STBG | $9,758,201 | $8,258,201 | $6,606,561 | $1,651,640 | ||
| 2026 | 608954 | Boston Region | Weston | WESTON- RECONSTRUCTION ON ROUTE 30 | 6 | STBG | $16,420,119 | $11,420,119 | $9,136,095 | $2,284,024 | ||
| 2026 | 608954 | Boston Region | Weston | WESTON- RECONSTRUCTION ON ROUTE 30 | 6 | TAP | $16,420,119 | $5,000,000 | $4,000,000 | $1,000,000 | ||
| 2026 | 609437 | Boston Region | Multiple | SALEM- PEABODY- BOSTON STREET IMPROVEMENTS | 4 | STBG | $14,172,868 | $14,172,868 | $11,338,294 | $2,834,574 | ||
| 2026 | 610662 | Boston Region | Woburn | WOBURN- ROADWAY AND INTERSECTION IMPROVEMENTS AT WOBURN COMMON, ROUTE 38 (MAIN STREET), WINN STREET, PLEASANT STREET AND MONTVALE AVENUE | 4 | HSIP | $17,382,600 | $4,000,000 | $3,600,000 | $400,000 | ||
| 2026 | 610662 | Boston Region | Woburn | WOBURN- ROADWAY AND INTERSECTION IMPROVEMENTS AT WOBURN COMMON, ROUTE 38 (MAIN STREET), WINN STREET, PLEASANT STREET AND MONTVALE AVENUE | 4 | STBG | $17,382,600 | $13,382,600 | $10,706,080 | $2,676,520 | ||
| 2026 | S12820 | Boston Region | BIKESHARE SUPPORT SET ASIDE | STBG | $6,000,000 | $1,000,000 | $800,000 | $200,000 | ||||
| Intersection Improvements | $13,311,175 | $10,930,643 | $2,380,532 | |||||||||
| 2026 | 605857 | Boston Region | Norwood | NORWOOD- INTERSECTION IMPROVEMENTS @ ROUTE 1 & UNIVERSITY AVENUE/EVERETT STREET | 5 | CMAQ | $28,699,272 | $0 | $0 | $0 | ||
| 2026 | 605857 | Boston Region | Norwood | NORWOOD- INTERSECTION IMPROVEMENTS @ ROUTE 1 & UNIVERSITY AVENUE/EVERETT STREET | 5 | HSIP | $28,699,272 | $631,724 | $568,552 | $63,172 | ||
| 2026 | 605857 | Boston Region | Norwood | NORWOOD- INTERSECTION IMPROVEMENTS @ ROUTE 1 & UNIVERSITY AVENUE/EVERETT STREET | 5 | NHPP | $28,699,272 | $4,998,901 | $3,999,121 | $999,780 | ||
| 2026 | 605857 | Boston Region | Norwood | NORWOOD- INTERSECTION IMPROVEMENTS @ ROUTE 1 & UNIVERSITY AVENUE/EVERETT STREET | 5 | STBG | $28,699,272 | $5,495,247 | $4,396,198 | $1,099,049 | ||
| 2026 | 608940 | Boston Region | Weston | WESTON- INTERSECTION IMPROVEMENTS BOSTON POST ROAD (ROUTE 20) AT WELLESLEY STREET | 6 | HSIP | $2,185,303 | $2,185,303 | $1,966,773 | $218,530 | ||
| Bicycle and Pedestrian | $21,288,202 | $17,030,562 | $4,257,640 | |||||||||
| 2026 | 609204 | Boston Region | Belmont | BELMONT- COMMUNITY PATH, BELMONT COMPONENT OF THE MCRT (PHASE I) | 4 | CMAQ | $21,288,202 | $7,288,202 | $5,830,562 | $1,457,640 | ||
| 2026 | 609204 | Boston Region | Belmont | BELMONT- COMMUNITY PATH, BELMONT COMPONENT OF THE MCRT (PHASE I) | 4 | STBG | $21,288,202 | $9,000,000 | $7,200,000 | $1,800,000 | ||
| 2026 | 609204 | Boston Region | Belmont | BELMONT- COMMUNITY PATH, BELMONT COMPONENT OF THE MCRT (PHASE I) | 4 | TAP | $21,288,202 | $5,000,000 | $4,000,000 | $1,000,000 | ||
| Roadway Improvements | $1,400,000 | $1,120,000 | $280,000 | |||||||||
| 2026 | 612989 | Boston Region | Boston | BOSTON- BRIDGE PRESERVATION, B-16-066 (38D), CAMBRIDGE STREET OVER MBTA | 6 | CMAQ | $16,632,000 | $1,400,000 | $1,120,000 | $280,000 | ||
| Bridge On-system NHS | $15,232,000 | $12,185,600 | $3,046,400 | |||||||||
| 2026 | 612989 | Boston Region | Boston | BOSTON- BRIDGE PRESERVATION, B-16-066 (38D), CAMBRIDGE STREET OVER MBTA | 6 | NHPP-PEN | $16,632,000 | $15,232,000 | $12,185,600 | $3,046,400 | ||
| Flex to FTA | $6,607,977 | $5,286,382 | $1,321,595 | |||||||||
| 2026 | S12113 | Boston Region | TRANSIT MODERNIZATION PROGRAM | CMAQ | $21,500,000 | $6,500,000 | $5,200,000 | $1,300,000 | ||||
| 2026 | S12807 | Boston Region | Multiple | MWRTA CATCHCONNECT MICROTRANSIT EXPANSION PHASE 2 | 3 | CMAQ | $380,477 | $107,977 | $86,382 | $21,595 | ||
| Transit Grant Program | $2,392,023 | $1,913,618 | $478,405 | |||||||||
| 2026 | S12124 | Boston Region | Multiple | COMMUNITY CONNECTIONS PROGRAM | CMAQ | $8,334,827 | $2,392,023 | $1,913,618 | $478,405 | |||
| Section 1B / Earmark or Discretionary Grant Funded Projects | $206,088,967 | $165,499,525 | $40,589,442 | |||||||||
| Earmark Discretionary | $0 | $0 | $0 | |||||||||
| 2026 | 607977 | Boston Region | Multiple | HOPKINTON- WESTBOROUGH- RECONSTRUCTION OF I-90/I-495 INTERCHANGE | 3 | HIP | $300,942,837 | $0 | $0 | $0 | ||
| Bridge On-system Non-NHS NB | $6,947,208 | $5,557,766 | $1,389,442 | |||||||||
| 2026 | 612075 | Boston Region | Salem | SALEM- BRIDGE REPLACEMENT, S-01-024, JEFFERSON AVENUE OVER PARALLEL STREET | 4 | HIP-BR | $3,123,360 | $3,123,360 | $2,498,688 | $624,672 | ||
| 2026 | 612099 | Boston Region | ASHLAND- BRIDGE REPLACEMENT, A-14-006, CORDAVILLE ROAD OVER SUDBURY RIVER | 3 | HIP-BR | $3,823,848 | $3,823,848 | $3,059,078 | $764,770 | |||
| Bridge Off-system Local NB | $3,141,758 | $3,141,758 | $0 | |||||||||
| 2026 | 612076 | Boston Region | Topsfield | TOPSFIELD- BRIDGE REPLACEMENT, T-06-013, PERKINS ROW OVER MILE BROOK | 4 | BROFF | $3,141,758 | $3,141,758 | $3,141,758 | $0 | ||
| Bridge On-System NHS NB | $196,000,001 | $156,800,001 | $39,200,000 | |||||||||
| 2026 | 612496 | Boston Region | Somerville | SOMERVILLE- BRIDGE PRESERVATION, S-17-031, I-93 (NB & SB) FROM ROUTE 28 TO TEMPLE STREET (PHASE 2) | 4 | HIP-BR | $196,000,001 | $196,000,001 | $156,800,001 | $39,200,000 | ||
| Section 2A / State Prioritized Reliability Projects | $72,552,107 | $61,441,667 | $11,110,441 | |||||||||
| Bridge On-system NHS | $17,824,268 | $14,259,414 | $3,564,854 | |||||||||
| 2026 | 605321 | Boston Region | Norwood | NORWOOD- BRIDGE PRESERVATION, N-25-026, PROVIDENCE HIGHWAY (STATE ROUTE 1) OVER THE NEPONSET RIVER | 5 | NHPP-PEN | $3,460,268 | $3,460,268 | $2,768,214 | $692,054 | ||
| 2026 | 606449 | Boston Region | Cambridge | CAMBRIDGE- BRIDGE REPLACEMENT, C-01-008, FIRST STREET BRIDGE & C-01-040, LAND BOULEVARD/BROAD CANAL BRIDGE | 6 | NHPP-PEN | $14,364,000 | $14,364,000 | $11,491,200 | $2,872,800 | ||
| Safety Improvements | $21,175,209 | $18,725,548 | $2,449,661 | |||||||||
| 2026 | 610675 | Boston Region | Chelsea | CHELSEA- RECONSTRUCTION OF SPRUCE STREET, FROM EVERETT AVENUE TO WILLIAMS STREET | 6 | HSIP | $5,841,153 | $5,841,153 | $5,257,038 | $584,115 | ||
| 2026 | 611954 | Boston Region | Boston | BOSTON- GUIDE AND TRAFFIC SIGN REPLACEMENT ON I-90/I-93 WITHIN CENTRAL ARTERY/TUNNEL SYSTEM | 6 | HSIP | $2,423,736 | $2,423,736 | $2,181,362 | $242,374 | ||
| 2026 | 611974 | Boston Region | Medford | MEDFORD- INTERSECTION IMPROVEMENTS AT MAIN STREET/SOUTH STREET, MAIN STREET/MYSTIC VALLEY PARKWAY RAMPS, AND MAIN STREET/MYSTIC AVENUE | 4 | HSIP | $9,177,840 | $4,588,920 | $4,130,028 | $458,892 | ||
| 2026 | 612599 | Boston Region | Lynn | LYNN- TARGETED SAFETY AND MULTIMODAL IMPROVEMENTS (PLAYBOOK PRIORITY CORRIDORS) | 4 | HSIP | $8,321,400 | $5,000,000 | $4,500,000 | $500,000 | ||
| 2026 | 612599 | Boston Region | Lynn | LYNN- TARGETED SAFETY AND MULTIMODAL IMPROVEMENTS (PLAYBOOK PRIORITY CORRIDORS) | 4 | STBG | $8,321,400 | $3,321,400 | $2,657,120 | $664,280 | ||
| Non-Interstate Pavement | $17,406,630 | $13,925,304 | $3,481,326 | |||||||||
| 2026 | 612049 | Boston Region | Randolph | RANDOLPH- RESURFACING AND RELATED WORK ON ROUTE 24 | 6 | NHPP | $9,128,700 | $9,128,700 | $7,302,960 | $1,825,740 | ||
| 2026 | 612050 | Boston Region | Multiple | BRAINTREE- WEYMOUTH- RESURFACING AND RELATED WORK ON ROUTE 3 | 6 | NHPP | $8,277,930 | $8,277,930 | $6,622,344 | $1,655,586 | ||
| Interstate Pavement | $16,146,000 | $14,531,400 | $1,614,600 | |||||||||
| 2026 | 612051 | Boston Region | Multiple | CANTON- MILTON- RANDOLPH- INTERSTATE MAINTENANCE AND RELATED WORK ON I-93 | 6 | NHPP-I | $16,146,000 | $16,146,000 | $14,531,400 | $1,614,600 | ||
| Section 2B / State Prioritized Modernization Projects | $70,560,716 | $62,531,022 | $8,029,694 | |||||||||
| Roadway Reconstruction | $48,088,307 | $43,279,476 | $4,808,831 | |||||||||
| 2026 | 607977 | Boston Region | Multiple | HOPKINTON- WESTBOROUGH- RECONSTRUCTION OF I-90/I-495 INTERCHANGE | 3 | NHPP-I | $300,942,837 | $41,613,593 | $37,452,234 | $4,161,359 | ||
| 2026 | 607977 | Boston Region | Multiple | HOPKINTON- WESTBOROUGH- RECONSTRUCTION OF I-90/I-495 INTERCHANGE | 3 | NFP-I | $300,942,837 | $6,474,714 | $5,827,243 | $647,471 | ||
| Intersection Improvements | $12,736,182 | $11,462,564 | $1,273,618 | |||||||||
| 2026 | 608564 | Boston Region | Watertown | WATERTOWN- INTERSECTION IMPROVEMENTS AT ROUTE 16 AND GALEN STREET | 6 | HSIP | $3,449,261 | $3,449,261 | $3,104,335 | $344,926 | ||
| 2026 | 610665 | Boston Region | Stoneham | STONEHAM- INTERSECTION IMPROVEMENTS AT ROUTE 28 (MAIN STREET), NORTH BORDER ROAD AND SOUTH STREET | 4 | HSIP | $4,698,001 | $4,698,001 | $4,228,201 | $469,800 | ||
| 2026 | 611974 | Boston Region | Medford | MEDFORD- INTERSECTION IMPROVEMENTS AT MAIN STREET/SOUTH STREET, MAIN STREET/MYSTIC VALLEY PARKWAY RAMPS, AND MAIN STREET/MYSTIC AVENUE | 4 | HSIP | $9,177,840 | $4,588,920 | $4,130,028 | $458,892 | ||
| Safe Routes to School | $9,736,227 | $7,788,982 | $1,947,245 | |||||||||
| 2026 | 610537 | Boston Region | Boston | BOSTON- ELLIS ELEMENTARY TRAFFIC CALMING (SRTS) | 6 | TAP | $2,737,728 | $2,737,728 | $2,190,182 | $547,546 | ||
| 2026 | 612804 | Boston Region | Dedham | DEDHAM- IMPROVEMENTS AT AVERY ELEMENTARY (SRTS) | 6 | TAP | $1,626,334 | $1,626,334 | $1,301,067 | $325,267 | ||
| 2026 | 612816 | Boston Region | Brookline | BROOKLINE- IMPROVEMENTS AT WILLIAM H. LINCOLN SCHOOL (SRTS) | 6 | TAP | $886,526 | $886,526 | $709,221 | $177,305 | ||
| 2026 | 612884 | Boston Region | Chelsea | CHELSEA- IMPROVEMENTS AT MARY C. BURKE ELEMENTARY (SRTS) | 6 | TAP | $1,617,667 | $1,617,667 | $1,294,134 | $323,533 | ||
| 2026 | 612889 | Boston Region | Sharon | SHARON- COTTAGE STREET SCHOOL IMPROVEMENTS (SRTS) | 5 | TAP | $1,497,906 | $1,497,906 | $1,198,325 | $299,581 | ||
| 2026 | 612894 | Boston Region | Framingham | FRAMINGHAM- IMPROVEMENTS AT HARMONY GROVE ELEMENTARY SCHOOL (SRTS) | 3 | TAP | $1,370,066 | $1,370,066 | $1,096,053 | $274,013 | ||
| Section 2C / State Prioritized Expansion Projects | $5,417,093 | $4,333,674 | $1,083,419 | |||||||||
| Bicycle and Pedestrian | $5,417,093 | $4,333,674 | $1,083,419 | |||||||||
| 2026 | 612523 | Boston Region | Revere | REVERE- STATE ROAD BEACHMONT CONNECTOR | 4 | CMAQ | $5,417,093 | $5,417,093 | $4,333,674 | $1,083,419 | ||
| Section 3B / Non-Federal Aid Funded | $26,680,000 | $0 | $26,680,000 | |||||||||
| NFA | $26,680,000 | $0 | $26,680,000 | |||||||||
| 2026 | 607977 | Boston Region | Multiple | HOPKINTON- WESTBOROUGH- RECONSTRUCTION OF I-90/I-495 INTERCHANGE | 3 | NFA | $300,942,837 | $26,680,000 | $0 | $26,680,000 | ||
| STIP: 2024 - 2028 (D) | ||||||||||||
| Year | MassDOT Project ID | MPO | Municipality | MassDOT Project Description | District | Funding Source | Adjusted TFPC | Total Programmed Funds | Federal Funds | Non-Federal Funds | ||
| Federal Fiscal Year 2027 | $622,136,812 | $282,978,807 | $339,158,005 | |||||||||
| Section 1A / Regionally Prioritized Projects | $144,006,044 | $116,629,527 | $27,376,517 | |||||||||
| Roadway Reconstruction | $94,327,597 | $76,362,078 | $17,965,519 | |||||||||
| 2027 | 605743 | Boston Region | Ipswich | IPSWICH- RESURFACING & RELATED WORK ON CENTRAL & SOUTH MAIN STREETS | 4 | STBG | $11,728,698 | $6,026,622 | $4,821,298 | $1,205,324 | ||
| 2027 | 606226 | Boston Region | Boston | BOSTON- RECONSTRUCTION OF RUTHERFORD AVENUE, FROM CITY SQUARE TO SULLIVAN SQUARE | 6 | NHPP | $197,759,449 | $8,600,000 | $6,880,000 | $1,720,000 | ||
| 2027 | 606226 | Boston Region | Boston | BOSTON- RECONSTRUCTION OF RUTHERFORD AVENUE, FROM CITY SQUARE TO SULLIVAN SQUARE | 6 | STBG | $197,759,449 | $0 | $0 | $0 | ||
| 2027 | 606226 | Boston Region | Boston | BOSTON- RECONSTRUCTION OF RUTHERFORD AVENUE, FROM CITY SQUARE TO SULLIVAN SQUARE | 6 | TAP | $197,759,449 | $0 | $0 | $0 | ||
| 2027 | 607981 | Boston Region | Somerville | SOMERVILLE- MCGRATH BOULEVARD CONSTRUCTION | 4 | STBG | $98,840,000 | $20,000,000 | $16,000,000 | $4,000,000 | ||
| 2027 | 607981 | Boston Region | Somerville | SOMERVILLE- MCGRATH BOULEVARD CONSTRUCTION | 4 | TAP | $98,840,000 | $2,000,000 | $1,600,000 | $400,000 | ||
| 2027 | 609246 | Boston Region | Lynn | LYNN- REHABILITATION OF WESTERN AVENUE (ROUTE 107) | 4 | HSIP | $45,897,600 | $3,000,000 | $2,700,000 | $300,000 | ||
| 2027 | 609246 | Boston Region | Lynn | LYNN- REHABILITATION OF WESTERN AVENUE (ROUTE 107) | 4 | STBG | $45,897,600 | $12,000,000 | $9,600,000 | $2,400,000 | ||
| 2027 | 610932 | Boston Region | Brookline | BROOKLINE- REHABILITATION OF WASHINGTON STREET | 6 | HSIP | $28,995,267 | $5,000,000 | $4,500,000 | $500,000 | ||
| 2027 | 610932 | Boston Region | Brookline | BROOKLINE- REHABILITATION OF WASHINGTON STREET | 6 | STBG | $28,995,267 | $23,995,267 | $19,196,214 | $4,799,053 | ||
| 2027 | 611983 | Boston Region | Chelsea | CHELSEA- PARK STREET & PEARL STREET RECONSTRUCTION | 6 | HSIP | $11,705,708 | $1,000,000 | $900,000 | $100,000 | ||
| 2027 | 611983 | Boston Region | Chelsea | CHELSEA- PARK STREET & PEARL STREET RECONSTRUCTION | 6 | STBG | $11,705,708 | $10,705,708 | $8,564,566 | $2,141,142 | ||
| 2027 | S12820 | Boston Region | BIKESHARE SUPPORT SET ASIDE | STBG | $6,000,000 | $2,000,000 | $1,600,000 | $400,000 | ||||
| Intersection Improvements | $17,573,400 | $14,058,720 | $3,514,680 | |||||||||
| 2027 | 605857 | Boston Region | Norwood | NORWOOD- INTERSECTION IMPROVEMENTS @ ROUTE 1 & UNIVERSITY AVENUE/EVERETT STREET | 5 | CMAQ | $28,699,272 | $3,000,000 | $2,400,000 | $600,000 | ||
| 2027 | 605857 | Boston Region | Norwood | NORWOOD- INTERSECTION IMPROVEMENTS @ ROUTE 1 & UNIVERSITY AVENUE/EVERETT STREET | 5 | NHPP | $28,699,272 | $3,573,400 | $2,858,720 | $714,680 | ||
| 2027 | 605857 | Boston Region | Norwood | NORWOOD- INTERSECTION IMPROVEMENTS @ ROUTE 1 & UNIVERSITY AVENUE/EVERETT STREET | 5 | STBG | $28,699,272 | $11,000,000 | $8,800,000 | $2,200,000 | ||
| Roadway Improvements | $13,000,000 | $10,400,000 | $2,600,000 | |||||||||
| 2027 | 607981 | Boston Region | Somerville | SOMERVILLE- MCGRATH BOULEVARD CONSTRUCTION | 4 | NHPP | $98,840,000 | $13,000,000 | $10,400,000 | $2,600,000 | ||
| Bicycle and Pedestrian | $4,858,127 | $3,886,502 | $971,625 | |||||||||
| 2027 | 613088 | Boston Region | Malden | MALDEN- SPOT POND BROOK GREENWAY | 4 | CMAQ | $4,858,127 | $3,000,000 | $2,400,000 | $600,000 | ||
| 2027 | 613088 | Boston Region | Malden | MALDEN- SPOT POND BROOK GREENWAY | 4 | TAP | $4,858,127 | $1,858,127 | $1,486,502 | $371,625 | ||
| Safety Improvements | $5,246,920 | $4,722,228 | $524,692 | |||||||||
| 2027 | 613121 | Boston Region | Everett | EVERETT- TARGETED MULTI-MODAL AND SAFETY IMPROVEMENTS ON ROUTE 16 (DESIGN ONLY) | 4 | HSIP | $5,246,920 | $5,246,920 | $4,722,228 | $524,692 | ||
| Flex to FTA | $6,500,000 | $5,200,000 | $1,300,000 | |||||||||
| 2027 | S12113 | Boston Region | TRANSIT MODERNIZATION PROGRAM | CMAQ | $21,500,000 | $6,500,000 | $5,200,000 | $1,300,000 | ||||
| Transit Grant Program | $2,500,000 | $2,000,000 | $500,000 | |||||||||
| 2027 | S12124 | Boston Region | Multiple | COMMUNITY CONNECTIONS PROGRAM | CMAQ | $8,334,827 | $2,500,000 | $2,000,000 | $500,000 | |||
| Section 2A / State Prioritized Reliability Projects | $241,511,844 | $82,877,514 | $158,634,330 | |||||||||
| Bridge On-system Non-NHS | $138,719,952 | $0 | $138,719,952 | |||||||||
| 2027 | 605276 | Boston Region | Multiple | BEVERLY- SALEM- DRAWBRIDGE REPLACEMENT/REHABILITATION OF B-11-005=S-01-013, KERNWOOD AVENUE OVER DANVERS RIVER | 4 | NGBP | $92,094,352 | $92,094,352 | $0 | $92,094,352 | ||
| 2027 | 607420 | Boston Region | Natick | NATICK- SUPERSTRUCTURE REPLACEMENT, N-03-012, BODEN LANE OVER CSX/MBTA | 3 | NGBP | $7,985,600 | $7,985,600 | $0 | $7,985,600 | ||
| 2027 | 608514 | Boston Region | Beverly | BEVERLY- BRIDGE REPLACEMENT, B-11-001, BRIDGE STREET OVER BASS RIVER (HALL-WHITAKER DRAWBRIDGE) | 4 | NGBP | $38,640,000 | $38,640,000 | $0 | $38,640,000 | ||
| Bridge On-system NHS | $96,351,892 | $77,081,514 | $19,270,378 | |||||||||
| 2027 | 606728 | Boston Region | Boston | BOSTON- BRIDGE REPLACEMENT B-16-365, STORROW DRIVE OVER BOWKER RAMPS | 6 | NHPP-PEN | $112,056,000 | $10,477,205 | $8,381,764 | $2,095,441 | ||
| 2027 | 611987 | Boston Region | Cambridge | CAMBRIDGE- BRIDGE REPLACEMENT, C-01-026, MEMORIAL DRIVE OVER BROOKLINE STREET | 6 | NHPP | $51,108,646 | $51,108,646 | $40,886,917 | $10,221,729 | ||
| 2027 | 612519 | Boston Region | Boston | BOSTON- BRIDGE REPLACEMENT, B-16-165, BLUE HILL AVENUE OVER RAILROAD | 6 | NHPP-PEN | $34,766,041 | $34,766,041 | $27,812,833 | $6,953,208 | ||
| Non-Interstate Pavement | $0 | $0 | $0 | |||||||||
| 2027 | 609402 | Boston Region | Multiple | FRAMINGHAM- NATICK- RESURFACING AND RELATED WORK ON ROUTE 9 | 3 | NHPP | $48,665,364 | $0 | $0 | $0 | ||
| Safety Improvements | $6,440,000 | $5,796,000 | $644,000 | |||||||||
| 2027 | 610650 | Boston Region | Boston | BOSTON- SAFETY IMPROVEMENTS ON GALLIVAN BOULEVARD (ROUTE 203), FROM WASHINGTON STREET TO GRANITE AVENUE | 6 | HSIP | $6,440,000 | $6,440,000 | $5,796,000 | $644,000 | ||
| 2027 | 612599 | Boston Region | Lynn | LYNN- TARGETED SAFETY AND MULTIMODAL IMPROVEMENTS (PLAYBOOK PRIORITY CORRIDORS) | 4 | HSIP | $8,321,400 | $0 | $0 | $0 | ||
| 2027 | 612599 | Boston Region | Lynn | LYNN- TARGETED SAFETY AND MULTIMODAL IMPROVEMENTS (PLAYBOOK PRIORITY CORRIDORS) | 4 | STBG | $8,321,400 | $0 | $0 | $0 | ||
| Interstate Pavement | $0 | $0 | $0 | |||||||||
| 2027 | 612033 | Boston Region | Lynnfield | LYNNFIELD- PEABODY- INTERSTATE MAINTENANCE AND RELATED WORK ON I-95 | 4 | NHPP-I | $8,575,451 | $0 | $0 | $0 | ||
| Section 2B / State Prioritized Modernization Projects | $75,333,816 | $65,419,642 | $9,914,175 | |||||||||
| Roadway Reconstruction | $63,007,343 | $54,763,028 | $8,244,315 | |||||||||
| 2027 | 607977 | Boston Region | Multiple | HOPKINTON- WESTBOROUGH- RECONSTRUCTION OF I-90/I-495 INTERCHANGE | 3 | NHPP-I | $300,942,837 | $17,928,463 | $16,135,617 | $1,792,846 | ||
| 2027 | 607977 | Boston Region | Multiple | HOPKINTON- WESTBOROUGH- RECONSTRUCTION OF I-90/I-495 INTERCHANGE | 3 | NFP-I | $300,942,837 | $25,643,072 | $23,078,765 | $2,564,307 | ||
| 2027 | 612615 | Boston Region | Multiple | CANTON- MILTON- ROADWAY RECONSTRUCTION ON ROUTE 138, FROM ROYALL STREET TO DOLLAR LANE | 6 | NHPP | $19,435,808 | $19,435,808 | $15,548,646 | $3,887,162 | ||
| Intersection Improvements | $7,954,352 | $7,158,917 | $795,435 | |||||||||
| 2027 | 612613 | Boston Region | Newton | NEWTON- INTERSECTION IMPROVEMENTS AT ROUTE 16 AND QUINOBEQUIN ROAD | 6 | HSIP | $4,872,000 | $4,872,000 | $4,384,800 | $487,200 | ||
| 2027 | 612616 | Boston Region | Milton | MILTON- INTERSECTION IMPROVEMENTS AT ROUTE 138 AND BRADLEE ROAD | 6 | HSIP | $3,082,352 | $3,082,352 | $2,774,117 | $308,235 | ||
| Safe Routes to School | $4,372,121 | $3,497,697 | $874,424 | |||||||||
| 2027 | S12793 | Boston Region | Holliston-Linden Street | TAP | $617,187 | $617,187 | $493,750 | $123,437 | ||||
| 2027 | S12795 | Boston Region | Newton-Parker | TAP | $1,456,000 | $1,456,000 | $1,164,800 | $291,200 | ||||
| 2027 | S12796 | Boston Region | Reading-Oakland Rd / Hillside Rd / Birch Meadow Drive-Coolidge Middle School | TAP | $2,298,934 | $2,298,934 | $1,839,147 | $459,787 | ||||
| Section 2C / State Prioritized Expansion Projects | $22,565,156 | $18,052,125 | $4,513,031 | |||||||||
| Bicycle and Pedestrian | $22,565,156 | $18,052,125 | $4,513,031 | |||||||||
| 2027 | 607329 | Boston Region | Multiple | WAKEFIELD- LYNNFIELD- RAIL TRAIL EXTENSION, FROM THE GALVIN MIDDLE SCHOOL TO LYNNFIELD/PEABODY T.L. | 4 | CMAQ | $24,543,047 | $10,600,000 | $8,480,000 | $2,120,000 | ||
| 2027 | 610660 | Boston Region | Multiple | SUDBURY- WAYLAND- MASS CENTRAL RAIL TRAIL (MCRT) | 3 | CMAQ | $4,061,413 | $4,061,413 | $3,249,130 | $812,283 | ||
| 2027 | 612499 | Boston Region | Medford | MEDFORD- SOUTH MEDFORD CONNECTOR BIKE PATH | 4 | CMAQ | $7,903,743 | $7,903,743 | $6,322,994 | $1,580,749 | ||
| Section 3B / Non-Federal Aid Funded | $138,719,952 | $0 | $138,719,952 | |||||||||
| Bridge On-system Non-NHS | $138,719,952 | $0 | $138,719,952 | |||||||||
| 2027 | 605276 | Boston Region | Multiple | BEVERLY- SALEM- DRAWBRIDGE REPLACEMENT/REHABILITATION OF B-11-005=S-01-013, KERNWOOD AVENUE OVER DANVERS RIVER | 4 | NGBP | $92,094,352 | $92,094,352 | $0 | $92,094,352 | ||
| 2027 | 607420 | Boston Region | Natick | NATICK- SUPERSTRUCTURE REPLACEMENT, N-03-012, BODEN LANE OVER CSX/MBTA | 3 | NGBP | $7,985,600 | $7,985,600 | $0 | $7,985,600 | ||
| 2027 | 608514 | Boston Region | Beverly | BEVERLY- BRIDGE REPLACEMENT, B-11-001, BRIDGE STREET OVER BASS RIVER (HALL-WHITAKER DRAWBRIDGE) | 4 | NGBP | $38,640,000 | $38,640,000 | $0 | $38,640,000 | ||
| STIP: 2024 - 2028 (D) | ||||||||||||
| Year | MassDOT Project ID | MPO | Municipality | MassDOT Project Description | District | Funding Source | Adjusted TFPC | Total Programmed Funds | Federal Funds | Non-Federal Funds | ||
| Federal Fiscal Year 2028 | $500,800,259 | $403,559,552 | $97,240,707 | |||||||||
| Section 1A / Regionally Prioritized Projects | $149,868,526 | $120,394,821 | $29,473,705 | |||||||||
| Roadway Reconstruction | $124,176,075 | $99,840,860 | $24,335,215 | |||||||||
| 2028 | 606226 | Boston Region | Boston | BOSTON- RECONSTRUCTION OF RUTHERFORD AVENUE, FROM CITY SQUARE TO SULLIVAN SQUARE | 6 | NHPP | $197,759,449 | $12,000,000 | $9,600,000 | $2,400,000 | ||
| 2028 | 606226 | Boston Region | Boston | BOSTON- RECONSTRUCTION OF RUTHERFORD AVENUE, FROM CITY SQUARE TO SULLIVAN SQUARE | 6 | STBG | $197,759,449 | $19,500,000 | $15,600,000 | $3,900,000 | ||
| 2028 | 606226 | Boston Region | Boston | BOSTON- RECONSTRUCTION OF RUTHERFORD AVENUE, FROM CITY SQUARE TO SULLIVAN SQUARE | 6 | TAP | $197,759,449 | $2,000,000 | $1,600,000 | $400,000 | ||
| 2028 | 607981 | Boston Region | Somerville | SOMERVILLE- MCGRATH BOULEVARD CONSTRUCTION | 4 | STBG | $98,840,000 | $30,000,000 | $24,000,000 | $6,000,000 | ||
| 2028 | 609246 | Boston Region | Lynn | LYNN- REHABILITATION OF WESTERN AVENUE (ROUTE 107) | 4 | HSIP | $45,897,600 | $5,000,000 | $4,500,000 | $500,000 | ||
| 2028 | 609246 | Boston Region | Lynn | LYNN- REHABILITATION OF WESTERN AVENUE (ROUTE 107) | 4 | STBG | $45,897,600 | $15,000,000 | $12,000,000 | $3,000,000 | ||
| 2028 | S12820 | Boston Region | BIKESHARE SUPPORT SET ASIDE | STBG | $6,000,000 | $2,000,000 | $1,600,000 | $400,000 | ||||
| 2028 | S12826 | Boston Region | Multiple | WESTWOOD- NORWOOD- RECONSTRUCTION OF CANTON STREET TO UNIVERSITY DRIVE, INCLUDING REHAB OF N-25-032=W-31-018 | 6 | CMAQ | $22,094,875 | $4,000,000 | $3,200,000 | $800,000 | ||
| 2028 | S12826 | Boston Region | Multiple | WESTWOOD- NORWOOD- RECONSTRUCTION OF CANTON STREET TO UNIVERSITY DRIVE, INCLUDING REHAB OF N-25-032=W-31-018 | 6 | STBG | $22,094,875 | $18,094,875 | $14,475,900 | $3,618,975 | ||
| 2028 | S12827 | Boston Region | Wakefield | WAKEFIELD - MAIN STREET CORRIDOR IMPROVEMENT PROJECT | 4 | CMAQ | $16,581,200 | $8,000,000 | $6,400,000 | $1,600,000 | ||
| 2028 | S12827 | Boston Region | Wakefield | WAKEFIELD - MAIN STREET CORRIDOR IMPROVEMENT PROJECT | 4 | STBG | $16,581,200 | $7,081,200 | $5,664,960 | $1,416,240 | ||
| 2028 | S12827 | Boston Region | Wakefield | WAKEFIELD - MAIN STREET CORRIDOR IMPROVEMENT PROJECT | 4 | TAP | $16,581,200 | $1,500,000 | $1,200,000 | $300,000 | ||
| Bicycle and Pedestrian | $16,692,451 | $13,353,961 | $3,338,490 | |||||||||
| 2028 | 610666 | Boston Region | Swampscott | SWAMPSCOTT- RAIL TRAIL CONSTRUCTION | 4 | CMAQ | $8,932,000 | $7,300,000 | $5,840,000 | $1,460,000 | ||
| 2028 | 610666 | Boston Region | Swampscott | SWAMPSCOTT- RAIL TRAIL CONSTRUCTION | 4 | TAP | $8,932,000 | $1,632,000 | $1,305,600 | $326,400 | ||
| 2028 | 610691 | Boston Region | Natick | NATICK- COCHITUATE RAIL TRAIL EXTENSION, FROM MBTA STATION TO MECHANIC STREET | 3 | STBG | $7,760,451 | $7,760,451 | $6,208,361 | $1,552,090 | ||
| Flex to FTA | $6,500,000 | $5,200,000 | $1,300,000 | |||||||||
| 2028 | S12113 | Boston Region | TRANSIT MODERNIZATION PROGRAM | CMAQ | $21,500,000 | $6,500,000 | $5,200,000 | $1,300,000 | ||||
| Transit Grant Program | $2,500,000 | $2,000,000 | $500,000 | |||||||||
| 2028 | S12124 | Boston Region | Multiple | COMMUNITY CONNECTIONS PROGRAM | CMAQ | $8,334,827 | $2,500,000 | $2,000,000 | $500,000 | |||
| Section 1B / Earmark or Discretionary Grant Funded Projects | $64,960,000 | $51,968,000 | $12,992,000 | |||||||||
| Bridge On-system Non-NHS NB | $64,960,000 | $51,968,000 | $12,992,000 | |||||||||
| 2028 | 608397 | Boston Region | Gloucester | GLOUCESTER- BRIDGE RECONSTRUCTION, G-05-002, WESTERN AVENUE OVER BLYNMAN CANAL | 4 | HIP-BR | $64,960,000 | $64,960,000 | $51,968,000 | $12,992,000 | ||
| Section 2A / State Prioritized Reliability Projects | $234,431,079 | $189,640,644 | $44,790,435 | |||||||||
| Bridge On-system NHS | $152,275,425 | $121,820,340 | $30,455,085 | |||||||||
| 2028 | 606728 | Boston Region | Boston | BOSTON- BRIDGE REPLACEMENT B-16-365, STORROW DRIVE OVER BOWKER RAMPS | 6 | NHPP-PEN | $112,056,000 | $40,075,975 | $32,060,780 | $8,015,195 | ||
| 2028 | 608396 | Boston Region | Multiple | LYNN- REVERE- BRIDGE RECONSTRUCTION, L-18-015=R-05-008, ROUTE 1A OVER SAUGUS RIVER | 4 | NHPP | $105,560,000 | $54,185,724 | $43,348,579 | $10,837,145 | ||
| 2028 | 613124 | Boston Region | Boston | BOSTON- DECK/SUPERSTRUCTURE REPLACEMENT, B-16-054 (4T2), BEACON STREET OVER I-90 (STRUCTURE 50, MILE 132.2) | 6 | NHPP-PEN | $42,295,604 | $42,295,604 | $33,836,483 | $8,459,121 | ||
| 2028 | 613125 | Boston Region | Boston | BOSTON- DECK/SUPERSTRUCTURE REPLACEMENT OF BRIDGE B-16-051(4T5), MASS AVENUE OVER I-90 & MBTA (STRUCTURE 54, MILE 132.84) | 6 | NHPP-PEN | $15,718,122 | $15,718,122 | $12,574,498 | $3,143,624 | ||
| Safety Improvements | $16,183,809 | $13,312,180 | $2,871,629 | |||||||||
| 2028 | 607748 | Boston Region | Acton | ACTON- INTERSECTION & SIGNAL IMPROVEMENTS ON SR 2 & SR 111 (MASSACHUSETTS AVENUE) AT PIPER ROAD & TAYLOR ROAD | 3 | HSIP | $4,382,329 | $3,651,329 | $3,286,196 | $365,133 | ||
| 2028 | 611969 | Boston Region | Everett | EVERETT- INTERSECTION IMPROVEMENTS ON ROUTE 16 | 4 | NHPP | $17,748,000 | $12,532,480 | $10,025,984 | $2,506,496 | ||
| Non-Interstate Pavement | $48,665,364 | $38,932,291 | $9,733,073 | |||||||||
| 2028 | 609402 | Boston Region | Multiple | FRAMINGHAM- NATICK- RESURFACING AND RELATED WORK ON ROUTE 9 | 3 | NHPP | $48,665,364 | $48,665,364 | $38,932,291 | $9,733,073 | ||
| Interstate Pavement | $17,306,481 | $15,575,833 | $1,730,648 | |||||||||
| 2028 | 612033 | Boston Region | Lynnfield | LYNNFIELD- PEABODY- INTERSTATE MAINTENANCE AND RELATED WORK ON I-95 | 4 | NHPP-I | $8,575,451 | $8,575,451 | $7,717,906 | $857,545 | ||
| 2028 | 612094 | Boston Region | Multiple | CANTON- DEDHAM- WESTWOOD- INTERSTATE MAINTENANCE AND RELATED WORK ON I-95 | 6 | NHPP-I | $8,731,030 | $8,731,030 | $7,857,927 | $873,103 | ||
| Section 2B / State Prioritized Modernization Projects | $34,191,557 | $27,676,809 | $6,514,748 | |||||||||
| Intersection Improvements | $2,458,573 | $2,212,716 | $245,857 | |||||||||
| 2028 | 607748 | Boston Region | Acton | ACTON- INTERSECTION & SIGNAL IMPROVEMENTS ON SR 2 & SR 111 (MASSACHUSETTS AVENUE) AT PIPER ROAD & TAYLOR ROAD | 3 | HSIP | $4,382,329 | $731,000 | $657,900 | $73,100 | ||
| 2028 | 608052 | Boston Region | Norwood | NORWOOD- INTERSECTION & SIGNAL IMPROVEMENTS AT US 1 (PROVIDENCE HIGHWAY) & MORSE STREET | 5 | HSIP | $1,727,573 | $1,727,573 | $1,554,816 | $172,757 | ||
| Roadway Reconstruction | $31,732,984 | $25,464,094 | $6,268,890 | |||||||||
| 2028 | 607977 | Boston Region | Multiple | HOPKINTON- WESTBOROUGH- RECONSTRUCTION OF I-90/I-495 INTERCHANGE | 3 | NHPP-I | $300,942,837 | $777,064 | $699,358 | $77,706 | ||
| 2028 | 609527 | Boston Region | Reading | READING- IMPROVEMENTS ON I-95 | 4 | NHPP | $17,376,800 | $17,376,800 | $13,901,440 | $3,475,360 | ||
| 2028 | 610543 | Boston Region | Multiple | REVERE- MALDEN- IMPROVEMENTS AT ROUTE 1 (NB) (PHASE 1) | 4 | NHPP | $8,363,600 | $8,363,600 | $6,690,880 | $1,672,720 | ||
| 2028 | 611969 | Boston Region | Everett | EVERETT- INTERSECTION IMPROVEMENTS ON ROUTE 16 | 4 | NHPP | $17,748,000 | $5,215,520 | $4,172,416 | $1,043,104 | ||
| Section 2C / State Prioritized Expansion Projects | $17,349,097 | $13,879,278 | $3,469,819 | |||||||||
| Bicycle and Pedestrian | $17,349,097 | $13,879,278 | $3,469,819 | |||||||||
| 2028 | 607329 | Boston Region | Multiple | WAKEFIELD- LYNNFIELD- RAIL TRAIL EXTENSION, FROM THE GALVIN MIDDLE SCHOOL TO LYNNFIELD/PEABODY T.L. | 4 | CMAQ | $24,543,047 | $13,943,047 | $11,154,438 | $2,788,609 | ||
| 2028 | 612607 | Boston Region | Danvers | DANVERS- RAIL TRAIL WEST EXTENSION (PHASE 3) | 4 | CMAQ | $3,406,050 | $3,406,050 | $2,724,840 | $681,210 | ||
Table 3-8
FFYs 2023-27 TIP Transit Table (MBTA Federal Capital Program)
| Federal Funding Program | ALI | 2024 | 2025 | 2026 | 2027 | 2028 | FFY24-28 Total (Federal) | FFY24-28 Total (Incl. Match) |
| 5307 | $193,628,164 | $197,611,190 | $202,682,910 | $202,682,910 | $202,682,910 | $999,288,084 | $1,249,110,105 | |
| Bridge & Tunnel Program | 12.24.05 | $0 | $26,234,709 | $26,234,709 | $26,234,709 | $26,234,709 | $104,938,836 | $131,173,545 |
| Revenue Vehicle Program | 12.12.00 | $59,283,688 | $101,373,367 | $106,445,087 | $106,445,087 | $106,445,087 | $479,992,316 | $599,990,395 |
| Signals/Systems Upgrade Program | 12.63.01 | $78,024,477 | $38,176,646 | $38,176,646 | $38,176,646 | $38,176,646 | $230,731,061 | $288,413,826 |
| Stations and Facilities Program | 12.34.00 | $56,319,999 | $31,826,468 | $31,826,468 | $31,826,468 | $31,826,468 | $183,625,871 | $229,532,339 |
| 5337 | $232,546,158 | $236,571,519 | $241,684,814 | $241,684,814 | $241,684,814 | $1,194,172,119 | $1,492,715,149 | |
| Bridge & Tunnel Program | 12.24.05 | $41,922,735 | $85,641,776 | $85,641,776 | $85,641,776 | $85,641,776 | $384,489,839 | $480,612,299 |
| Revenue Vehicle Program | 12.12.00 | $39,200,000 | $26,782,526 | $31,895,822 | $31,895,822 | $31,895,822 | $161,669,992 | $202,087,490 |
| Signals/Systems Upgrade Program | 12.63.01 | $32,306,280 | $25,811,048 | $25,811,047 | $25,811,047 | $25,811,047 | $135,550,469 | $169,438,086 |
| Stations and Facilities Program | 12.34.00 | $119,117,143 | $98,336,169 | $98,336,169 | $98,336,169 | $98,336,169 | $512,461,819 | $640,577,274 |
| 5339 | $6,135,804 | $6,261,816 | $6,416,908 | $6,416,908 | $6,416,908 | $31,648,344 | $39,560,430 | |
| Bus Program | 11.14.00 | $6,135,804 | $6,261,816 | $6,416,908 | $6,416,908 | $6,416,908 | $31,648,344 | $39,560,430 |
| FFY24-28 FTA Formula Funding | $432,310,126 | $440,444,525 | $450,784,632 | $450,784,632 | $450,784,632 | $2,225,108,547 | $2,781,385,684 | |
| Other Federal | $147,500,000 | $516,564,667 | $247,585,333 | $147,500,000 | $147,500,000 | $1,206,650,000 | $1,206,650,000 | |
| RRIF Financing - PTC/ATC/Fiber | 12.63.01 | $0 | $369,064,667 | $100,085,333 | $0 | $0 | $469,150,000 | $469,150,000 |
| RRIF/TIFIA Financing Program | 12.24.05 | $147,500,000 | $147,500,000 | $147,500,000 | $147,500,000 | $147,500,000 | $737,500,000 | $737,500,000 |
| FFY24-28 Total Federal Funding | $579,810,126 | $957,009,192 | $698,369,965 | $598,284,632 | $598,284,632 | $3,431,758,547 | $3,988,035,684 | |
| Note: | ||||||||
| FTA formula funds (5307, 5337 and 5339) are based on estimated apportionments for FFY24-28. | ||||||||
| TIP programs and projects are based on the draft FY24-28 CIP and planned federal obligations as of Apr-23. Adjustments will be made to federal projects and budgets as the FY24-28 CIP is finalized. | ||||||||
| The Activity Line Item (ALI) codes are preliminary only and generally reflect the bulk of the TIP program. Within a program there may be several different ALI codes used. | ||||||||
| RRIF loan funding for the PTC/ATC/Fiber Resiliency project is based on the currently planned drawdown schedule and is subject to change. | ||||||||
| RRIF/TIFIA financing program funding is an initial estimate and will be refined as projects are identified and loans are finalized with the Build America Bureau. | ||||||||
Table 3-9
FFYs 2024-28 TIP Transit Table (MBTA Federal Capital Program - Project List and Descriptions [80% Federal Share])
| Funds | TIP Program | CIP ID# | Project Name | FFY 2023 | FFY 2024-2028 | Total (Federal) | Project Description |
| FTA Formula Funds (5307, 5337, 5339) | |||||||
| 5307 - Bridge and Tunnel | |||||||
| 5307 | Bridge and Tunnel | P0909 | Repairs and Rehabilitation of MBTA-Owned Dams | $0 | $13,200,000 | $13,200,000 | Repairs, rehabilitation and/or decommissioning of the Spillway Dam on the Providence/Stoughton Line in Canton and the Cordaville Pond Dam on the Framingham/Worcester Line in Southborough. |
| 5307 | Bridge and Tunnel | P1107 | Bridge Program Pipeline - Rehabilitation, Repair and Replacement | $0 | $91,738,836 | $91,738,836 | This program uses information provided through the bridge inspection and load rating program to design and construct prioritized bridge rehabilitation, repair, or replacement projects. |
| $0 | $104,938,836 | $104,938,836 | |||||
| 5307 - Revenue Vehicles | |||||||
| 5307 | Revenue Vehicles | P0369 | Green Line Type 10 Vehicle Replacement Program | $86,646,370 | $269,725,111 | $356,371,481 | Procurement of 102 new fully-accessible light rail vehicle (LRV) fleet and related infrastructure improvements to replace the existing Type 7 and Type 8 fleets and support increased system capacity. |
| 5307 | Revenue Vehicles | P0618 | Procurement of 40ft Enhanced Electric Hybrid Buses | $0 | $145,893,636 | $145,893,636 | Procurement of 460 40ft Enhanced Electric Hybrid (EEH) buses to replace 310 40ft diesel buses purchased in 2006-2008 and support more reliable, efficient, and sustainable operations. Includes vehicle testing, warranty, and inspection. |
| 5307 | Revenue Vehicles | P0649 | Option Order Procurement of New Flyer Hybrid 40ft Buses | $0 | $6,642,894 | $6,642,894 | Procurement of 194 40ft buses with hybrid propulsion to replace an aging fleet and improve fuel economy. |
| 5307 | Revenue Vehicles | P0652 | Procurement of 100 Bi-Level Commuter Rail Coaches | $7,815,237 | $27,261,028 | $35,076,265 | Procurement of 100 Bi-Level Commuter Rail coaches to replace aging single-level coaches, expand capacity from 120 to 180 passengers per coach, reduce number of coaches required, and mitigate operational bottlenecks. |
| 5307 | Revenue Vehicles | P0911 | Hybrid and CNG Bus Overhaul | $59,098,327 | $0 | $59,098,327 | Midlife overhaul of major systems and components of 156 40ft hybrid buses to ensure reliable and safe operations that meet FTA requirements. Also includes condition assessment activities for 175 40ft CNG buses, and 45 60ft hybrid buses. |
| 5307 | Revenue Vehicles | P1016 | Mattapan Trolley Select System Upgrade | $2,771,505 | $2,149,646 | $4,921,152 | Overhaul of the 75+-year-old PCC cars operating on the Mattapan Line to improve fleet reliability. Includes work on the propulsion system, trucks, auxiliary electrical power system, wiring, lighting, doors, car bodies, and paint. |
| 5307 | Revenue Vehicles | P1151 | Blue Line Vehicle Mid-Life Overhaul | $2,400,000 | $0 | $2,400,000 | Planning of the midlife overhaul of 94 Blue Line heavy-rail vehicles built by Siemens. The project will address systems at or nearing the end of their intended service lives, obsolete components, and functional improvements. |
| 5307 | Revenue Vehicles | P1154 | CNG Bus Overhaul (New Flyer XN40 - SR 1982) | $666,667 | $0 | $666,667 | Planning for the midlife overhaul of 175 40-foot New Flyer CNG buses delivered 2016 to 2017. These buses require overhaul of major systems and components to ensure continued reliable and safe operations and to meet FTA service life requirements. |
| 5307 | Revenue Vehicles | P1155 | Hybrid Bus Overhaul (New Flyer XDE40 - SR 2011) | $800,000 | $0 | $800,000 | Planning for the midlife overhaul of 44 60-foot New Flyer hybrid buses delivered 2016 to 2017. These buses require overhaul of major systems and components to ensure continued reliable and safe operations and to meet FTA service life requirements. |
| 5307 | Revenue Vehicles | P1162 | Reliability Centered Maintenance - Blue, Orange and Red Line | $0 | $28,320,000 | $28,320,000 | Improvements to trucks, brakes, motors, current collectors, propulsion, and auxiliary fuses on the Blue Line and improvements to propulsion, brakes, HVAC, and doors on the Red and Orange Lines. |
| $160,198,106 | $479,992,316 | $640,190,421 | |||||
| 5307 - Signals and Systems | |||||||
| 5307 | Signals and Systems | P0285 | Signal Program - Red/Orange Line | $58,646,277 | $54,116,151 | $112,762,428 | Replacement and upgrade of signal equipment on the Red and Orange Lines. Includes renewal of track circuit modules using latest digital audio frequency technology and replacement of wayside equipment on the Orange Line south of Haymarket. |
| 5307 | Signals and Systems | P0857 | Mattapan HSL Transformation | $0 | $62,293,157 | $62,293,157 | State of good repair and accessibility improvements, power upgrades, and other infrastructure investments on the Mattapan Line. |
| 5307 | Signals and Systems | P0912 | Systemwide Tunnel Flood Mitigation Program | $0 | $37,200,000 | $37,200,000 | Planning, training, and infrastructure improvements to make the tunnel network more resilient to flooding exposures due to storm surge, precipitation, and sea level rise. |
| 5307 | Signals and Systems | P0940 | Rail Transformation - Early Action Items | $0 | $8,000,000 | $8,000,000 | Various early-action efforts to support future Rail Transformation. Includes addition of double tracks, interlockings, platforms, and turnbacks on the Newburyport/Rockport, Fitchburg, Haverhill, and Lowell Lines at key stations. |
| 5307 | Signals and Systems | P1139 | Systemwide Asset Management Program Phase 4 | $0 | $33,321,753 | $33,321,753 | Implementation of the Asset Management Program in accordance with FTA req. Includes asset inventory and condition assessments; updates to the National Transit Database (NTD) and the Transit Asset Management Plan (TAMP); and EAMS implementation. |
| 5307 | Signals and Systems | P1157 | Systemwide Non-Revenue Vehicles Program | $0 | $9,600,000 | $9,600,000 | Replacement of non-revenue vehicles in the authority's fleet. Non-revenue vehicles include first response vehicles, service cars and trucks, and many other types of vehicles that support operations and maintenance of the system. |
| 5307 | Signals and Systems | P1159 | Everett Test Equipment Upgrades | $0 | $2,400,000 | $2,400,000 | Addition of two AC traction motor test cells, two tread brake unit test benches, one air compressor test unit, and a thermal chamber at the Everett Main Repair Facility. |
| 5307 | Signals and Systems | P1210 | PILC-EPR Medium Voltage Cable Replacement Program | $0 | $11,800,000 | $11,800,000 | Replacement of medium voltage AC cables that are beyond their useful life between traction power substations to maintain a state of good repair and reduce lead exposure risk to employees. |
| 5307 | Signals and Systems | P1212 | 15kV Feeder and Duct Bank Replacement | $0 | $12,000,000 | $12,000,000 | Design and systemwide replacement of cables with Paper Insulated Lead Covered (PILC) feeders with new cables containing Ethylene Propylene Rubber (EPR) feeders to increase employee safety and power system resiliency. |
| $58,646,277 | $230,731,061 | $289,377,338 | |||||
| 5307 - Stations and Facilities | |||||||
| 5307 | Stations and Facilities | P0066e | Harvard/Central Elevator | $400,000 | $0 | $400,000 | Replacement of existing station elevator No. 821 at Harvard Square and No. 861 at Central Square on the Red Line, per ADA/BCIL requirements. Also includes replacement of central escalator No. 360. |
| 5307 | Stations and Facilities | P0075 | Elevator Program Multiple Location Design | $20,951,644 | $22,026,625 | $42,978,269 | Design and some construction work for the replacement of elevators and/or addition of new, redundant elevators and related wayfinding amenities at transit stations. |
| 5307 | Stations and Facilities | P0165 | Harvard Square Busway Repairs | $993,027 | $0 | $993,027 | Rehabilitation of roadway, lighting, signage, drainage, and catenary systems in the Harvard busway and accessibility upgrades to ensure near level boarding for the 71 and 73 buses. |
| 5307 | Stations and Facilities | P0671a | Quincy Bus Facility Modernization | $32,522,178 | $62,527,791 | $95,049,968 | Relocation and replacement of the Quincy Bus Maintenance Facility. The new, modernized facility will expand capacity and includes the infrastructure necessary to support the MBTA's first battery-electric bus (BEB) fleet and bus electrification. |
| 5307 | Stations and Facilities | P0671b | Arborway Bus Facility - Design Funding | $0 | $27,720,000 | $27,720,000 | Design funding to support the construction of a new Arborway bus facility to accommodate battery electric bus (BEB) infrastructure and bus electrification. |
| 5307 | Stations and Facilities | P0671c | North Cambridge Bus Facility Retrofit | $0 | $28,800,000 | $28,800,000 | Renovation of North Cambridge facility to support conversion to battery electric bus (BEB) fleets and bus electrification. |
| 5307 | Stations and Facilities | P1113 | Bus Priority Project Construction | $0 | $9,120,000 | $9,120,000 | Funding to support construction of bus priority infrastructure. This may include side- or center-running bus lanes, transit signal priority, pavement markings, and stop upgrades. |
| 5307 | Stations and Facilities | P1216 | Everett Building 2 Floor Repairs | $0 | $15,031,457 | $15,031,457 | Repairs to the heavily deteriorated structure on the first floor of Everett's Building 2 facility that supports heavy rail service. |
| 5307 | Stations and Facilities | P1225 | Systemwide Escalator and Elevator Replacement Program | $0 | $12,000,000 | $12,000,000 | Replacement of escalators and elevators systemwide that are in poor condition, have limited parts available, and require replacement as identified in the MBTA's 20-Year Vertical Transportation Capital Plan. |
| 5307 | Stations and Facilities | P1233 | Green Line D Branch Enhanced Accessibility Improvements | $0 | $6,399,998 | $6,399,998 | Replacement of legacy uninterruptable power source equipment with latest generation devices and cables across all rapid transit communication rooms to allow core devices to remain online and operational during momentary power outages. |
| $54,993,482 | $183,625,871 | $238,619,353 | |||||
| 5337 - Bridge and Tunnel | |||||||
| 5337 | Bridge and Tunnel | P0006 | Gloucester Drawbridge Replacement | $12,402,982 | $0 | $12,402,982 | Replacement of Gloucester Drawbridge on the Rockport Line. The new bridge will consist of a moveable bascule span with two independent barrels, two spans of precast concrete box beams, a new steel superstructure, and a new micro-pile abutment. |
| 5337 | Bridge and Tunnel | P0008 | Emergency Bridge Design / Inspection & Rating | $20,848,534 | $0 | $20,848,534 | Funding to support as-needed emergency design, inspection, and rating of bridges. |
| 5337 | Bridge and Tunnel | P0009 | Bridges - Design | $8,493,454 | $3,902,654 | $12,396,108 | Design funding to support the repair, rehabilitation, and replacement of bridges across the system. |
| 5337 | Bridge and Tunnel | P0018 | North Station Draw 1 Bridge Replacement | $20,502,981 | $144,649,614 | $165,152,595 | Replacement of North Station Draw 1 bridge structure and control tower. Includes expansion of bridge capacity from 4 to 6 tracks, expansion of station platform capacity from 10 to 12 tracks, and a pedestrian path across the Charles River. |
| 5337 | Bridge and Tunnel | P0037 | Emergency Bridge Repair | $5,014,180 | $0 | $5,014,180 | Funding to support emergency bridge repairs on an on-call basis. |
| 5337 | Bridge and Tunnel | P0182 | Tunnel Rehab | $9,004,269 | $0 | $9,004,269 | Construction and professional services relating to tunnel repair and inspection. |
| 5337 | Bridge and Tunnel | P0495 | Bridge Bundling Contract | $0 | $11,200,000 | $11,200,000 | Replacement of six commuter rail bridges at Intervale Rd. in Weston; Bacon St. in Wellesley; High Line Bridge in Somerville; Lynn Fells Parkway in Melrose; Parker St. in Lawrence; and Commercial St. in Lynn. |
| 5337 | Bridge and Tunnel | P0551 | Longfellow Approach | $8,528,092 | $159,471,909 | $168,000,000 | Rehabilitation of Longfellow Approach viaduct, Span 1 of the Longfellow Bridge, and station platforms at Charles/MGH Station. Includes new track, power, communication and signal systems, and additional emergency egress and redundant elevators. |
| 5337 | Bridge and Tunnel | P0627 | Systemwide Bridge Inspection and Rating | $6,377,260 | $22,400,000 | $28,777,260 | Program to support in-depth inspection and load rating of MBTA-owned bridges at regular intervals. Load ratings are used to establish a systemwide priority list of bridge repairs, rehabilitation, and replacement. |
| 5337 | Bridge and Tunnel | P0892 | Saugus Drawbridge Replacement | $2,445,159 | $5,554,842 | $8,000,000 | Design of Saugus Drawbridge replacement on the Newburyport/Rockport Line. The new bridge would include a widened approach embankment, a new control house, signal upgrades, and relocation of submerged utilities. |
| 5337 | Bridge and Tunnel | P0907 | East Street Bridge Replacement (Dedham) | $4,192,505 | $10,207,495 | $14,400,000 | Replacement of East Street bridge carrying the Franklin Line in Dedham. The new bridge will feature improved vertical and horizontal clearance, improved roadway features, and improved pedestrian and vehicle access to East Street. |
| 5337 | Bridge and Tunnel | P1107 | Bridge Program Pipeline - Rehabilitation, Repair and Replacement | $4,400,000 | $11,600,000 | $16,000,000 | This program uses information provided through the bridge inspection and load rating program to design and construct prioritized bridge rehabilitation, repair, or replacement projects. |
| 5337 | Bridge and Tunnel | P1115 | South Elm Street Bridge Replacement | $560 | $4,095,326 | $4,095,886 | Replacement of South Elm Street bridge on the Haverhill Line serving Commuter Rail, Downeaster, and Pan Am freight trains. |
| 5337 | Bridge and Tunnel | P1116 | Systemwide Culvert Inspection and Load Rating | $0 | $2,800,000 | $2,800,000 | Inventory, inspection, and load rating of the MBTA's approx. 1,300 culverts supporting in-service structures systemwide. The scope of work includes an initial inspection to establish baseline condition, followed by inspection every five years. |
| 5337 | Bridge and Tunnel | R0074 | Tunnel Inspection Systemwide | $5,360 | $8,608,000 | $8,613,360 | Ongoing inspection and rating of Red Line, Orange Line, Green Line, and Blue Line tunnels. |
| $102,215,335 | $384,489,839 | $486,705,174 | |||||
| 5337 - Revenue Vehicles | |||||||
| 5337 | Revenue Vehicles | P0239 | F40 Commuter Rail Locomotive Overhaul | $17,186,527 | $16,484,144 | $33,670,671 | Overhaul of 37 F40 Commuter Rail locomotives to improve reliability and reduce risk of unplanned maintenance. |
| 5337 | Revenue Vehicles | P0370 | Green Line Train Protection | $64,981,631 | $21,914,013 | $86,895,645 | Procurement and installation of on-board and wayside equipment for a train protection and information system on the Green Line to mitigate red signal violations, train-to-train collisions, derailments, and intrusions into work zones. |
| 5337 | Revenue Vehicles | P0918 | Future Rolling Stock Fleet | $800,000 | $39,200,000 | $40,000,000 | Planning funds to support future procurement of 25 electrified or decarbonized Commuter Rail rolling stock to replace the oldest vehicles in the fleet and support rail electrification. |
| 5337 | Revenue Vehicles | P0927 | Rolling Stock - Locomotive and Coach State of Good Repair and Resiliency | $8,784,689 | $10,471,834 | $19,256,523 | Upgrades to improve system reliability, correct deficiencies, standardize procedures, and increase equipment availability for Commuter Rail rolling stock. Includes vehicle procurement, testing support, service life enhancement, and overhauls. |
| 5337 | Revenue Vehicles | P1173 | HSP46 Locomotive Overhaul | $536,000 | $73,600,000 | $74,136,000 | Midlife overhaul of 40 HSP46 Locomotives to improve reliability and reduce risk of unplanned maintenance. |
| $92,288,847 | $161,669,992 | $253,958,839 | |||||
| 5337 - Signals and Systems | |||||||
| 5337 | Signals and Systems | P0146 | SCADA Upgrades | $0 | $1,600,000 | $1,600,000 | Upgrades to the Power Supervisory Control and Data Acquisition (SCADA) communication network from leased lines to the Security Wide Area Network (SWAN) to provide high-speed ethernet connection at traction power substations and unit substations. |
| 5337 | Signals and Systems | P0261 | Worcester Line Track and Station Accessibility Improvements | $9,654,473 | $16,231,267 | $25,885,740 | New third track and realignment of existing tracks on the Framingham and Worcester Commuter Rail lines between Weston and Framingham. Includes upgrades to Wellesley Farms, Wellesley Hills, Wellesley Square, and West Natick Stations. |
| 5337 | Signals and Systems | P0283 | Green Line Central Tunnel Signal - 25 Cycle | $3,731,460 | $0 | $3,731,460 | Replacement of 25Hz track circuits with 100Hz track circuits in the Green Line central tunnel. Includes replacement of track circuit cable, trough, messenger, cases, relays, rectifiers, and signal power equipment. |
| 5337 | Signals and Systems | P0301 | Systemwide Radio | $111,800,719 | $0 | $111,800,719 | Upgrade of the MBTA’s existing two-way radio system used by MBTA Transit Police and operations personnel. This project includes mobile radios for heavy rail, light rail, and bus vehicles. |
| 5337 | Signals and Systems | P0591 | Green Line Central Tunnel Track and Signal Replacement | $16,598,773 | $79,401,227 | $96,000,000 | Rehabilitation and upgrades to signal and track infrastructure within the Green Line Central Tunnel. Includes central instrumentation houses and signal, track, and power systems at Copley, Park Street, and Government Center. |
| 5337 | Signals and Systems | P0705 | Power Systems Resiliency Program | $7,384 | $5,144,453 | $5,151,837 | Replacement of damaged power cable duct banks that energize areas of the Red, Orange, Blue, and Green Lines. Includes excavation, demolition, conduit replacement, manhole replacement, surface restoration, and power-cable installation. |
| 5337 | Signals and Systems | P0904 | Systemwide Asset Management Program Phase 3 | $5,132,759 | $2,467,241 | $7,600,000 | Implementation of the Asset Management Program in accordance with FTA requirements. Includes professional services, audit, inventory, condition assessments, updates to the National Transit Database (NTD), and Transit Asset Management Plan (TAMP). |
| 5337 | Signals and Systems | P1104 | Traction Power Substation Upgrades | $0 | $5,760,000 | $5,760,000 | Complete replacement of electrical systems and strucural, mechanical, and plumbing improvements at nine aging traction power substations (TPSS). This scope also includes a TPSS Design Guide to standardize future improvements. |
| 5337 | Signals and Systems | P1114 | South Boston to Forest Hills Duct Bank Replacement | $0 | $12,946,281 | $12,946,281 | Replacement of duct banks and cables which carry AC power from the South Boston power complex to Forest Hills. |
| 5337 | Signals and Systems | P1132 | Ashmont Branch Track Replacement | $4,000,000 | $0 | $4,000,000 | Design and construction for partial reconstruction of track and track support systems on the Ashmont Branch of the Red Line.This is part of a series of Red Line track replacement projects. |
| 5337 | Signals and Systems | P1133 | Braintree Line Track Replacement | $1,200,000 | $0 | $1,200,000 | Design and construction for partial reconstruction of track and track support systems on the Braintree Branch of the Red Line. This is part of a series of Red Line track replacement projects. |
| 5337 | Signals and Systems | P1139 | Systemwide Asset Management Program Phase 4 | $9,600,000 | $0 | $9,600,000 | Implementation of the Asset Management Program in accordance with FTA req. Includes asset inventory and condition assessments; updates to the National Transit Database (NTD) and the Transit Asset Management Plan (TAMP); and EAMS implementation. |
| 5337 | Signals and Systems | P1149 | Unit Substation Replacement Project | $1,851,360 | $0 | $1,851,360 | Development of a unit substation (USS) design guide and replacement of existing power and electrical equipment at USS locations, including AC feeder disconnect switches. |
| 5337 | Signals and Systems | P1213 | SCADA Equipment Update | $0 | $12,000,000 | $12,000,000 | Equipment and fiber optic network upgrades to the Supervisory Control and Data Acquisition (SCADA) system that controls critical power infrastructure. Upgrades incl. a new master terminal, programmable logic controllers, and remote terminal units. |
| $163,576,927 | $135,550,469 | $299,127,396 | |||||
| 5337 - Stations and Facilities | |||||||
| 5337 | Stations and Facilities | P0003 | Green Line B-Branch Consolidation | $295,716 | $0 | $295,716 | Consolidation of four Green Line B-Branch stops into two new, fully accessible stations: Babcock Street and Amory Street. Features include accessible boarding and exits, security and lighting upgrades, and longer platforms to accommodate Type 10s. |
| 5337 | Stations and Facilities | P0066 | Elevator Program | $0 | $1,585,531 | $1,585,531 | Design and construction funding for elevator improvements on the rapid transit system. Individual elevator projects are separated into unique projects once construction stage is reached. |
| 5337 | Stations and Facilities | P0074 | Downtown Crossing Vertical Transportation Improvements Phase 2 | $0 | $62,208,880 | $62,208,880 | Design and construction of 3 new elevators to provide vertical transfers from the Red Line northbound to the Orange Line southbound platform, and from the Orange Line northbound to the Red Line southbound platform at Downtown Crossing. |
| 5337 | Stations and Facilities | P0076 | Oak Grove Station Vertical Transportation Improvements | $800,000 | $800,000 | $1,600,000 | Accessibility upgrades at Oak Grove station, including three elevators, replacement of one existing elevator, sidewalk repairs, and wayfinding and station-brightening improvements. |
| 5337 | Stations and Facilities | P0087 | Braintree and Quincy Adams Garage Rehabilitation | $3,763,904 | $5,984,095 | $9,748,000 | Full rehabilitation of the Red Line’s Braintree Station and Quincy Adams Station parking garages to extend the operable service life of each facility by forty years, including new elevators at Braintree and upgrades to life and fire safety systems. |
| 5337 | Stations and Facilities | P0129 | Newton Highlands Green Line Station Accessibility Project | $21,713,141 | $16,588,853 | $38,301,993 | Accessibility improvements at Newton Highlands on the Green Line D Branch, including three ramps covered with canopies, raised platforms, one at-grade pedestrian crossing, site lighting, new platform shelters, and covered bike racks. |
| 5337 | Stations and Facilities | P0163 | Forest Hills Improvement Project | $5,726,410 | $20,363,354 | $26,089,764 | Accessibility and state of good repair improvements at Forest Hills Station. Includes elevator replacement, new elevator/stair tower to connect upper and lower busway, accessibility upgrades, station brightening, wayfinding, and platform repairs. |
| 5337 | Stations and Facilities | P0169 | Wollaston Station / Quincy Center Garage Demolition | $440,376 | $2,095,100 | $2,535,476 | Complete modernization of Wollaston Station, demolition of the top 3 levels of the Quincy Center parking garage, replacement of one elevator at Quincy Center, and construction of an accessible walkway to Quincy Center. |
| 5337 | Stations and Facilities | P0174 | Natick Center Station Accessibility Project | $0 | $10,739,265 | $10,739,265 | Reconstruction and modernization of Natick Center Station, including new fully accessible high-level side platforms,elevators, ramps, stairs, lighting, wayfinding, streetscape, upgraded tracks, and connection to the Cochituate Rail Trail. |
| 5337 | Stations and Facilities | P0179 | Winchester Center Station | $0 | $5,865,827 | $5,865,827 | Reconstruction and modernization of Winchester Center Station including new fully accessible high-level side platforms, elevators, ramps, stairs, lighting, signage and wayfinding, streetscape improvements, and upgraded track infrastructure. |
| 5337 | Stations and Facilities | P0395 | Worcester Union Station Accessibility and Infrastructure Improvements | $0 | $2,841,410 | $2,841,410 | Includes high-level center platform with elevators, ramps, and stairs; replacement and realignment of station tracks; and construction of a new rail crossover to improve accessibility, operations, and service capacity at Worcester Union Station. |
| 5337 | Stations and Facilities | P0631b | Blue Line Communications Room SGR Improvements | $0 | $16,374,166 | $16,374,166 | Rehabilitation of communications rooms along the Blue Line to bring them into a state of good repair and support the implementation of Fare Transformation. |
| 5337 | Stations and Facilities | P0679 | Codman Yard Expansion and Improvements | $0 | $48,118,356 | $48,118,356 | Improvements to Codman Yard, including in-kind replacement of existing infrastructure and the expansion of storage capacity to support the new Red Line fleet. |
| 5337 | Stations and Facilities | P0856 | Ruggles Station Improvements Phase 2 | $99,625,355 | $0 | $99,625,355 | Continuation of Ruggles Station Improvements to address accessibility, code-compliance, and state-of-good repair issues. Includes repair, reconstruction, and improvements to platforms, entrances, stairs, elevators, ramps, restrooms, and wayfinding. |
| 5337 | Stations and Facilities | P0923 | E Branch Accessibility & Capacity Improvements | $0 | $68,752,659 | $68,752,659 | Improvements to surface track and stations on the E branch of the Green Line, extending from the Northeastern Station portal to Heath Street Station. |
| 5337 | Stations and Facilities | P0924 | B Branch Accessibility & Capacity Improvements | $0 | $122,712,388 | $122,712,388 | Track realignments, accessibility improvements, potential consolidation, and station and traction power upgrades along the Green Line B branch between Blandford St. and Warren St. Stations. |
| 5337 | Stations and Facilities | P1010 | Riverside Vehicle Maintenance Facility Modifications & Upgrades | $0 | $39,480,004 | $39,480,004 | Upgrades to existing hoists, pits, and mezzanines at the Riverside Vehicle Maintenance Facility to accommodate the future Type 10 fleet. |
| 5337 | Stations and Facilities | P1011 | Green Line Extension Vehicle Maintenance Facility Modifications & Upgrades | $0 | $9,943,729 | $9,943,729 | Design and installation of a new hoist at the Green Line Extension (GLX) Vehicle Maintenance Facility to accommodate the future Type 10 fleet. |
| 5337 | Stations and Facilities | P1025 | Lynn Parking Garage Decommissioning | $0 | $18,252,240 | $18,252,240 | Decommissioning of the closed Lynn Station parking garage. |
| 5337 | Stations and Facilities | P1101 | Lake Street Complex Demolition and Reconfiguration | $0 | $3,680,695 | $3,680,695 | Demolition of the Lake Street facility and reconfiguration into an expanded yard. The site will be designed to maximize train storage, streamline yard operations, and eliminate a sharp curve in anticipation of the larger Type 10 light rail fleet. |
| 5337 | Stations and Facilities | P1103 | Reservoir Yard and Non-Revenue Track Optimization and Reconfiguration | $0 | $24,424,868 | $24,424,868 | Reconfiguration of various track elements at Reservoir, including the lower west yard, East/West Wye, Chestnut Hill Avenue connection, B-branch connection, and non-revenue track around Cleveland Circle. |
| 5337 | Stations and Facilities | P1144 | Commuter Rail Facilities State of Good Repair | $22,800,000 | $0 | $22,800,000 | Funding to support Commuter Rail facilities improvements, including design support contracts, roof and roof equipment replacement, WiFi and IT infrastructure, fluid systems, and maintenance of way facilities. |
| 5337 | Stations and Facilities | P1171 | Billerica MOW Repair and Storage Facility | $0 | $24,000,000 | $24,000,000 | Funds to design and construct a new, fully accessible Commuter Rail maintenance facility, storage yards, and tracks in Billerica, with eight service bays, wash bay, overhead bridge crane, office space, and employee amenities. |
| 5337 | Stations and Facilities | P1222 | Codman Yard Storage and Office Facility | $0 | $7,650,400 | $7,650,400 | Establishment of a dedicated storage and office facility at the Codman Yard to store, repair, and maintain critical equipment. |
| 5337 | Stations and Facilities | R0071 | Lynn Station and Parking Garage Improvements Phase II | $3,680,328 | $0 | $3,680,328 | Design funding for new elevators, stairs, platform, canopy, and architectural improvements to the station and the intent to acquire and demolish structures under station's viaduct. Existing parking garage will also be replaced by surface parking. |
| $158,845,231 | $512,461,819 | $671,307,050 | |||||
| 5339 - Bus and Bus Facility | |||||||
| 5339 | Bus Program | P0911 | Hybrid and CNG Bus Overhaul | $5,980,713 | $31,648,344 | $37,629,057 | Midlife overhaul of major systems and components of 156 40ft hybrid buses to ensure reliable and safe operations that meet FTA requirements. Also includes condition assessment activities for 175 40ft CNG buses, and 45 60ft hybrid buses. |
| $5,980,713 | $31,648,344 | $37,629,057 | |||||
| Note: Project descriptions and dollar amounts are preliminary only and are provided for informational purposes. In many cases, the scopes of work and project budgets will become more fully developed as the design process proceeds and is completed. The MBTA may also opt to fund a project from a different FTA funding source based on the timing of projects and the availability of FTA funds. | |||||||
| RRIF/TIFIA Financing Program | |||||||
| Projects Potentially Funded by Federal RRIF/TIFIA Loans | |||||||
| RRIF/TIFIA Financing | P0671a | Quincy Bus Facility Modernization | RRIF/TIFIA loan amount/ timing to be determined | Relocation and replacement of the Quincy Bus Maintenance Facility. The new, modernized facility will expand capacity and includes the infrastructure necessary to support the MBTA's first battery-electric bus (BEB) fleet and bus electrification. | |||
| RRIF/TIFIA Financing | P0952 | Future Regional Rail Layover Planning | RRIF/TIFIA loan amount/ timing to be determined | Real estate procurement and preliminary design for a Commuter Rail layover facility at Widett Circle in South Boston. | |||
| RRIF/TIFIA Financing | P0018 | North Station Draw 1 Bridge Replacement | RRIF/TIFIA loan amount/ timing to be determined | Replacement of North Station Draw 1 bridge structure and control tower. Includes expansion of bridge capacity from 4 to 6 tracks, expansion of station platform capacity from 10 to 12 tracks, and a pedestrian path across the Charles River. | |||
| RRIF/TIFIA Financing | P0170 | Newton Commuter Rail Stations Design | RRIF/TIFIA loan amount/ timing to be determined | Design of double-side, high-level, fully accessible platforms at Auburndale, West Newton, and Newtonville stations. Additional improvements include bike shelters, pick-up/drop-off locations, accessible parking, and connection to The Ride. | |||
| RRIF/TIFIA Financing | P0178 | South Attleboro Station Improvements | RRIF/TIFIA loan amount/ timing to be determined | Design for the construction of a new South Attleboro station, to include 800-ft. high-level platforms, three elevators, platform access ramps, a bus bay, egress to Newport Ave., additional parking, improved vehicular circulation, updated lighting. | |||
| RRIF/TIFIA Financing | P0863 | South-Side Commuter Rail Maintenance Facility | RRIF/TIFIA loan amount/ timing to be determined | Assessment and design for a new Commuter Rail maintenance and layover facility at Readville. Includes design for future construction of multiple maintenance bays within Yard 1 and Upper Yard 2. | |||
| Note: The MBTA is exploring the use of federal loans through the Build America Bureau to finance certain capital projects at a lower interest rate than traditional tax-exempt bonds. This includes loans under the Railroad Rehabilitation & Improvement Financing (RRIF) and Transportation Infrastructure Finance and Innovation Act (TIFIA) programs. The projects listed above are being considered for this program, subject to the approval of funding through the CIP process. Additional project and funding information will be provided through a future TIP/Amendment if federal grant funds or loans are utilized. | |||||||
Table 3-10: FFYs 2024–28 TIP Transit Table (MWRTA)
| Project Number | RTA | Program | Project Name | Notes | Federal Fiscal Year | Total Cost | Bond Cap | State | 100% State | Bond Cap | Match | Federal Transit Discretionary Grant | Federal | FTA | Section 5307 | Federal | FTA | Section 5339 Statewide | Federal | FTA | Federal Transit Discretionary Grant | Operating | Additional State Assistance | State Contract Assistance | Federal | FHWA | Transportation Development Credits |
| FFY 2024 | |||||||||||||
| RTD0011103 | MWRTA | Operating | Operating Assistance Non-Fixed Route ADA Paratransit Service | Operating assistance for non-fixed route ADA paratransit service | 2024 | $2,000,000 | $0 | $0 | $1,600,000 | $0 | $0 | $400,000 | $0 |
| RTD0011104 | MWRTA | Transit | RTA Facility and Vehicle Maintenance | Acquisition of Bus Support Equipment/Facilities | Acquire after-market vehicle accessories (i.e., passenger counters, DVR - vehicle recorders, annunciators) | 2024 | $200,000 | $40,000 | $0 | $160,000 | $0 | $0 | $0 | $0 |
| RTD0011105 | MWRTA | Transit | RTA Facility and System Modernization | Technology Support/Capital Outreach | Mobility management; IT; Call center; Travel training enhancements/improvements; MWRTA applies for competitive funding for this line item and will reduce the RTACAP request upon award of additional federal funds. | 2024 | $300,000 | $150,000 | $0 | $150,000 | $0 | $0 | $0 | $0 |
| RTD0011106 | MWRTA | Transit | RTA Facility and Vehicle Maintenance | Terminal, Intermodal (Transit) - Blandin | MWRTA will utilize these funds to maintain a state-of-good-repair value of at least 3.5 for the operations and administration facility along with all amenities and support equipment located at 15 Blandin Ave, Framingham, MA. | 2024 | $500,000 | $100,000 | $0 | $400,000 | $0 | $0 | $0 | $0 |
| RTD0011107 | MWRTA | Transit | RTA Facility and Vehicle Maintenance | Terminal, Intermodal (Transit) - Framingham Commuter Rail Station (FCRS) | Intermodal at the Framingham Commuter Rail Station (FCRS) enhancements/improvements; MWRTA applies for competitive funding for this line item and will reduce the RTACAP request upon award of additional federal funds. | 2024 | $5,000 | $1,000 | $0 | $4,000 | $0 | $0 | $0 | $0 |
| T00037 | MWRTA | Transit | RTA Facility and Vehicle Maintenance | CNG Dispensers at the Compressed Natural Gas Fueling Facility | Upgrade the CNG (compressed natural gas) Dispensers at the MWRTA Fueling Facility. | 2024 | $200,000 | $100,000 | $0 | $100,000 | $0 | $0 | $0 | $0 |
| RTD0011114 | MWRTA | Transit | RTA Vehicle Replacement | 5339 Competitive Revenue Vehicle Replacement - Discretionary | Buy replacement vehicles; 11 D(b) - CNGs + 5 E2s - Gas | 2024 | $1,930,000 | $0 | $482,500 | $0 | $0 | $1,447,500 | $0 | $0 |
| RTD0011123 | MWRTA | Transit | RTA Fleet Upgrades | 5339 Competitive 2024 Electric Vehicle (EV) Infrastructure - Discretionary | Modernization fleet electrification - Vehicle migration - Purchase of 5 electric vehicles | 2024 | $300,000 | $0 | $40,000 | $0 | $0 | $260,000 | $0 | $0 |
| RTD0011130 | MWRTA | Transit | RTA Facility and System Modernization | FCRS Intermodal Hub - Discretionary | Explore opportunities for Framingham Commuter Rail Station (FCRS) for the expansion of Intermodal transportation opportunities. | 2024 | $30,000,000 | $0 | $0 | $0 | $0 | $25,000,000 | $0 | $5,000,000 |
| T00038 | MWRTA | Transit | RTA Facility and System Modernization | Electronic Sign Board | Procurement of electronic sign boards. | 2024 | $150,000 | $0 | $150,000 | $0 | $0 | $0 | $0 | $0 |
| FFY 2025 | |||||||||||||
| RTD0011109 | MWRTA | Transit | RTA Facility and Vehicle Maintenance | Acquisition of Bus Support Equipment/Facilities | Acquire after-market vehicle accessories (i.e., passenger counters, DVR - vehicle recorders, annunciators) | 2025 | $113,750 | $22,750 | $0 | $91,000 | $0 | $0 | $0 | $0 |
| RTD0011110 | MWRTA | Transit | RTA Facility and System Modernization | Technology Support/Capital Outreach | Mobility management; IT; Call center; Travel training enhancements/improvements; MWRTA applies for competitive funding for this line item and will reduce the RTACAP request upon award of additional federal funds. | 2025 | $200,000 | $40,000 | $0 | $160,000 | $0 | $0 | $0 | $0 |
| RTD0011111 | MWRTA | Transit | RTA Facility and Vehicle Maintenance | Terminal, Intermodal (Transit) - Blandin | MWRTA will utilize these funds to maintain a state-of-good-repair value of at least 3.5 for the operations and administration facility along with all amenities and support equipment located at 15 Blandin Ave, Framingham, MA. | 2025 | $562,500 | $112,500 | $0 | $450,000 | $0 | $0 | $0 | $0 |
| RTD0011112 | MWRTA | Operating | Operating Assistance Non-Fixed Route ADA Paratransit Service | Operating assistance for non-fixed route ADA paratransit service | 2025 | $2,000,000 | $0 | $0 | $1,600,000 | $0 | $0 | $400,000 | $0 |
| RTD0011115 | MWRTA | Transit | RTA Vehicle Replacement | 5339 Competitive Revenue Vehicle Replacement - Discretionary | Buy replacement vehicles; 3 D(b) - CNGs + 5 E2s - Gas | 2025 | $641,500 | $0 | $128,300 | $0 | $0 | $513,200 | $0 | $0 |
| RTD0011121 | MWRTA | Transit | RTA Facility and Vehicle Maintenance | Terminal, Intermodal (Transit) - Framingham Commuter Rail Station (FCRS) | Framingham intermodal enhancements/improvements; MWRTA applies for competitive funding for this line item and will reduce the RTACAP request upon award of additional federal funds. | 2025 | $5,000 | $1,000 | $0 | $4,000 | $0 | $0 | $0 | $0 |
| RTD0011124 | MWRTA | Transit | RTA Fleet Upgrades | 5339 Competitive 2025 Electric Vehicle (EV) Additional Electrification Costs - Discretionary | Modernization fleet electrification - Vehicle migration - Purchase of 5 paratransit (Type A) electric vehicles. MWRTA is seeking an 8-year migration to fully electric vehicles. This request is supported in MWRTA's TAM to maintain useful life benchmarks of the agency's paratransit fleet and is in support of Gov. Baker's 2020 Transportation and Climate Initiative (TCI). | 2025 | $1,000,000 | $0 | $500,000 | $500,000 | $0 | $0 | $0 | $0 |
| RTD0011137 | MWRTA | Transit | RTA Vehicle Replacement | Vehicle Replacement - Cutaways (8) #2 of 2 | FY25 #1 of 2 5339 $250k + RTACAP $125k; FY25 #2 of 2 5307 $250k + RTACAP $125k for 3 D(b) w/CNG + 5 E2s - Gas | 2025 | $471,968 | $94,394 | $0 | $0 | $377,574 | $0 | $0 | $0 |
| RTD0011133 | MWRTA | Transit | RTA Facility and System Modernization | AFC Transition - Mobile Fare Collection Equipment | Develop API to work with CharlieCard 2.0 | 2025 | $100,000 | $50,000 | $0 | $50,000 | $0 | $0 | $0 | $0 |
| RTD0011134 | MWRTA | Transit | RTA Facility and Vehicle Maintenance | Public Restrooms at Blandin & Framingham Commuter Rail Station Hubs - Discretionary | Provide safe, clean, well-ventilated public restrooms at the Blandin Hub and FCRS (Framingham Commuter Rail Station) Intermodal Hub. | 2025 | $200,000 | $0 | $40,000 | $0 | $0 | $160,000 | $0 | $0 |
| FFY 2026 | |||||||||||||
| RTD0011116 | MWRTA | Operating | Operating Assistance Non-Fixed Route ADA Paratransit Service | Operating assistance for non-fixed route ADA paratransit service | 2026 | $2,000,000 | $0 | $0 | $1,600,000 | $0 | $0 | $400,000 | $0 |
| RTD0011117 | MWRTA | Transit | RTA Facility and Vehicle Maintenance | Terminal, Intermodal (Transit) - Blandin | MWRTA will utilize these funds to maintain a state-of-good-repair value of at least 3.5 for the operations and administration facility along with all amenities and support equipment located at 15 Blandin Ave, Framingham, MA. | 2026 | $687,500 | $137,500 | $0 | $550,000 | $0 | $0 | $0 | $0 |
| RTD0011118 | MWRTA | Transit | RTA Facility and System Modernization | Technology Support/Capital Outreach | Mobility management; IT; Call center; Travel training enhancements/improvements; MWRTA applies for competitive funding for this line item and will reduce the RTACAP request upon award of additional federal funds. | 2026 | $200,000 | $40,000 | $0 | $160,000 | $0 | $0 | $0 | $0 |
| RTD0011119 | MWRTA | Transit | RTA Facility and Vehicle Maintenance | Acquisition of Bus Support Equipment/Facilities | Acquire after-market vehicle accessories (i.e., passenger counters, DVR - vehicle recorders, annunciators) | 2026 | $113,750 | $22,750 | $0 | $91,000 | $0 | $0 | $0 | $0 |
| RTD0011120 | MWRTA | Transit | RTA Facility and Vehicle Maintenance | Terminal, Intermodal (Transit) - Framingham Commuter Rail Station (FCRS) | Intermodal at the Framingham Commuter Rail Station (FCRS) enhancements/improvements; MWRTA applies for competitive funding for this line item and will reduce the RTACAP request upon award of additional federal funds. | 2026 | $5,000 | $1,000 | $0 | $4,000 | $0 | $0 | $0 | $0 |
| RTD0011125 | MWRTA | Transit | RTA Fleet Upgrades | 2026 Electric Vehicle (EV) Additional Electrification Costs | Modernization fleet electrification - Vehicle migration - Purchase of 5 paratransit (Type A) electric vehicles. MWRTA is seeking an 8-year migration to fully electric vehicles. This request is supported in MWRTA's TAM to maintain useful life benchmarks of the agency's paratransit fleet and is in support of Gov. Baker's 2020 Transportation and Climate Initiative (TCI). | 2026 | $1,000,000 | $500,000 | $0 | $0 | $500,000 | $0 | $0 | $0 |
| RTD0011126 | MWRTA | Transit | RTA Vehicle Replacement | 5339 Competitive Revenue Vehicle Replacement - Discretionary | Buy replacement vehicles; 6 D(b) - CNGs + 2 E2s - Gas | 2026 | $573,436 | $0 | $114,688 | $0 | $0 | $458,748 | $0 | $0 |
| RTD0011138 | MWRTA | Transit | RTA Vehicle Replacement | Vehicle Replacement - Cutaways (8) #2 of 2 | FY26 #1 of 2 5339 $250k + RTACAP $125k; FY26 #2 of 2 5307 $250k + RTACAP $125k for 6 D(b) w/CNG + 2 E2s - Gas | 2026 | $573,436 | $114,688 | $0 | $0 | $458,748 | $0 | $0 | $0 |
| FFY 2027 | |||||||||||||
| RTD0011195 | MWRTA | Operating | Operating Assistance Non-Fixed Route ADA Paratransit Service | Operating assistance for non-fixed route ADA paratransit service | 2027 | $2,000,000 | $0 | $0 | $1,600,000 | $0 | $0 | $400,000 | $0 |
| RTD0011196 | MWRTA | Transit | RTA Facility and Vehicle Maintenance | Terminal, Intermodal (Transit) - Blandin | MWRTA will utilize these funds to maintain a state-of-good-repair value of at least 3.5 for the operations and administration facility along with all amenities and support equipment located at 15 Blandin Ave, Framingham, MA. | 2027 | $708,125 | $141,625 | $0 | $566,500 | $0 | $0 | $0 | $0 |
| RTD0011197 | MWRTA | Transit | RTA Facility and Vehicle Maintenance | Technology Support/Capital Outreach | Mobility management; IT; Call center; Travel training enhancements/improvements; MWRTA applies for competitive funding for this line item and will reduce the RTACAP request upon award of additional federal funds. | 2027 | $200,000 | $40,000 | $0 | $160,000 | $0 | $0 | $0 | $0 |
| RTD0011198 | MWRTA | Transit | RTA Facility and Vehicle Maintenance | Acquisition of Bus Support Equipment/Facilities | Acquire after-market vehicle accessories (i.e., passenger counters, DVR - vehicle recorders, annunciators) | 2027 | $450,000 | $90,000 | $0 | $360,000 | $0 | $0 | $0 | $0 |
| RTD0011199 | MWRTA | Transit | RTA Facility and Vehicle Maintenance | Terminal, Intermodal (Transit) - Framingham Commuter Rail Station (FCRS) | Intermodal at the Framingham Commuter Rail Station (FCRS) enhancements/improvements; MWRTA applies for competitive funding for this line item and will reduce the RTACAP request upon award of additional federal funds. | 2027 | $6,500 | $1,300 | $0 | $5,200 | $0 | $0 | $0 | $0 |
| RTD0011200 | MWRTA | Transit | RTA Vehicle Replacement | 5339 Competitive Revenue Vehicle Replacement - Discretionary | Buy replacement vehicles; 5 E2(a)s | 2027 | $590,639 | $0 | $118,128 | $0 | $0 | $472,511 | $0 | $0 |
| RTD0011201 | MWRTA | Transit | RTA Fleet Upgrades | 2027 Electric Vehicle (EV) Additional Electrification Costs | Modernization fleet electrification - vehicle migration - purchase of paratransit (Type A) electric vehicles. MWRTA is seeking an 8-year migration to fully electric vehicles. This request is supported in MWRTA's TAM to maintain useful life benchmarks of the agency's paratransit fleet and is in support of Gov. Baker's 2020 Transportation and Climate Initiative (TCI). | 2027 | $900,000 | $180,000 | $0 | $0 | $720,000 | $0 | $0 | $0 |
| RTD0011202 | MWRTA | Transit | RTA Vehicle Replacement | Vehicle Replacement - Cutaways #2 of 2 | Vehicle replacement - cutaways #2 of 2 | 2027 | $590,639 | $118,128 | $0 | $0 | $472,511 | $0 | $0 | $0 |
| FFY 2028 | |||||||||||||
| RTD0011195 | MWRTA | Operating | Operating Assistance Non-Fixed Route ADA Paratransit Service | Operating assistance for non-fixed route ADA paratransit service | 2028 | $2,000,000 | $0 | $0 | $1,600,000 | $0 | $0 | $400,000 | $0 |
| RTD0011196 | MWRTA | Transit | RTA Facility and Vehicle Maintenance | Terminal, Intermodal (Transit) - Blandin | MWRTA will utilize these funds to maintain a state-of-good-repair value of at least 3.5 for the operations and administration facility along with all amenities and support equipment located at 15 Blandin Ave, Framingham, MA. | 2028 | $708,125 | $141,625 | $0 | $566,500 | $0 | $0 | $0 | $0 |
| RTD0011197 | MWRTA | Transit | RTA Facility and Vehicle Maintenance | Technology Support/Capital Outreach | Mobility management; IT; Call center; Travel training enhancements/improvements; MWRTA applies for competitive funding for this line item and will reduce the RTACAP request upon award of additional federal funds. | 2028 | $200,000 | $40,000 | $0 | $160,000 | $0 | $0 | $0 | $0 |
| RTD0011198 | MWRTA | Transit | RTA Facility and Vehicle Maintenance | Acquisition of Bus Support Equipment/Facilities | Acquire after-market vehicle accessories (i.e., passenger counters, DVR - vehicle recorders, annunciators) | 2028 | $450,000 | $90,000 | $0 | $360,000 | $0 | $0 | $0 | $0 |
| RTD0011199 | MWRTA | Transit | RTA Facility and Vehicle Maintenance | Terminal, Intermodal (Transit) - Framingham Commuter Rail Station (FCRS) | Intermodal at the Framingham Commuter Rail Station (FCRS) enhancements/improvements; MWRTA applies for competitive funding for this line item and will reduce the RTACAP request upon award of additional federal funds. | 2028 | $6,500 | $1,300 | $0 | $5,200 | $0 | $0 | $0 | $0 |
| RTD0011200 | MWRTA | Transit | RTA Vehicle Replacement | 5339 Competitive Revenue Vehicle Replacement - Discretionary | Buy replacement vehicles; 5 E2(a)s | 2028 | $590,639 | $0 | $118,128 | $0 | $0 | $472,511 | $0 | $0 |
| RTD0011201 | MWRTA | Transit | RTA Fleet Upgrades | 2027 Electric Vehicle (EV) Additional Electrification Costs | Modernization fleet electrification - vehicle migration - purchase of paratransit (Type A) electric vehicles. MWRTA is seeking an 8-year migration to fully electric vehicles. This request is supported in MWRTA's TAM to maintain useful life benchmarks of the agency's paratransit fleet and is in support of Gov. Baker's 2020 Transportation and Climate Initiative (TCI). | 2028 | $900,000 | $180,000 | $0 | $0 | $720,000 | $0 | $0 | $0 |
| RTD0011202 | MWRTA | Transit | RTA Vehicle Replacement | Vehicle Replacement - Cutaways #2 of 2 | Vehicle replacement - cutaways #2 of 2 | 2028 | $590,639 | $118,128 | $0 | $0 | $472,511 | $0 | $0 | $0 |
Table 3-11: FFYs 2024–28 TIP Transit Table (CATA)
| Project Number | RTA | Program | Project Name | Notes | Federal Fiscal Year | Total Cost | Bond Cap | State | 100% State | Federal | FTA | Section 5307 | Other | Municipal and Local | Transit |
| FFY 2024 | |||||||||
| RTD0010579 | CATA | Transit | RTA Facility and Vehicle Maintenance | Preventive Maintenance | Preventive maintenance | 2024 | $356,250 | $0 | $285,000 | $71,250 |
| RTD0010583 | CATA | Transit | RTA Facility and Vehicle Maintenance | Buy Miscellaneous Small Capital Items | Misc. small capital items | 2024 | $15,000 | $15,000 | $0 | $0 |
| RTD0010584 | CATA | Transit | RTA Facility and Vehicle Maintenance | Acquire Shop Equipment/Small Capital Items | Acquisition of shop equipment and miscellaneous capital items for vehicle maintenance facilities. | 2024 | $37,500 | $7,500 | $30,000 | $0 |
| RTD0010587 | CATA | Transit | RTA Facility and Vehicle Maintenance | Repave Administration/Operations Facility Parking Lot | Repave parking lot at administration and operations facility. Lot was last paved in the early 2000s during building rehabilitation. | 2024 | $400,000 | $80,000 | $320,000 | $0 |
| T00073 | CATA | Transit | RTA Facility and Vehicle Maintenance | Rehab/Renovation Administration & Operations Facility | This project is dedicated towards keeping its administration and operations facility in a state of good repair to offer safe and reliable transit services for its community. | 2024 | $50,000 | $50,000 | $0 | $0 |
| FFY 2025 | |||||||||
| RTD0010579 | CATA | Transit | RTA Facility and Vehicle Maintenance | Preventive Maintenance | Preventive maintenance | 2025 | $356,250 | $0 | $285,000 | $71,250 |
| RTD0010583 | CATA | Transit | RTA Facility and Vehicle Maintenance | Buy Miscellaneous Small Capital Items | Misc. small capital items | 2025 | $50,000 | $50,000 | $0 | $0 |
| RTD0010584 | CATA | Transit | RTA Facility and Vehicle Maintenance | Acquire Shop Equipment/Small Capital Items | Acquisition of shop equipment and miscellaneous capital items for vehicle maintenance facilities. | 2025 | $37,500 | $7,500 | $30,000 | $0 |
| RTD0010591 | CATA | Transit | RTA Vehicle Replacement | Revenue Vehicle Replacement | Replacement of vehicles used on fixed route service that have reached the end of their useful life, 3 in 2025 and 4 in 2026. CATA has requested 100% RTACAP funding for this project as CATA receives a small and limited amount of 5307 funds, most of which are dedicated towards Preventive Maintenance leaving a very small amount of capital funds for all other projects. The replacement of these vehicles will allow CATA to maintain a state of good repair for transit vehicles and continue to provide safe and reliable transit services for the community. | 2025 | $1,800,000 | $1,800,000 | $0 | $0 |
| T00073 | CATA | Transit | RTA Facility and Vehicle Maintenance | Rehab/Renovation Administration & Operations Facility | This project is dedicated towards keeping its administration and operations facility in a state of good repair to offer safe and reliable transit services for its community. | 2025 | $50,000 | $50,000 | $0 | $0 |
| FFY 2026 | |||||||||
| RTD0010579 | CATA | Transit | RTA Facility and Vehicle Maintenance | Preventive Maintenance | Preventive maintenance | 2026 | $356,250 | $0 | $285,000 | $71,250 |
| RTD0010583 | CATA | Transit | RTA Facility and Vehicle Maintenance | Buy Miscellaneous Small Capital Items | Misc. small capital items | 2026 | $50,000 | $50,000 | $0 | $0 |
| RTD0010584 | CATA | Transit | RTA Facility and Vehicle Maintenance | Acquire Shop Equipment/Small Capital Items | Acquisition of shop equipment and miscellaneous capital items for vehicle maintenance facilities. | 2026 | $37,500 | $7,500 | $30,000 | $0 |
| RTD0010591 | CATA | Transit | RTA Vehicle Replacement | Revenue Vehicle Replacement | Replacement of vehicles used on fixed route service that have reached the end of their useful life, 3 in 2025 and 4 in 2026. CATA has requested 100% RTACAP funding for this project as CATA receives a small and limited amount of 5307 funds, most of which are dedicated towards Preventive Maintenance leaving a very small amount of capital funds for all other projects. The replacement of these vehicles will allow CATA to maintain a state of good repair for transit vehicles and continue to provide safe and reliable transit services for the community. | 2026 | $1,800,000 | $1,800,000 | $0 | $0 |
| T00073 | CATA | Transit | RTA Facility and Vehicle Maintenance | Rehab/Renovation Administration & Operations Facility | This project is dedicated towards keeping its administration and operations facility in a state of good repair to offer safe and reliable transit services for its community. | 2026 | $50,000 | $50,000 | $0 | $0 |
| FFY 2027 | |||||||||
| RTD0010579 | CATA | Transit | RTA Facility and Vehicle Maintenance | Preventive Maintenance | Preventive maintenance | 2027 | $356,250 | $0 | $285,000 | $71,250 |
| RTD0010583 | CATA | Transit | RTA Facility and Vehicle Maintenance | Buy Miscellaneous Small Capital Items | Misc. small capital items | 2027 | $50,000 | $50,000 | $0 | $0 |
| RTD0010584 | CATA | Transit | RTA Facility and Vehicle Maintenance | Acquire Shop Equipment/Small Capital Items | Acquisition of shop equipment and miscellaneous capital items for vehicle maintenance facilities. | 2027 | $37,500 | $7,500 | $30,000 | $0 |
| T00073 | CATA | Transit | RTA Facility and Vehicle Maintenance | Rehab/Renovation Administration & Operations Facility | This project is dedicated towards keeping its administration and operations facility in a state of good repair to offer safe and reliable transit services for its community. | 2027 | $50,000 | $50,000 | $0 | $0 |
| FFY 2028 | |||||||||
| RTD0010579 | CATA | Transit | RTA Facility and Vehicle Maintenance | Preventive Maintenance | Preventive maintenance | 2028 | $356,250 | $0 | $285,000 | $71,250 |
| RTD0010583 | CATA | Transit | RTA Facility and Vehicle Maintenance | Buy Miscellaneous Small Capital Items | Misc. small capital items | 2028 | $50,000 | $50,000 | $0 | $0 |
| RTD0010584 | CATA | Transit | RTA Facility and Vehicle Maintenance | Acquire Shop Equipment/Small Capital Items | Acquisition of shop equipment and miscellaneous capital items for vehicle maintenance facilities. | 2028 | $37,500 | $7,500 | $30,000 | $0 |
| T00073 | CATA | Transit | RTA Facility and Vehicle Maintenance | Rehab/Renovation Administration & Operations Facility | This project is dedicated towards keeping its administration and operations facility in a state of good repair to offer safe and reliable transit services for its community. | 2028 | $50,000 | $50,000 | $0 | $0 |
DETAILD PROJECT DESCRIPTIONS
Proponent: This field lists the primary advocate for each project, who is responsible for seeing the project through to completion.
ID Number: This number references the project’s identification number in MassDOT’s project-tracking system.
Project Type: This field provides the type of project programmed. For those projects programmed with Regional Target funds (projects listed in Section 1A of the TIP tables), the projects are categorized according to the MPO’s six investment programs (Bicycle and Pedestrian, Complete Streets, Intersection Improvements, Major Infrastructure, Community Connections, and Transit Modernization). For those projects programmed directly by MassDOT (projects listed in Sections 1B, 2A, 2B, 2C, and 3B), MassDOT’s STIP Program categories are applied.
Cost: This figure is the total project cost as programmed in the TIP across all fiscal years, including years outside of FFYs 2024–28.
Funding Source: e funding source indicates whether a project is funded using the MPO’s Regional Target funds or MassDOT’s statewide highway funds.
Scoring Summary: This table shows the number of points awarded to the project across each of the MPO’s project evaluation categories. MPO staff has not evaluated all projects in the TIP; staff only evaluates projects that are being considered for funding with the MPO’s Regional Target funds. The field definitions for the tables are as follows for all projects scored in the MPO’s Bicycle and Pedestrian, Complete Streets, Intersection Improvements, Major Infrastructure, and Transit Modernization investment programs:
Projects within the MPO’s Community Connections Program are scored using different categories, given the unique nature of this program. The field definitions for those tables are as follows:
As mentioned in Chapter 2, the MPO adopted a revised set of project selection criteria in October 2020. These new criteria were used to score new projects under consideration for funding using the MPO’s Regional Target funds for both the FFYs 2022–26 and FFYs 2023–27 TIP cycles. For this reason, the scoring criteria and point allocations vary based on when a project was evaluated for funding and programmed in the TIP. Point allocations are specified for each project, and some project pages feature additional information in this section to provide context for how projects were evaluated. Further details on all of the MPO’s project selection criteria are available in Appendix A.
Project Description: The description of the project is based, in part, on the written description of the project on MassDOT’s Project Information website. In some cases, these descriptions have been modified to clarify the details of the projects. Projects evaluated by the MPO tend to have more detailed descriptions, as more complete project documentation was provided to MPO staff for these projects.
Funding Summary: Funding tables are included for each project and show the following information:
For more information on all projects, please visit MassDOT’s Project Information website, https://hwy.massdot.state.ma.us/projectinfo/projectinfo.asp, the Boston Region MPO’s website, www.bostonmpo.org, or contact Ethan Lapointe, TIP Manager, at TIP@ctps.org.
ACTON: PARKING MANAGEMENT SYSTEM

Proponent: |
Acton |
ID Number: |
S12818 |
Project Type: |
Community Connections |
Cost: |
$15,000 |
Funding Source: |
Regional Target Funds |
Category |
Conn |
Coord |
Plan |
TE |
MS/DP |
FS |
Total |
Score |
9 out of 18 |
0 out of 15 |
6 out of 15 |
8 out of 18 |
6 out of 24 |
0 out of 10 |
29 out of 100 |
This project will implement digital parking management products to improve the efficiency of permitting and en- forcement processes at five commuter parking lots surrounding the MBTA South Acton commuter rail station. These highly utilized lots provide nearly 500 parking spaces. The project will support the transition from a paper-based parking management system to a cloudbased one that will be more convenient for commuters and Acton’s parking management team.
Source |
(FFY) 2024 |
2025 |
2026 |
2027 |
2028 |
Total |
Federal Funds |
$12,000 |
– |
– |
– |
– |
$15,000 |
Non-Federal Funds |
$3,000 |
– |
– |
– |
– |
$3,750 |
Total Funds |
$15,000 |
— |
— |
— |
— |
$18,750 |
ACTON: INTERSECTION AND SIGNAL IMPROVEMENTS ON ROUTES 2 AND 111 (MASSACHUSETTS AVENUE) AT PIPER ROAD AND TAYLOR ROAD
 AT PIPER ROAD AND TAYLOR ROAD")
Proponent: |
MassDOT |
ID Number: |
607748 |
Project Type: |
Intersection Improvements |
Cost: |
$4,382,329 |
Funding Source: |
Statewide Highway Funds |
This is a MassDOT-prioritized project and is therefore not directly evaluated using the MPO’s TIP scoring criteria.
The project will make upgrades at the intersection to improve safety. The upgrades will include signs, pavement markings, and traffic signals as identified through a Road Safety Audit process in the Town of Acton.
Source |
(FFY) 2024 |
2025 |
2026 |
2027 |
2028 |
Total |
Federal Funds |
– |
– |
– |
– |
$3,944,096 |
$3,944,096 |
Non-Federal Funds |
– |
– |
– |
– |
$438,233 |
$438,233 |
Total Funds |
— |
— |
— |
— |
$4,382,329 |
$4,382,329 |
ACTON-BOXBOROUGH-LITTLETON: PAVEMENT PRESERVATION ROUTE 2

Proponent: |
MassDOT |
ID Number: |
610722 |
Project Type: |
Non-Intersate Pavement |
Cost: |
$7,867,299 |
Funding Source: |
Statewide Highway Funds |
This is a MassDOT-prioritized project and is therefore not directly evaluated using the MPO’s TIP scoring criteria.
This project includes pavement preservation work on Route 2 in Acton, Boxborough, and Littleton.
Source |
(FFY) 2024 |
2025 |
2026 |
2027 |
2028 |
Total |
Federal Funds |
– |
$6,293,839 |
– |
– |
– |
$6,293,839 |
Non-Federal Funds |
– |
$1,573,460 |
– |
– |
– |
$1,573,460 |
Total Funds |
– |
$7,867,299 |
— |
— |
— |
$7,867,299 |
ARLINGTON: STRATTON SCHOOL IMPROVEMENTS (SRTS)
-01.png "ARLINGTON: STRATTON SCHOOL IMPROVEMENTS (SRTS)")
Proponent: |
MassDOT |
ID Number: |
609531 |
Project Type: |
Safe Routes to School |
Cost: |
$1,302,209 |
Funding Source: |
State Highway Funds |
This is a MassDOT-prioritized project and is therefore not directly evaluated using the MPO’s TIP scoring criteria.
This project will make upgrades to promote safety along the roadways surrounding Stratton Elementary School in Arlington through the Safe Routes to School program.
Source |
(FFY) 2024 |
2025 |
2026 |
2027 |
2028 |
Total |
Federal Funds |
– |
$1,041,767 |
– |
– |
– |
$1,041,767 |
Non-Federal Funds |
– |
$260,442 |
– |
– |
– |
$260,442 |
Total Funds |
— |
$1,302,209 |
– |
– |
– |
$1,302,209 |
ASHLAND: REHABILITATION AND RAIL CROSSING IMPROVEMENTS ON CHERRY STREET

Proponent: |
Ashland |
ID Number: |
608436 |
Project Type: |
Intersection Improvements |
Cost: |
$1,222,315 |
Funding Source: |
Regional Target Funds, State Highway Funds |
Category |
Safety |
Sys Pres |
CM/M |
CA/SC |
EQUITY |
EV |
Total |
Score |
12 out of 30 |
10 out of 29 |
5 out of 29 |
2 out of 16 |
1 out of 12 |
8 out of 18 |
38 out of 134 |
PROJECT DESCRIPTION
The primary purpose of the project is to improve the safety features for the roadway corridors of Cherry Street and Main Street in order to establish a Federal Railroad Administration Quiet Zone surrounding the railroad crossings on those two roadways. This goal will primarily be accomplished through the installation of roadway medians and the enhancement of existing railroad crossing signals and gates. In addition, the project addresses a critical gap in the pedestrian sidewalk network through the construction of new sidewalks. The project’s other goals include improving the existing roadway condition through pavement reconstruction and enhancing stormwater drainage in the project area. This project includes a $480,000 USDOT earmark.
Source |
(FFY) 2024 |
2025 |
2026 |
2027 |
2028 |
Total |
Federal Funds |
– |
$977,852 |
– |
– |
– |
$977,852 |
Non-Federal Funds |
– |
$244,463 |
– |
– |
– |
$244,463 |
Total Funds |
— |
$1,222,315 |
— |
— |
— |
$1,222,315 |
ASHLAND: BRIDGE REPLACEMENT, A-14-006, CORDAVILLE ROAD OVER SUDBURY RIVER

Proponent: |
MassDOT |
ID Number: |
612099 |
Project Type: |
Bridge |
Cost: |
$3,823,848 |
Funding Source: |
Statewide Highway Funds |
This is a MassDOT-prioritized project and is therefore not directly evaluated using the MPO’s TIP scoring criteria.
This project will replace bridge A-14-006, which carries Cordaville Road over the Sudbury River in Ashland.
Source |
(FFY) 2024 |
2025 |
2026 |
2027 |
2028 |
Total |
Federal Funds |
– |
– |
$3,059,078 |
– |
– |
$3,059,078 |
Non-Federal Funds |
– |
– |
$764,770 |
– |
– |
$764,770 |
Total Funds |
– |
– |
$3,823,848 |
– |
– |
$3,823,848 |
BELMONT: COMMUNITY PATH,BELMONT COMPONENT OF THE MCRT (PHASE 1)
")
Proponent: |
Belmont |
ID Number: |
609204 |
Project Type: |
Bicycle and Pedestrian |
Cost: |
$21,288,202 |
Funding Source: |
Regional Target Funds |
Category |
Safety |
Sys Pres |
CM/M |
CA/SC |
EQUITY |
EV |
Total |
Score |
15 out of 20 |
8 out of 14 |
18 out of 18 |
7 out of 14 |
7.6 out of 20 |
9 out of 14 |
64.6 out of 100 |
This project will construct the Belmont Community Path between the existing Fitchburg Cutoff Path and Belmont Center, creating a direct off-street connection between the heart of Belmont, the Alewife MBTA station, and destinations beyond in Cambridge, Somerville, and Boston. The project proposes a 12-foot paved facility with two-foot grass shoulders and additional landscaping along the length of the path that will buffer the new facility from the adjacent railroad tracks and neighboring properties. The project includes an underpass beneath the commuter rail tracks at Channing Road and Alexander Avenue to provide a safe connection between the Winnbrook neighborhood that lies on the north side of the tracks with the bike lanes on Concord Avenue and the adjacent new school serving students in grades 7-12.
Source |
(FFY) 2024 |
2025 |
2026 |
2027 |
2028 |
Total |
Federal Funds |
– |
– |
$17,030,562 |
– |
– |
$17,030,562 |
Non-Federal Funds |
– |
– |
$4,257,640 |
– |
– |
$4,257,640 |
Total Funds |
— |
— |
$21,288,202 |
— |
— |
$21,288,202 |
BIKESHARE STATE OF GOOD REPAIR SET-ASIDE

Proponent: |
CTPS |
ID Number: |
S12820 |
Project Type: |
Community Connections |
Cost: |
$6,000,000 |
Funding Source: |
Regional Target Funds |
This line item sets aside funding to support Bikeshare investments within the Community Connections program. Example uses of this set-aside include bikeshare system expansion, as well as replacement and upgrades to existing stations.
Source |
(FFY) 2024 |
2025 |
2026 |
2027 |
2028 |
Total |
Federal Funds |
– |
$1,000,000 |
$1,000,000 |
$2,000,000 |
$2,000,000 |
$6,000,000 |
Non-Federal Funds |
– |
– |
– |
– |
– |
– |
Total Funds |
— |
$1,000,000 |
$1,000,000 |
$2,000,000 |
$2,000,000 |
$6,000,000 |
BOLTON, BOXBOROUGH, LITTLETON, STOW: MONTACHUSETT RTA MICROTRANSIT SERVICE

Proponent: |
Montachusett RTA |
ID Number: |
S12703 |
Project Type: |
Community Connections |
Cost: |
$1,316,061 |
Funding Source: |
Regional Target Funds |
Category |
Conn |
Coord |
Plan |
TE |
MS/DP |
FS |
Total |
Score |
7 out of 18 |
15 out of 15 |
3 out of 15 |
6 out of 18 |
16 out of 24 |
10 out of 10 |
57 out of 100 |
This project will establish an on-demand microtransit service for the towns of Bolton, Boxborough, Littleton, and Stow, to be operated by the Montachusett Regional Transit Authority (MART). The primary goals of the project are to connect residents to employment centers and activity hubs in the region while providing a low-cost transportation alternative to single-occupancy vehicles. The service will utilize MART’s existing vehicle fleet and will allow riders to book trips through a mobile app. This project was funded through the FFY23 round of grants through the MPO's Community Connections Program, and was funded with $479,066 in that year.
Source |
(FFY) 2024 |
2025 |
2026 |
2027 |
2028 |
Total |
Federal Funds |
$344,283 |
$325,313 |
– |
– |
– |
$669,596 |
Non-Federal Funds |
$86,071 |
$81,328 |
– |
– |
– |
$167,399 |
Total Funds |
$430,354 |
$406,641 |
— |
— |
— |
$836,995 |
BOSTON: BRIDGE PRESERVATION, B-16-066 (38D), CAMBRIDGE STREET OVER MBTA
, CAMBRIDGE STREET OVER MBTA")
Proponent: |
Boston |
ID Number: |
612989 |
Project Type: |
Complete Streets |
Cost: |
$16,632,000 |
Funding Source: |
Regional Target Funds |
Category |
Safety |
Sys Pres |
CM/M |
CA/SC |
EQUITY |
EV |
Total |
Score |
5 out of 30 |
15 out of 29 |
12.5 out of 29 |
4.5 out of 16 |
5.9 out of 12 |
10.25 out of 18 |
53.2 out of 134 |
PROJECT DESCRIPTION
The project replaces the deck of the Cambridge Street Bridge in Boston’s Charlestown neighborhood, which is a key connector traversing both MBTA Orange Line and Commuter Rail and Amtrak rail service in addition to travel under- neath Interstate 93. This state-of-good-repair investment improves multimodal accessibility with upgraded pedes- trian and bicycle facilities in addition to a new westbound bus lane for improved bus connections between Sullivan Square, Charlestown, and Somerville.
Source |
(FFY) 2024 |
2025 |
2026 |
2027 |
2028 |
Total |
Federal Funds |
– |
– |
$13,305,600 |
– |
– |
$13,305,600 |
Non-Federal Funds |
– |
– |
$3,326,400 |
– |
– |
$3,326,400 |
Total Funds |
— |
— |
$16,632,000 |
— |
— |
$16,632,000 |
BOSTON: BRIDGE RECONSTRUCTION/ REHABILITATION, B-16-181, WEST ROXBURY PARKWAY OVER MBTA

Proponent: |
MassDOT |
ID Number: |
606902 |
Project Type: |
Bridge |
Cost: |
$8,889,831 |
Funding Source: |
Statewide Highway Funds |
This is a MassDOT-prioritized project and is therefore not directly evaluated using the MPO’s TIP scoring criteria.
This project will involve the reconstruction of bridge B-16-181, which carries West Roxbury Parkway over the MBTA Needham commuter rail line.
Source |
(FFY) 2024 |
2025 |
2026 |
2027 |
2028 |
Total |
Federal Funds |
$7,111,865 |
– |
– |
– |
– |
$7,111,865 |
Non-Federal Funds |
$1,777,966 |
– |
– |
– |
– |
$1,777,966 |
Total Funds |
$8,889,831 |
— |
— |
– |
– |
$8,889,831 |
BOSTON: BRIDGE REHABILITATION, B-16-107, CANTERBURY STREET OVER AMTRAK RAILROAD
Proponent: |
MassDOT |
ID Number: |
608197 |
Project Type: |
Bridge |
Cost: |
$4,504,926 |
Funding Source: |
Statewide Highway Funds |
This is a MassDOT-prioritized project and is therefore not directly evaluated using the MPO’s TIP scoring criteria.
This project will replace the superstructure of bridge B-16-107, which carries Canterbury Street over the Amtrak/MBTA tracks.
Source |
(FFY) 2024 |
2025 |
2026 |
2027 |
2028 |
Total |
Federal Funds |
– |
$3,603,941 |
– |
– |
– |
$3,603,941 |
Non-Federal Funds |
– |
$900,985 |
– |
– |
– |
$900,985 |
Total Funds |
– |
$4,504,926 |
– |
– |
– |
$4,504,926 |
BOSTON: BRIDGE REPLACEMENT, B-16-165, BLUE HILL AVENUE OVER RAILROAD

Proponent: |
MassDOT |
ID Number: |
612519 |
Project Type: |
Bridge |
Cost: |
$34,766,041 |
Funding Source: |
Statewide Highway Funds |
This is a MassDOT-prioritized project and is therefore not directly evaluated using the MPO’s TIP scoring criteria.
This project will replace bridge B-16-165, which carries Blue Hill Avenue over the MBTA Fairmount and Franklin commuter rail lines in Boston.
Source |
(FFY) 2024 |
2025 |
2026 |
2027 |
2028 |
Total |
Federal Funds |
– |
– |
– |
$27,812,833 |
– |
$27,812,833 |
Non-Federal Funds |
– |
– |
– |
$6,953,208 |
– |
$6,953,208 |
Total Funds |
– |
– |
– |
$34,766,041 |
– |
$34,766,041 |
BOSTON: BRIDGE PRESERVATION, B-16-236 (39M, 39P, 39U, 39W, 39Y), 5 BRIDGES CARRYING STATE ROUTE 1A (EAST BOSTON EXPRESSWAY NB/SB) AND RAMPS
, 5 BRIDGES CARRYING STATE ROUTE 1A (EAST BOSTON EXPRESSWAY NB/SB) AND RAMPS")
Proponent: |
MassDOT |
ID Number: |
613209 |
Project Type: |
Bridge |
Cost: |
$6,525,000 |
Funding Source: |
Statewide Highway Funds |
This is a MassDOT-prioritized project and is therefore not directly evaluated using the MPO’s TIP scoring criteria.
Bridge preservation of five structures in Boston carrying Route 1A (East Boston Expressway NB/SB) and ramps.
Source |
(FFY) 2024 |
2025 |
2026 |
2027 |
2028 |
Total |
Federal Funds |
$1,305,000 |
– |
– |
– |
– |
$1,305,000 |
Non-Federal Funds |
$5,220,000 |
– |
– |
– |
– |
$5,220,000 |
Total Funds |
$6,525,000 |
– |
– |
– |
– |
$6,525,000 |
BOSTON: DECK/SUPERSTRUCTURE REPLACEMENT OF BRIDGE B-16-051(4T5), MASS AVENUE OVER I-90 & MBTA (STRUCTURE 54, MILE 132.84)
, MASS AVENUE OVER I-90 & MBTA (STRUCTURE 54, MILE 132.84)")
Proponent: |
MassDOT |
ID Number: |
613125 |
Project Type: |
Bridge |
Cost: |
$15,718,122 |
Funding Source: |
Statewide Highway Funds |
This is a MassDOT-prioritized project and is therefore not directly evaluated using the MPO’s TIP scoring criteria.
This project will perform deck and superstructure replacement of Bridge B–16–051(4T5), Massachusetts Avenue over Interstate 90 and MBTA Commuter Rail near Hynes Convention Center Station.
Source |
(FFY) 2024 |
2025 |
2026 |
2027 |
2028 |
Total |
Federal Funds |
– |
– |
– |
– |
$12,574,498 |
$12,574,498 |
Non-Federal Funds |
– |
– |
– |
– |
$3,143,624 |
$3,143,624 |
Total Funds |
– |
– |
– |
– |
$15,718,122 |
$15,718,122 |
BOSTON: DECK/SUPERSTRUCTURE REPLACEMENT, B-16-054 (4T2), BEACON STREET OVER I-90 (STRUCTURE 50, MILE 132.2)
![]()
Proponent: |
MassDOT |
ID Number: |
613125 |
Project Type: |
Bridge |
Cost: |
$42,295,604 |
Funding Source: |
Statewide Highway Funds |
This is a MassDOT-prioritized project and is therefore not directly evaluated using the MPO’s TIP scoring criteria.
This project will perform deck and superstructure replacement of Bridge B–16–054(4T2), Beacon Street over Interstate 90 and MBTA Commuter Rail near Landsdowne Station.
Source |
(FFY) 2024 |
2025 |
2026 |
2027 |
2028 |
Total |
Federal Funds |
– |
– |
– |
– |
$33,836,483 |
$33,836,483 |
Non-Federal Funds |
– |
– |
– |
– |
$8,459,121 |
$8,459,121 |
Total Funds |
– |
– |
– |
– |
$42,295,604 |
$42,295,604 |
BOSTON: BRIDGE REPLACEMENT B-16-365-STORROW DRIVE OVER BOWKER RAMPS

Proponent: |
Boston |
ID Number: |
606728 |
Project Type: |
Major Infrastructure |
Cost: |
$112,056,000 |
Funding Source: |
Statewide Highway Funds |
This is a MassDOT-prioritized project and is therefore not directly evaluated using the MPO’s TIP scoring criteria.
This project will replace bridge B-16-365, which carries Storrow Drive over the Bowker Ramps and Muddy River in Boston. This bridge is currently listed as structurally deficient and has posted vehicle weight restrictions due to its poor condition. The funding for this project is anticipated to continue into 2029
Source |
(FFY) 2024 |
2025 |
2026 |
2027 |
2028 |
Total |
Federal Funds |
– |
– |
– |
$8,381,764 |
$32,060,780 |
$40,442,544 |
Non-Federal Funds |
– |
– |
– |
$2,095,441 |
$8,015,195 |
$10,110,636 |
Total Funds |
— |
— |
— |
$10,478,205 |
$40,075,975 |
$112,056,000 |
BOSTON: ELECTRIC BLUEBIKES ADOPTION

Proponent: |
Boston |
ID Number: |
S12823 |
Project Type: |
Community Connections |
Cost: |
$1,020,000 |
Funding Source: |
Regional Target Funds |
Category |
Conn |
Coord |
Plan |
TE |
MS/DP |
FS |
Total |
Score |
17 out of 18 |
15 out of 15 |
6 out of 15 |
9 out of 18 |
24 out of 24 |
10 out of 10 |
81 out of 100 |
Purchase of 272 electric bikes (e-bikes) and 136 spare batteries for the City of Boston’s Bluebikes network
Source |
(FFY) 2024 |
2025 |
2026 |
2027 |
2028 |
Total |
Federal Funds |
$816,000 |
– |
– |
– |
– |
$1,020,000 |
Non-Federal Funds |
$204,000 |
– |
– |
– |
– |
$255,000 |
Total Funds |
$1,020,000 |
— |
— |
— |
— |
$1,275,000 |
BOSTON: IMPROVEMENT ON BOYLSTON STREET, FROM INTERSECTION OF BROOKLINE AVENUE & PARK DRIVE TO IPSWICH STREET

Proponent: |
Boston |
ID Number: |
606453 |
Project Type: |
Complete Streets |
Cost: |
$8,665,052 |
Funding Source: |
Regional Target Funds |
Category |
Safety |
Sys Pres |
CM/M |
CA/SC |
EQUITY |
EV |
Total |
Score |
7 out of 30 |
6 out of 29 |
15 out of 29 |
12 out of 16 |
8 out of 12 |
12 out of 18 |
60 out of 134 |
This roadway improvement project will enhance safety and mobility for people walking and biking along the Boylston Street corridor. Short-term improvements are planned by the City of Boston in the fall of 2021 to provide a mix of buffered and park- ing-protected bicycle lanes on Boylston Street between Park Drive and Ipswich Street. This project will formalize these improve- ments while also improving traffic signals and crosswalks, replacing street lighting, and reconstructing sidewalks and ramps to achieve ADA compliance throughout the corridor. This project will also construct additional improvements to the Muddy River crossing at the western end of the corridor, including along Park Drive to the Landmark Center driveway and at the intersection of Brookline Avenue and Pilgrim Road. These improvements will include the addition of segments of separated bicycle lanes and cycle track, improved signals and crosswalks, and reconstructed sidewalks to shorten pedestrian crossings.
Source |
(FFY) 2024 |
2025 |
2026 |
2027 |
2028 |
Total |
Federal Funds |
– |
$6,932,042 |
– |
– |
– |
$6,932,042 |
Non-Federal Funds |
– |
$1,733,010 |
– |
– |
– |
$1,733,010 |
Total Funds |
— |
$8,665,052 |
— |
— |
— |
$8,665,052 |
BOSTON: RECONSTRUCTION OF RUTHERFORD AVENUE, FROM CITY SQUARE TO SULLIVAN SQUARE

Proponent: |
Boston |
ID Number: |
606226 |
Project Type: |
Major Infrastructure |
Cost: |
$197,759,449 |
Funding Source: |
Regional Target Funds |
This project is funded using Regional Target funds, but was not scored using the MPO’s TIP project selection criteria. The project was evaluated through the MPO’s Long-Range Transportation Plan process.
The reconstruction of Rutherford Avenue from City Square to Sullivan Square will make the road a multimodal urban boulevard corridor. This project will be funded over five years, starting in FFY 2027. The total project cost is estimat- ed to be $197,759,449 and the total funding in the FFYs 2024-28 TIP is $42,100,000. The City of Boston will contribute $25,000,000 in local funding towards the project.
Source |
(FFY) 2024 |
2025 |
2026 |
2027 |
2028 |
Total |
Federal Funds |
– |
– |
– |
$6,880,000 |
$26,800,000 |
$33,680,000 |
Non-Federal Funds |
– |
– |
– |
$1,720,000 |
$6,700,000 |
$8,420,000 |
Total Funds |
— |
— |
— |
$8,600,000 |
$33,500,000 |
$42,100,000 |
BOSTON: ELLIS ELEMENTARY TRAFFIC CALMING (SRTS)
")
Proponent: |
MassDOT |
ID Number: |
610537 |
Project Type: |
Safe Routes to School |
Cost: |
$2,737,728 |
Funding Source: |
Statewide Highway Funds |
This is a MassDOT-prioritized project and is therefore not directly evaluated using the MPO’s TIP scoring criteria.
This project will make upgrades to promote safety along the roadways surrounding Ellis Elementary School in Boston through the Safe Routes to School program. The project proposes traffic-calming measures throughout the project area, including speed humps and curb extensions at several locations. Along Humboldt Avenue, the project proposes signal timing adjustments, the addition of bicycle lanes, and the installation of bus bulbs and a crosswalk at the intersection of Humboldt Avenue and Monroe Street. Raised intersection treatments are also proposed at three locations along Walnut Avenue.
Source |
(FFY) 2024 |
2025 |
2026 |
2027 |
2028 |
Total |
Federal Funds |
– |
– |
$2,190,182 |
– |
– |
$2,190,182 |
Non-Federal Funds |
– |
– |
$547,546 |
– |
– |
$547,546 |
Total Funds |
– |
– |
$2,737,728 |
– |
– |
$2,737,728 |
BOSTON: GUIDE AND TRAFFIC SIGN REPLACEMENT ON I-90/I-93 WITHIN CENTRAL ARTERY/TUNNEL SYSTEM

Proponent: |
MassDOT |
ID Number: |
611954 |
Project Type: |
Safety Improvements |
Cost: |
$2,423,736 |
Funding Source: |
Statewide Highway Funds |
This is a MassDOT-prioritized project and is therefore not directly evaluated using the MPO’s TIP scoring criteria.
This project involves the replacement of guide and traffic signs on Interstate 93 and Interstate 90 within the Central Artery/Tunnel system, including applicable signing on intersecting secondary roadways. The project covers approximately six miles along Interstate 90 (mile markers 132 to 138) and five miles along Interstate 93 (mile markers 15 to 20). The project area includes the Ted Williams Tunnel from the Interstate 90 terminus in East Boston westbound to the Brookline/Boston city line east of St. Mary’s Street. The project area along Interstate 93 runs between Southhampton Street north to the Mystic Avenue off ramp.
Source |
(FFY) 2024 |
2025 |
2026 |
2027 |
2028 |
Total |
Federal Funds |
– |
– |
$2,181,362 |
– |
– |
$2,181,362 |
Non-Federal Funds |
– |
– |
$242,374 |
– |
– |
$242,374 |
Total Funds |
– |
– |
$2,423,736 |
– |
– |
$2,423,736 |
BOSTON: GALLIVAN BOULEVARD (ROUTE 203) SAFETY IMPROVEMENTS, FROM WASHINGTON STREET TO GRANITE AVENUE
 SAFETY IMPROVEMENTS, FROM WASHINGTON STREET TO GRANITE AVENUE")
Proponent: |
MassDOT |
ID Number: |
610650 |
Project Type: |
Safety Improvements |
Cost: |
$6,440,000 |
Funding Source: |
Regional Target Funds |
This is a MassDOT-prioritized project and is therefore not directly evaluated using the MPO’s TIP scoring criteria.
his project will implement safety measures for all users along Route 203, Gallivan Boulevard from Washington Street to Granite Avenue in Boston.
Source |
(FFY) 2024 |
2025 |
2026 |
2027 |
2028 |
Total |
Federal Funds |
– |
– |
– |
$5,796,000 |
– |
$5,796,000 |
Non-Federal Funds |
– |
– |
– |
$644,000 |
– |
$644,000 |
Total Funds |
– |
– |
– |
$6,440,000 |
— |
$6,440,000 |
BOSTON: COLUMBUS AVE BUS LANE PHASE II

Proponent: |
MBTA |
ID Number: |
S12822 |
Project Type: |
Transit Modernization |
Cost: |
$11,750,000 |
Funding Source: |
Regional Target Funds |
This is an MBTA-prioritized project and is therefore not direclty evaluated using the MPO's TIP scoring criteria.
Building on Phase 1, Phase 2 of the Columbus Avenue Bus Lanes project includes bus-only lanes, transit signal pri- ority, improvements to bus stops and shelters along Columbus Ave. and Tremont St., and enhanced pedestrian and bicycle connections into MBTA Orange Line stations at Jackson Square, Roxbury Crossing, and Ruggles. New project elements include green infrastructure to promote traffic calming and reduce impervious surfaces.
Source |
(FFY) 2024 |
2025 |
2026 |
2027 |
2028 |
Total |
Federal Funds |
$9,400,000 |
– |
– |
– |
– |
$9,400,000 |
Non-Federal Funds |
$2,350,000 |
– |
– |
– |
– |
$2,350,000 |
Total Funds |
$11,750,000 |
— |
— |
— |
— |
$11,750,000 |
BOSTON: JACKSON SQUARE STATION: ACCESSIBILITY IMPROVEMENTS

Proponent: |
MBTA |
ID Number: |
S12819 |
Project Type: |
Transit Modernization |
Cost: |
$26,250,000 |
Funding Source: |
Regional Target Funds |
This is an MBTA-prioritized project and is therefore not direclty evaluated using the MPO's TIP scoring criteria.
Includes construction of new elevator, modernization of existing elevator, lighting improvements, and various state of good repair improvements to the station.
Source |
(FFY) 2024 |
2025 |
2026 |
2027 |
2028 |
Total |
Federal Funds |
$9,800,000 |
$11,200,000 |
– |
– |
– |
$21,000,000 |
Non-Federal Funds |
$2,450,000 |
$2,800,000 |
– |
– |
– |
$5,250,000 |
Total Funds |
$12,250,000 |
$14,000,00 |
— |
— |
— |
$26,250,000 |
BRAINTREE-WEYMOUTH: RESURFACING AND RELATED WORK ON ROUTE 3

Proponent: |
MassDOT |
ID Number: |
612050 |
Project Type: |
Non-Interstate Pavement |
Cost: |
$8,277,930 |
Funding Source: |
Statewide Highway Funds |
This is a MassDOT-prioritized project and is therefore not directly evaluated using the MPO’s TIP scoring criteria.
This project includes resurfacing and related work on Route 3 in Braintree and Weymouth. The project’s extents run from mile marker 37.7 to mile marker 41.8 for a total of 4.1 miles, or from the Weymouth/Hingham town line to Union Street in Braintree.
Source |
(FFY) 2024 |
2025 |
2026 |
2027 |
2028 |
Total |
Federal Funds |
– |
– |
$6,622,344 |
– |
– |
$6,622,344 |
Non-Federal Funds |
– |
– |
$1,655,586 |
– |
– |
$1,655,586 |
Total Funds |
– |
– |
$8,277,930 |
– |
– |
$8,277,930 |
BROOKLINE: REHABILITATION OF WASHINGTON STREET

Proponent: |
Brookline |
ID Number: |
610932 |
Project Type: |
Complete Streets |
Cost: |
$28,995,267 |
Funding Source: |
Regional Target Funds |
Category |
Safety |
Sys Pres |
CM/M |
CA/SC |
EQUITY |
EV |
Total |
Score |
14 out of 18 |
13 out of 20 |
11 out of 18 |
7 out of 12 |
7.4 out of 20 |
10 out of 12 |
62.4 out of 100 |
This project will reconstruct Washington Street in Brookline between Boylston Street and Beacon Street. Washington Street is currently constrained, with a narrow right of way that accommodates two lanes of traffic, on-street parking in both directions, bicycling, and significant volumes of pedestrians. Sidewalks are currently in poor condition, and the area contains two HSIP bicy- cle crash clusters and one pedestrian crash cluster. The project will reconstruct sidewalks along both sides of the entire corridor and will provide protected bicycle facilities in both directions that are separated from vehicular traffic for a vast majority of the corridor. Other multimodal improvements include the provision of dedicated bus pull-out space outside of the travel lanes. The project will also replace the existing signals along Washington Street’s length and will reconstruct the roadway surface.
Source |
(FFY) 2024 |
2025 |
2026 |
2027 |
2028 |
Total |
Federal Funds |
– |
– |
– |
$23,196,214 |
– |
$23,196,214 |
Non-Federal Funds |
– |
– |
– |
$5,799,053 |
– |
$5,799,053 |
Total Funds |
— |
— |
— |
$28,995,267 |
— |
$28,995,267 |
BROOKLINE: IMPROVEMENTS AT WILLIAM H. LINCOLN SCHOOL (SRTS)
.png "BROOKLINE: IMPROVEMENTS AT WILLIAM H. LINCOLN SCHOOL (SRTS)")
Proponent: |
MassDOT |
ID Number: |
612816 |
Project Type: |
Safe Routes to School |
Cost: |
$886,526 |
Funding Source: |
Statewide Highway Funds |
This is a MassDOT-prioritized project and is therefore not directly evaluated using the MPO’s TIP scoring criteria.
This project will make upgrades to promote safety along the roadways surrounding William H. Lincoln School in Brookline through the Safe Routes to School program. The Project will improve pedestrian and bicycle safety and access improvements on the one-way portion of Chestnut Street, including the installation of a two-way protected bike lane, new sidewalks, new ADA-compliant wheelchair ramps, related pavement markings, and signage. On Kennard Road, the project will construct a new raised intersection, crosswalks, ADA-compliant wheelchair ramps, related pavement markings, and signage at the school driveway to reduce motor vehicle speed and improve pedestrian safety and access.
Source |
(FFY) 2024 |
2025 |
2026 |
2027 |
2028 |
Total |
Federal Funds |
– |
– |
$709,221 |
– |
– |
$709,221 |
Non-Federal Funds |
– |
– |
$177,305 |
– |
– |
$177,305 |
Total Funds |
– |
– |
$886,526 |
– |
– |
$886,526 |
BURLINGTON: IMPROVEMENTS AT I-95 (ROUTE 128)/ROUTE 3 INTERCHANGE
/ROUTE 3 INTERCHANGE")
Proponent: |
MassDOT |
ID Number: |
609516 |
Project Type: |
Complete Streets |
Cost: |
$3,498,560 |
Funding Source: |
Statewide Highway Funds |
This is a MassDOT-prioritized project and is therefore not directly evaluated using the MPO’s TIP scoring criteria.
This project will make improvements to the interchange at Interstate 95 (Route 128) and Route 3 in Burlington.
Source |
(FFY) 2024 |
2025 |
2026 |
2027 |
2028 |
Total |
Federal Funds |
– |
$2,798,848 |
– |
– |
– |
$2,798,848 |
Non-Federal Funds |
– |
$699,712 |
– |
– |
– |
$699,712 |
Total Funds |
– |
$3,498,560 |
– |
– |
– |
$3,498,560 |
BURLINGTON- LYNNFIELD- WAKEFIELD- WOBURN: BRIDGE PRESERVATION OF 10 BRIDGES CARRYING I-95

Proponent: |
MassDOT |
ID Number: |
613196 |
Project Type: |
Bridge |
Cost: |
$3,999,600 |
Funding Source: |
Statewide Highway Funds |
This is a MassDOT-prioritized project and is therefore not directly evaluated using the MPO’s TIP scoring criteria.
Bridge preservation of 10 reinforced concrete frame bridges in Burlington, Lynnfield, Wakefield, and Woburn to include concrete patching and railing upgrades.
Source |
(FFY) 2024 |
2025 |
2026 |
2027 |
2028 |
Total |
Federal Funds |
$3,199,680 |
– |
– |
– |
– |
$3,199,680 |
Non-Federal Funds |
$799,920 |
– |
– |
– |
– |
$799,920 |
Total Funds |
$3,999,600 |
– |
– |
– |
– |
$3,999,600 |
CAMBRIDGE: SUPERSTRUCTURE REPLACEMENT, C-01-031, US ROUTE 3/ROUTE 16/ROUTE 2 OVER MBTA REDLINE

Proponent: |
MassDOT |
ID Number: |
610776 |
Project Type: |
Bridge |
Cost: |
$6,604,208 |
Funding Source: |
Statewide Highway Funds |
This is a MassDOT-prioritized project and is therefore not directly evaluated using the MPO’s TIP scoring criteria.
This project will rehabilitate bridge C-01-031 in Cambridge.
Source |
(FFY) 2024 |
2025 |
2026 |
2027 |
2028 |
Total |
Federal Funds |
– |
$5,283,366 |
– |
– |
– |
$5,283,366 |
Non-Federal Funds |
– |
$1,320,842 |
– |
– |
– |
$1,320,842 |
Total Funds |
– |
$6,604,208 |
– |
– |
– |
$6,604,208 |
CAMBRIDGE: BRIDGE REPLACEMENT, FIRST STREET BRIDGE AND LAND BOULEVARD BRIDGE/BROAD CANAL BRIDGE

Proponent: |
MassDOT |
ID Number: |
606449 |
Project Type: |
Bridge |
Cost: |
$14,364,000 |
Funding Source: |
Statewide Highway Funds |
This is a MassDOT-prioritized project and is therefore not directly evaluated using the MPO’s TIP scoring criteria.
This project will replace bridge C-01-008, which carries First Street over Broad Canal, and bridge C-01-040, which carries Land Boulevard over Broad Canal, in Cambridge. Both bridges are currently listed as structurally deficient and has posted load restrictions due to their poor condition.
Source |
(FFY) 2024 |
2025 |
2026 |
2027 |
2028 |
Total |
Federal Funds |
– |
– |
$11,491,200 |
– |
– |
$11,491,200 |
Non-Federal Funds |
– |
– |
$2,872,800 |
– |
– |
$2,872,800 |
Total Funds |
– |
– |
$14,364,000 |
– |
– |
$14,364,000 |
CAMBRIDGE: ELECTRIC BLUEBIKES ADOPTION

Proponent: |
Cambridge |
ID Number: |
S12824 |
Project Type: |
Community Connections |
Cost: |
$352,575 |
Funding Source: |
Regional Target Funds |
Category |
Conn |
Coord |
Plan |
TE |
MS/DP |
FS |
Total |
Score |
14 out of 18 |
9 out of 15 |
12 out of 15 |
6 out of 18 |
21 out of 24 |
10 out of 10 |
72 out of 100 |
Purchase of 90 new e-bikes and 45 spare batteries for the City of Cambridge’s Bluebikes network.
Source |
(FFY) 2024 |
2025 |
2026 |
2027 |
2028 |
Total |
Federal Funds |
$282,060 |
– |
– |
– |
– |
$352,575 |
Non-Federal Funds |
$70,515 |
– |
– |
– |
– |
$88,144 |
Total Funds |
$352,575 |
— |
— |
— |
— |
$440,719 |
CANTON-MILTON: ROADWAY RECONSTRUCTION ON ROUTE 138, FROM ROYALL STREET TO DOLLAR LANE

Proponent: |
MassDOT |
ID Number: |
612615 |
Project Type: |
Roadway Reconstruction |
Cost: |
$19,435,808 |
Funding Source: |
Statewide Highway Funds |
This is a MassDOT-prioritized project and is therefore not directly evaluated using the MPO’s TIP scoring criteria.
This project will make improvements to a 1.7-mile segment of Route 138 between Royall Street in Canton and Dollar Lane in Milton. The primary focus of the project is the addition of a shared-use path along the eastern side of the roadway, along with the reconstructing of existing sidewalks along the western side of the corridor. The intersection at Route 138 and Dollar Lane will be reconstructed to improve turn lanes and signals in an effort to enhance safety, as this location was identified as a 2017–2019 top-200 crash location statewide.
Source |
(FFY) 2024 |
2025 |
2026 |
2027 |
2028 |
Total |
Federal Funds |
– |
– |
– |
$15,548,646 |
– |
$15,548,646 |
Non-Federal Funds |
– |
– |
– |
$3,887,162 |
– |
$3,887,162 |
Total Funds |
– |
– |
– |
$19,435,808 |
– |
$19,435,808 |
CANTON: CENTER BICYCLE RACKS AND LANES

Proponent: |
Canton |
ID Number: |
S12806 |
Project Type: |
Community Connections |
Cost: |
$10,000 |
Funding Source: |
Regional Target Funds |
Category |
Conn |
Coord |
Plan |
TE |
MS/DP |
FS |
Total |
Score |
6 out of 18 |
2 out of 15 |
9 out of 15 |
59 out of 18 |
22 out of 24 |
10 out of 10 |
58 out of 100 |
This project will purchase and install bicycle racks in Downtown Canton to provide for additional bicycle parking near MBTA commuter rail facilities.
Source |
(FFY) 2024 |
2025 |
2026 |
2027 |
2028 |
Total |
Federal Funds |
$8,000 |
– |
– |
– |
– |
$8,000 |
Non-Federal Funds |
$2,000 |
– |
– |
– |
– |
$2,000 |
Total Funds |
$10,000 |
— |
— |
— |
— |
$10,500 |
CANTON: BRIDGE REPLACEMENT, C-02-042, REVERE COURT OVER WEST BRANCH OF THE NEPONSET RIVER

Proponent: |
MassDOT |
ID Number: |
609438 |
Project Type: |
Bridge |
Cost: |
$2,328,651 |
Funding Source: |
Statewide Highway Funds |
This is a MassDOT-prioritized project and is therefore not directly evaluated using the MPO’s TIP scoring criteria.
This project will replace bridge C-02-042, which carries Revere Court over the west branch of the Neponset River.
Source |
(FFY) 2024 |
2025 |
2026 |
2027 |
2028 |
Total |
Federal Funds |
$1,862,921 |
– |
– |
– |
– |
$1,862,921 |
Non-Federal Funds |
$465,730 |
– |
– |
– |
– |
$465,730 |
Total Funds |
$2,328,651 |
– |
– |
– |
– |
$2,328,651 |
CANTON: PUBLIC SCHOOLS BIKE PROGRAM

Proponent: |
Canton |
ID Number: |
S12805 |
Project Type: |
Community Connections |
Cost: |
$22,500 |
Funding Source: |
Regional Target Funds |
Category |
Conn |
Coord |
Plan |
TE |
MS/DP |
FS |
Total |
Score |
6 out of 18 |
2 out of 15 |
9 out of 15 |
59 out of 18 |
22 out of 24 |
10 out of 10 |
58 out of 100 |
This project will install new bicycle racks at three public elementary schools, one middle school, and one high school in Canton.
Source |
(FFY) 2024 |
2025 |
2026 |
2027 |
2028 |
Total |
Federal Funds |
$18,000 |
– |
– |
– |
– |
$18,000 |
Non-Federal Funds |
$4,500 |
– |
– |
– |
– |
$4,500 |
Total Funds |
$22,500 |
— |
— |
— |
— |
$22,500 |
![]()
CANTON: ROYALL STREET SHUTTLE

Proponent: |
Canton |
ID Number: |
S12114 |
Project Type: |
Community Connections |
Cost: |
$534,820 |
Funding Source: |
Regional Target Funds |
This project received a total score of 51 points when evaluated using the criteria for the pilot round of the MPO’s Community Connections Program. These criteria are listed in Table A-11.
This project will establish a shuttle service connecting Canton’s Royall Street employment cluster with the MBTA Route 128 commuter rail station and Ashmont, Mattapan Trolley, and Quincy Adams rapid transit stations. The goal of the project is to improve access to employment centers and major transit hubs by providing peak hour shuttle services for commuters and residents. The map above shows one of three planned routes for the shuttle, the precise details of which are under development. Funding for this project began in FFYs 2022 and continued into 2023 with $386,278 allocated in prior TIP years for allocation.
Source |
(FFY) 2024 |
2025 |
2026 |
2027 |
2028 |
Total |
Federal Funds |
$118,834 |
– |
– |
– |
– |
$260,576 |
Non-Federal Funds |
$29,708 |
– |
– |
– |
– |
$65,215 |
Total Funds |
$148,542 |
— |
— |
— |
— |
$325,791 |
![]()
CANTON-MILTON-RANDOPLH: INTERSTATE MAINTENANCE AND RELATED WORK ON I-93

Proponent: |
MassDOT |
ID Number: |
612051 |
Project Type: |
Interstate Pavement |
Cost: |
$16,146,000 |
Funding Source: |
Statewide Highway Funds |
This is a MassDOT-prioritized project and is therefore not directly evaluated using the MPO’s TIP scoring criteria.
This project will conduct pavement maintenance on Interstate 93 in Canton, Milton, and Randolph. The project will resurface the roadway between the Interstate 93/Interstate 95 interchange in Canton and the Interstate 93/Route 24 interchange in Randolph, a distance of approximately three miles.
Source |
(FFY) 2024 |
2025 |
2026 |
2027 |
2028 |
Total |
Federal Funds |
– |
– |
$14,531,400 |
– |
– |
$14,531,400 |
Non-Federal Funds |
– |
– |
$1,614,600 |
– |
– |
$1,614,600 |
Total Funds |
– |
– |
$16,146,000 |
– |
– |
$16,146,000 |
CANTON-DEDHAM-WESTWOOD: INTERSTATE MAINTENANCE AND RELATED WORK ON I-95

Proponent: |
MassDOT |
ID Number: |
612094 |
Project Type: |
Interstate Pavement |
Cost: |
$8,731,030 |
Funding Source: |
Statewide Highway Funds |
This is a MassDOT-prioritized project and is therefore not directly evaluated using the MPO’s TIP scoring criteria.
This project is an interstate maintenance resurfacing project on Interstate 95 / Route 128. A preservation treatment or thin-bonded overlay is proposed to extend the useful service life of the pavement and improve safety.
Source |
(FFY) 2024 |
2025 |
2026 |
2027 |
2028 |
Total |
Federal Funds |
– |
– |
– |
– |
$7,857,927 |
$7,857,927 |
Non-Federal Funds |
– |
– |
– |
– |
$873,103 |
$873,103 |
Total Funds |
– |
– |
– |
– |
$8,731,030 |
$8,731,030 |
CHELSEA: PARK STREET & PEARL STREET RECONSTRUCTION

Proponent: |
Chelsea |
ID Number: |
611983 |
Project Type: |
Complete Streets |
Cost: |
$11,705,708 |
Funding Source: |
Regional Target Funds |
Category |
Safety |
Sys Pres |
CM/M |
CA/SC |
EQUITY |
EV |
Total |
Score |
14 out of 18 |
14 out of 20 |
11 out of 18 |
6 out of 12 |
14.9 out of 20 |
10 out of 12 |
69.9 out of 100 |
This project will improve safety along Park and Pearl Streets for all users, with a specific emphasis on improving conditions for people walking and bicycling. Smart signalization and geometric reconstruction will mitigate vehicular congestion while provid- ing clear pedestrian paths of travel and shorter crosswalk distances via newly constructed ramps and sidewalks. This project may implement a priority bus and bike lane, beginning along Park Street at Williams Street up to the eventual surface renovation of Upper Broadway to the Revere City Line, an MPO funded project in FFY 2022. Signals will allow for preferential movements of safety vehicles and MBTA buses through each intersection.
Source |
(FFY) 2024 |
2025 |
2026 |
2027 |
2028 |
Total |
Federal Funds |
– |
– |
– |
$9,364,566 |
– |
$9,364,566 |
Non-Federal Funds |
– |
– |
– |
$2,341,142 |
– |
$2,341,142 |
Total Funds |
— |
— |
— |
$11,705,708 |
— |
$11,705,708 |
CHELSEA: TARGETED SAFETY IMPROVEMENTS AND RELATED WORK ON BROADWAY, FROM WILLIAMS STREET TO CITY HALL AVENUE

Proponent: |
MassDOT |
ID Number: |
609532 |
Project Type: |
Intersection Improvements |
Cost: |
$6,315,013 |
Funding Source: |
Regional Target Funds |
Category |
Safety |
Sys Pres |
CM/M |
CA/SC |
EQUITY |
EV |
Total |
Score |
23 out of 30 |
18 out of 29 |
14 out of 29 |
4 out of 16 |
10 out of 12 |
14 out of 18 |
83 out of 134 |
The project will include corridor wide safety improvements targeted at reducing incidents for all users. Standard safety counter- measures such as improved signage, lighting, traffic calming streetscape elements, curb extensions, signal upgrades (where applicable) and other countermeasures may be incorporated. In addition, it is expected that the corridor’s pavement, sidewalks and bus transit amenities will be improved or replaced. .
Source |
(FFY) 2024 |
2025 |
2026 |
2027 |
2028 |
Total |
Federal Funds |
– |
$1,263,003 |
– |
– |
– |
$1,263,003 |
Non-Federal Funds |
– |
$5,052,010 |
– |
– |
– |
$5,052,010 |
Total Funds |
— |
$6,315,013 |
— |
— |
— |
$6,315,013 |
CHELSEA: RECONSTRUCTION OF SPRUCE STREET, FROM EVERETT AVENUE TO WILLIAMS STREET

Proponent: |
MassDOT |
ID Number: |
610675 |
Project Type: |
Safety Improvements |
Cost: |
$5,841,153 |
Funding Source: |
Statewide Highway Funds |
This is a MassDOT-prioritized project and is therefore not directly evaluated using the MPO’s TIP scoring criteria.
This project will reconstruct Spruce Street in Chelsea from Everett Avenue to Williams Street.
Source |
(FFY) 2024 |
2025 |
2026 |
2027 |
2028 |
Total |
Federal Funds |
– |
– |
$5,257,038 |
– |
– |
$5,257,038 |
Non-Federal Funds |
– |
– |
$584,115 |
– |
– |
$584,115 |
Total Funds |
– |
– |
$5,841,153 |
– |
— |
$5,841,153 |
CHELSEA: IMPROVEMENTS AT MARY C. BURKE ELEMENTARY (SRTS)
.png "CHELSEA: IMPROVEMENTS AT MARY C. BURKE ELEMENTARY (SRTS)")
Proponent: |
MassDOT |
ID Number: |
612884 |
Project Type: |
Safe Routes to School |
Cost: |
$1,617,667 |
Funding Source: |
Statewide Highway Funds |
This is a MassDOT-prioritized project and is therefore not directly evaluated using the MPO’s TIP scoring criteria.
This project will make upgrades to promote safety along the roadways surrounding Mary C. Burke Elementary School in Chelsea through the Safe Routes to School program. The project will serve the immediate needs of the students and staff by drastically improving pedestrian safety along Eastern Avenue, Stockton Street, and Spencer Avenue. Improvements include the addition of pedestrian signals, rehabilitation of pavement markings and roadway surfaces, construction of new ADA-compliant ramps, and reconstruction of existing traffic signal components. The project will also reduce the number of travel lanes on Eastern Avenue to add a pedestrian refuge. The roadway network will be simplified through the formal closure of a rarely used roadway in the project area, allowing for the creation of new open space in its place.
Source |
(FFY) 2024 |
2025 |
2026 |
2027 |
2028 |
Total |
Federal Funds |
– |
– |
$1,294,134 |
– |
– |
$1,294,134 |
Non-Federal Funds |
– |
– |
$323,533 |
– |
– |
$323,533 |
Total Funds |
– |
– |
$1,617,667 |
– |
– |
$1,617,667 |
COMMUNITY CONNECTIONS PROGRAM
Proponent: |
Regionwide |
ID Number: |
S12124 |
Project Type: |
Community Connections |
Cost: |
$8,334,827 |
Funding Source: |
Regional Target Funds |
The scoring criteria for the Community Connections Program are listed in Appendix A. Scores for projects funded in the FFYs 2023-27 TIP through this program are available on those projects’ pages within this chapter.
The Community Connections Program is the MPO’s funding program for first- and last-mile solutions, community transportation, and other small, nontraditional transportation projects such as those that update transit technology and improve bicycle and pedestrian facilities. The Community Connections Program is one of the investment programs included in the MPO’s current Long-Range Transportation Plan, Destination 2040. The program was originally funded at a level of $2 million per year in Re- gional Target funds beginning in FFY 2021. With the increase in funds available to the MPO through the Bipartisan Infrastructure Law, the funding level for this program has been increased to $2.5 million annually beginning in FFY 2023. Seventeen projects are funded in the FFYs 2024-28 TIP through this program, the details of which are available in this chapter. Remaining funding in FFYs 2025 through 2028 will be allocated during future TIP cycles.
Source |
(FFY) 2024 |
2025 |
2026 |
2027 |
2028 |
Total |
Federal Funds |
– |
$942,804 |
$2,392,023 |
$2,500,000 |
$2,500,000 |
$8,334,827 |
Non-Federal Funds |
– |
– |
– |
– |
– |
– |
Total Funds |
— |
$942,804 |
$2,392,023 |
$2,500,000 |
$2,500,000 |
$8,334,827 |
COHASSET AND SCITUATE: CORRIDOR IMPROVEMENTS AND RELATED WORK ON JUSTICE CUSHING HIGHWAY (ROUTE 3A), FROM BEECHWOOD STREET TO HENRY TURNER BAILEY ROAD
, FROM BEECHWOOD STREET TO HENRY TURNER BAILEY ROAD")
Proponent: |
MassDOT |
ID Number: |
608007 |
Project Type: |
Complete Streets |
Cost: |
$15,496,957 |
Funding Source: |
Regional Target Funds |
Category |
Safety |
Sys Pres |
CM/M |
CA/SC |
EQUITY |
EV |
Total |
Score |
16 out of 30 |
4 out of 29 |
8 out of 29 |
5 out of 16 |
1 out of 12 |
3 out of 18 |
37 out of 134 |
Work on this project includes corridor improvements from the Beechwood Street intersection to the Cohasset/Scit- uate town line. The Route 3A/Beechwood Street intersection will be upgraded with new traffic signal equipment as well as minor geometric improvements. The Route 3A/ Henry Turner Bailey Road intersection will be reviewed for meeting requirements for traffic signals as well as geometric improvements. Pedestrian and bicycle accommodation will be included along the corridor.
Source |
(FFY) 2024 |
2025 |
2026 |
2027 |
2028 |
Total |
Federal Funds |
$12,397,566 |
– |
– |
– |
– |
$12,397,566 |
Non-Federal Funds |
$3,099,391 |
– |
– |
– |
– |
$3,099,391 |
Total Funds |
$15,496,957 |
— |
— |
— |
— |
$15,496,957 |
DANVERS-MIDDLETON: BRIDGE REPLACEMENT, D-03-009=M-20-005, ANDOVER STREET (SR 114) OVER IPSWICH RIVER
 OVER IPSWICH RIVER")
Proponent: |
MassDOT |
ID Number: |
610782 |
Project Type: |
Bridge |
Cost: |
$5,703,371 |
Funding Source: |
Statewide Highway Funds |
This is a MassDOT-prioritized project and is therefore not directly evaluated using the MPO’s TIP scoring criteria.
This project will fund the replacement of bridge D-03-009=M-20-005, which carries Andover Street over the Ipswich River between Danvers and Middleton.
Source |
(FFY) 2024 |
2025 |
2026 |
2027 |
2028 |
Total |
Federal Funds |
– |
$4,562,697 |
– |
– |
– |
$4,562,697 |
Non-Federal Funds |
– |
$1,140,674 |
– |
– |
– |
$1,140,674 |
Total Funds |
– |
$5,703,371 |
– |
– |
– |
$5,703,371 |
DANVERS: RAIL TRAIL WEST EXTENSION (PHASE 3)
-01.png "DANVERS: RAIL TRAIL WEST EXTENSION (PHASE 3)")
Proponent: |
MassDOT |
ID Number: |
612607 |
Project Type: |
Bicycle and Pedestrian |
Cost: |
$3,406,050 |
Funding Source: |
Statewide Highway Funds |
This is a MassDOT-prioritized project and is therefore not directly evaluated using the MPO’s TIP scoring criteria.
This project will construct a 0.8-mile segment of the Danvers Rail Trail from Spring Street in the east to just west of Maple Street. The eastern end of this project will connect to earlier phases of the Danvers Rail Trail and to the larger Border to Boston Trail system further east.
Source |
(FFY) 2024 |
2025 |
2026 |
2027 |
2028 |
Total |
Federal Funds |
– |
– |
– |
– |
$2,724,840 |
$2,724,840 |
Non-Federal Funds |
– |
– |
– |
– |
$681,210 |
$681,210 |
Total Funds |
– |
– |
– |
– |
$3,406,050 |
$3,406,050 |
DEDHAM: IMPROVEMENTS AT AVERY ELEMENTARY (SRTS)
.png "DEDHAM: IMPROVEMENTS AT AVERY ELEMENTARY (SRTS)")
Proponent: |
MassDOT |
ID Number: |
612804 |
Project Type: |
Safe Routes to School |
Cost: |
$1,626,334 |
Funding Source: |
Statewide Highway Funds |
This is a MassDOT-prioritized project and is therefore not directly evaluated using the MPO’s TIP scoring criteria.
This project will make upgrades to promote safety along the roadways surrounding Avery Elementary School in Dedham through the Safe Routes to School program. The project includes three areas of improvement designed to facilitate safe walking to the Avery campus. The project proposes adding sidewalks and granite curbing on Maverick Street, along with adding new granite curbing along Whiting Avenue. A new crosswalk with rectangular-rapid-flashing beacons is also proposed for installation on Whiting Avenue at Recreation Road. Finally, Hill Avenue is frequently used as a cut-through for students who live East of Avery Elementary, but this route is currently a dead-end road ending in a wooded area with steep grade, a ledge, and fencing. This project proposes formalizing this connection with an ADA-accessible pedestrian walkway ramp to facilitate safe passage in what is currently an unmaintained student made path that is unsafe especially in winter months.
Source |
(FFY) 2024 |
2025 |
2026 |
2027 |
2028 |
Total |
Federal Funds |
– |
– |
$1,301,067 |
– |
– |
$1,301,067 |
Non-Federal Funds |
– |
– |
$325,267 |
– |
– |
$325,267 |
Total Funds |
– |
– |
$1,626,334 |
– |
– |
$1,626,334 |
EVERETT: TARGETED MULTI-MODAL AND SAFETY IMPROVEMENTS ON ROUTE 16

Proponent: |
MassDOT |
ID Number: |
613121 |
Project Type: |
Intersection Improvements |
Cost: |
$5,246,920 |
Funding Source: |
Regional Target Funds |
This is a MassDOT-prioritized project and is therefore not directly evaluated using the MPO’s TIP scoring criteria.
This project will make targeted safety enhancements along Route 16 in Everett with a focus on enhanced multimodal accessibility along the corridor.
Source |
(FFY) 2024 |
2025 |
2026 |
2027 |
2028 |
Total |
Federal Funds |
– |
– |
– |
$4,197,536 |
– |
$4,197,536 |
Non-Federal Funds |
– |
– |
– |
$1,049,384 |
– |
$1,049,384 |
Total Funds |
— |
— |
— |
$5,246,920 |
— |
$5,246,920 |
EVERETT: RECONSTRUCTION OF BEACHAM STREET

Proponent: |
Everett |
ID Number: |
609257 |
Project Type: |
Complete Streets |
Cost: |
$10,548,928 |
Funding Source: |
Regional Target Funds |
Category |
Safety |
Sys Pres |
CM/M |
CA/SC |
EQUITY |
EV |
Total |
Score |
19 out of 18 |
10 out of 29 |
13 out of 29 |
4 out of 16 |
7 out of 12 |
1 out of 18 |
54 out of 134 |
This Complete Streets project involves the reconstruction of Beacham Street to reduce vehicular collisions and improve bicycle travel. This project also includes the implementation of a shared-use bike path with a buffer along 0.65 miles of the Beacham Street corridor, a major connection between Boston, Somerville, and Cambridge, and Chelsea and East Boston. To promote pedestrian safety, upgrades to traffic signals, pavement markings, and sidewalk conditions will be incorporated to reduce conflict with vehicular traffic and provide an ADA-compliant travel route.
Source |
(FFY) 2024 |
2025 |
2026 |
2027 |
2028 |
Total |
Federal Funds |
– |
$8,439,142 |
– |
– |
– |
$8,439,142 |
Non-Federal Funds |
– |
$2,109,786 |
– |
– |
– |
$2,109,786 |
Total Funds |
— |
$10,548,928 |
– |
– |
– |
$10,548,928 |
EVERETT: INTERSECTION IMPROVEMENTS ON ROUTE 16
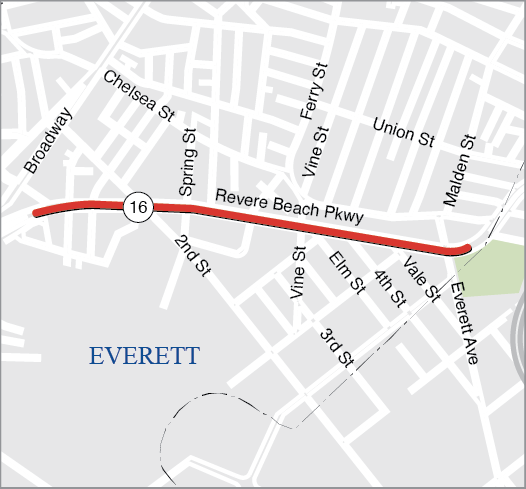
Proponent: |
MassDOT |
ID Number: |
611969 |
Project Type: |
Intersection Improvements, |
Cost: |
$17,748,000 |
Funding Source: |
Statewide Highway Funds |
This is a MassDOT-prioritized project and is therefore not directly evaluated using the MPO’s TIP scoring criteria.
This project will make safety improvements at seven intersections along Route 16 in Everett, from Gladstone Street to Everett Avenue. This key regional roadway features three 2017–2019 all-mode crash clusters and three of the state’s top-200 crash locations, making it high-priority safety improvement location. This project includes rehabilitating or reconstructing the traffic signals at each intersection, adding pedestrian signal phases, and making improvements to sidewalks, ramps, crosswalks, and curbing. This project will also explore the feasibility of improved bicycle accommodations during the design phase.
Source |
(FFY) 2024 |
2025 |
2026 |
2027 |
2028 |
Total |
Federal Funds |
– |
– |
– |
– |
$14,198,400 |
$14,198,400 |
Non-Federal Funds |
– |
– |
– |
– |
$3,549,600 |
$3,549,600 |
Total Funds |
– |
– |
– |
– |
$17,748,000 |
$17,748,000 |
FRAMINGHAM-NATICK: RESURFACING AND RELATED WORK ON ROUTE 9

Proponent: |
MassDOT |
ID Number: |
609402 |
Project Type: |
Non-Interstate Pavement |
Cost: |
$48,665,364 |
Funding Source: |
Statewide Highway Funds |
This is a MassDOT-prioritized project and is therefore not directly evaluated using the MPO’s TIP scoring criteria.
This project consists of resurfacing and related work on Route 9.
Source |
(FFY) 2024 |
2025 |
2026 |
2027 |
2028 |
Total |
Federal Funds |
– |
– |
– |
– |
$38,932,291 |
$38,932,291 |
Non-Federal Funds |
– |
– |
– |
– |
$9,733,073 |
$9,733,073 |
Total Funds |
– |
– |
– |
– |
$48,665,364 |
$48,665,364 |
FRAMINGHAM: IMPROVEMENTS AT HARMONY GROVE ELEMENTARY SCHOOL (SRTS)
.png "FRAMINGHAM: IMPROVEMENTS AT HARMONY GROVE ELEMENTARY SCHOOL (SRTS)")
Proponent: |
MassDOT |
ID Number: |
612894 |
Project Type: |
Safe Routes to School |
Cost: |
$1,370,066 |
Funding Source: |
Statewide Highway Funds |
This is a MassDOT-prioritized project and is therefore not directly evaluated using the MPO’s TIP scoring criteria.
This project will make upgrades to promote safety along the roadways surrounding Harmony Grove Elementary School in Framingham through the Safe Routes to School program. This project includes installing new and reconstructing existing sidewalk and curbing on Second Street, from Beaver Street to Waverly Street, and Taralli Terrace, from Second Street to Beaver Park Road. The project will also realign the intersection of Beaver Park Road and Taralli Terrace and install new pavement markings, ADA-compliant curb cuts, crosswalks, and shared bike lanes on Second Street.
Source |
(FFY) 2024 |
2025 |
2026 |
2027 |
2028 |
Total |
Federal Funds |
– |
– |
$1,096,053 |
– |
– |
$1,096,053 |
Non-Federal Funds |
– |
– |
$274,013 |
– |
– |
$274,013 |
Total Funds |
– |
– |
$1,370,066 |
– |
– |
$1,370,066 |
GLOUCESTER: BRIDGE RECONSTRUCTION, G-05-002, WESTERN AVENUE OVER BLYNMAN CANAL

Proponent: |
MassDOT |
ID Number: |
608397 |
Project Type: |
Bridge |
Cost: |
$64,960,000 |
Funding Source: |
Statewide Highway Funds |
This is a MassDOT-prioritized project and is therefore not directly evaluated using the MPO’s TIP scoring criteria.
his project will reconstruct bridge G-05-002, which carries Route 127, Western Avenue over the Blynman Canal in Gloucester.
Source |
(FFY) 2024 |
2025 |
2026 |
2027 |
2028 |
Total |
Federal Funds |
– |
– |
– |
– |
$51,968,000 |
$51,968,000 |
Non-Federal Funds |
– |
– |
– |
– |
$12,992,000 |
$12,992,000 |
Total Funds |
– |
– |
– |
– |
$64,960,000 |
$64,960,000 |
GLOUCESTER AND ROCKPORT: CATA ON DEMAND MICROTRANSIT SERVICE EXPANSION

Proponent: |
CATA |
ID Number: |
S12700 |
Project Type: |
Community Connections |
Cost: |
$813,291 |
Funding Source: |
Regional Target Funds |
Category |
Conn |
Coord |
Plan |
TE |
MS/DP |
FS |
Total |
Score |
11 out of 18 |
6 out of 15 |
9 out of 15 |
6 out of 18 |
20 out of 24 |
10 out of 10 |
62 out of 100 |
This project will expand the existing CATA On Demand microtransit service in Gloucester to include Rockport and the Lanesville neighborhood of Gloucester. The existing operating zone includes two MBTA commuter rail stations, two industrial parks, a hospital, and the waterfront district. The original purpose of CATA On Demand was to address the first- and last-mile gaps for commuters between existing transit and employment centers. The service has evolved, however, to serve a broader group of riders, including students, families, people with disabilities, and older adults. The expansion of the service to include new locations aims to continue to broaden the appeal of CATA On Demand to this wider audience and to better meet their needs when accessing school, medical appointments, grocery stores, and other essential destinations. This project is funded through the third round of grants available through the MPO’s Community Connections Program and was funded for $333,450 in FFY23 of the FFY 2023-27 TIP.
Source |
(FFY) 2024 |
2025 |
2026 |
2027 |
2028 |
Total |
Federal Funds |
$212,052 |
$171,821 |
– |
– |
– |
$383,873 |
Non-Federal Funds |
$53,013 |
$42,955 |
– |
– |
– |
$95,968 |
Total Funds |
$265,065 |
$214,776 |
— |
— |
– |
$479,841 |
HAMILTON-IPSWICH: SUPERSTRUCTURE REPLACEMENT, H-03-002=I-01-006, WINTHROP STREET OVER IPSWICH RIVER

Proponent: |
MassDOT |
ID Number: |
609467 |
Project Type: |
Bridge |
Cost: |
$3,386,585 |
Funding Source: |
Statewide Highway Funds |
This is a MassDOT-prioritized project and is therefore not directly evaluated using the MPO’s TIP scoring criteria.
This project will replace bridge H-03-002=I-01-006, which carries Winthrop Street over the Ipswich River.
Source |
(FFY) 2024 |
2025 |
2026 |
2027 |
2028 |
Total |
Federal Funds |
– |
$2,709,268 |
– |
– |
– |
$2,709,268 |
Non-Federal Funds |
– |
$677,317 |
– |
– |
– |
$677,317 |
Total Funds |
– |
$3,386,585 |
– |
– |
– |
$3,386,585 |
HINGHAM: IMPROVEMENTS ON ROUTE 3A FROM OTIS STREET/ COLE ROAD, INCLUDING SUMMER STREET AND ROTARY; ROCKLAND STREET TO GEORGE WASHINGTON BOULEVARD

Proponent: |
Hingham |
ID Number: |
605168 |
Project Type: |
Complete Streets |
Cost: |
$15,018,900 |
Funding Source: |
Regional Target Funds |
Category |
Safety |
Sys Pres |
CM/M |
CA/SC |
EQUITY |
EV |
Total |
Score |
10 out of 30 |
16 out of 29 |
17 out of 29 |
10 out of 16 |
0 out of 12 |
2 out of 18 |
55 out of 134 |
The project improves multimodal access between Hingham Center, residential areas, and Hingham Harbor by ex- tending the existing buffered, shared-use bike path from Rockland Street to the Hingham inner harbor. In addition, improvements to reduce vehicular accidents will be incorporated through the establishment of turn lanes and a small roundabout at the intersection of Route 3A and Summer Street.
Source |
(FFY) 2024 |
2025 |
2026 |
2027 |
2028 |
Total |
Federal Funds |
– |
$12,015,120 |
– |
– |
– |
$12,015,120 |
Non-Federal Funds |
– |
$3,003,780 |
– |
– |
– |
$3,003,780 |
Total Funds |
— |
$15,018,900 |
— |
— |
— |
$15,018,900 |
HOPKINTON AND WESTBOROUGH: RECONSTRUCTION OF INTERSTATE 90/INTERSTATE 495 INTERCHANGE

Proponent: |
MassDOT |
ID Number: |
607977 |
Project Type: |
Roadway Reconstruction |
Cost: |
$300,942,837 |
Funding Source: |
Statewide Highway Funds |
This is a MassDOT-prioritized project and is therefore not directly evaluated using the MPO’s TIP scoring criteria.
The project will improve the interchange of Interstate 90 and Interstate 495. This project is funded over seven federal fiscal years (FFYs 2022-27) for a total cost of $300,942,837.
Source |
(FFY) 2024 |
2025 |
2026 |
2027 |
2028 |
Total |
Federal Funds |
$40,245,712 |
$53,808,640 |
$43,279,477 |
$39,214,382 |
$777,064 |
$177,247,569 |
Non-Federal Funds |
$6,351,475 |
$9,312,071 |
$4,708,830 |
$4,357,153 |
$77,706 |
$25,907,235 |
Total Funds |
$46,659,187 |
$60,120,711 |
$47,988,307 |
$43,571,535 |
$43,571,535 |
$203,154,804 |
HUDSON AND MARLBOROUGH: MWRTA CATCHCONNECT MICROTRANSIT SERVICE EXPANSION

Proponent: |
MWRTA |
ID Number: |
S12701 |
Project Type: |
Community Connections |
Cost: |
$450,163 |
Funding Source: |
Regional Target Funds |
Category |
Conn |
Coord |
Plan |
TE |
MS/DP |
FS |
Total |
Score |
12 out of 18 |
3 out of 15 |
9 out of 15 |
9 out of 18 |
16 out of 24 |
10 out of 10 |
59 out of 100 |
This project will expand MetroWest RTA’s existing CatchConnect microtransit service in Framingham, Natick, and Wellesley to include the municipalities of Hudson and Marlborough. This added service region will allow consumers to connect to MWRTA fixed-route services in the area, including the Route 7 traveling north and south to Framingham and the Route 7C travelling east and west through downtown Marlborough. CatchConnect service allows riders to book on-demand trips via an existing mobile application or telephone. This project is funded through the third round of grants available through the MPO’s Community Connections Program. The first year of funding for this project was in Federal Fiscal Year 2023 with $141,250 in funding.
Source |
(FFY) 2024 |
2025 |
2026 |
2027 |
2028 |
Total |
Federal Funds |
$119,540 |
$127,590 |
– |
– |
– |
$247,130 |
Non-Federal Funds |
$29,885 |
$31,898 |
– |
– |
– |
$61,783 |
Total Funds |
$149,425 |
$159,488 |
— |
— |
— |
$308,913 |
IPSWICH: RESURFACING AND RELATED WORK ON CENTRAL AND SOUTH MAIN STREETS

Proponent: |
Ipswich |
ID Number: |
605743 |
Project Type: |
Complete Streets |
Cost: |
$11,728,698 |
Funding Source: |
Regional Target Funds |
Category |
Safety |
Sys Pres |
CM/M |
CA/SC |
EQUITY |
EV |
Total |
Score |
11 out of 30 |
10 out of 29 |
10 out of 29 |
6 out of 16 |
2 out of 12 |
8 out of 18 |
47 out of 134 |
In Ipswich, the project will reconstruct the roadway between Mineral Street and Poplar Street (3,200 feet) to improve the roadway surface. Minor geometric improvements at intersection and pedestrian crossings will be included. Sidewalks and wheelchair ramps will be improved in selected areas for ADA compliance. The drainage system is undersized and will be upgraded.
Source |
(FFY) 2024 |
2025 |
2026 |
2027 |
2028 |
Total |
Federal Funds |
– |
– |
$4,561,661 |
$4,821,298 |
– |
$9,382,959 |
Non-Federal Funds |
– |
– |
$1,140,415 |
$1,205,324 |
– |
$2,345,739 |
Total Funds |
— |
— |
$5,702,076 |
$6,026,622 |
— |
$11,728,698 |
LITTLETON: RECONSTRUCTION OF FOSTER STREET

Proponent: |
Littleton |
ID Number: |
609054 |
Project Type: |
Complete Streets |
Cost: |
$5,164,375 |
Funding Source: |
Regional Target Funds |
Category |
Safety |
Sys Pres |
CM/M |
CA/SC |
EQUITY |
EV |
Total |
Score |
12 out of 30 |
3 out of 29 |
11 out of 29 |
5 out of 16 |
1 out of 12 |
6 out of 18 |
38 out of 134 |
This project involves improvements to address traffic congestion and the safety of pedestrians and bicyclists through the addition of turning lanes and the reduction and consolidation of curb cuts. Full accommodations for vehicular, bicycle, and pedestrian travel and upgraded signage and wayfinding will also be established to improve accessibility for all users who travel to and from the nearby businesses.
Source |
(FFY) 2024 |
2025 |
2026 |
2027 |
2028 |
Total |
Federal Funds |
$4,131,500 |
– |
– |
– |
– |
$4,131,500 |
Non-Federal Funds |
$1,032,875 |
– |
– |
– |
– |
$1,032,875 |
Total Funds |
$5,164,375 |
— |
— |
— |
— |
$5,164,375 |
LYNN: BROAD STREET CORRIDOR TRANSIT SIGNAL PRIORITY

Proponent: |
Lynn |
ID Number: |
S12802 |
Project Type: |
Community Connections |
Cost: |
$297,800 |
Funding Source: |
Regional Target Funds |
Category |
Conn |
Coord |
Plan |
TE |
MS/DP |
FS |
Total |
Score |
17.5 out of 18 |
12 out of 15 |
13.5 out of 15 |
12 out of 18 |
23 out of 24 |
10 out of 10 |
88 out of 100 |
Upgrades to traffic signal equipment at seven signalized intersections on Broad Street in Lynn to facilitate the effi- ciency of all modes of transportation on a key transportation corridor. The Lynn Transit Action Plan identified the corridor as a priority area for improvement with 5,100 daily passenger trips via several MBTA bus routes.
Source |
(FFY) 2024 |
2025 |
2026 |
2027 |
2028 |
Total |
Federal Funds |
$238,240 |
– |
– |
– |
– |
$238,240 |
Non-Federal Funds |
$59,560 |
– |
– |
– |
– |
$59,560 |
Total Funds |
$297,800 |
– |
– |
– |
– |
$297,800 |
LYNN: REHABILITATION OF ESSEX STREET

Proponent: |
Lynn |
ID Number: |
609252 |
Project Type: |
Complete Streets |
Cost: |
$19,698,640 |
Funding Source: |
Regional Target Funds |
Category |
Safety |
Sys Pres |
CM/M |
CA/SC |
EQUITY |
EV |
Total |
Score |
19 out of 30 |
17 out of 29 |
9 out of 29 |
8 out of 16 |
10 out of 12 |
3 out of 18 |
66 out of 134 |
This project is focused on making key safety improvements for pedestrians and bicyclists. Existing sidewalks on Es- sex Street will be reconstructed to ADA/AAB standards and will be complemented by the addition of new on-street bicycle facilities. Pedestrian safety will be improved through the construction of curb bump-outs at intersections to reduce crosswalk length. In addition, operational improvements such as signal updates and pavement markings will be established to enhance safety.
Source |
(FFY) 2024 |
2025 |
2026 |
2027 |
2028 |
Total |
Federal Funds |
– |
$15,758,912 |
– |
– |
– |
$15,758,912 |
Non-Federal Funds |
– |
$3,939,728 |
– |
– |
– |
$3,939,728 |
Total Funds |
— |
$19,698,640 |
— |
— |
— |
$19,698,640 |
LYNN: REHABILITATION OF WESTERN AVENUE (ROUTE 107)
")
Proponent: |
Lynn |
ID Number: |
609246 |
Project Type: |
Complete Streets |
Cost: |
$45,897,600 |
Funding Source: |
Regional Target Funds |
Category |
Safety |
Sys Pres |
CM/M |
CA/SC |
EQUITY |
EV |
Total |
Score |
18 out of 18 |
14 out of 20 |
10 out of 18 |
11 out of 12 |
11.9 out of 20 |
10 out of 12 |
74.9 out of 100 |
This project will reconstruct 1.9 miles of Western Avenue (Route 107) in Lynn between Centre Street and Eastern Avenue. Work will include roadway pavement reconstruction, drainage improvements, improved design for traffic operations and safety, new signs and pavement markings, and bicycle and ADA-compliant pedestrian improvements. This project includes improvements to bus stop locations throughout the corridor and bus-priority elements will be considered during the design phase. A key goal of this project is to enhance safety along the corridor, as this segment of Western Avenue has three 2017–2019 top-200 crash clusters, four 2017–2019 all-mode crash clusters, one 2010–2019 bicycle crash cluster, and one 2010–2019 pedestrian crash cluster, making it a high-priority safety improvement location statewide. This project is anticipated to be funded over three fiscal years, with funding beginning in FFY 2027.
Source |
(FFY) 2024 |
2025 |
2026 |
2027 |
2028 |
Total |
Federal Funds |
– |
– |
– |
$12,300,000 |
$16,000,000 |
$28,300,000 |
Non-Federal Funds |
– |
– |
– |
$2,700,000 |
$4,000,000 |
$6,700,000 |
Total Funds |
— |
— |
— |
$15,000,000 |
$20,000,000 |
$35,000,000 |
LYNN: TARGETED SAFETY AND MULTIMODAL IMPROVEMENTS (PLAYBOOK PRIORITY CORRIDORS)
")
Proponent: |
MassDOT |
ID Number: |
612599 |
Project Type: |
Safety Improvements |
Cost: |
$8,321,400 |
Funding Source: |
Statewide Highway Funds |
This is a MassDOT-prioritized project and is therefore not directly evaluated using the MPO’s TIP scoring criteria.
This project will implement targeted safety improvements at key locations in Lynn as identified in the Lynn Safe Streets for People Playbook. This multimodal safety plan was created by the City of Lynn in partnership with MassDOT and identified priority streets for improvement and developed strategies to support the creation of a safe network for all users, with an emphasis on walking, biking, and taking transit. The project will involve the implementation of both corridor- and intersection-level treatments and amenities for street users on a systemic basis. The street corridors in this phase will include Walnut Street, Franklin Street, Linwood Street, Washington Street, Boston Street, Essex Street, Liberty Street, Tremont Street, Central Avenue, Exchange Street, and Commercial Street. Corridor treatments will include the installation of protected bicycle lanes, shared streets treatments, and traffic-calming measures such as speed cushions or humps. Intersection treatments will include curb ramps and extensions, geometric adjustments, raised crosswalks, installation of rectangular-rapid-flashing beacons, and signal equipment and timing upgrades. Amenities for street users will include the installation of bicycle parking, improved bus shelters, signage, and benches, floating bus stops, and bus bulbs.
Source |
(FFY) 2024 |
2025 |
2026 |
2027 |
2028 |
Total |
Federal Funds |
– |
– |
$7,157,120 |
– |
– |
$7,157,120 |
Non-Federal Funds |
– |
– |
$1,164,280 |
– |
– |
$1,164,280 |
Total Funds |
– |
– |
$8,321,400 |
– |
— |
$8,321,400 |
LYNN: LYNN STATION IMPROVEMENTS PHASE II

Proponent: |
MBTA |
ID Number: |
S12705 |
Project Type: |
Transit Modernization |
Cost: |
$48,100,000 |
Funding Source: |
Regional Target Funds |
This project was selected for funding by the MPO late in the FFYs 2023–27 TIP development cycle, so it has not yet been scored using the MPO’s project selection criteria. This section will be updated with the project’s final score when it is available.
This project will make a range of improvements to the MBTA commuter rail station in Lynn, addressing the existing deterioration within the station to bring it into a state of good repair. The project will reconstruct the existing platform, construct two new elevators, and rehabilitate existing stairways and lighting throughout the station, among other upgrades. This project also includes waterproofing and structural repairs to the viaduct northeast of the station. In FFY 23, the MPO funded this project with $34,500,000. The funding for this project continues into the current TIP with $13,600,000 for a total allocation of $48,100,000.
Source |
(FFY) 2024 |
2025 |
2026 |
2027 |
2028 |
Total |
Federal Funds |
$10,880,000 |
– |
– |
– |
– |
$10,880,000 |
Non-Federal Funds |
$2,720,000 |
– |
– |
– |
– |
$2,720,000 |
Total Funds |
$13,600,000 |
– |
– |
– |
— |
$13,600,000 |
LYNN-REVERE: BRIDGE RECONSTRUCTION, L-18-015=R-05-008, ROUTE 1A OVER SAUGUS RIVER

Proponent: |
MassDOT |
ID Number: |
608396 |
Project Type: |
Bridge |
Cost: |
$105,560,000 |
Funding Source: |
Regional Target Funds |
This is a MassDOT-prioritized project and is therefore not directly evaluated using the MPO’s TIP scoring criteria.
This project will perform substructure and superstructure repairs and construction for the General Edwards Bridge carrying the Route 1A Lynnway over the Saugus River between Revere and Lynn. The funding for this project is anticipated to continue into 2029.
Source |
(FFY) 2024 |
2025 |
2026 |
2027 |
2028 |
Total |
Federal Funds |
– |
– |
– |
– |
$43,348,579 |
$43,348,579 |
Non-Federal Funds |
– |
– |
– |
– |
$10,837,145 |
$10,837,145 |
Total Funds |
– |
– |
– |
– |
$54,185,724 |
$54,185,724 |
LYNNFIELD AND PEABODY: INTERSTATE MAINTENANCE AND RELATED WORK ON I-95

Proponent: |
MassDOT |
ID Number: |
612033 |
Project Type: |
Interstate Pavement |
Cost: |
$8,575,451 |
Funding Source: |
Statewide Highway Funds |
This is a MassDOT-prioritized project and is therefore not directly evaluated using the MPO’s TIP scoring criteria.
This project will maintain Interstate 95 in Lynnfield and Peabody from Hawkes Brook to Proctor Brook.
Source |
(FFY) 2024 |
2025 |
2026 |
2027 |
2028 |
Total |
Federal Funds |
– |
– |
– |
– |
$7,717,906 |
$7,717,906 |
Non-Federal Funds |
– |
– |
– |
– |
$857,545 |
$857,545 |
Total Funds |
– |
– |
– |
– |
$8,575,451 |
$8,575,451 |
LYNNFIELD AND WAKEFIELD: LYNNFIELD- RAIL TRAIL EXTENSION, FROM THE GALVIN MIDDLE SCHOOL TO LYNNFIELD/PEABODY T.L.

Proponent: |
MassDOT |
ID Number: |
607329 |
Project Type: |
Bicycle and Pedestrian |
Cost: |
$24,543,047 |
Funding Source: |
Regional Target Funds |
This is a MassDOT-prioritized project and is therefore not directly evaluated using the MPO’s TIP scoring criteria.
The proposed Wakefield/Lynnfield Rail Trail extends from the Galvin Middle School in Wakefield north to the Lynnfield/Peabody town line, a distance of approximately 4.4 miles. Approximately 1.9 miles of the trail is located within Wakefield and 2.5 miles in Lynnfield. The corridor is the southern section of the former Newburyport Railroad and will connect to Peabody and the regional Border to Boston Trail.
Source |
(FFY) 2024 |
2025 |
2026 |
2027 |
2028 |
Total |
Federal Funds |
– |
– |
– |
$8,480,000 |
$11,154,438 |
$19,634,438 |
Non-Federal Funds |
– |
– |
– |
$2,120,000 |
$2,788,609 |
$4,908,609 |
Total Funds |
— |
— |
— |
$10,600,000 |
$13,943,047 |
$24,543,047 |
MALDEN: SPOT POND BROOK GREENWAY

Proponent: |
Malden |
ID Number: |
613088 |
Project Type: |
Bicycle Network and Pedestrian Connections |
Cost: |
$4,858,127 |
Funding Source: |
Regional Target Funds |
Category |
Safety |
Sys Pres |
CM/M |
CA/SC |
EQUITY |
EV |
Total |
Score |
16.5 out of 30 |
10 out of 29 |
18 out of 29 |
5 out of 16 |
12 out of 12 |
11.5 out of 18 |
73 out of 134 |
This project will construct a 1.1 mile shared-use path connecting Coytemore Lea Park in Malden’s Oak Grove neigh- borhood with the Northern Strand Community Trail and Malden River via downtown Malden. The project will replace existing sidewalk infrastructure and adjust roadway widths to accomodate a new 11 foot shared-use facility within the existing right-of-way.
Source |
(FFY) 2024 |
2025 |
2026 |
2027 |
2028 |
Total |
Federal Funds |
– |
– |
– |
$3,886,502 |
– |
$3,886,502 |
Non-Federal Funds |
– |
– |
– |
$971,625 |
– |
$971,625 |
Total Funds |
— |
— |
— |
$4,858,127 |
— |
$4,858,127 |
MALDEN-REVERE: IMPROVEMENTS AT ROUTE 1 (NB) (PHASE 1)
-01.png "MALDEN-REVERE: IMPROVEMENTS AT ROUTE 1 (NB) (PHASE 1)")
Proponent: |
MassDOT |
ID Number: |
610543 |
Project Type: |
Roadway Reconstruction |
Cost: |
$8,363,600 |
Funding Source: |
Statewide Highway Funds |
This is a MassDOT-prioritized project and is therefore not directly evaluated using the MPO’s TIP scoring criteria.
This project will make improvements along Route 1 northbound in Malden and Revere over a distance of approximately 0.8 miles north of Squire Road.
Source |
(FFY) 2024 |
2025 |
2026 |
2027 |
2028 |
Total |
Federal Funds |
– |
– |
– |
– |
$6,690,880 |
$6,690,880 |
Non-Federal Funds |
– |
– |
– |
– |
$1,672,720 |
$1,672,720 |
Total Funds |
– |
– |
– |
– |
$8,363,600 |
$8,363,600 |
MEDFORD: BICYCLE PARKING - TIER 1

Proponent: |
Medford |
ID Number: |
S12803 |
Project Type: |
Community Connections |
Cost: |
$29,600 |
Funding Source: |
Regional Target Funds |
Category |
Conn |
Coord |
Plan |
TE |
MS/DP |
FS |
Total |
Score |
6 out of 18 |
2 out of 15 |
9 out of 15 |
59 out of 18 |
22 out of 24 |
10 out of 10 |
58 out of 100 |
This project will purchase and install 40 bicycle racks to create 80 additional bicycle parking stations at priority areas throughout the City of Medford. These priority areas include West Medford (including the commuter rail station), Medford Square, Tufts Square, South Medford, Wellington Station, and Haines Square. The racks will also serve stops along MBTA bus routes, including Routes 80, 94, 95, 96, 101, 108, and 134.
Source |
(FFY) 2024 |
2025 |
2026 |
2027 |
2028 |
Total |
Federal Funds |
$23,680 |
– |
– |
– |
– |
$23,680 |
Non-Federal Funds |
$5,920 |
– |
– |
– |
– |
$5,920 |
Total Funds |
$29,600 |
— |
— |
— |
— |
$29,600 |
MEDFORD: BLUEBIKES EXPANSION

Proponent: |
Medford |
ID Number: |
S12804 |
Project Type: |
Community Connections |
Cost: |
$118,643 |
Funding Source: |
Regional Target Funds |
Category |
Conn |
Coord |
Plan |
TE |
MS/DP |
FS |
Total |
Score |
6 out of 18 |
2 out of 15 |
9 out of 15 |
59 out of 18 |
22 out of 24 |
10 out of 10 |
58 out of 100 |
This project will expand the existing Bluebikes system in Medford through the purchase and installation of four Blue- bikes docks and an additional 25 bikes. The locations of these docks may be Condon Shell, Glenwood, Lawrence Estates, and West Medford.
Source |
(FFY) 2024 |
2025 |
2026 |
2027 |
2028 |
Total |
Federal Funds |
$94,914 |
– |
– |
– |
– |
$94,914 |
Non-Federal Funds |
$23,729 |
– |
– |
– |
– |
$23,729 |
Total Funds |
$118,643 |
— |
— |
— |
— |
$118,643 |
MEDFORD: INTERSECTION IMPROVEMENTS AT MAIN STREET/SOUTH STREET, MAIN STREET/MYSTIC VALLEY PARKWAY RAMPS, AND MAIN STREET/MYSTIC AVENUE

Proponent: |
MassDOT |
ID Number: |
611974 |
Project Type: |
Intersection Improvements, |
Cost: |
$9,177,840 |
Funding Source: |
Statewide Highway Funds |
This is a MassDOT-prioritized project and is therefore not directly evaluated using the MPO’s TIP scoring criteria.
This project will make safety improvements to the intersection of Main Street and South Street in Medford. This location has a 2010–2019 pedestrian crash cluster and a 2017–2019 top-200 crash location (statewide), making it a high-priority safety improvement location. The scope of this project involves reconstruction of the intersection either by constructing a roundabout or reconstructing and updating the signal control system and lane assignments. A detailed alternatives analysis will be conducted to identify the preferred traffic control for the intersection, in addition to improvements to accessibility, and bicycle and pedestrian accommodations. This project will build upon the analysis done in the Medford Square Priority Roadways Improvement Study published by the Boston Region MPO in December 2018.
Source |
(FFY) 2024 |
2025 |
2026 |
2027 |
2028 |
Total |
Federal Funds |
– |
– |
$8,260,056 |
– |
– |
$8,260,056 |
Non-Federal Funds |
– |
– |
$917,784 |
– |
– |
$917,784 |
Total Funds |
– |
– |
$9,177,840 |
– |
– |
$9,177,840 |
MEDFORD: MILTON FULLER ROBERTS ELEMENTARY SCHOOL (SRTS)
")
Proponent: |
MassDOT |
ID Number: |
612001 |
Project Type: |
Safe Routes to School |
Cost: |
$1,020,484 |
Funding Source: |
Statewide Highway Funds |
This is a MassDOT-prioritized project and is therefore not directly evaluated using the MPO’s TIP scoring criteria.
This project includes pedestrian improvements at three key intersections for students approaching Roberts Elementary School. Improvements include the following: a full pedestrian signal, curb extensions, and improved lighting at the intersection of Fellsway with Paris Street and Fern Road, and sidewalk improvements from this intersection to the Roberts School along Park Street; pedestrian realignment, curb bump-outs, and pedestrian rapid-flashing beacons at the intersection of Salem Street and Hadley Place; and pedestrian rapid-flashing beacons, curb extensions, and improved lighting at the intersection of Fellsway and Grant Avenue.
Source |
(FFY) 2024 |
2025 |
2026 |
2027 |
2028 |
Total |
Federal Funds |
– |
$816,387 |
– |
– |
– |
$816,387 |
Non-Federal Funds |
– |
$204,097 |
– |
– |
– |
$204,097 |
Total Funds |
– |
$1,020,484 |
– |
– |
– |
$1,020,484 |
MEDFORD: SHARED USE PATH CONNECTION AT THE ROUTE 28/WELLINGTON UNDERPASS

Proponent: |
MassDOT |
ID Number: |
611982 |
Project Type: |
Bicycle and Pedestrian |
Cost: |
$4,560,833 |
Funding Source: |
Statewide Highway Funds |
This is a MassDOT-prioritized project and is therefore not directly evaluated using the MPO’s TIP scoring criteria.
This project will enhance bicycle and pedestrian travel in Medford by creating a shared-use path connection under Route 28 (Fellsway) along the Mystic River. This connection will be similar to a shared-use boardwalk on the opposite side of the Mystic River in Somerville, which also runs under Route 28. Once complete, this project will be a critical connection between existing riverfront pathways along the Mystic River in Medford, including the Wellington Greenway on the east side of Route 28 and the path system within the Mystic River State Reservation on the west side of Route 28.
Source |
(FFY) 2024 |
2025 |
2026 |
2027 |
2028 |
Total |
Federal Funds |
– |
$3,648,666 |
– |
– |
– |
$3,648,666 |
Non-Federal Funds |
– |
$912,167 |
– |
– |
– |
$912,167 |
Total Funds |
– |
$4,560,833 |
– |
– |
– |
$4,560,833 |
MEDFORD: SOUTH MEDFORD CONNECTOR BIKE PATH

Proponent: |
MassDOT |
ID Number: |
612499 |
Project Type: |
Bicycle and Pedestrian |
Cost: |
$7,903,743 |
Funding Source: |
Statewide Highway Funds |
This is a MassDOT-prioritized project and is therefore not directly evaluated using the MPO’s TIP scoring criteria.
This project will enhance bicycle and pedestrian connectivity in Medford by creating a shared-use path along the south side of the Mystic River. This project aims to provide a critical link in the regional transportation network by connecting two existing Department of Conservation and Recreation paths and supporting bicycle commuter access throughout the region. This project will construct an 8- to 10-foot wide pathway approximately one mile long primarily within the existing right of way of Route 16.
Source |
(FFY) 2024 |
2025 |
2026 |
2027 |
2028 |
Total |
Federal Funds |
– |
– |
– |
$6,322,994 |
– |
$6,322,994 |
Non-Federal Funds |
– |
– |
– |
$1,580,749 |
– |
$1,580,749 |
Total Funds |
– |
– |
– |
$7,903,743 |
– |
$7,903,743 |
MEDFORD: BRIDGE PRESERVATION OF 10 BRIDGES CARRYING I-93

Proponent: |
MassDOT |
ID Number: |
613211 |
Project Type: |
Bridge |
Cost: |
$1,746,000 |
Funding Source: |
Statewide Highway Funds |
This is a MassDOT-prioritized project and is therefore not directly evaluated using the MPO’s TIP scoring criteria.
Bridge preservation of substructures requiring patching in Medford. Topside repairs being completed by other contract this will maintain state of good repair.
Source |
(FFY) 2024 |
2025 |
2026 |
2027 |
2028 |
Total |
Federal Funds |
$1,396,800 |
– |
– |
– |
– |
$1,396,800 |
Non-Federal Funds |
$349,200 |
– |
– |
– |
– |
$349,200 |
Total Funds |
$1,746,000 |
– |
– |
– |
– |
$1,746,000 |
MIDDLETON: BRIDGE REPLACEMENT, M-20-003, ROUTE 62 (MAPLE STREET) OVER IPSWICH RIVER
 OVER IPSWICH RIVER")
Proponent: |
MassDOT |
ID Number: |
608522 |
Project Type: |
Bridge |
Cost: |
$3,635,960 |
Funding Source: |
Statewide Highway Funds |
This is a MassDOT-prioritized project and is therefore not directly evaluated using the MPO’s TIP scoring criteria.
The project will replace the bridge that carries Route 62 (Maple Street) over the Ipswich River in Middleton.
Source |
(FFY) 2024 |
2025 |
2026 |
2027 |
2028 |
Total |
Federal Funds |
$2,908,768 |
– |
– |
– |
– |
$2,908,768 |
Non-Federal Funds |
$727,192 |
– |
– |
– |
– |
$727,192 |
Total Funds |
$3,635,960 |
– |
– |
– |
– |
$3,635,960 |
MILFORD: REHABILITATION ON ROUTE 16, FROM ROUTE 109 TO BEAVER STREET

Proponent: |
Milford |
ID Number: |
608045 |
Project Type: |
Complete Streets |
Cost: |
$9,758,201 |
Funding Source: |
Regional Target Funds |
Category |
Safety |
Sys Pres |
CM/M |
CA/SC |
EQUITY |
EV |
Total |
Score |
20 out of 20 |
7 out of 29 |
9 out of 29 |
-1 out of 16 |
3 out of 12 |
5 out of 18 |
43 out of 134 |
This project supports enhanced vehicular safety and traffic flow through the implementation of a road diet, additional roadway reconstruction, and enhanced signalization on the Route 16 (East Main Street) corridor from Route 109 (Medway Road) to Beaver Street. In addition, the project also addresses pedestrian and bicyclist safety through the addition of pavement markings for shared-use bike lanes and the construction of new six-foot sidewalks along both sides of the roadway.
Source |
(FFY) 2024 |
2025 |
2026 |
2027 |
2028 |
Total |
Federal Funds |
– |
– |
$7,806,561 |
– |
– |
$7,806,561 |
Non-Federal Funds |
– |
– |
$1,951,640 |
– |
– |
$1,951,640 |
Total Funds |
– |
– |
$9,758,201 |
– |
– |
$9,758,201 |
MILTON: INTERSECTION IMPROVEMENTS AT ROUTE 28 (RANDOLPH AVENUE) & CHICKATAWBUT ROAD
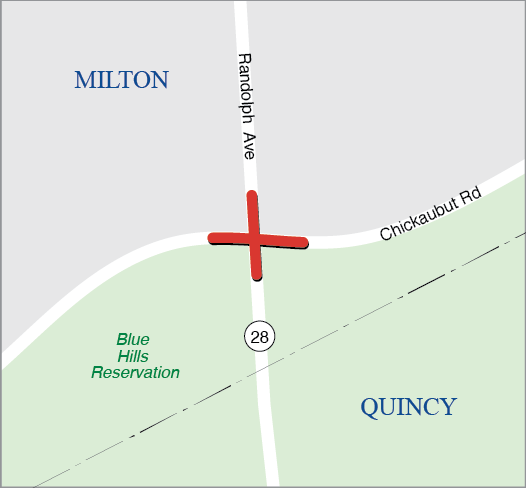
Proponent: |
MassDOT |
ID Number: |
607342 |
Project Type: |
Intersection Improvements |
Cost: |
$9,112,736 |
Funding Source: |
Regional Target Funds |
This is a MassDOT-prioritized project and is therefore not directly evaluated using the MPO’s TIP scoring criteria.
This intersection ranked second in the 2008–10 Statewide Top 200 Intersection Crash List. This project addresses the high number and severity of crashes that occur at this intersection.
Source |
(FFY) 2024 |
2025 |
2026 |
2027 |
2028 |
Total |
Federal Funds |
$7,251,041 |
– |
– |
– |
– |
$7,251,041 |
Non-Federal Funds |
$1,590,456 |
– |
– |
– |
– |
$1,590,456 |
Total Funds |
$9,112,736 |
– |
– |
– |
– |
$9,112,736 |
MWRTA: CATCHCONNECT MICTROTRANSIT SERVICE EXPANSION PHASE 2

Proponent: |
MWRTA |
ID Number: |
S12807 |
Project Type: |
Community Connections |
Cost: |
$380,477 |
Funding Source: |
Regional Target Funds |
Category |
Conn |
Coord |
Plan |
TE |
MS/DP |
FS |
Total |
Score |
6 out of 18 |
2 out of 15 |
9 out of 15 |
9 out of 18 |
22 out of 24 |
10 out of 10 |
58 out of 100 |
This project will expand the MetroWest Regional Transit Authority’s (MWRTA) CatchConnect mictrotransit program within the municipalities of Framingham and Natick. The expanded service will improve weeknight mobility in eve- ning hours between 7:30pm and 10:30pm Monday through Friday to provide a supplemental public transportation resource following the conclusion of tradtional fixed-route service.
Source |
(FFY) 2024 |
2025 |
2026 |
2027 |
2028 |
Total |
Federal Funds |
$112,000 |
$106,000 |
$86,382 |
– |
– |
$304,382 |
Non-Federal Funds |
$28,000 |
$26,500 |
$21,595 |
– |
– |
$76,095 |
Total Funds |
$140,000 |
$132,500 |
$107,977 |
— |
— |
$380,477 |
NATICK: COCHITUATE RAIL TRAIL EXTENSION, FROM MBTA STATION TO MECHANIC STREET

Proponent: |
Natick |
ID Number: |
610691 |
Project Type: |
Bicycle Network and Pedestrian Connections |
Cost: |
$7,760,451 |
Funding Source: |
Regional Target Funds |
Category |
Safety |
Sys Pres |
CM/M |
CA/SC |
EQUITY |
EV |
Total |
Score |
12 out of 30 |
11 out of 29 |
18 out of 29 |
5 out of 16 |
8 out of 12 |
13 out of 18 |
67 out of 134 |
This project will extend the Cochituate Rail Trail in Natick from its current terminus at Mechanic Street southward via a shared-use bridge to connect to the Natick Center Commuter Rail Station and Route 27.
Source |
(FFY) 2024 |
2025 |
2026 |
2027 |
2028 |
Total |
Federal Funds |
– |
– |
– |
– |
$6,208,361 |
$6,208,361 |
Non-Federal Funds |
– |
– |
– |
– |
$1,552,090 |
$1,552,090 |
Total Funds |
— |
— |
— |
— |
$7,760,451 |
$7,760,451 |
NATICK: LAKE COCHITUATE PATH

Proponent: |
MassDOT |
ID Number: |
610680 |
Project Type: |
Bicycle and Pedestrian |
Cost: |
$3,428,355 |
Funding Source: |
Statewide Highway Funds |
This is a MassDOT-prioritized project and is therefore not directly evaluated using the MPO’s TIP scoring criteria.
This project includes a 0.4-mile segment of shared-used path along Route 9 in Natick. The project limits are from Archer Drive to the Cochituate Rail Trail. No roadway crossings are proposed and the shared-use path will provide a bicycle and pedestrian connection between the Cochituate Rail Trail and the robust residential and commercial area that is located in close proximity to the project’s western terminus, filling a critical gap in the multimodal network.
Source |
(FFY) 2024 |
2025 |
2026 |
2027 |
2028 |
Total |
Federal Funds |
– |
$2,742,684 |
– |
– |
– |
$2,742,684 |
Non-Federal Funds |
– |
$685,671 |
– |
– |
– |
$685,671 |
Total Funds |
– |
$3,428,355 |
– |
– |
– |
$3,428,355 |
NATICK: BRIDGE REPLACEMENT, ROUTE 27 OVER ROUTE 9 AND INTERCHANGE IMPROVEMENTS

Proponent: |
MassDOT |
ID Number: |
605313 |
Project Type: |
Bridge |
Cost: |
$75,677,350 |
Funding Source: |
Statewide Highway Funds |
Category |
Safety |
Sys Pres |
CM/M |
CA/SC |
EQUITY |
EV |
Total |
Score |
13 out of 18 |
13 out of 20 |
11 out of 18 |
8 out of 12 |
6.7 out of 20 |
6 out of 12 |
57.7 out of 100 |
This project will completely reconfigure and reconstruct the bridge that carries Route 27 over Route 9, creating a modified diverging diamond layout that aims to improve traffic flow and roadway geometry while enhancing safety for all users. There are currently no ADA-compliant sidewalks or bike lanes on the bridge. Only one side of the bridge has sidewalks, which are in poor condition. This project will create a dedicated bicycle and pedestrian bridge along with off-road facilities throughout the project area, providing a pedestrian and bicycle link between the neighborhoods north of Route 9 with Natick Center and the Cochituate Rail Trail. Additionally, the Route 27 bridge was built in 1931 and is currently listed as structurally deficient, so this project supports a return of this overpass to a state of good repair. This project was evaluated using the MPO’s scoring criteria because it was considered for funding using Regional Target Funds. MassDOT funded the project, however.
Source |
(FFY) 2024 |
2025 |
2026 |
2027 |
2028 |
Total |
Federal Funds |
$72,301,364 |
– |
– |
– |
– |
$72,301,364 |
Non-Federal Funds |
$3,375,986 |
– |
– |
– |
– |
$3,375,986 |
Total Funds |
$75,677,350 |
— |
— |
— |
– |
$75,677,350 |
NEWTON: NEWMO MICROTRANSIT SERVICE EXPANSION PHASE 1

Proponent: |
Newton |
ID Number: |
S12694 |
Project Type: |
Community Connections |
Cost: |
$890,574 |
Funding Source: |
Regional Target Funds |
Category |
Conn |
Coord |
Plan |
TE |
MS/DP |
FS |
Total |
Score |
18 out of 18 |
14 out of 15 |
12 out of 15 |
9 out of 18 |
24 out of 24 |
10 out of 10 |
87 out of 100 |
This project will expand Newton’s existing city-wide microtransit service to include stops in Watertown, Waltham, Weston, Wellesley, Needham, and Boston, with the goal of connecting riders to an expanded network of employment centers, activity hubs, and public transportation options. NewMo is Newton’s on-demand rideshare system, operated by Via. The system uses state-of-the-art technology to cost-effectively deliver dynamically routed, shared rides using microtransit technology. The system is on track to provide 50,000 trips in its first year and sees significant ridership by low-income individuals, commuters, seniors, and students. The Boston Region MPO contributed funding to NewMo’s initial launch, with $727,000 allocated to the project’s first phase in FFYs 2021–23. This second phase is funded through the third round of grants available through the MPO’s Community Connections Programand was funded for $412,665 in FFY23 in the previous TIP.
Source |
(FFY) 2024 |
2025 |
2026 |
2027 |
2028 |
Total |
Federal Funds |
$214,597 |
$167,730 |
– |
– |
– |
$382,327 |
Non-Federal Funds |
$53,649 |
$41,933 |
– |
– |
– |
$95,582 |
Total Funds |
$268,246 |
$209,663 |
— |
— |
— |
$477,909 |
NEWTON: HORACE MANN ELEMENTARY SCHOOL IMPROVEMENTS (SRTS)
")
Proponent: |
MassDOT |
ID Number: |
611997 |
Project Type: |
Safe Routes to School |
Cost: |
$861,238 |
Funding Source: |
Statewide Highway Funds |
This is a MassDOT-prioritized project and is therefore not directly evaluated using the MPO’s TIP scoring criteria.
This project will upgrade the intersections of Crafts Street and Albemarle Road and Albemarle Road and North Street, to improve bicycle and pedestrian accommodations near the Horace Mann Elementary School, FA Day Middle School, and the Newton Early Childhood Program. The project as proposed includes installing a fully actuated traffic signal at the Crafts Street and Albemarle Road intersection and a rapid-flashing-beacon crosswalk system at the Albemarle Road and North Street intersection. It will also require signal modifications to the existing traffic signal at Crafts Street at North Street.
Source |
(FFY) 2024 |
2025 |
2026 |
2027 |
2028 |
Total |
Federal Funds |
– |
$688,990 |
– |
– |
– |
$688,990 |
Non-Federal Funds |
– |
$172,247 |
– |
– |
– |
$172,247 |
Total Funds |
– |
$861,238 |
– |
– |
– |
$861,238 |
NEWTON: INTERSECTION IMPROVEMENTS AT ROUTE 16 AND QUINOBEQUIN ROAD

Proponent: |
MassDOT |
ID Number: |
612613 |
Project Type: |
Intersection Improvements |
Cost: |
$4,872,000 |
Funding Source: |
Statewide Highway Funds |
This is a MassDOT-prioritized project and is therefore not directly evaluated using the MPO’s TIP scoring criteria.
This project will make safety improvements to the intersection of Route 16, Washington Street and Quinobequin Road in Newton near the Route 16 and Route 128/I-95 Interchange.
Source |
(FFY) 2024 |
2025 |
2026 |
2027 |
2028 |
Total |
Federal Funds |
– |
– |
– |
$4,384,800 |
– |
$4,384,800 |
Non-Federal Funds |
– |
– |
– |
$487,200 |
– |
$487,200 |
Total Funds |
– |
– |
– |
$4,872,000 |
– |
$4,872,000 |
NEWTON AND WESTON: BRIDGE REHABILITATION, N-12-010=W-29-005, COMMONWEALTH AVENUE (ROUTE 30) OVER THE CHARLES RIVER
-01.png "NEWTON AND WESTON: BRIDGE REHABILITATION, N-12-010=W-29-005, COMMONWEALTH AVENUE (ROUTE 30) OVER THE CHARLES RIVER")
Proponent: |
MassDOT |
ID Number: |
110980 |
Project Type: |
Intersection Improvements |
Cost: |
$21,851,750 |
Funding Source: |
Regional Target Funds |
This project was selected for funding by the MPO late in the FFYs 2023–27 TIP development cycle, so it has not yet been scored using the MPO’s project selection criteria. This section will be updated with the project’s final score when it is available.
This project will replace bridge N-12-010=W-29-005 that carries Commonwealth Avenue (Route 30) over the Charles River between Newton and Weston. The project aims to improve the existing poor condition of the bridge and improve safety at the interchange while adding new bicycle and pedestrian accommodations to the corridor. These new facilities for people walking and bicycling will connect to facilities being constructed as a part of adjacent projects on Route 30, including improvements in Newton that are funded by MassDOT in FFY 2023 (project number 610674) and the reconstruction of Route 30 in Weston, funded by the MPO in FFY 2026 (project number 608954).
Source |
(FFY) 2024 |
2025 |
2026 |
2027 |
2028 |
Total |
Federal Funds |
$17,481,400 |
– |
– |
– |
– |
$17,481,400 |
Non-Federal Funds |
$4,370,350 |
– |
– |
– |
– |
$4,370,350 |
Total Funds |
$21,851,750 |
– |
– |
– |
– |
$21,851,750 |
NORWOOD: BRIDGE PRESERVATION, PROVIDENCE HIGHWAY (STATE ROUTE 1) OVER THE NEPONSET RIVER
 OVER THE NEPONSET RIVER")
Proponent: |
MassDOT |
ID Number: |
605321 |
Project Type: |
Bridge |
Cost: |
$3,460,268 |
Funding Source: |
Statewide Highway Funds |
This project received a total score of 53 points when evaluated using the criteria for the pilot round of the MPO’s Community Connections Program. These criteria are listed in table A-11.
This project will rehabilitate bridge N-25-026, which carries Providence Highway (State Route 1) over the Neponset River in Norwood.
Source |
(FFY) 2024 |
2025 |
2026 |
2027 |
2028 |
Total |
Federal Funds |
– |
– |
$2,768,214 |
– |
– |
$2,768,214 |
Non-Federal Funds |
– |
– |
$692,054 |
– |
– |
$692,054 |
Total Funds |
– |
– |
$3,460,268 |
– |
– |
$3,460,268 |
NORWOOD: INTERSECTION & SIGNAL IMPROVEMENTS AT US 1 (PROVIDENCE HIGHWAY) & MORSE STREET
 & MORSE STREET")
Proponent: |
MassDOT |
ID Number: |
608052 |
Project Type: |
Intersection Improvements |
Cost: |
$1,727,573 |
Funding Source: |
Statewide Highway Funds |
This is a MassDOT-prioritized project and is therefore not directly evaluated using the MPO’s TIP scoring criteria.
This project will rehabilitate bridge N-25-026, which carries Providence Highway (State Route 1) over the Neponset River in Norwood.
Source |
(FFY) 2024 |
2025 |
2026 |
2027 |
2028 |
Total |
Federal Funds |
– |
– |
– |
– |
$1,554,816 |
$1,554,816 |
Non-Federal Funds |
– |
– |
– |
– |
$172,757 |
$172,757 |
Total Funds |
– |
– |
– |
– |
$1,727,573 |
$1,727,573 |
NORWOOD: INTERSECTION IMPROVEMENTS AT ROUTE 1 AND UNIVERSITY AVENUE/EVERETSTREET

Proponent: |
Norwood |
ID Number: |
605857 |
Project Type: |
Intersection Improvements |
Cost: |
$28,699,272 |
Funding Source: |
Regional Target Funds |
Category |
Safety |
Sys Pres |
CM/M |
CA/SC |
EQUITY |
EV |
Total |
Score |
11 out of 30 |
12 out of 29 |
15 out of 29 |
11 out of 16 |
2 out of 12 |
4 out of 18 |
55 out of 134 |
This project includes traffic signal upgrades and associated geometric improvements at the intersection of Route 1 with University Avenue and Everett Street. Related improvements include constructing an additional travel lane in each direction on Route 1, upgrading of traffic signals, lengthening of left-turn lanes on Route 1, upgrading of pe- destrian crossings at each leg of the intersection, and upgrading of bicycle amenities (loop detectors) at the inter- section. Rehabilitation of sidewalks, curbing, median structures, lighting, and guard rails are also proposed.
Source |
(FFY) 2024 |
2025 |
2026 |
2027 |
2028 |
Total |
Federal Funds |
– |
– |
$8,900,698 |
$14,058,720 |
– |
$22,959,418 |
Non-Federal Funds |
– |
– |
$2,225,174 |
$3,514,680 |
– |
$5,739,854 |
Total Funds |
— |
— |
$11,125,872 |
$17,573,400 |
— |
$28,699,272 |
PEABODY: INDEPENDENCE GREENWAY EXTENSION

Proponent: |
Peabody |
ID Number: |
609211 |
Project Type: |
Bicycle and Pedestrian |
Cost: |
$7,524,204 |
Funding Source: |
Regional Target Funds |
Category |
Safety |
Sys Pres |
CM/M |
CA/SC |
EQUITY |
EV |
Total |
Score |
9 out of 30 |
4 out of 29 |
9 out of 29 |
4 out of 16 |
4 out of 12 |
4 out of 18 |
34 out of 134 |
This project will extend the Independence Greenway 1.3 miles east from its present terminus at the North Shore Mall to the intersection of the Warren Street Extension and Endicott Street in central Peabody. When complete, the proj- ect will bring the greenway’s total length to eight miles. This project makes use of an existing rail corridor as it runs parallel to Lowell Street.
Source |
(FFY) 2024 |
2025 |
2026 |
2027 |
2028 |
Total |
Federal Funds |
$6,019,363 |
– |
– |
– |
– |
$6,019,363 |
Non-Federal Funds |
$1,504,841 |
– |
– |
– |
– |
$1,504,841 |
Total Funds |
$7,524,204 |
— |
— |
— |
— |
$7,524,204 |
PEABODY: MULTI-USE PATH CONSTRUCTION OF INDEPENDENCE GREENWAY AT INTERSTATE 95 AND ROUTE 1

Proponent: |
Peabody |
ID Number: |
610544 |
Project Type: |
Bicycle and Pedestrian |
Cost: |
$6,334,200 |
Funding Source: |
Regional Target Funds |
Category |
Safety |
Sys Pres |
CM/M |
CA/SC |
EQUITY |
EV |
Total |
Score |
15 out of 30 |
13 out of 29 |
11 out of 29 |
4 out of 16 |
4 out of 12 |
6 out of 18 |
53 out of 134 |
The project includes construction of a new 12-foot wide multi-use paved path along the abandoned railbed between two existing segments of the Independence Greenway in Peabody. The project also includes a connection to the existing Border to Boston trailhead at Lowell Street. The work includes full-depth pavement construction, minor drainage improvements, vegetative privacy screening, new and reset granite curb, new cement concrete sidewalk and hot mix asphalt, signal upgrades at the intersections of Lowell and Bourbon Streets and Route 1 northbound and Lowell Street, a new two-span steel pedestrian bridge, and various curb, walking, and parking improvements to the existing parking lot at 215 Newbury Street.
Source |
(FFY) 2024 |
2025 |
2026 |
2027 |
2028 |
Total |
Federal Funds |
– |
$5,067,360 |
– |
– |
– |
$5,067,360 |
Non-Federal Funds |
– |
$1,266,840 |
– |
– |
– |
$1,266,840 |
Total Funds |
– |
$6,334,200 |
– |
— |
— |
$6,334,200 |
PROJECT DESIGN SUPPORT PILOT
Proponent: |
CTPS |
ID Number: |
S12825 |
Project Type: |
Project Design Support Pilot |
Cost: |
$4,000,000 |
Funding Source: |
Regional Target Funds |
Set-aside funding to support the Project Design Support Pilot program, which is planned to launch in the FFY 2025- 29 TIP.
Source |
(FFY) 2024 |
2025 |
2026 |
2027 |
2028 |
Total |
Federal Funds |
– |
$4,000,000 |
– |
– |
– |
$4,000,000 |
Non-Federal Funds |
– |
– |
– |
– |
– |
– |
Total Funds |
— |
$4,000,000 |
— |
— |
— |
$4,000,000 |
QUINCY-WEYMOUTH-BRAINTREE: RESURFACING AND RELATED WORK ON ROUTE 53
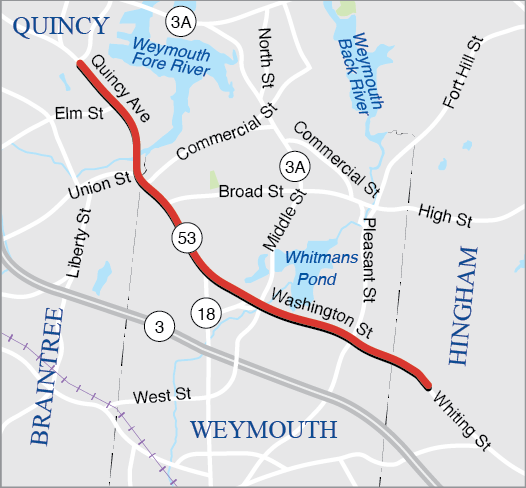
Proponent: |
MassDOT |
ID Number: |
608498 |
Project Type: |
Complete Streets |
Cost: |
$6,635,050 |
Funding Source: |
Statewide Highway Funds |
This is a MassDOT-prioritized project and is therefore not directly evaluated using the MPO’s TIP scoring criteria.
This project involves traffic and safety improvements for all users along Sea Street through the reconstruction of side- walks with ADA-compliant ramps, the provision of bicycle accommodations, and the construction of median islands. Geometric modifications of the roadway and upgraded traffic signal systems will also be established to enhance safety.
Source |
(FFY) 2024 |
2025 |
2026 |
2027 |
2028 |
Total |
Federal Funds |
– |
$5,308,040 |
– |
– |
– |
$5,308,040 |
Non-Federal Funds |
– |
$1,327,010 |
– |
– |
– |
$1,327,010 |
Total Funds |
– |
$6,635,050 |
— |
— |
— |
$6,635,050 |
RANDOLPH: RESURFACING AND RELATED WORK ON ROUTE 24

Proponent: |
MassDOT |
ID Number: |
612049 |
Project Type: |
Non-Interstate Pavement |
Cost: |
$9,128,700 |
Funding Source: |
Statewide Highway Funds |
This is a MassDOT-prioritized project and is therefore not directly evaluated using the MPO’s TIP scoring criteria.
This project will improve the pavement condition and make other associated improvements on Route 24 in Randolph between the Route 24 and Interstate 93 interchange and Page Street, a distance of approximately four miles.
Source |
(FFY) 2024 |
2025 |
2026 |
2027 |
2028 |
Total |
Federal Funds |
– |
– |
$7,302,960 |
– |
– |
$7,302,960 |
Non-Federal Funds |
– |
– |
$1,825,740 |
– |
– |
$1,825,740 |
Total Funds |
– |
– |
$9,128,700 |
– |
– |
$9,128,700 |
RANDOLPH: RESURFACING AND RELATED WORK ON ROUTE 28

Proponent: |
MassDOT |
ID Number: |
609399 |
Project Type: |
Complete Streets |
Cost: |
$7,194,377 |
Funding Source: |
Statewide Highway Funds |
This is a MassDOT-prioritized project and is therefore not directly evaluated using the MPO’s TIP scoring criteria.
This project involves the resurfacing of 13.2 lane miles of Route 28 in Randolph. The project includes two sections of Route 28, from mile marker 105.8 to 107.4 and from mile marker 107.6 to 109.3.
Source |
(FFY) 2024 |
2025 |
2026 |
2027 |
2028 |
Total |
Federal Funds |
– |
$5,755,502 |
– |
– |
– |
$5,755,502 |
Non-Federal Funds |
– |
$1,438,875 |
– |
– |
– |
$1,438,875 |
Total Funds |
– |
$7,194,377 |
— |
— |
— |
$7,194,377 |
READING: IMPROVEMENTS ON I-95

Proponent: |
MassDOT |
ID Number: |
609527 |
Project Type: |
Complete Streets |
Cost: |
$17,376,800 |
Funding Source: |
Statewide Highway Funds |
This is a MassDOT-prioritized project and is therefore not directly evaluated using the MPO’s TIP scoring criteria.
This project will improve Interstate 95 in between Commerce Way in Woburn and Ash Street in Reading, a distance of approximately two miles.
Source |
(FFY) 2024 |
2025 |
2026 |
2027 |
2028 |
Total |
Federal Funds |
– |
– |
– |
– |
$13,901,440 |
$13,901,440 |
Non-Federal Funds |
– |
– |
– |
– |
$3,475,360 |
$3,475,360 |
Total Funds |
– |
– |
— |
— |
$17,376,800 |
$17,376,800 |
READING/WOBURN: RAIL TRANSFORMATION–EARLY ACTION ITEMS - READING STATION AND WILBUR INTERLOCKING

Proponent: |
MBTA |
ID Number: |
S12821 |
Project Type: |
Transit Modernization |
Cost: |
$14,000,000 |
Funding Source: |
Regional Target Funds |
This project includes the addition of a turn track at Reading Station and improvements to the siding at Wilbur Inter- locking on the Lowell Line to enable 30 minute headways in the short term and higher frequencies with electrified rolling stock. Improvements would reduce conflicts with freight traffic and the Amtrak Downeaster while facilitating bus integration.
Source |
(FFY) 2024 |
2025 |
2026 |
2027 |
2028 |
Total |
Federal Funds |
$11,200,000 |
– |
– |
– |
– |
$11,200,000 |
Non-Federal Funds |
$2,800,000 |
– |
– |
– |
– |
$2,800,000 |
Total Funds |
$14,000,000 |
— |
— |
— |
— |
$14,000,000 |
REVERE: IMPROVEMENTS AT BEACHMONT VETERANS ELEMENTARY (SRTS)
")
Proponent: |
MassDOT |
ID Number: |
612100 |
Project Type: |
Safe Routes to School |
Cost: |
$338,329 |
Funding Source: |
Statewide Highway Funds |
This is a MassDOT-prioritized project and is therefore not directly evaluated using the MPO’s TIP scoring criteria.
This Safe Routes to School project proposes pedestrian improvements at several intersections surrounding Beachmont Veterans Elementary School in Revere. This project will reconstruct sections of sidewalk and curbing, improve markings at several crosswalks, and add tactile warning panels at some locations.
Source |
(FFY) 2024 |
2025 |
2026 |
2027 |
2028 |
Total |
Federal Funds |
– |
$270,663 |
– |
– |
– |
$270,663 |
Non-Federal Funds |
– |
$67,666 |
– |
– |
– |
$67,666 |
Total Funds |
– |
$338,329 |
– |
– |
– |
$338,329 |
REVERE: STATE ROAD BEACHMONT CONNECTOR

Proponent: |
MassDOT |
ID Number: |
612523 |
Project Type: |
Bicycle and Pedestrian |
Cost: |
$5,417,093 |
Funding Source: |
Statewide Highway Funds |
This is a MassDOT-prioritized project and is therefore not directly evaluated using the MPO’s TIP scoring criteria.
The primary goal of this project is to provide a safe path for bicyclists and improve pedestrian and vehicular safety along State Road between Donnelly Square and Eliot Circle in Revere. The proposed scope will reduce both northbound and southbound travel on State Road from two lanes to a single lane to provide bicycle and pedestrian facilities, including a two-way separated bicycle lane on the west side of the corridor and a one-way parking-protected bicycle lane along the east side of the corridor. This project will improve the sidewalk along both sides of State Road, providing a direct connection for pedestrians to the Beachmont MBTA Blue Line station that is comfortable, safe, and accessible. Crosswalks with accessible ramps are proposed across all side streets and there is a proposed crossing of State Road just south of Ocean Avenue that will connect proposed facilities to the existing sidewalk on Revere Beach Parkway.
Source |
(FFY) 2024 |
2025 |
2026 |
2027 |
2028 |
Total |
Federal Funds |
– |
– |
$4,333,674 |
– |
– |
$4,333,674 |
Non-Federal Funds |
– |
– |
$1,083,419 |
– |
– |
$1,083,419 |
Total Funds |
– |
– |
$5,417,093 |
– |
– |
$5,417,093 |
SALEM: BRIDGE REPLACEMENT, S-01-024, JEFFERSON AVENUE OVER PARALLEL STREET

Proponent: |
MassDOT |
ID Number: |
612075 |
Project Type: |
Bridge |
Cost: |
$3,123,360 |
Funding Source: |
Statewide Highway Funds |
This is a MassDOT-prioritized project and is therefore not directly evaluated using the MPO’s TIP scoring criteria.
This project will replace bridge S-01-024, which carries Jefferson Avenue over Parallel Street in Salem.
Source |
(FFY) 2024 |
2025 |
2026 |
2027 |
2028 |
Total |
Federal Funds |
– |
– |
$2,498,688 |
– |
– |
$2,498,688 |
Non-Federal Funds |
– |
– |
$624,672 |
– |
– |
$624,672 |
Total Funds |
– |
– |
$3,123,360 |
– |
– |
$3,123,360 |
SALEM: BOSTON STREET IMPROVEMENTS

Proponent: |
Salem |
ID Number: |
609437 |
Project Type: |
Complete Streets |
Cost: |
$14,172,868 |
Funding Source: |
Regional Target Funds |
Category |
Safety |
Sys Pres |
CM/M |
CA/SC |
EQUITY |
EV |
Total |
Score |
12 out of 18 |
15 out of 20 |
11 out of 18 |
8 out of 12 |
11 out of 20 |
11 out of 12 |
68 out of 100 |
This project aims to improve mobility for vehicles, bicycles, and pedestrians between Salem and Peabody and create separated bicycle facilities between the two municipalities that do not currently exist today. In addition to off-street bicycle facilities, major improvements to the corridor include incorporating Complete Streets design elements such as ADA/AAB-compliant sidewalks, pedestrian ramps, and crosswalks. This project will add a new traffic signal at the intersection of Boston Street and Aborn Street and will upgrade existing traffic signals at the intersections of Boston Street and Essex Street, Boston Street and Bridge Street/Proctor Street/Goodhue Street, and Boston Street and Grove Street/Nichols Street.
Source |
(FFY) 2024 |
2025 |
2026 |
2027 |
2028 |
Total |
Federal Funds |
– |
– |
$11,338,294 |
– |
– |
$11,338,294 |
Non-Federal Funds |
– |
– |
$2,834,574 |
– |
– |
$2,834,574 |
Total Funds |
– |
– |
$14,172,868 |
— |
— |
$14,172,868 |
SHARON: COTTAGE STREET SCHOOL IMPROVEMENTS (SRTS)
.png "SHARON: COTTAGE STREET SCHOOL IMPROVEMENTS (SRTS)")
Proponent: |
MassDOT |
ID Number: |
612889 |
Project Type: |
Safe Routes to School |
Cost: |
$1,497,906 |
Funding Source: |
Statewide Highway Funds |
This is a MassDOT-prioritized project and is therefore not directly evaluated using the MPO’s TIP scoring criteria.
This project will make upgrades to promote safety along the roadways surrounding Cottage Street Elementary School in Sharon through the Safe Routes to School program. This project proposes to create continuous sidewalks along the entirety of Cottage Street, from Billings Street to Ames Street. Work will involve reconstructing all existing sidewalks and adding new sidewalks where none exist today. The project also proposes the addition of rectangular-rapid-flashing beacons at five crosswalks along Cottage Street.
Source |
(FFY) 2024 |
2025 |
2026 |
2027 |
2028 |
Total |
Federal Funds |
– |
– |
$1,198,325 |
– |
– |
$1,198,325 |
Non-Federal Funds |
– |
– |
$299,581 |
– |
– |
$299,581 |
Total Funds |
– |
– |
$1,497,906 |
– |
– |
$1,497,906 |
SOMERVILLE: MCGRATH BOULEVARD CONSTRUCTION

Proponent: |
MassDOT |
ID Number: |
607981 |
Project Type: |
Major Infrastructure |
Cost: |
$98,840,000 |
Funding Source: |
Regional Target Funds |
Category |
Safety |
Sys Pres |
CM/M |
CA/SC |
EQUITY |
EV |
Total |
Score |
13 out of 18 |
19 out of 20 |
13 out of 18 |
8 out of 12 |
9.2 out of 20 |
10 out of 12 |
72.2 out of 100 |
This project will remove the existing McCarthy Viaduct along McGrath Boulevard in Somerville and replace it with an at-grade urban boulevard, approximately 1.5 miles long, from Broadway in the north to Third Street in the south. The project will result in more conventional intersection configurations at Washington Street and Somerville Avenue, which are currently under or next to the viaduct. Removing the viaduct will physically reconnect the neighborhoods of Somerville with more direct vehicle, pedes- trian, bicycle, and transit networks. The project will enhance transit access along the corridor, improving bus operations and the bus rider experience with the installation of floating/in-lane bus stops, transit signal priority, and bus queue-jump lanes at key intersections. New sidewalks and bicycle facilities will be provided for the length of the proposed McGrath Boulevard and will connect with the extended Somerville Community Path, creating access to the regional bicycle network. The proposed facilities will provide direct intermodal connections to existing bus routes and the new Green Line station in East Somerville. This project is anticipated to be funded over four fiscal years, with the first year of funding in FFY 2027.
Source |
(FFY) 2024 |
2025 |
2026 |
2027 |
2028 |
Total |
Federal Funds |
– |
– |
– |
$28,000,000 |
$24,000,000 |
$52,000,000 |
Non-Federal Funds |
– |
– |
– |
$7,000,000 |
$6,000,000 |
$13,000,000 |
Total Funds |
— |
— |
— |
$35,000,000 |
$30,000,000 |
$65,000,000 |
SOMERVILLE: BRIDGE PRESERVATION, S-17-031, I-93 (NB & SB) FROM ROUTE 28 TO TEMPLE STREET (PHASE 2)
 FROM ROUTE 28 TO TEMPLE STREET (PHASE 2")
Proponent: |
MassDOT |
ID Number: |
612496 |
Project Type: |
Bridge |
Cost: |
$196,000,001 |
Funding Source: |
Statewide Highway Funds |
This is a MassDOT-prioritized project and is therefore not directly evaluated using the MPO’s TIP scoring criteria.
This project will rehabilitate bridge S-17-031, which carries an elevated portion of Interstate 93 between Route 28 and Temple Street in Somerville. This is a continuation of a bridge preservation project on the same portion of Interstate 93 (project number 606528), which began construction in late 2021.
Source |
(FFY) 2024 |
2025 |
2026 |
2027 |
2028 |
Total |
Federal Funds |
– |
– |
$156,800,001 |
– |
– |
$156,800,001 |
Non-Federal Funds |
– |
– |
$39,200,000 |
– |
– |
$39,200,000 |
Total Funds |
– |
– |
$196,000,001 |
– |
– |
$196,000,001 |
STONEHAM: INTERSECTION IMPROVEMENTS AT ROUTE 28 (MAIN STREET), NORTH BORDER ROAD AND SOUTH STREET
, NORTH BORDER ROAD AND SOUTH STREET")
Proponent: |
MassDOT |
ID Number: |
610665 |
Project Type: |
Intersection Improvements |
Cost: |
$4,698,001 |
Funding Source: |
Statewide Highway Funds |
This is a MassDOT-prioritized project and is therefore not directly evaluated using the MPO’s TIP scoring criteria.
This project will make intersection improvements at Route 28 (Main Street), North Border Road, and South Street in Stoneham.
Source |
(FFY) 2024 |
2025 |
2026 |
2027 |
2028 |
Total |
Federal Funds |
– |
– |
$4,228,201 |
– |
– |
$4,228,201 |
Non-Federal Funds |
– |
– |
$469,800 |
– |
– |
$469,800 |
Total Funds |
– |
– |
$4,698,001 |
– |
– |
$4,698,001 |
STONEHAM: STONEHAM SHUTTLE SERVICE

Proponent: |
Stoneham |
ID Number: |
S12699 |
Project Type: |
Community Connections |
Cost: |
$796,817 |
Funding Source: |
Regional Target Funds |
Category |
Conn |
Coord |
Plan |
TE |
MS/DP |
FS |
Total |
Score |
15 out of 18 |
12 out of 15 |
12 out of 15 |
6 out of 18 |
17 out of 24 |
10 out of 10 |
72 out of 100 |
This project will create a local shuttle service that, will connect Stoneham residents and employees of Stoneham businesses to transportation options in surrounding communities during peak hours and within Stoneham during non-peak hours. The primary goal of this project is to fill gaps in the existing MBTA service network by creating an east-west connection across Stoneham where only north-south MBTA bus service exists today. The Town plans to use a 24-passenger bus that would operate on a 12-hour/day schedule Monday-Friday, with shorter hours on Saturday. During peak hours, the shuttle would stop at defined destinations along the route. During off-peak hours, the shuttle could go off-route based on the needs of riders. This project is funded through the third round of grants available through the MPO’s Community Connections Program and was funded for $330,189 in FFY 23 in the FFY 2023-27 TIP.
Source |
(FFY) 2024 |
2025 |
2026 |
2027 |
2028 |
Total |
Federal Funds |
$209,151 |
$164,151 |
– |
– |
– |
$373,302 |
Non-Federal Funds |
$52,288 |
$41,038 |
– |
– |
– |
$93,326 |
Total Funds |
$261,439 |
$205,189 |
– |
— |
— |
$466,628 |
SUDBURY-WAYLAND: MASS CENTRAL RAIL TRAIL (MCRT)
")
Proponent: |
MassDOT |
ID Number: |
610660 |
Project Type: |
Bicycle and Pedestrian |
Cost: |
$4,061,413 |
Funding Source: |
Statewide Highway Funds |
This is a MassDOT-prioritized project and is therefore not directly evaluated using the MPO’s TIP scoring criteria.
This project will extend the Mass Central Rail Trail from its existing terminus at Andrew Road in Wayland to Landham Road in Sudbury, a distance of approximately 1.6 miles.
Source |
(FFY) 2024 |
2025 |
2026 |
2027 |
2028 |
Total |
Federal Funds |
– |
– |
– |
$3,249,130 |
– |
$3,249,130 |
Non-Federal Funds |
– |
– |
– |
$812,283 |
– |
$812,283 |
Total Funds |
– |
– |
– |
$4,061,413 |
– |
$4,061,413 |
SWAMPSCOTT: RAIL TRAIL CONSTRUCTION

Proponent: |
Swampscott |
ID Number: |
610666 |
Project Type: |
Bicycle and Pedestrian |
Cost: |
$8,932,000 |
Funding Source: |
Regional Target Funds |
Category |
Safety |
Sys Pres |
CM/M |
CA/SC |
EQUITY |
EV |
Total |
Score |
13 out of 20 |
5 out of 14 |
18 out of 18 |
12 out of 14 |
7.4 out of 20 |
11 out of 14 |
66.4 out of 100 |
This project will construct a new 2.1-mile-long multi-use linear park running the length of Swampscott and connecting with the existing Marblehead Rail Trail and the larger East Coast Greenway. This project will provide safe, accessible connections to the Town’s schools, recreation areas, MBTA commuter rail station, and natural resources for people walking and bicycling. The project will feature a 10-foot-wide trail with a two-foot sloping shoulder on each side. The trail will cross Paradise Road (Route 1A) with a pedestrian bridge using the existing railroad abutments from the former rail line. Trail amenities will be located at the Swampscott Middle School, including bathrooms, vehicle parking for trail users, bicycle parking, and a public bike repair station.
Source |
(FFY) 2024 |
2025 |
2026 |
2027 |
2028 |
Total |
Federal Funds |
– |
– |
– |
– |
$7,145,600 |
$7,145,600 |
Non-Federal Funds |
– |
– |
– |
– |
$1,786,400 |
$1,786,400 |
Total Funds |
— |
— |
— |
— |
$8,932,000 |
$8,932,000 |
TOPSFIELD: BRIDGE REPLACEMENT, T-06-013, PERKINS ROW OVER MILE BROOK

Proponent: |
MassDOT |
ID Number: |
612076 |
Project Type: |
Bridge |
Cost: |
$3,141,758 |
Funding Source: |
Statewide Highway Funds |
This is a MassDOT-prioritized project and is therefore not directly evaluated using the MPO’s TIP scoring criteria.
This project will replace bridge T-06-013, which carries Perkins Row over Mile Brook in Topsfield.
Source |
(FFY) 2024 |
2025 |
2026 |
2027 |
2028 |
Total |
Federal Funds |
– |
– |
$2,513,406 |
– |
– |
$2,513,406 |
Non-Federal Funds |
– |
– |
$628,352 |
– |
– |
$628,352 |
Total Funds |
– |
– |
$3,141,758 |
– |
– |
$3,141,758 |
TRANSIT MODERNIZATION PROGRAM
Proponent: |
Regionwide |
ID Number: |
S12113 |
Project Type: |
Transit Modernization |
Cost: |
$21,500,000 |
Funding Source: |
Regional Target Funds |
No projects have yet been scored using the Transit Modernization criteria. Projects will be evaluated by the MPO in future TIP cycles for funding within this investment program.
The MPO’s Transit Modernization Program was established in Destination 2040, the MPO’s current Long-Range Trans- portation Plan. This program will allocate a portion of the MPO’s Regional Target Highway funds to transit projects that advance the MPO’s goals in the region, including upgrades to stations and facilities and the purchase of vehicles for transit providers. The MPO has begun allocating approximately five percent of its annual funding, or $6,500,000 annually, to this program beginning in FFY 2025. Specific projects will be funded using these reserved funds in future TIP cycles.
Source |
(FFY) 2024 |
2025 |
2026 |
2027 |
2028 |
Total |
Federal Funds |
– |
$2,500,000 |
$6,500,000 |
$6,500,000 |
$6,500,000 |
$21,500,000 |
Non-Federal Funds |
– |
– |
– |
– |
– |
– |
Total Funds |
— |
$2,500,000 |
$6,500,000 |
$6,500,000 |
$6,500,000 |
$21,500,000 |
WAKEFIELD: COMPREHENSIVE DOWNTOWN MAIN STREET RECONSTRUCTION

Proponent: |
Wakefield |
ID Number: |
613145 |
Project Type: |
Complete Streets |
Cost: |
$16,581,200 |
Funding Source: |
Regional Target Funds |
Category |
Safety |
Sys Pres |
CM/M |
CA/SC |
EQUITY |
EV |
Total |
Score |
13 out of 30 |
13 out of 29 |
10 out of 29 |
6 out of 16 |
8.8 out of 12 |
11 out of 18 |
61.8 out of 134 |
This complete streets project redesigns Route 129 Main Street in downtown Wakefield to integrate comprehensive multimodal facilities through the addition of shared-use-paths, median refuges, curb bumpouts, and other geomet- ric improvements. The project improves safety for all users with upgrades to lighting and turn radii, including for emergency response vehicles.
Source |
(FFY) 2024 |
2025 |
2026 |
2027 |
2028 |
Total |
Federal Funds |
– |
– |
– |
– |
$13,264,960 |
$13,264,960 |
Non-Federal Funds |
– |
– |
– |
– |
$3,316,240 |
$3,316,240 |
Total Funds |
— |
— |
— |
— |
$16,581,200 |
$16,581,200 |
WALTHAM: INTERSTATE MAINTENANCE AND RELATED WORK ON I-95

Proponent: |
MassDOT |
ID Number: |
612048 |
Project Type: |
Interstate Pavement |
Cost: |
$16,039,175 |
Funding Source: |
Statewide Highway Funds |
This is a MassDOT-prioritized project and is therefore not directly evaluated using the MPO’s TIP scoring criteria.
This project will resurface Interstate 95 in Waltham between Route 2 and Route 20, a distance of approximately four miles.
Source |
(FFY) 2024 |
2025 |
2026 |
2027 |
2028 |
Total |
Federal Funds |
$14,435,258 |
– |
– |
– |
– |
$14,435,258 |
Non-Federal Funds |
$1,603,918 |
– |
– |
– |
– |
$1,603,918 |
Total Funds |
$16,039,175 |
– |
– |
– |
– |
$16,039,175 |
WATERTOWN: REHABILITATION OF MOUNT AUBURN STREET (ROUTE 16)
")
Proponent: |
Watertown |
ID Number: |
607777 |
Project Type: |
Complete Streets |
Cost: |
$27,899,345 |
Funding Source: |
Regional Target Funds |
This is a MassDOT-prioritized project and is therefore not directly evaluated using the MPO’s TIP scoring criteria.
The project will reconstruct approximately 9,300 feet of Mount Auburn Street, from the Cambridge city line to the intersection with Summer Street, just east of Watertown Square. The project involves revisions to the roadway geometry, including a roadway diet to reduce the number of lanes; safety improvements; multimodal accommodations, including shared or exclusive bike lanes; improvements to the existing traffic signal equipment; and improved ADA amenities at intersections.
Source |
(FFY) 2024 |
2025 |
2026 |
2027 |
2028 |
Total |
Federal Funds |
$2,795,399 |
– |
– |
– |
– |
$2,795,399 |
Non-Federal Funds |
$696,850 |
– |
– |
– |
– |
$698,850 |
Total Funds |
$3,494,249 |
— |
— |
— |
— |
$3,494,249 |
WATERTOWN: INTERSECTION IMPROVEMENTS AT ROUTE 16 AND GALEN STREET

Proponent: |
MassDOT |
ID Number: |
608564 |
Project Type: |
Intersection Improvements |
Cost: |
$3,449,261 |
Funding Source: |
Regional Target Funds |
This is a MassDOT-prioritized project and is therefore not directly evaluated using the MPO’s TIP scoring criteria.
This project will make safety improvements to the intersection of Route 16 and Galen Street in Watertown. This location features a 2010–2019 pedestrian crash cluster and a 2017–2019 all-mode crash cluster, making it a high-priority safety improvement location.
Source |
(FFY) 2024 |
2025 |
2026 |
2027 |
2028 |
Total |
Federal Funds |
– |
– |
$3,104,335 |
– |
– |
$3,104,335 |
Non-Federal Funds |
– |
– |
$344,926 |
– |
– |
$344,926 |
Total Funds |
– |
– |
$3,449,261 |
– |
– |
$3,449,261 |
WATERTOWN: PLEASANT STREET SHUTTLE SERVICE EXPANSION

Proponent: |
Watertown |
ID Number: |
S12697 |
Project Type: |
Community Connections |
Cost: |
$1,002,198 |
Funding Source: |
Regional Target Funds |
Category |
Conn |
Coord |
Plan |
TE |
MS/DP |
FS |
Total |
Score |
18 out of 18 |
12 out of 15 |
9 out of 15 |
9 out of 18 |
20 out of 24 |
10 out of 10 |
78 out of 100 |
This project will expand upon the existing Pleasant Street Shuttle in Watertown, which launched in September 2021 as a partnership between the Town of Watertown and the Watertown TMA. The service runs along a 1.5-mile stretch of Pleasant Street that has no transit service. The primary goal of the project is to provide peak-hour shuttle services connecting businesses and residential locations to major transit hubs in Watertown and Cambridge. This expansion will allow the existing 60-minute headways to be reduced to 30 minutes and will support the transition of the service to an all-electric vehicle fleet. This project is funded through the third round of grants available through the MPO’s Community Connections Program and was funded for $437,825 in FFY23 in the FFY 2023-27 TIP.
Source |
(FFY) 2024 |
2025 |
2026 |
2027 |
2028 |
Total |
Federal Funds |
$268,347 |
$183,151 |
– |
– |
– |
$451,498 |
Non-Federal Funds |
$67,087 |
$45,788 |
– |
– |
– |
$112,875 |
Total Funds |
$335,434 |
$228,939 |
– |
— |
— |
$564,373 |
WESTON: INTERSECTION IMPROVEMENTS AT BOSTON POST ROAD (ROUTE 20) AT WELLESLEY STREET
 AT WELLESLEY STREET")
Proponent: |
Weston |
ID Number: |
608940 |
Project Type: |
Intersection Improvements |
Cost: |
$2,185,303 |
Funding Source: |
Regional Target Funds |
Category |
Safety |
Sys Pres |
CM/M |
CA/SC |
EQUITY |
EV |
Total |
Score |
15 out of 21 |
9 out of 17 |
10 out of 18 |
8 out of 12 |
5.6 out of 20 |
3 out of 12 |
50.6 out of 100 |
This project aims to address the safety concerns and crash incidents that contribute to the intersection’s inclusion on the state’s HSIP eligibility list as a high-crash location while also seeking to alleviate traffic congestion in the area. The project scope in- cludes the installation of a new traffic signal system, reconfiguring the intersection to address documented safety issues, consoli- dating pavement area, and the simplification of turning movements. Proposed pedestrian improvements include replacement of sidewalks along the north side of Route 20 and the east side of Boston Post Road. New sidewalk is proposed on the south side of Route 20, the west side of Boston Post Road, and on both sides of Wellesley Street within the immediate intersection limits. The proposed traffic signal system includes protected pedestrian crossings and crosswalks are proposed on all approaches to the intersection. The project also includes the addition of bicycle lanes and improvements to a school bus stop on adjacent Windsor Way.
Source |
(FFY) 2024 |
2025 |
2026 |
2027 |
2028 |
Total |
Federal Funds |
– |
– |
$1,748,242 |
– |
– |
$1,748,242 |
Non-Federal Funds |
– |
– |
$437,061 |
– |
– |
$437,061 |
Total Funds |
— |
— |
$2,185,303 |
— |
— |
$2,185,303 |
WESTON: RECONSTRUCTION ON ROUTE 30
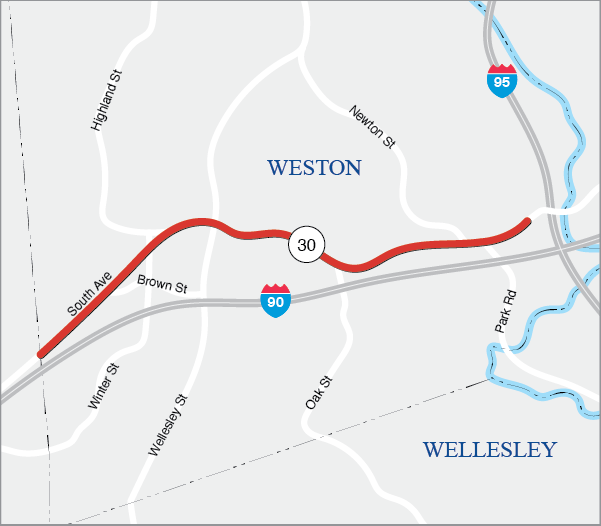
Proponent: |
Weston |
ID Number: |
608954 |
Project Type: |
Complete Streets |
Cost: |
$16,420,119 |
Funding Source: |
Regional Target Funds |
Category |
Safety |
Sys Pres |
CM/M |
CA/SC |
EQUITY |
EV |
Total |
Score |
11 out of 18 |
10 out of 20 |
10 out of 18 |
9 out of 12 |
6.2 out of 20 |
3 out of 12 |
49.2 out of 100 |
This project will improve pavement and roadway conditions along a 3.7-mile segment of Route 30 and make geometric and safety improvements at intersections along the corridor. A key goal of the project is to create a corridor that better serves all users, especially those who are walking and bicycling. To that end, this project will construct a 10-foot off-road shared-use path along the full length of the project. The path will run along the south side of the roadway from the Natick town line to the intersection at Newton Street, crossing to the north side at Newton Street to continue to the end of the project limits. This path will connect with other proposed bicycle and pedestrian accommodations in the area, including on the Route 30 bridge over the Charles River (project number 110980, funded by the MPO in FFY 2024) and on Route 30 in Newton (project number 610674, funded by MassDOT in FFY 2023).
Source |
(FFY) 2024 |
2025 |
2026 |
2027 |
2028 |
Total |
Federal Funds |
– |
– |
$13,136,095 |
– |
– |
$13,136,095 |
Non-Federal Funds |
– |
– |
$3,284,024 |
– |
– |
$3,284,024 |
Total Funds |
— |
— |
$16,420,119 |
— |
— |
$16,420,119 |
WESTWOOD-NORWOOD: RECONSTRUCTION OF CANTON STREET TO UNIVERSITY DRIVE, INCLUDING REHAB OF N-25-032=W-31-018

Proponent: |
Westwood |
ID Number: |
608158 |
Project Type: |
Complete Streets |
Cost: |
$22,094,875 |
Funding Source: |
Regional Target Funds |
Category |
Safety |
Sys Pres |
CM/M |
CA/SC |
EQUITY |
EV |
Total |
Score |
12 out of 30 |
14.5 out of 29 |
9 out of 29 |
3.75 out of 16 |
5 out of 12 |
9 out of 18 |
53.3 out of 134 |
This project will reconstruct the roadway and install pedestrian and bicycle facilities where none currently exist. A sidewalk will be constructed along the southbound side of the roadway, with a shared-use-path constructed along the northbound side. The project improves visibility at five curves along the corridor to improve stopping sight distances, including the addition of apron turn lanes and medians for improved navigation. High visibility crosswalks and beacons will be added at seven locations.
Source |
(FFY) 2024 |
2025 |
2026 |
2027 |
2028 |
Total |
Federal Funds |
– |
– |
– |
– |
$17,675,900 |
$17,675,900 |
Non-Federal Funds |
– |
– |
– |
– |
$4,418,975 |
$4,418,975 |
Total Funds |
— |
— |
— |
— |
$22,094,875 |
$22,094,875 |
WILMINGTON: BRIDGE REPLACEMENT, W-38-029 (2KV), ST 129 LOWELL STREET OVER I 93
, ST 129 LOWELL STREET OVER I 93")
Proponent: |
MassDOT |
ID Number: |
608703 |
Project Type: |
Bridge |
Cost: |
$16,592,888 |
Funding Source: |
Statewide Highway Funds |
This is a MassDOT-prioritized project and is therefore not directly evaluated using the MPO’s TIP scoring criteria.
This project includes the addition of five-foot bicycle lanes along both sides of the roadway along the Route 38 cor- ridor. Sidewalks will also be provided along both sides of the roadway between Route 62 and Route 129. In addition, improved traffic signals and the reconstruction of turn lanes will enhance pedestrian safety and improve vehicular flow. This project is bisected at its midpoint by project number 607327, Bridge Replacement, W-38-002, Route 38 (Main Street) over the B&M Railroad. This project is funded using $12,662,437 in statewide highway funds in FFY 2023.
Source |
(FFY) 2024 |
2025 |
2026 |
2027 |
2028 |
Total |
Federal Funds |
– |
$18,985,143 |
– |
– |
– |
$18,985,143 |
Non-Federal Funds |
– |
$4,746,286 |
– |
– |
– |
$4,746,286 |
Total Funds |
— |
$23,731,429 |
— |
— |
— |
$23,731,429 |
WILMINGTON: RECONSTRUCTION ON ROUTE 38 (MAIN STREET), FROM ROUTE 62 TO THE WOBURN CITY LINE
, FROM ROUTE 62 TO THE WOBURN CITY LIN")
Proponent: |
Wilmington |
ID Number: |
608051 |
Project Type: |
Complete Streets |
Cost: |
$24,644,177 |
Funding Source: |
Regional Target Funds |
Category |
Safety |
Sys Pres |
CM/M |
CA/SC |
EQUITY |
EV |
Total |
Score |
15 out of 30 |
12 out of 29 |
13 out of 29 |
10 out of 16 |
1 out of 12 |
8 out of 18 |
59 out of 134 |
This project includes the addition of five-foot bicycle lanes along both sides of the roadway along the Route 38 corridor. Sidewalks will also be provided along both sides of the roadway between Route 62 and Route 129. In addition, improved traffic signals and the reconstruction of turn lanes will enhance pedestrian safety and improve vehicular flow.
Source |
(FFY) 2024 |
2025 |
2026 |
2027 |
2028 |
Total |
Federal Funds |
– |
$19,815,342 |
– |
– |
– |
$19,815,342 |
Non-Federal Funds |
– |
$4,828,835 |
– |
– |
– |
$4,828,835 |
Total Funds |
— |
$24,644,177 |
— |
— |
— |
$24,644,177 |
![]()
WOBURN: INTERSTATE PAVEMENT PRESERVATION AND RELATED WORK ON I-95

Proponent: |
MassDOT |
ID Number: |
612034 |
Project Type: |
Interstate Pavement |
Cost: |
$7,849,699 |
Funding Source: |
Statewide Highway Funds |
This is a MassDOT-prioritized project and is therefore not directly evaluated using the MPO’s TIP scoring criteria.
This project is a pavement maintenance project that will repave 4.1 miles of Interstate 95 northbound and southbound between the Cambridge Street interchange in Burlington and the Interstate 93 interchange in Woburn.
Source |
(FFY) 2024 |
2025 |
2026 |
2027 |
2028 |
Total |
Federal Funds |
$7,064,729 |
– |
– |
– |
– |
$7,064,729 |
Non-Federal Funds |
$784,970 |
– |
– |
– |
– |
$784,970 |
Total Funds |
$7,849,699 |
– |
– |
– |
– |
$7,849,699 |
WOBURN: ROADWAY AND INTERSECTION IMPROVEMENTS AT WOBURN COMMON, ROUTE 38 (MAIN STREET), WINN STREET, PLEASANT STREET, AND MONTVALE AVENUE
, WINN STREET, PLEASANT STREET, AND MONTVALE AVENUE")
Proponent: |
Woburn |
ID Number: |
610662 |
Project Type: |
Complete Streets |
Cost: |
$17,382,600 |
Funding Source: |
Regional Target Funds |
Category |
Safety |
Sys Pres |
CM/M |
CA/SC |
EQUITY |
EV |
Total |
Score |
22 out of 30 |
15 out of 29 |
16 out of 29 |
10 out of 16 |
4 out of 12 |
8 out of 18 |
75 out of 134 |
Improve safety and congestion within the Woburn Common area by making safety and operational improvements, reconfiguring the Woburn Common rotary, and reconstructing and realigning roadways. The project will also recon- struct sidewalks, add bike lanes, and upgrade or add signals in the area.
Source |
(FFY) 2024 |
2025 |
2026 |
2027 |
2028 |
Total |
Federal Funds |
– |
– |
$13,906,080 |
– |
– |
$13,906,080 |
Non-Federal Funds |
– |
– |
$3,476,520 |
– |
– |
$3,476,520 |
Total Funds |
— |
— |
$17,382,600 |
— |
— |
$17,382,600 |
WOBURN AND BURLINGTON: INTERSECTION RECONSTRUCTION AT ROUTE 3 (CAMBRIDGE ROAD) AND BEDFORD ROAD AND SOUTH BEDFORD STREET
 AND BEDFORD ROAD AND SOUTH BEDFORD STREET")
Proponent: |
MassDOT |
ID Number: |
608067 |
Project Type: |
Intersection Improvements |
Cost: |
$1,978,080 |
Funding Source: |
Regional Target Funds |
Category |
Safety |
Sys Pres |
CM/M |
CA/SC |
EQUITY |
EV |
Total |
Score |
9 out of 30 |
11 out of 29 |
19 out of 29 |
7 out of 16 |
2 out of 12 |
4 out of 18 |
52 out of 134 |
The intersection of U.S. Route 3 (Cambridge Street) at South Bedford Street and Bedford Road has been identified as a high-crash location in the Boston region. The existing geometry and traffic operations can often present challenges for motorists, pedestrians, and bicyclists. This project will reconstruct the intersection and all traffic signal equipment. Geometry enhancements will be made to accommodate exclusive turn lanes for all approaches to the intersection. The project will include reconstruction of the sidewalk along the east side of Cambridge Street and both sides of the Bedford Road westbound approach, and new sidewalk will be constructed on the south side of South Bedford Street. Bicycle accommodations consisting of five-foot wide bicycle lanes (with two-foot wide buffers where feasible) will be provided, as will ADA-compliant MBTA bus stops on Cambridge Street.
Source |
(FFY) 2024 |
2025 |
2026 |
2027 |
2028 |
Total |
Federal Funds |
– |
$1,582,464 |
– |
– |
– |
$1,582,464 |
Non-Federal Funds |
– |
$395,616 |
– |
– |
– |
$395,616 |
Total Funds |
– |
$1,978,080 |
– |
– |
– |
$1,978,080 |
WRENTHAM: CONSTRUCTION OF INTERSTATE 495/ROUTE 1A RAMPS

Proponent: |
MassDOT |
ID Number: |
603739 |
Project Type: |
Major Infrastructure |
Cost: |
$17,994,890 |
Funding Source: |
Regional Target Funds |
Category |
Safety |
Sys Pres |
CM/M |
CA/SC |
EQUITY |
EV |
Total |
Score |
23 out of 30 |
11 out of 29 |
12 out of 29 |
9 out of 16 |
0 out of 12 |
0 out of 18 |
55 out of 134 |
This project consists of the construction of ramps at the interchange of Route 1A and Interstate 495 to accommodate increased volumes resulting from development at the interchange. The design may proceed by developers and, de- pending on cost and scale of development proposals, MassDOT may incorporate ramp construction into a highway project. Future mitigation packages for developers may involve a median island to meet MassDOT’s and the Town of Wrentham’s long-range plan for the interchange.
Source |
(FFY) 2024 |
2025 |
2026 |
2027 |
2028 |
Total |
Federal Funds |
$14,395,912 |
– |
– |
– |
– |
$14,395,912 |
Non-Federal Funds |
$3,598,978 |
– |
– |
– |
– |
$3,598,978 |
Total Funds |
$17,994,890 |
— |
— |
— |
— |
$17,994,890 |
Performance-based planning and programming (PBPP) applies data and performance management principles to inform transportation decision-making. The purpose of PBPP is to ensure that transportation investment decisions are oriented toward meeting established goals. PBPP activities include:
The Boston Region MPO’s PBPP process is shaped by both federal transportation performance management requirements and the MPO’s goals and objectives, which are established as part of the MPO’s Long-Range Transportation Plan (LRTP). This chapter discusses how these two frameworks shape the MPO’s PBPP process and describes the MPO’s current set of performance measures and targets. It also explains how the MPO anticipates the projects funded in the Federal Fiscal Years (FFYs) 2024–28 Transportation Improvement Program (TIP) will support improvements in various performance areas and make progress toward performance targets.
PBPP requirements originated with the enactment of the Moving Ahead for Progress in the 21st Century Act (MAP-21) in 2012. MAP-21 directed states, MPOs, and public transportation providers to carry out a performance and outcome-based surface transportation program. (MAP-21 identified seven national goals for the nation’s highway system, which are described in Appendix E.) Table 4-1 shows the relationship between these national goal areas and the MPO’s goal areas. The MPO’s goals and related objectives in the 2019 LRTP, Destination 2040, are described in more detail in Chapter 1 of this document. The MPO is currently developing its next LRTP, Destination 2050. Once it is adopted, the goals and objectives described there-in will shape the development of MPO processes, including the PBPP process.
Table 4-1
National and Boston Region MPO Goal Areas
National Goal Area |
Boston Region MPO Goal Areas |
Safety |
Safety |
Infrastructure Condition |
System Preservation and Modernization |
System Reliability |
Capacity Management and Mobility |
Congestion Reduction |
Capacity Management and Mobility |
Environmental Sustainability |
Clean Air and Sustainable Communities |
Freight Movement/Economic Vitality |
Capacity Management and Mobility, Economic Vitality |
Reduced Project Delivery Delays |
Not Applicable |
Not Applicable |
Transportation Equity |
Source: Boston Region MPO staff.
The US Department of Transportation (USDOT) has established performance measures in areas relevant to the national goals. Table 4-2 lists these measures for the transit system and Table 4-3 for the roadway system.
Table 4-2
Federally Required Transit Performance Measures
National Goal Area |
Transit Performance Area or Asset Category |
Performance Measures |
Relevant MPO Goal Area |
Safety |
Fatalities |
|
Safety |
Safety |
Injuries |
|
Safety |
Safety |
Safety Events |
|
Safety |
Safety |
System Reliability |
|
Safety |
Infrastructure Condition |
Equipment |
|
System Preservation and Modernization |
Infrastructure Condition |
Rolling Stock |
|
System Preservation and Modernization |
Infrastructure Condition |
Infrastructure |
|
System Preservation and Modernization |
Infrastructure Condition |
Facilities |
|
System Preservation and Modernization |
FTA = Federal Transit Administration. MPO = metropolitan planning organization. ULB = useful life benchmark. VRM = vehicle-revenue miles.
Sources: National Public Transportation Safety Plan (January 2017), the Public Transportation Agency Safety Plan Rule (49 CFR Part 673), and the Transit Asset Management Rule (49 CFR Part 625).
Table 4-3
Federally Required Roadway Performance Measures
National Goal Area |
Roadway |
Performance Measures |
Relevant MPO Goal Area |
Safety |
Injuries and Fatalities |
• Number of fatalities |
Safety |
Infrastructure Condition |
Pavement Condition |
• Percent of pavements on the Interstate System in good condition |
System Preservation and Modernization |
Infrastructure Condition |
Bridge Condition |
• Percent of NHS bridges by deck area classified as in good condition |
System Preservation and Modernization |
System Reliability |
Performance of the National Highway System |
• Percent of the person-miles traveled on the Interstate System that are reliable |
Capacity Management/ Mobility |
System Reliability, Freight Movement and Economic Vitality |
Freight Movement on the Interstate System |
• Truck Travel Time Reliability Index (for truck travel on Interstate highways) |
Capacity Management/ Mobility, Economic Vitality |
Congestion Reduction |
Congestion Mitigation and Air Quality |
• Annual hours of peak hour excessive delay per capita (for travel on NHS roadways) |
Capacity Management/ Mobility |
Environmental Sustainability |
Congestion Mitigation and Air Quality |
• Total emissions reduction for applicable pollutants and precursors for CMAQ-funded projects in designated nonattainment and maintenance areas* |
Clean Air/Sustainable Communities |
*As of April 2022, the MPO was no longer in maintenance for carbon monoxide. However, the MPO must fulfill these performance requirements at least until the FHWA issues an updated applicability determination related to CMAQ performance requirements (expected in October 2023).
CMAQ = Congestion Mitigation and Air Quality Improvement Program. MPO = metropolitan planning organization. NHS = National Highway System.
Sources: Highway Safety Improvement Program Rule (23 CFR 924), National Performance Management Measures Rule (23 CFR 490), and the Boston Region MPO staff.
The MPO’s PBPP framework is also used to inform decision-making in other areas that relate to its federally mandated responsibilities or to the MPO’s goals and objectives. For example, the MPO has established a transportation equity goal and objectives that states that all people receive comparable benefits from, and are not disproportionately burdened by, MPO investments, regardless of race, color, national origin, age, income, ability, or sex. The MPO’s work in this area includes assessing the equity implications of the projects proposed and funded in the TIP. Regular equity performance monitoring enables the MPO to better understand how transportation equity populations may be affected by transportation investment decisions, so that it can decide whether and how to adjust its investment approach. These activities for the FFYs 2024−28 TIP are described in Chapter 6.
Setting federally-required performance measures involves three phases: (1) planning, (2) investing, and (3) monitoring and evaluating performance outcomes.
In the planning phase, agencies set goals and objectives for the transportation system, identify performance measures, and set performance targets. They identify and acquire data and conduct analyses needed to support these processes. They also outline the frameworks they will use to make decisions in key planning documents.
The Commonwealth of Massachusetts creates performance-based plans, such as the Strategic Highway Safety Plan (SHSP) for improving roadway safety and the Transportation Asset Management Plan (TAMP) for improving infrastructure condition, particularly for NHS roads and bridges. Similarly, transit providers create Transit Asset Management (TAM) plans and Public Transportation Agency Safety Plans (PTASPs) that describe the data and processes these agencies will use to address transit state of good repair and safety needs. The Commonwealth is responsible for setting performance targets for the federally required roadway performance measures described in Table 4-3, while transit agencies must set targets for the measures described in Table 4-2.
The MPO’s activities in the planning phase include creating a goals-and-objectives framework in its LRTP and other performance-based plans—such as Congestion Mitigation and Air Quality Improvement (CMAQ) Program Performance Plans—as necessary. The MPO also establishes targets for federally required performance measures. It may support performance targets set by the Massachusetts Department of Transportation (MassDOT) or public transit providers, or it may set separate targets for the MPO’s planning area.
In the investing phase, agencies use the framework established in the planning phase to create strategies for investing transportation funds. When updating the LRTP, the MPO creates investment programs and funding guidelines to help direct project investments. In each TIP cycle, the MPO selects projects to fund in these programs. MPO members rely on several sets of information when selecting projects:
Meanwhile, MassDOT, the Massachusetts Bay Transportation Authority (MBTA), Cape Ann Transportation Authority (CATA), and MetroWest Regional Transit Authority (MWRTA) follow their respective processes to select projects and programs for inclusion in the MassDOT Capital Investment Plan (CIP). The federally funded investments that are included in the CIP are also documented in the MPO’s TIP.
After making plans and investments, agencies report on performance outcomes. This reporting includes tracking trends, collecting data to understand the results of investment decisions, and comparing targets to actual performance. Going forward, the MPO plans to conduct before-and-after studies to learn how the actual outcomes of TIP projects compare to expectations.
In addition, the MPO describes performance on various transportation metrics through its Congestion Management Process (CMP) and tools such as the MPO’s Performance Dashboard. MassDOT reports on performance targets and progress to the Federal Highway Administration (FHWA) and posts the information on the MassDOT Performance Management Tracker website. Public transit providers report their targets and performance progress to the Federal Transit Administration (FTA).
Federal transportation agencies require states, public transit operators, and MPOs to share information to ensure consistency across processes. In Massachusetts, these coordination responsibilities are outlined in the 2019 Performance-Based Planning and Programming Agreement between MassDOT, Massachusetts MPOs and transportation planning organizations, the MBTA, and regional transit authorities (RTAs) operating in Massachusetts.
Staff from Massachusetts MPOs, MassDOT staff, and other stakeholders coordinate on PBPP implementation through the Transportation Program Managers Group, including through its subcommittee on performance measures. For performance measures that states and MPOs track at the Boston MA-NH-RI Urbanized Area (UZA) level, coordination responsibilities are documented in the 2018 Boston MA-NH-RI UZA Memorandum of Understanding (MOU). 4-1 The Boston Region MPO is also a signatory to the Providence RI-MA UZA and the Worcester MA-CT UZA memoranda of understanding—these agreements define intergovernmental coordination responsibilities and activities that may support PBPP.
This section discusses investments in the FFYs 2024−28 TIP and how they relate to elements of the MPO’s PBPP framework.4-2
Through its Safety goal area, MPO has committed to investing in projects and programs that aim to reduce the number and severity of crashes for all modes, and the number of serious injuries and fatalities occurring on the transportation system. Similarly, the Massachusetts SHSP and National Roadway Safety Strategy include a long-term “Vision Zero” goal to move “towards zero deaths” by eliminating fatalities and serious injuries, and they provide a comprehensive framework for improving safety on all public roads in the Commonwealth. 4-3 The Commonwealth’s Bicycle Transportation and Pedestrian Transportation Plans also include initiatives and actions intended to make walking and biking safer. 4-4
The MBTA, MWRTA, and CATA produce PTASPs that describe how they will implement safety management systems (SMS). 4-5 Transit providers support SMS through safety management policies, safety risk management strategies, safety assurance methods (which include performance monitoring), and safety promotion. PTASPs also describe the performance targets these agencies set for measures outlined in the National Public Transportation Safety Plan.
For each calendar year (CY), the Commonwealth and the MPO must set targets for five federally required roadway safety performance measures:
Values are expressed as five-year rolling annual averages and are tracked using information from the Massachusetts Crash Data System and the National Highway Traffic Safety Administration’s (NHTSA’s) Fatality Analysis and Reporting System (FARS).
The most current set of roadway safety performance targets reflect a CY 2019–23 rolling annual average, as required by FHWA. The Commonwealth considered the following factors when setting these targets:
Table 4-4 shows the CY 2023 roadway safety performance targets and the Commonwealth’s long-term targets.
Table 4-4
Massachusetts Safety Performance Targets
Performance Measure |
CY 2023 Target |
MA Long-Term Target |
Number of Fatalities |
355.00 |
0.00 |
Fatality Rate (per 100M VMT) |
0.59 |
0.00 |
Number of Serious Injuries |
2,569.00 |
0.00 |
Serious Injury Rate (per 100M VMT) |
4.25 |
0.00 |
Number of Nonmotorized Fatalities and Serious Injuries |
437.00 |
0.00 |
* These targets are expressed as five-year rolling annual averages.
CY = calendar year. M = million. MA = Massachusetts. VMT = vehicle-miles traveled.
Sources: Federal Highway Administration, Commonwealth of Massachusetts, Boston Region MPO staff.
Figures 4-1 through 4-5 display actual and draft data, projections, and CY 2023 targets for Massachusetts for each roadway safety performance measure. The figures are based on data that were available in spring and summer 2022, when the Commonwealth was setting CY 2022 targets. In February 2023, the MPO endorsed the Commonwealth’s CY 2023 roadway safety performance targets as the targets for the region. This approach reflects the way the MPO collaborates with the Commonwealth on safety strategies to reduce fatalities and injuries in the Boston region.
Figure 4-1 shows five-year rolling averages for fatalities for Massachusetts and the Boston region, both of which increased in 2021. Because total fatalities declined between 2017 and 2020, the 2021 increase still produces a five-year rolling average that is lower than that of 2016 and earlier. However, given the implementation of the Commonwealth’s speed management campaigns and other safety measures, as well as the decrease in fatalities between 2016 and 2019, the number of expected fatalities in 2023 is lower than the number of fatalities in the years since 2020. The Commonwealth set a target that anticipates an average of 355 fatalities for 2019–23, which the MPO also accepted. The Commonwealth continues to have an overarching goal of zero fatalities and injuries on Massachusetts’ roadways.
Figure 4-1
Number of Fatalities
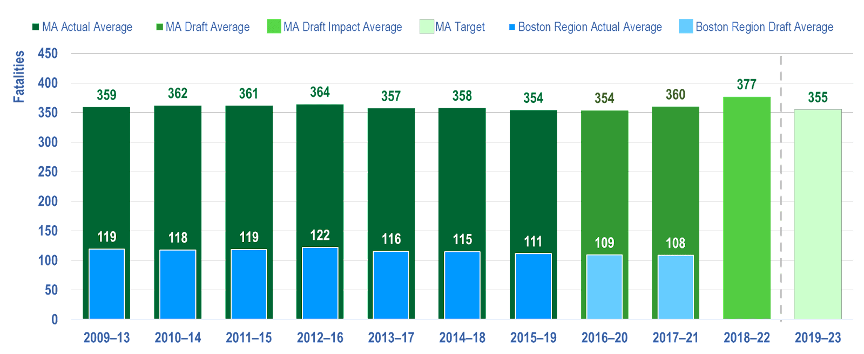
Notes: Values reflect five-year rolling annual averages and have been rounded to the nearest integer. The 2016–20 and 2017–21 averages were calculated in spring 2022 using draft data for 2020 and 2021.
MA = Massachusetts.
Sources: National Highway Traffic Safety Administration Fatality Analysis and Reporting System, Massachusetts Department of Transportation, and Boston Region MPO staff.
Figure 4-2 shows past trends, projections, and the Commonwealth’s CY 2022 target for the fatality rate per 100 million VMT. Because of the COVID-19 pandemic, VMT decreased in 2020 compared to prior years but rebounded in 2021. The Commonwealth estimates that 2022 VMT values will be higher, reflecting a gradual return to pre-pandemic levels of travel. Based on these trends, the Commonwealth set a target for the 2019–23 rolling average of 0.596 fatalities per 100 million VMT, which the MPO also accepted.
Figure 4-2
Fatality Rate per 100 Million VMT
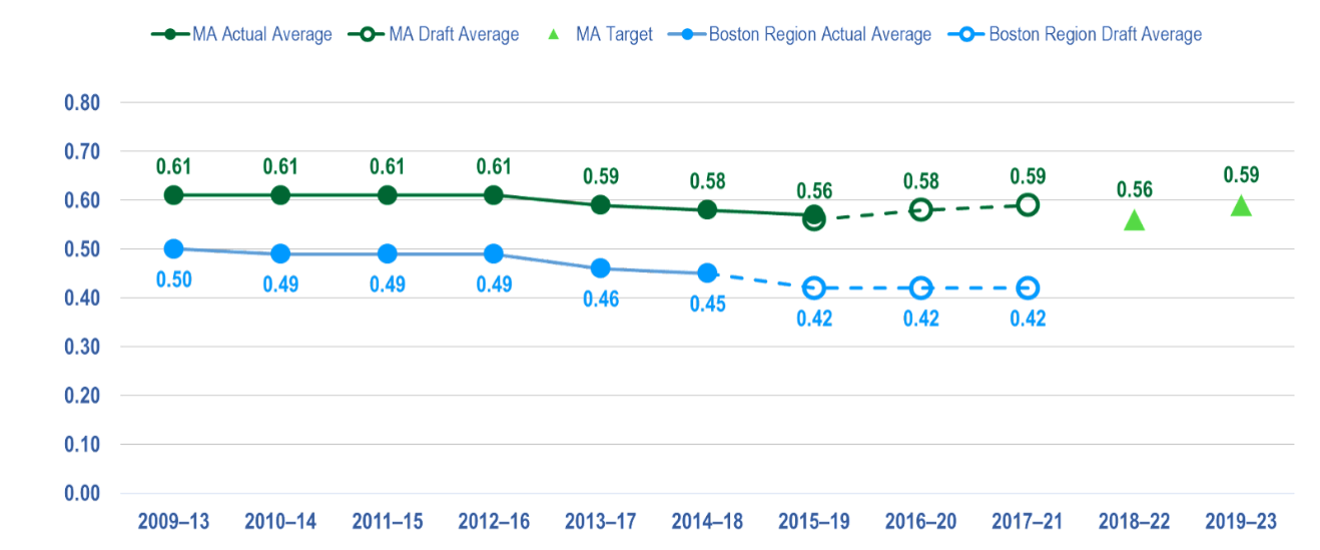
Notes: Values reflect five-year rolling annual averages and have been rounded to the hundredths decimal place. The 2016–20 and 2017–21 averages were calculated in spring 2022 using draft data for 2020 and 2021.
MA = Massachusetts. VMT = vehicle-miles traveled.
Sources: National Highway Traffic Safety Administration Fatality Analysis and Reporting System, Massachusetts Department of Transportation, and Boston Region MPO staff.
Figure 4-3 shows past trends, projections, and the Commonwealth’s CY 2022 target for the number of serious injuries. Five-year rolling averages for the serious injury-oriented measures have decreased over time in both Massachusetts and the Boston region. The number of serious injuries that occurred in 2020 was lower than previous years, likely affected by the pandemic and related travel behavior changes. However, serious injuries increased in 2021 to the highest levels since 2016. Given the decreases in serious injuries between 2016 and 2020, the five-year rolling target for 2023 assumes a two percent decrease from the 2021 performance. Based on these calculations, the Commonwealth set a target that anticipates an average of 2,569 serious injuries in 2019–23, which the MPO also accepted.
Figure 4-3
Number of Serious Injuries
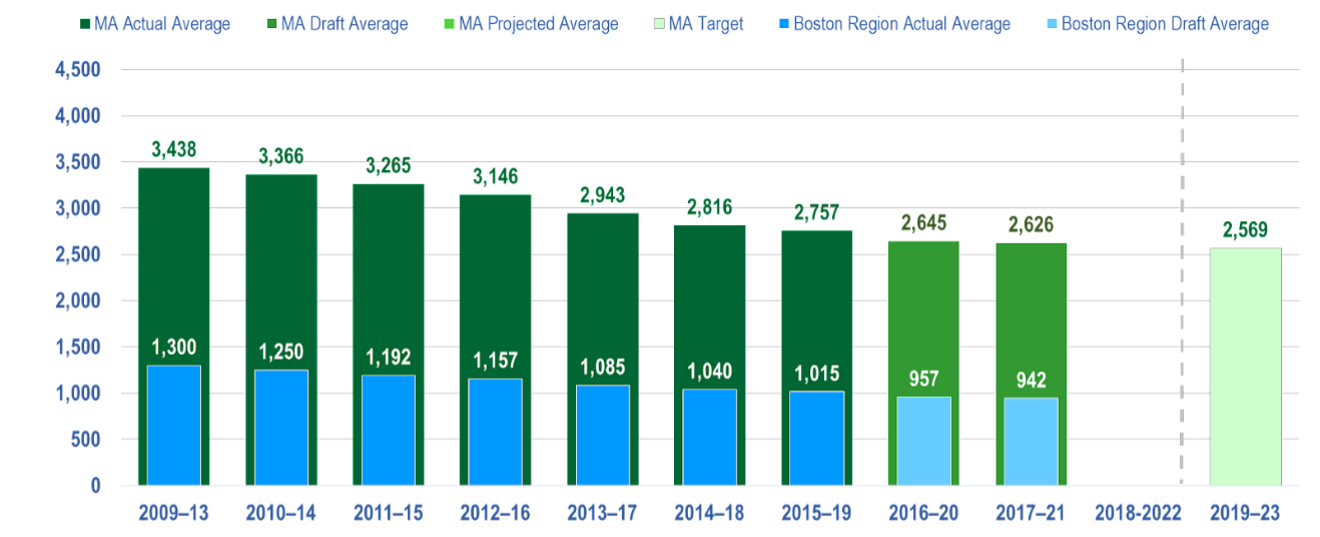
Notes: Values reflect five-year rolling annual averages and have been rounded to the nearest integer. The 2016–20 and 2017–21 averages were calculated in spring 2022 using draft data for 2020 and 2021.
MA = Massachusetts.
Sources: Massachusetts Department of Transportation and Boston Region MPO Staff.
Figure 4-4 shows past trends and projections pertaining to the serious injury rate per 100 million VMT, as well as the Commonwealth’s target 2019–23 average of 4.25 serious injuries per 100 million vehicle-miles traveled, which the MPO also accepted.
Figure 4-4
Serious Injury Rate per 100 Million VMT
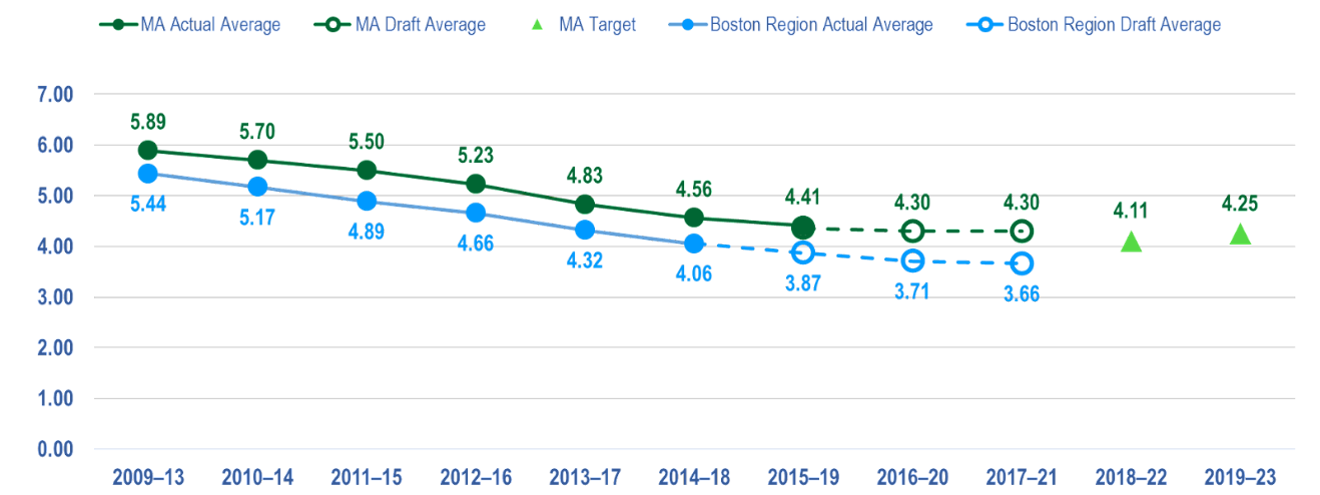
Notes: Values reflect five-year rolling annual averages and have been rounded to the nearest integer. The 2016–20 and 2017–21 averages were calculated in spring 2022 using draft data for 2020 and 2021.
MA = Massachusetts. VMT = vehicle-miles traveled.
Sources: Massachusetts Department of Transportation and Boston Region MPO staff.
Figure 4-5 shows past trends, projections, and the CY 2023 target for the number of nonmotorized fatalities and serious injuries for both Massachusetts and the Boston region. These figures include fatalities and serious injuries of people who walk, bicycle, skate, or use wheelchairs or other mobility devices. When developing this target, the Commonwealth considered fluctuations in the annual number of nonmotorized fatalities and serious injuries, including the reduction in these crash outcomes that occurred in 2020 and the increase in 2021. The Commonwealth assumed that the number of nonmotorized fatalities and serious injuries in 2023 would decrease by six percent from the five-year rolling average for 2021. Using these calculations, the Commonwealth set a target average for 2019–23 of 437 nonmotorized fatalities and serious injuries, which the MPO accepted.
Figure 4-5
Number of Nonmotorized Fatalities and Serious Injuries
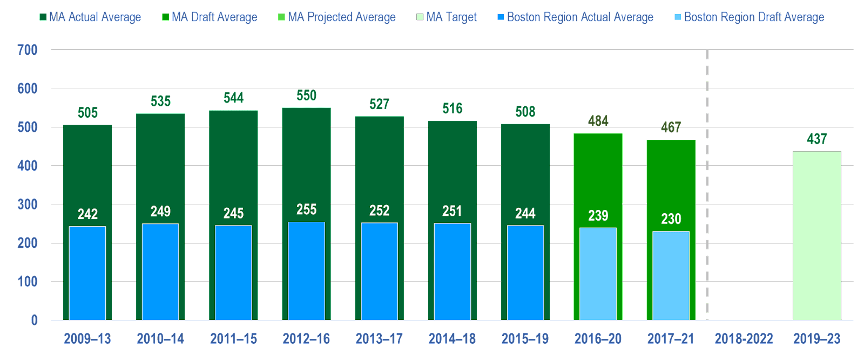
Notes: Values reflect five-year rolling annual averages and have been rounded to the nearest integer. The 2016–20 and 2017–21 averages were calculated in spring 2022 using draft data for 2020 and 2021.
MA = Massachusetts. VMT = vehicle-miles traveled.
Sources: Massachusetts Department of Transportation and Boston Region MPO staff.
By endorsing the Commonwealth’s roadway safety targets for the Boston region, the MPO agreed to program projects that help achieve those targets. When selecting projects to fund, the MPO identifies projects likely to improve safety outcomes through its TIP project selection criteria. Criteria account for crash activity within the project area and the types of safety countermeasures included in the proposed project.
All projects funded by the MPO include safety countermeasures or features that are expected to improve safety for motorists, bicyclists, and pedestrians. Projects in the Intersection Improvement, Complete Streets, and Major Infrastructure programs are expected to improve safety on roadways for multiple travel modes, while its Bicycle Network and Pedestrian Connections projects will improve safety for those traveling by nonmotorized means.
Table 4-5 lists performance metrics that assess how FFYs 2024–28 corridor, intersection, and bicycle and pedestrian projects may improve safety. 4-6 The information shown indicates the number of projects that have safety countermeasures and improvements focused on high-crash locations. Table A-2 in Appendix A summarizes the impacts each Regional Target project is expected to have on performance areas discussed throughout this chapter, including safety performance.
Table 4-5
FFYs 2024–28 Projects: Roadway Safety Performance Metrics
Metric |
Value |
Regional Target projects that address all-mode HSIP clusters1 |
14 projects |
All-mode HSIP cluster locations addressed by Regional Target projects1 |
25 locations |
Regional Target projects that address HSIP Pedestrian clusters2 |
9 projects |
HSIP pedestrian cluster locations addressed by Regional Target projects2 |
13 locations |
Regional Target projects that address HSIP bicycle clusters2 |
6 projects |
HSIP bicycle cluster locations addressed by Regional Target projects2 |
7 locations |
Project areas where fatal crashes have occurred3 |
0 areas |
Project areas where injury crashes have occurred3 |
35 areas |
Note: The group of projects reflected in this table does not include Community Connections investments or Transit Modernization investments.
1 All-mode HSIP clusters are based on crash data from 2017 to 2019.
2 HSIP bicycle clusters and HSIP pedestrian clusters are based on data from 2010 to 2019.
3 Analysis of crashes in Regional Target project areas is based on crash data from 2017 to 2020
HSIP = Highway Safety Improvement Program.
Sources: Massachusetts Crash Data System, Massachusetts Department of Transportation, and the Boston Region MPO.
The projects in the FFYs 2024–28 TIP funded by MassDOT will also improve safety and are expected to reduce fatalities and serious injuries on the region’s roadways. MassDOT’s Intersection Improvements, Roadway Improvements, Roadway Reconstruction, Safe Routes to School, and Safety Improvements programs most directly address safety considerations. In addition, the Reliability and Modernization programs focus on maintaining and upgrading infrastructure, which help make roadway travel safer. The various bridge and pavement improvement programs may also improve safety by supporting asset maintenance and state of good repair. The Bicycle and Pedestrian projects may reduce nonmotorized fatalities and injuries by improving separated facilities for bicyclists and pedestrians.
The National Public Transportation Safety Plan details performance measures for which transit agencies subject to the PTASP rule must set targets. Transit agencies revisit their performance targets when updating their PTASPs each year. Required performance measures include the following include the following: 4-7
MPOs have their own responsibilities pertaining to transit safety measures. MPOs must set regional targets for these transit safety performance measures in coordination with transit agencies and states. MPOs document these targets in the LRTPs and TIPs and consider proposed transit investments in the context of how they may improve transit safety. The Boston Region MPO updated its set of transit safety performance targets on March 2, 2023. This update includes the MBTA’s, MWRTA’s, and CATA’s safety targets. Each agency’s targets are presented separately to reflect the local context, including the characteristics of the local operating environments and planned investments, policies, and safety-management activities.
The MBTA sets targets for four modes: heavy rail (Red, Orange, and Blue Lines), light rail (Green Line and the Mattapan High Speed Line), bus, and The RIDE paratransit system. Based on CY 2019–21 averages, the MBTA runs approximately 1,897,000 VRM of service on its heavy rail system; 463,000 VRM on its light rail system; 1,925,000 VRM on its bus network; and 11,475,000 VRM for The RIDE. The MBTA’s commuter rail network and ferry service are not subject to these FTA requirements and are addressed outside of the PTASP process.
Table 4-6 shows averages for the transit safety measures for MBTA heavy rail, light rail, bus, and The RIDE from CYs 2019 to 2021.
Table 4-6
Past Safety Performance Data for MBTA Transit Services
(CYs 2019–21 Averages)
MBTA Mode |
Average Fatalities |
Average Fatality Rate1 |
Average Injuries |
Average Injury Rate1 |
Average Safety Events |
Average Safety Event |
Average System Reliability Value2 |
Heavy Rail |
0.33 |
0.01 |
184.00 |
8.16 |
25.00 |
1.09 |
43,713.00 |
Light Rail |
0.00 |
0.00 |
81.00 |
14.64 |
28.00 |
5.04 |
7,515.00 |
Bus |
1.00 |
0.05 |
292.00 |
12.48 |
100.00 |
4.29 |
29,099.00 |
The RIDE |
0.00 |
0.00 |
27.00 |
2.31 |
21.00 |
1.77 |
61,231.00 |
Notes: This table reflects data available at the time the MBTA developed its targets.
1 Fatality, injury, and safety event rates are expressed per one million VRM. Rate values have been rounded to the nearest hundredth.
2 The system reliability measure is expressed as mean VRM traveled per major mechanical failure.
CY = calendar year. MBTA = Massachusetts Bay Transportation Authority. VRM = vehicle revenue-miles.
Source: MBTA and the Boston Region MPO staff.
The MBTA’s safety performance targets for CY 2023 are shown in Table 4-7. When setting targets, the MBTA varied its approach by measure:
Table 4-7
MBTA CY 2023 Safety Performance Targets
MBTA Mode |
Fatalities Target |
Fatality Rate Target1 |
Injuries Target |
Injury Rate Target1 |
Safety Events Target |
Safety Event Target1 |
System Reliability Target2 |
Heavy Rail |
0.0 |
0.0 |
180.0 |
7.99 |
24.0 |
1.07 |
44,500 |
Light Rail |
0.0 |
0.0 |
79.0 |
14.35 |
27.0 |
4.94 |
7,650 |
Bus |
0.0 |
0.0 |
286 |
12.23 |
98.0 |
4.21 |
29,500 |
The RIDE3 |
0.0 |
0.0 |
27.0 |
2.27 |
20.0 |
1.74 |
62,500 |
1 Fatality, injury, and safety event rates are expressed per one million VRM. Rate values have been rounded to the nearest tenth.
2 The system reliability measure is expressed as mean VRM traveled per major mechanical failure.
3 The injuries target for The RIDE remains the same as past averages due to rounding.
CY = calendar year. MBTA = Massachusetts Bay Transportation Authority. VRM = vehicle revenue-miles.
Source: MBTA and the Boston Region MPO staff.
CATA monitors safety performance and sets targets for its fixed-route bus service and its demand response service. According to averages calculated using state fiscal years (SFYs) 2018–22 data, CATA’s demand response system runs about 136,000 VRM annually, and its fixed-route bus system runs about 279,000 VRM annually. 4-10 Table 4-8 provides SFY 2018–22 averages for the fatality, injury, safety event, and system reliability measures for CATA’s fixed-route bus and demand response systems. 4-11
Table 4-8
Past Safety Performance Data for CATA Transit Services
(SFY 2018–22 Averages)
CATA Mode |
Average Fatalities |
Average Fatality Rate1 |
Average Injuries |
Average Injury Rate1 |
Average Safety Events |
Average Safety Event Rate1 |
Average System Reliability Value2 |
Fixed- Route Bus |
0.0 |
0.0 |
0.2 |
0.1 |
2.4 |
0.2 |
73,603 |
Demand Response |
0.0 |
0.0 |
0.2 |
0.2 |
1.2 |
0.8 |
133,848 |
Note: Values have been rounded to the nearest tenth.
1 Fatality, injury, and safety event rates are expressed per one hundred thousand VRM.
2 The system reliability measure is expressed as mean VRM traveled per major mechanical failure.
CATA = Cape Ann Transportation Authority. CY = calendar year. VRM = vehicle revenue-miles.
Sources: CATA, the National Transit Database, and the Boston Region MPO staff.
Table 4-9 provides a summary of CATA’s SFY 2023 performance targets, which cover the period from July 2022 to June 2023. Targets are expressed per one hundred thousand VRM. In general, CATA used past data and averages as the basis for determining its transit safety performance targets for SFY 2023. When CATA set targets, it reviewed data for years when injuries or safety events did take place. CATA also accounted for the number of preventable accidents that occurred on its systems, in addition to incidents reported to the National Transit Database (NTD).
Table 4-9
CATA SFY 2023 Safety Performance Targets
CATA Mode |
Fatalities Target |
Fatality Rate Target1 |
Injuries Target |
Injury Rate Target1 |
Safety Events Target |
Safety Event Target1 |
System Reliability Target2 |
Fixed- Route Bus |
0.0 |
0.0 |
1.0 |
0.5 |
2.5 |
1.5 |
70,000.0 |
Demand Response |
0.0 |
0.0 |
1.0 |
0.5 |
1.5 |
1.0 |
135,000.0 |
Note: Values have been rounded to the nearest tenth.
1 Fatality, injury, and safety event rates are expressed per one hundred thousand VRM.
2 The system reliability measure is expressed as mean VRM traveled per major mechanical failure.
CATA = Cape Ann Transportation Authority. SFY = state fiscal year. VRM = vehicle revenue-miles.
Source: CATA and the Boston Region MPO staff.
MWRTA monitors performance and sets targets for fixed-route bus service and demand response services. According to averages calculated using SFYs 2018–22 data, MWRTA’s demand response system runs about 843,000 VRM annually, and its fixed-route bus system runs about 1,124,000 VRM annually. 4-12 Table 4-10 shows SFY 2018–22 averages for the transit safety measures for MWRTA’s transit services. 4-13 MWRTA’s rate values are expressed in 100,000 VRM.
Table 4-10
Past Safety Performance Data for
MWRTA Transit Services (SFYs 2018–22 Averages)
MWRTA Mode |
Average Fatalities |
Average Fatality Rate1 |
Average Injuries |
Average Injury Rate1 |
Average Safety Events |
Average Safety Event Rate1 |
Average System Reliability Value2 |
Fixed- Route Bus |
0.0 |
0.0 |
0.6 |
0.05 |
1.4 |
0.13 |
128,551 |
Demand Response |
0.0 |
0.0 |
0.6 |
0.07 |
1.6 |
0.20 |
67,468 |
Note: Values have been rounded to the nearest tenth.
1 Fatality, injury, and safety event rates are expressed per one hundred thousand VRM.
2 The system reliability measure is expressed as mean VRM traveled per major mechanical failure.
MWRTA = MetroWest Regional Transit Authority. VRM = vehicle revenue-miles.
Sources: MWRTA, the National Transit Database, and the Boston Region MPO staff.
Table 4-11 provides a summary of MWRTA’s SFY 2022 performance targets, which include fatality, injury, and safety event rates expressed per one hundred thousand VRM. MWRTA set its transit safety performance targets by reviewing historic safety data for its fleet and by planning to operate as safely as possible and by proactively addressing hazards as they are identified.
Table 4-11
MWRTA SFY 2023 Safety Performance Targets
MWRTA Mode |
Fatalities Target |
Fatality Rate Target1 |
Injuries Target |
Injury Rate Target1 |
Safety Events Target |
Safety Event Target1 |
System Reliability Target2 |
Fixed- Route Bus |
0.00 |
0.00 |
12.00 |
1.0 |
15.0 |
1.25 |
75,000 |
Demand Response |
0.00 |
0.00 |
8.00 |
1.0 |
10.0 |
1.25 |
75,000 |
Note: Values have been rounded to the nearest tenth
1 Fatality, injury, and safety event rates are expressed per one hundred thousand VRM.
2 The system reliability measure is expressed as mean VRM traveled per major mechanical failure.
MWRTA = MetroWest Regional Transit Authority. VRM = vehicle revenue-miles.
Source: MWRTA and the Boston Region MPO.
MassDOT and the transit agencies in the Boston region account for safety when selecting transit projects for capital investment programs, including the TIP. Safety is part of MassDOT’s Reliability priority area and investment programs are sized to support MBTA and RTA asset condition. Safety issues are also considered at the level of individual investments. For example, members of the MBTA Safety team review all candidate projects to determine whether they may address documented existing or potential safety hazards.
Table 4-12
TIP Projects Supporting Safety Performance
TIP Project |
Regional Transit Agency |
Type |
Lynn Station Improvements Phase 2 |
MBTA |
Station upgrades |
Jackson Square Accessibility Improvements |
MBTA |
Accessibility upgrades |
Reading Station and Wilbur Interlocking |
MBTA |
Rail Transformation—Interlocking turn track upgrades |
Columbus Avenue Bus Lanes Phase 2 |
MBTA |
Bus lanes |
MPO-funded corridor and intersection projects can also help improve safety outcomes for bus and paratransit services by making the region’s roadways safer. The MPO has also set aside $5.5 million per year in its Transit Modernization investment program starting in FFY 2025. While the MPO continues to work with MassDOT and the region’s transit agencies to define the scope of this program, in October 2020 the MPO established baseline transit safety evaluation criteria for this program, which mirror the evaluation criteria used by the MBTA.
The MBTA’s planned capital investments are intended to improve safety outcomes, asset condition, and system reliability. The MBTA plans to improve a number of its stations, while Blue Line improvements will include rebuilding the Long Wharf emergency egress and improving track and tunnel infrastructure and communication rooms.
CATA and MWRTA also plan to make investments that will support safety. CATA will continue to use its federal and state dollars to fund preventative maintenance activities, improve its administration and maintenance facility, and purchase new revenue vehicles to replace those that have reached the end of their useful life. Similarly, MWRTA will continue to purchase replacement vehicles and invest in improvements to its Blandin terminal facility and the intermodal center at the commuter rail station in Framingham. MWRTA’s planned facilities investments during the FFYs 2024–28 include a new body shop to support efficient and cost-effective repair of its vehicles. Transit agency investments are also discussed in the System Preservation and Modernization Performance section of this chapter and additional details about these investments are available in Chapter 3.
In 2023, the MPO was awarded a federal Safe Streets and Roads for All discretionary grant for $2.1 million. The MPO will use this grant money to create an action plan, and the MPO will continue to work with its planning partners and other stakeholders to better understand roadway and transit risk, measure safety outcomes, and invest in projects that will reduce fatalities and injuries.
Another of the MPO’s goals is to maintain and modernize the transportation system and plan for its resiliency. There is a need to address existing maintenance and state-of-good-repair needs for roads, sidewalks, and transit assets, update infrastructure to meet customer needs, and prepare for existing or future extreme conditions such as sea level rise and flooding.
Projects funded in the FFYs 2024–28 TIP support asset condition improvements, which complement MassDOT’s and transit agencies’ more extensive state-of-good-repair and modernization projects. MassDOT uses information from its asset management systems to guide decisions about asset maintenance and modernization and considers roadway investment priorities from its TAMP. 4-14 Similarly, transit agencies that receive FTA funding must produce TAM plans that describe transit system assets and their condition, along with the tools and investment strategies these agencies will use to improve these assets.
To meet federal performance monitoring requirements, states and MPOs must track and set performance targets for the condition of bridges on the National Highway System (NHS). Bridge condition performance measures include the following:
NHS bridge condition is classified based on the condition ratings of three bridge components: the deck, the superstructure, and the substructure. The lowest rating of the three components determines the overall bridge condition. The measures express the share of NHS bridges in a certain condition by deck area, divided by the total deck area of NHS bridges in the MPO region or state.
Table 4-13 shows performance baselines for NHS bridge condition in Massachusetts and the Boston region. MassDOT determined that Massachusetts has 2,246 NHS bridges and analyzed those bridges to understand their current condition with respect to the federal bridge-condition performance measures. In 2022, MassDOT analyzed the 844 NHS bridges in the region at that time. According to these baseline values, the Boston region had a smaller share of NHS bridge deck area considered to be in good condition and a slightly larger share of NHS bridge deck area considered to be in poor condition, compared to Massachusetts overall.
Table 4-13
NHS Bridge Condition Baselines for Massachusetts and the Boston Region
Geographic Area |
Total NHS Bridges |
Total NHS Bridge Deck Area (square feet) |
Percent of NHS Bridge Deck Area in Good Condition |
Percent of NHS Bridge Deck Area in PoorCondition |
Massachusetts1 |
2,246 |
28,689,888 |
16.9% |
11.2% |
Boston Region |
844 |
13,916,199 |
15.7% |
12.9% |
1 Massachusetts baseline data is based on a MassDOT analysis conducted in 2022.
NHS = National Highway System.
Sources: Massachusetts Department of Transportation and the Boston Region MPO staff.
States must set performance targets for NHS bridge and pavement condition measures at two-year and four-year intervals. Table 4-14 shows the baseline Massachusetts value calculated in 2022 and MassDOT’s current NHS bridge performance targets established in 2023. The two-year target reflects conditions as of the end of CY 2023, and the four-year target reflects conditions as of the end of CY 2025. These targets reflect the bridge condition MassDOT anticipated based on historic trends and planned bridge investments. As shown in the table, MassDOT anticipated that the share of NHS bridge deck area in good condition and poor condition would be nearly identical to the baseline.
Table 4-14
Massachusetts NHS Bridge Condition Targets
Federally Required Bridge Condition Performance Measure |
Baseline (CY 2022) |
Two-Year Target |
Four-Year Target |
MA Long Term Target |
Percent of NHS Bridges [by deck area] that are in good condition |
16% |
16% |
16% |
>18% |
Percent of NHS Bridges [by deck area] that are in poor condition |
12% |
16% |
12% |
< 10% |
MA = Massachusetts. MassDOT = Massachusetts Department of Transportation. NHS = National Highway System.
Sources: MassDOT and the Boston Region MPO staff.
The Boston Region MPO elected to support MassDOT’s four-year bridge performance targets in February 2023. This approach reflects the ways that each entity supports bridge improvements in the Boston region. The MPO’s Regional Target program typically makes modest contributions to bridge improvements in the Boston region, while the MassDOT Bridge Program remains the region’s primary funding source for replacement or rehabilitation of substandard bridges.
As with NHS bridges, USDOT’s performance-management framework requires states and MPOs to monitor and set targets for the condition of pavement on NHS roadways. According to the 2020 Massachusetts’ Road Inventory Year End Report, 10,409 lane-miles (about 14 percent of statewide lane mileage) are part of the NHS. This figures includes 3,206 lane-miles on the Interstate System and 7,203 lane miles of non-Interstate NHS roadways. All Interstate roadways in Massachusetts are owned by MassDOT, which also owns 4,433 lane-miles (62 percent) of non-Interstate NHS roadways.
Within the Boston region, 3,706 lane-miles (16 percent all of roadway lane miles) are part of the NHS. Of these, 1,170 lane miles (37 percent) are on the Interstate System, which is owned by MassDOT. Of the 2,536 non-Interstate NHS roadway lane-miles, 1,224 lane-miles (48 percent) are owned by MassDOT.
Federal NHS pavement performance measures include the following:
Interstate pavement is classified as in good or poor condition using the International Roughness Index (IRI) and one or more pavement distress metrics (cracking and/or rutting and faulting) depending on the pavement type (asphalt, jointed concrete, or continuous concrete). FHWA sets thresholds for each metric that determine whether the metric value is good, fair, or poor, along with thresholds that determine whether the pavement segment as a whole is in good or poor condition.
In 2023, MassDOT established performance targets for NHS pavement condition performance measures. The two-year target reflects conditions as of the end of CY 2023, and the four-year target reflects conditions as of the end of CY 2025. The other types of distress data have not previously been required as part of MassDOT pavement-monitoring programs. 4-15 At the time of target setting, MassDOT noted that setting targets for these pavement-condition measures is challenging given the lack of complete historic data. MassDOT’s approach when setting targets was to use past pavement indicators to identify trends and to set conservative targets. Table 4-15 shows MassDOT’s performance targets for these measures along with baseline data as of 2021.
Table 4-15
Massachusetts NHS Pavement Condition Targets
Federally Required Pavement Condition Performance Measure1 |
Baseline |
Two-Year Target |
Four-Year Target |
Percent of Interstate Highway System pavements that are in good condition2 |
72% |
70% |
70% |
Percent of Interstate Highway System pavements that are in poor condition |
0% |
2% |
2% |
Percent of non-Interstate NHS pavements that are in good condition |
33.9% |
30% |
30% |
Percent of non-Interstate NHS pavements that are in poor condition |
2.9% |
5% |
5% |
1 The 2021 values for pavement condition are as of January 1, 2021.
2 These values reflect the International Roughness Index only.
CY = calendar year. NHS = National Highway System.
Sources: MassDOT and the Boston Region MPO staff.
MPOs are required to set four-year Interstate and non-Interstate NHS pavement-condition performance targets by either supporting state targets or setting separate quantitative targets for the region. The Boston Region MPO elected to support MassDOT’s four-year targets for these NHS pavement-condition measures in March 2023. This approach reflects the ways that each entity supports NHS and other pavement improvements in the Boston region. The MPO’s policy has been to not use Regional Target funds for projects that only resurface pavement. MassDOT’s pavement-improvement programs, along with its other corridor and intersection improvement programs, provide the majority of funding for pavement improvements in the Boston region. However, the MPO does fund roadway reconstruction projects that include pavement improvements in addition to other design elements, and through this process the MPO will work with MassDOT to make progress towards these NHS pavement-condition targets.
When prioritizing capital investments for the TIP, the MPO uses its project evaluation criteria to assess how well each project funded with Regional Target dollars may help maintain or modernize the Boston region’s roadway infrastructure. The MPO’s criteria prioritize projects that improve poor condition bridges, pavement, sidewalks, and signals, or that improve the network’s ability to support emergency response and respond to extreme conditions. 4-16 In October 2020, the MPO adopted an updated set of project selection criteria that
More information about the MPO’s current TIP criteria is available in Appendix A.
Table 4-16 displays metrics and information about how the MPO’s FFYs 2024–28 Regional Target projects are expected to improve infrastructure on the region’s roadways. MPO staff developed estimated values for these metrics using available data from MassDOT’s Bridge Inventory and Road Inventory files; project proponent information such as functional design reports; results from TIP project evaluations; and other sources. The MPO expects that these FFYs 2024–28 investments will help make progress towards statewide NHS bridge and pavement condition targets, help improve the overall condition of the region’s roadways and bridges, and address resiliency needs.
Table 4-16
Regional Target Projects: Roadway System Preservation and Modernization Performance Metrics
Metric |
Value |
Bridge structures improved |
8 structures |
NHS bridge structures improved |
7 structures |
New bridge structures to be constructed |
6 structures |
Lane miles of substandard pavement improved1 |
68.39 lane miles |
Lane miles of substandard NHS pavement improved1 |
41.4 lane miles |
Miles of substandard sidewalk improved |
27.46 miles |
Projects that improve emergency response |
25 projects |
Projects that improve the ability to respond to extreme weather or climate conditions |
17 projects |
Transit stations improved |
4 stations |
Note: Community Connections projects do not include system preservation and modernization elements and are not included in this table.
1 Substandard pavement and sidewalk designations are based on data provided by MassDOT and project proponents and on MPO assessments conducted for TIP evaluations. The estimated lane miles of substandard NHS pavement improved is based on the pavement condition assessment for the project and the MPO’s assessment of the portion of the project on the NHS. The IRI thresholds used to classify pavement are based on TIP criteria approved in October 2020: less than 95 (good), 95 to 170 (fair or substandard), greater than 170 (poor or substandard).
FFY = federal fiscal year. IRI = International Roughness Index. MassDOT = Massachusetts Department of Transportation. MPO = metropolitan planning organization. NHS = National Highway System.
Source: MassDOT and the Boston Region MPO staff.
Transit agencies must update performance targets for federally required TAM performance measures. These targets relate to transit rolling stock, nonrevenue service vehicles, facilities, and rail fixed-guideway infrastructure. They are developed based on the agencies’ most recent asset inventories and condition assessments, and capital investment and procurement expectations, which are informed by the agencies’ TAM plans. MBTA, MWRTA, and CATA share their asset inventory and condition data and their performance targets with the Boston Region MPO so that the MPO can monitor and set TAM targets for the Boston region. The MPO revisits its targets in these performance areas each year when updating its TIP.
The following sections discuss the MPO’s current performance targets (adopted in March 2023) for each of the TAM performance measures. They reflect the MBTA’s, CATA’s, and MWRTA’s SFY 2022 TAM performance targets (for July 2022 through June 2023). After consulting with the MBTA, CATA, and MWRTA, MPO staff has aggregated or reorganized some target information for particular asset subgroups. When compared to SFY 2021 performance, the SFY 2022 TAM targets described in Tables 4-17 through 4-20 may reflect changes in the overall number of assets in each transit category, past or planned asset replacement or repair, other factors depending on the asset type, or a combination of these factors. They may also reflect some recent updates to data or the reclassification of assets into different categories.
FTA’s TAM performance measure for evaluating whether rolling stock and equipment vehicles are in a state of good repair is the percent of vehicles that meet or exceed their useful life benchmark (ULB). This measure uses vehicle age as a proxy for state of good repair, with the goal being to bring this value as close to zero as possible. FTA defines ULB as “the expected lifecycle of a capital asset for a particular transit provider’s operating environment, or the acceptable period of use in service for a particular transit provider’s operating environment.” 4-17
For its SFY 2023 targets, the MBTA used FTA default ULBs for all vehicle types except for paratransit autos and vans, some articulated buses, and some light rail vehicles, which are measured using MBTA-defined ULBs. The MWRTA uses FTA default ULBs for vans and equipment vehicles (excluding automobiles) and ULBs from MassDOT’s Fully Accessible Vehicle Guide for its cutaway vehicles and automobiles. 4-18 CATA uses useful life criteria as defined in FTA Circular 5010.1E for ULB values for its vehicles. 4-19
Table 4-17 describes SFY 2022 baselines and the MPO’s SFY 2023 targets for rolling stock. The MBTA, CATA, and MWRTA are improving performance for a variety of rolling-stock-vehicle classes. Transit agencies can make improvements on this measure by expanding their rolling-stock fleets or replacing vehicles within those fleets.
Table 4-17
TAM Performance Values and SFY 2023 Targets for Transit Rolling Stock
|
|
|
SFY 2022 Performance |
|
|||
|---|---|---|---|---|---|---|
| Agency |
Asset Type |
Number of Vehicles |
Number of Vehicles |
Percent of Vehicles |
Target Percent of Vehicles |
|
MBTA |
Buses1 |
952 |
307 |
32% |
32% |
|
MBTA |
Light Rail Vehicles |
227 |
0 |
0% |
0% |
|
MBTA |
Vintage Trolleys1 |
7 |
7 |
100% |
100% |
|
MBTA |
Heavy Rail Vehicles2 |
472 |
252 |
53% |
39%* |
|
MBTA |
Commuter Rail Locomotives |
81 |
|
23% |
23%* |
|
MBTA |
Commuter Rail Coaches |
393 |
30 |
8% |
7% |
|
MBTA |
Ferry Boats |
4 |
0 |
0% |
0% |
|
MBTA |
Paratransit Vehicles3 |
704 |
0 |
0% |
0% |
|
CATA |
Buses |
16 |
4 |
25% |
30% |
|
CATA |
Cutaway Vehicles4 |
16 |
10 |
63% |
5% |
|
MWRTA |
Automobiles |
2 |
2 |
100% |
100%* |
|
MWRTA |
Vans5 |
3 |
0 |
0% |
0% |
|
MWRTA |
Cutaway vehicles6 |
108 |
9 |
8% |
25% |
|
* The SFY 2022 target anticipates improved performance compared to SFY 2021 performance.
1 MBTA vintage trolleys are used on the Ashmont-Mattapan High Speed Line.
2 The targets account for Red and Orange Line vehicle delivery.
3 The MBTA’s The RIDE paratransit vehicle data and target reflect automobiles and vans.
4 The NTD defines a cutaway vehicle as a vehicle in which a bus body is mounted on a van or light-duty truck chassis, which may be reinforced or extended. CATA uses these vehicles to provide fixed-route and demand response service.
5 MWRTA’s vans are used to provide demand response service.
6 MWRTA uses cutaway vehicles to provide fixed-route and demand response service.
CATA = Cape Ann Transportation Authority. MBTA = Massachusetts Bay Transportation Authority. MWRTA = MetroWest Regional Transit Authority. NTD = National Transit Database. SFY = state fiscal year. ULB = Useful Life Benchmark.
Source: CATA, MBTA, MWRTA, and Boston Region MPO staff.
The MBTA’s planned SFY 2023 investments in revenue vehicles include ongoing replacements for the bus fleet commuter rail locomotive and coach overhauls, and continued procurement of Red and Orange Line (heavy rail) vehicles and Green Line Type 9 vehicles.
Table 4-18 shows SFY 2022 baselines and the MPO’s SFY 2023 targets for transit-equipment vehicles. Transit agencies can make progress by expanding their fleets or replacing vehicles within those fleets. The MBTA notes that some of its equipment vehicles are stored indoors and used sporadically, and therefore can perform adequately even well beyond their ULBs. Also, the MBTA’s nonrevenue vehicle program focuses on replacing the vehicles that have the highest impact on service, including those used for winter response and track maintenance, which may not always be the oldest vehicles in the fleet.
Table 4-18
SFY 2022 Performance and SFY 2023 Targets for Equipment
(Nonrevenue Vehicles)
|
|
|
SFY 2022 Performance |
|
||
|---|---|---|---|---|---|
| Agency |
Asset Type |
Number of Vehicles |
Number of Vehicles |
Percent of Vehicles |
Target Percent of Vehicles |
MBTA |
All Equipment |
1,417 |
315 |
22% |
25% |
CATA |
All Equipment |
3 |
3 |
100% |
100% |
MWRTA |
All Equipment |
11 |
4 |
36% |
50% |
CATA = Cape Ann Transportation Authority. MBTA = Massachusetts Bay Transportation Authority. MWRTA = MetroWest Regional Transit Authority. SFY = state fiscal year. ULB = Useful Life Benchmark.
Source: CATA, MBTA, MWRTA, and Boston Region MPO staff.
FTA assesses the condition for passenger stations, parking facilities, and administrative and maintenance facilities to determine if they are in a state of good repair by using the FTA Transit Economic Requirements Model (TERM) scale, which generates a composite score based on assessments of facility components. Facilities with scores below three are considered to be in marginal or poor condition (though this score is not a measure of facility safety or operational performance). The goal is to bring the share of facilities that meet this criterion to zero. Infrastructure projects focused on individual systems may improve performance gradually, while more extensive facility improvement projects may have a more dramatic effect on a facility’s TERM scale score.
Table 4-19 shows SFY 2022 measures and the MPO’s SFY 2023 targets for MBTA, CATA, and MWRTA facilities.
Table 4-19
SFY 2022 Performance and SFY 2023 Targets for Facilities
|
|
|
SFY 2022 Performance |
|
|||
|---|---|---|---|---|---|---|
| Agency |
Asset Type |
Number of Facilities |
Number of Facilities Rated < 3.0 on the FTA’s Term Scale |
Percent of Facilities |
Target Percent of Facilities Rated < 3.0 on the FTA’s Term Scale |
|
MBTA |
Passenger/ |
386 |
22 |
6% |
7% |
|
MBTA |
Administrative/ Maintenance Facilities1 |
427 |
149 |
35% |
35%* |
|
CATA |
Administrative/Maintenance Facilities |
1 |
0 |
0% |
0% |
|
MWRTA |
Administrative/Maintenance Facilities |
1 |
0 |
0% |
0% |
|
1 The MBTA reports performance targets for facilities with a baseline consistent assessment and continues to undertake physical condition assessments for all facilities.
2 The FY 2023 target for passenger and parking facilities reflects the likelihood that five commuter rail assets will receive lower condition ratings this year: South Attleboro, West Newton, Newtonville, Lynn Garage, and Lynn Station.
CATA = Cape Ann Transportation Authority. FTA = Federal Transit Administration. MBTA = Massachusetts Bay Transportation Authority. MWRTA = MetroWest Regional Transit Authority. SFY = State Fiscal Year.
Source: CATA, MBTA, MWRTA, and Boston Region MPO staff.
Table 4-20 describes SFY 2022 baselines and SFY 2023 targets for rail fixed-guideway condition. The MBTA is the only transit agency in the Boston region with this asset type. Rail fixed-guideway condition is measured by the percentage of track that is subject to performance or speed restrictions. Performance restrictions reflect the condition of track, signal, and other supporting systems, which the MBTA can improve through maintenance, upgrades, and replacement and renewal projects. The goal is to bring the share of MBTA track systems subject to performance restrictions to zero.
Table 4-20
SFY 2022 Performance and SFY 2023 MBTA Targets for Infrastructure (Fixed Guideway)
|
|
SFY 2022 Performance |
|
||
|---|---|---|---|---|
| Asset Type |
Number of Miles |
Number of Miles with Performance Restrictions |
Percent of Miles with Performance Restrictions |
Target Percent of Miles with Performance Restrictions |
MBTA Transit Fixed Guideway1 |
127 |
6 |
5% |
2% |
MBTA Commuter Rail Fixed Guideway |
641 |
22 |
3% |
4% |
Note: For this performance measure, the term “miles” refers to “directional route miles,” which represents the miles managed and maintained by the MBTA with respect to each direction of travel (for example, northbound and southbound), and excludes nonrevenue tracks such as yards, turnarounds, and storage tracks. The baseline and target percentages represent the annual average number of miles meeting this criterion over the 12-month reporting period.
1 The MBTA’s Transit Fixed Guideway information reflects light rail and heavy rail fixed guideway networks.
MBTA = Massachusetts Bay Transportation Authority. SFY = State Fiscal Year.
Source: MBTA and Boston Region MPO staff.
The MBTA transit targets for SFY 2023 are more aggressive than those of SFY 2022, which reflect a commitment to improving the condition of track assets and reducing the number of speed restrictions for heavy and light rail.
Many types of transit investments may affect the TAM vehicle, facility, and fixed-guideway performance measures described in the previous section, because these investments may either improve or replace assets already included in transit agency inventories, or because they may expand those inventories. These investments may improve assets gradually over time by upgrading specific asset subsystems, or they may generate more dramatic changes in performance by overhauling or replacing assets.
The FFYs 2024–28 TIP includes a variety of transit infrastructure improvement initiatives, funded both by the MPO’s Regional Targets and dollars that the MBTA, MWRTA, and CATA program in coordination with MassDOT. Many of the MBTA and CATA investments appear in the priority investment lists these agencies include in their TAM plans. Because of the timing of these investments, they are not expected to affect the MPO’s current (SFY 2022) TAM performance targets; however, they are expected to help improve performance on the TAM measures over time.
During FFYs 2024 to 2028, the MBTA will be investing in vehicles to replace or expand its fleets through its Vehicles program. These procurements will support more efficient, reliable, and sustainable operations and include the following:
The MBTA will also overhaul catamarans, hybrid and compressed-natural-gas (CNG) buses, Blue Line vehicles, and vintage trolleys that serve the Mattapan Line. It will also fund activities and procurements to ensure that existing fleets are resilient and in a state of good repair. Finally, the MBTA will allocate funds to planning for future fleet procurements.
Meanwhile, CATA plans to purchase several buses, including both body-on-chassis and low-floor buses, to replace those that have reached the end of their useful life. The MWRTA plans to purchase cutaway vehicles to replace vehicles that have reached the end of their useful life. Expected purchases include CNG-powered vehicles and electric vehicles. MWRTA will also continue pursuing opportunities to migrate its fleet to fully electric vehicles. Collectively, these investments will help improve the condition of the fleets and make progress with respect to the TAM rolling stock performance measure.
During FFYs 2024 to 2028, the MPO will provide Regional Target funding to support improvements to the Jackson Square, Lynn, and Reading MBTA stations. The Jackson Square Station Accessibility Improvements Project will make state-of-good-repair improvements to the facility on the MBTA’s Orange Line, including repairs to its existing elevator, the addition of a new elevator, and improvements to lighting and wayfinding signage. Many elements of the Lynn Station project will improve its state of good repair, including reconstruction of the existing rail platform, construction of two new elevators, new stairways, and upgraded lighting. This project also includes repairs to the viaduct to the northeast of the station. The Rail Transformation Project will improve track on the Haverhill commuter rail line, including Reading Station, and the Lowell line to accommodate increased service and improve operational safety.
While MWRTA’s and CATA’s administration and maintenance facilities are currently in a state of good repair, these agencies will continue to maintain and upgrade those facilities during FFYs 2024 to 2028. CATA plans to repave the parking lot of its maintenance and operations facility. MWRTA is exploring the feasibility of making significant enhancements to improve safety, reliability, and amenities at its Blandin Hub facility. MWRTA plans to make significant investments in electrification infrastructure for its fleet, with a focus on renewable energy, through phased investments in solar infrastructure and battery electric storage systems. Renewable energy will be used for charging electric vehicles (EVs), as well as facility operations.
The MBTA’s investments in track signals and systems through its Signals and System Upgrade Program during FFYs 2024 to 2028 will, over time, help reduce the need for performance restrictions on fixed guideways. Projects that address this area include the following:
In addition to investing in the Jackson Square, Lynn, and Reading Stations, the MPO has set aside $6.5 million per year in its Transit Modernization investment program starting in FFY 2025. While the MPO continues to work with MassDOT and the region’s transit agencies to define the scope of this program, in October 2020 the MPO established baseline transit system preservation and modernization evaluation criteria for this program. These include criteria that award points for
The MPO will continue to work to improve the links between transportation investments and system preservation and modernization, and will coordinate with MassDOT, the MBTA, MWRTA, and CATA, and other stakeholders on that process. This work may include the following activities:
The MPO’s capacity management and mobility goal focuses on using existing facility capacity more efficiently and increasing transportation options. The MPO’s objectives in this area encompass a variety of modes and aspects of mobility, including access to and the accessibility of different transportation modes, connectivity between modes and systems, and support for reliable travel and congestion mitigation. Much of the Boston region is densely developed, which creates both opportunities and challenges to addressing these access, reliability, and congestion mitigation needs.
Several different planning processes come together to address capacity management and mobility performance, issues, and needs. Through its CMP, the MPO does extensive analysis of congestion and mobility constraints in the region. The MPO also produces periodic CMAQ Performance Plans and progress reports to address requirements related to the federal Congestion Mitigation and Air Quality Improvement Program; these describe other congestion-oriented measures and targets. 4-20 The MPO combines this work with ongoing system-level analyses that support its long-range planning, which are documented in its LRTP Needs Assessment. MassDOT conducts its own analyses of mobility performance and needs, which it documents in modal plans such as its Freight Plan, Bicycle Transportation Plan, and Pedestrian Transportation Plan, its Congestion in the Commonwealth reports and accompanying studies, and its MassDOT Performance Management Tracker tool. 4-21 Meanwhile, the MBTA tracks and analyzes mobility metrics and uses these to support planning processes, such as Focus40, its current long-term investment plan. 4-22 The exchange and integration of these plans help agencies in the Boston region coordinate to improve mobility across modes.
The MPO examines a variety of different metrics to understand congestion and mobility issues, several of which are discussed below.
FHWA requires states and MPOs to monitor and set targets for two performance measures that pertain to all travelers on NHS roadways:
These measures capture (1) whether travel times on an NHS segment are consistent (reliability); and (2) the extent to which NHS users’ travel may be affected by those conditions (percent of person miles). Several component metrics make up this measure:
States and MPOs identify the person-miles of travel for each NHS segment and divide the total person-miles on the relevant NHS network that are reliable by the total person-miles on the relevant NHS network. To support this analysis, FHWA provides travel-time and traffic-volume data as part of the National Performance Management Research Data Set (NPMRDS), in which travel-time data are reported by traffic messaging channel (TMC) segments. These data, along with a set of analysis tools, are available through the Regional Integrated Transportation Information System (RITIS), which is developed and maintained by the Center for Advanced Transportation Technology Laboratory at the University of Maryland. MassDOT has obtained access to the RITIS platform and grants access to MPOs and transportation planning organizations in the Commonwealth.
States are required to set two-year and four-year targets for these measures. In 2022, MassDOT calculated baselines and established targets for these measures for the Massachusetts Interstate and non-Interstate NHS networks. MassDOT considered FHWA guidance and recommendations for establishing initial targets with this limited historic data, and it set initial targets for Massachusetts equal to CY 2021 baseline values. 4-24
Table 4-21 shows MassDOT’s CY 2021 baselines and two-year and four-year targets for these measures. The Boston Region MPO, like all MPOs, was required to establish four-year targets for these measures by either supporting state targets or setting its own quantitative targets for the Boston region. In 2023, the MPO board voted to support the state’s four-year targets. As noted in previous sections, MassDOT owns and manages the Interstate network in Massachusetts and implements strategies to improve its performance. As with the roadway safety performance targets previously discussed, this approach reflects the way the Commonwealth and the MPO will need to collaborate to make and keep the non-Interstate NHS in the region reliable. Relevant strategies may include designing and funding roadway infrastructure improvements and supporting signal retiming, which fall under the purview of both the MPO and MassDOT. Others include regulating vehicle volumes using approaches such as ramp metering or managed lanes, which would fall under the Commonwealth’s purview.
Table 4-21 also shows CY 2021 baselines for the Boston region’s Interstate and non-Interstate NHS networks for comparison. As the table shows, the Boston region’s share of reliable person-miles traveled on its Interstate and non-Interstate NHS networks was lower than statewide values for Massachusetts in 2021.
Table 4-21
Baseline Values and Targets for Travel Time Reliability
Network |
Measure |
2021 Measure |
Two-Year Target |
Four-Year Target |
Massachusetts—Interstate Highway System |
Percent of person-miles on the |
84.2% |
74.0% |
76.0% |
Massachusetts—Non-Interstate NHS System |
Percent of person-miles on the |
87.9% |
85.0% |
87.0% |
Boston Region—Interstate Highway System1 |
Percent of person-miles on the |
71.4% |
N/A |
N/A |
Boston Region—Non-Interstate NHS System1 |
Percent of person-miles on the |
81.7% |
N/A |
N/A |
Note: The two-year target reflects conditions as of the end of CY 2023, and the four-year target reflects conditions as of the end of CY 2025.
1 The baseline values for the Boston region that are shown in this table were calculated in 2022.
CY = calendar year. MPO = metropolitan planning organization. N/A = not applicable. NHS = National Highway System.
Sources: National Performance Management Research Data Set, Cambridge Systematics, Massachusetts Department of Transportation, and the Boston Region MPO staff.
Figure 4-6 shows the change in the percent of person-miles on the Interstate Highway System that were reliable for both Massachusetts and the Boston region between 2017 and 2022. Figure 4-7 shows the change in the percent of person-miles on the non-Interstate NHS for the same time period and geographies. As shown in the charts, the travel time reliability measures for the Interstate Highway System and the non-Interstate NHS in Massachusetts were better than the Commonwealth’s two-year and four-year targets. The share of reliable person-miles on the NHS network increased significantly in 2020 for both the Boston region and Massachusetts as a whole, primarily because of reduced travel in response to the COVID-19 pandemic, though the percentage of reliable person-miles dropped for both geographies in 2021 and 2022 as travel increased. As the region and the Commonwealth adjust to post-pandemic travel patterns and levels of demand, the MPO will work with the Commonwealth, municipalities, and other stakeholders to support reliable travel on the NHS and other roadways.
Figure 4-6
Performance Values and Targets for the Percent of Person-Miles that are Reliable on the Interstate Highway System
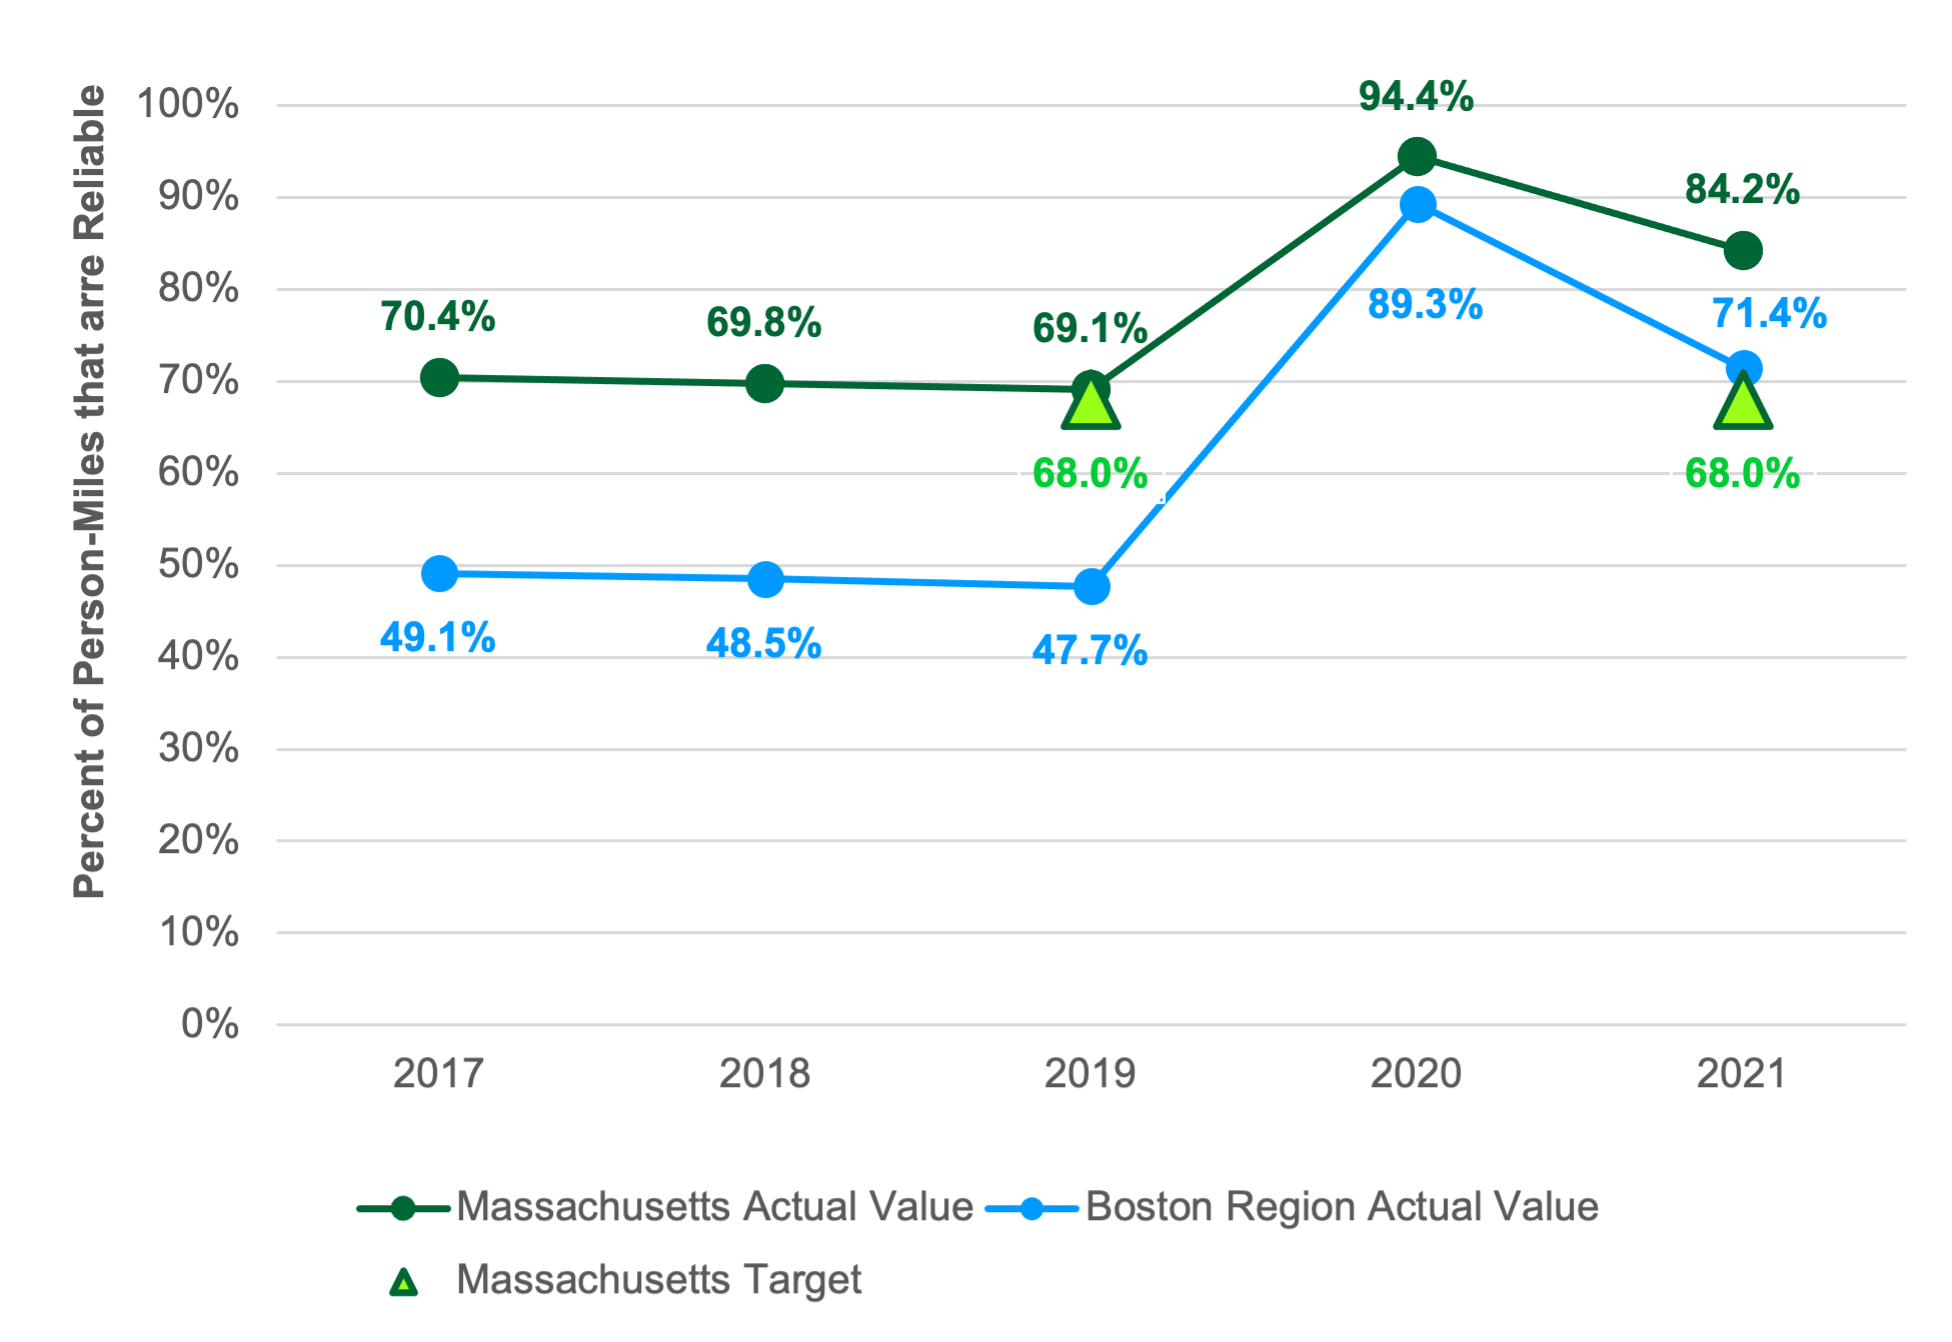
Note: The number of municipalities in the Boston Region MPO area decreased from 101 to 97 in 2018. This change may have affected 2017 values calculated using the RITIS platform in April 2022 as compared to baselines determined when targets were initially set in 2018.
MPO = metropolitan planning organization. RITIS = Regional Integrated Transportation Information System.
Sources: National Performance Management Research Data Set and the Boston Region MPO staff.
Figure 4-7
Performance Values and Targets for the Percent of Person-Miles that are Reliable on the Non-Interstate NHS
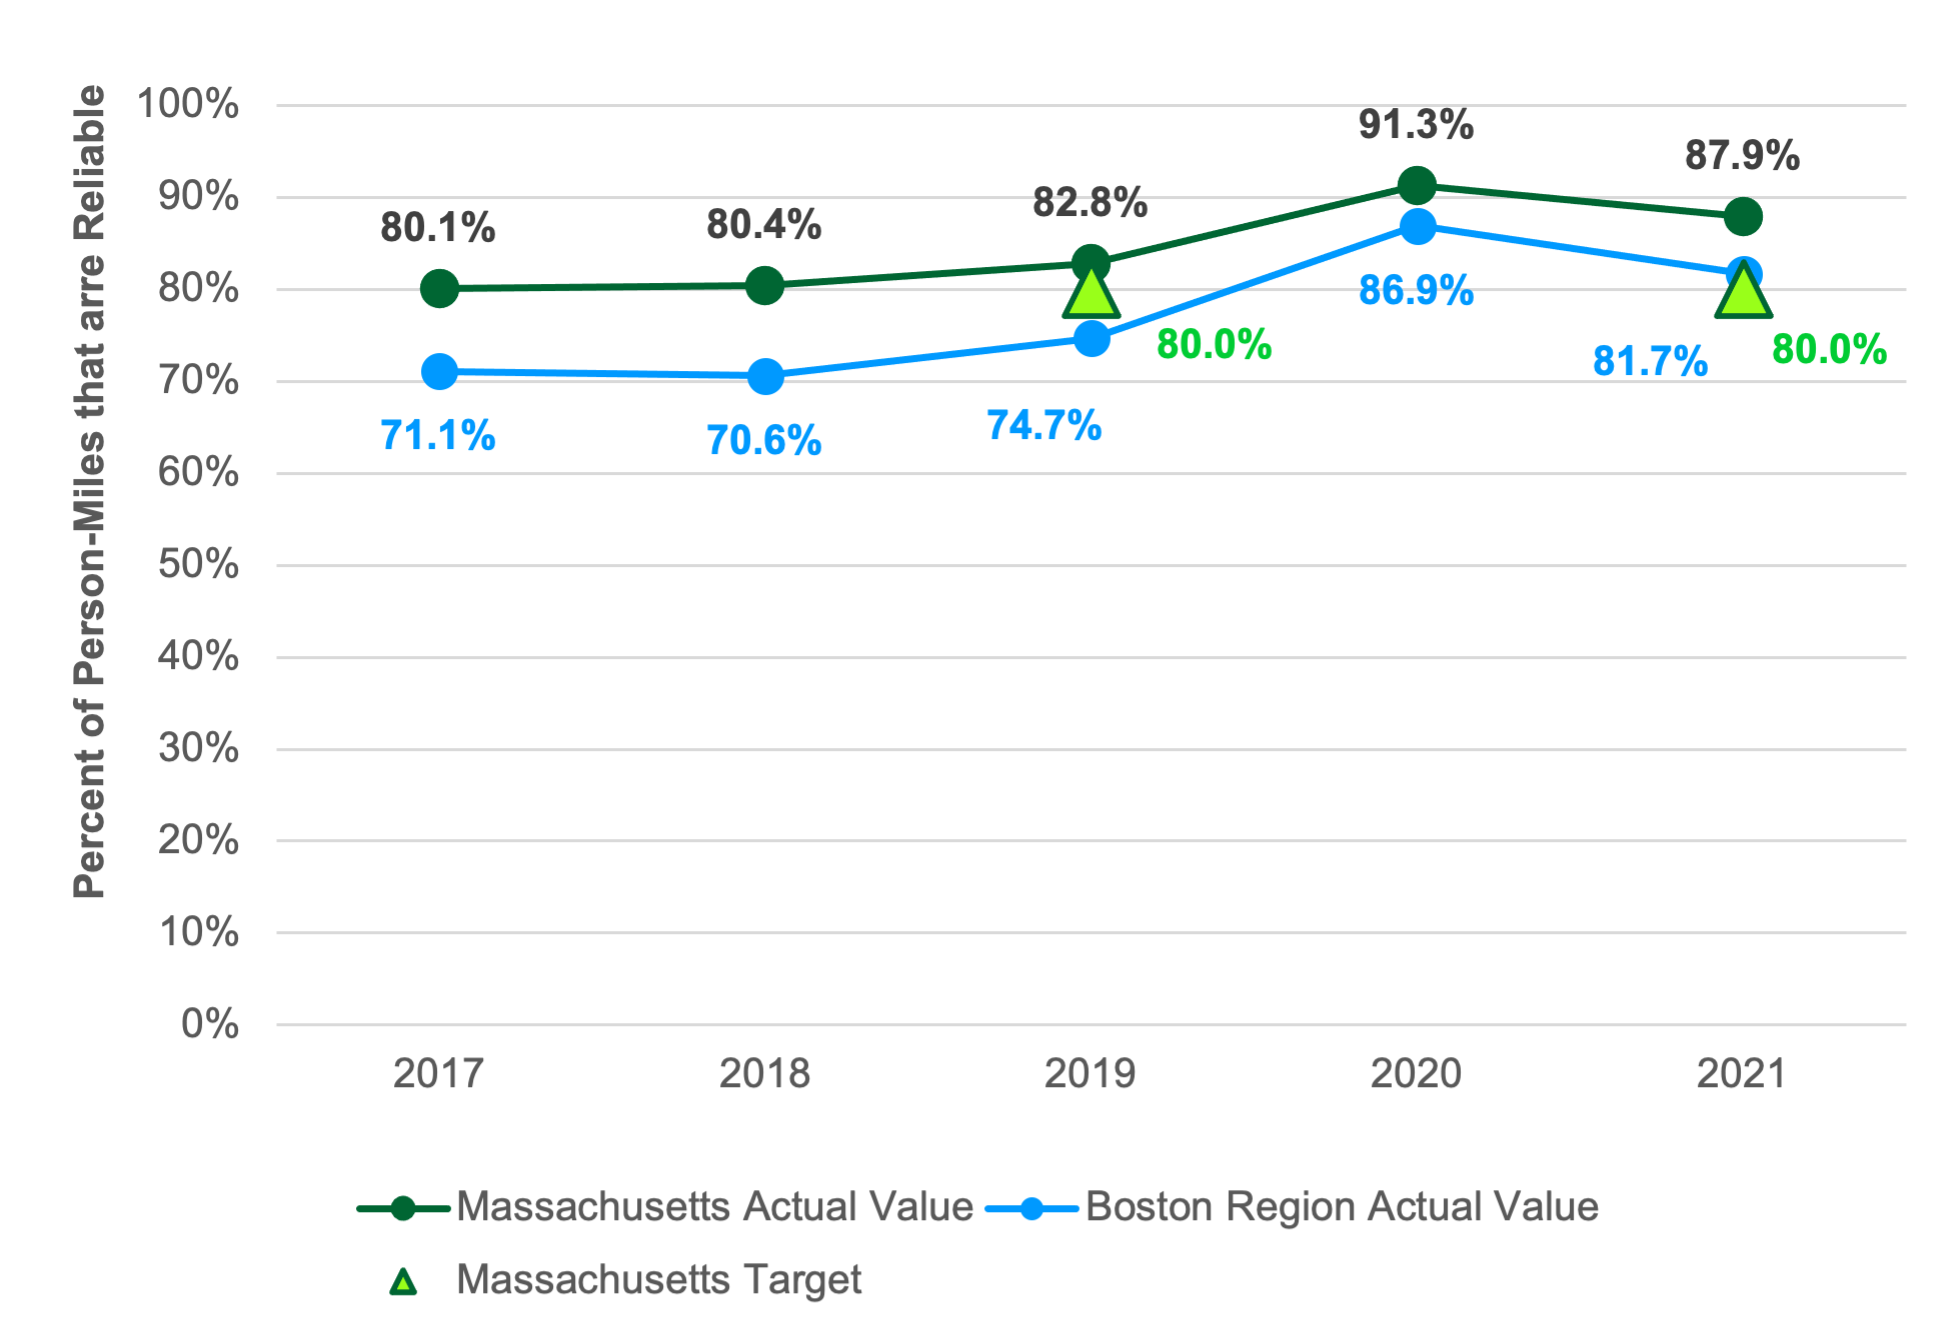
Note: The number of municipalities in the Boston Region MPO area decreased from 101 to 97 in 2018. This change may have affected 2017 values calculated using the RITIS platform in April 2022 as compared to baselines determined when targets were initially set in 2018.
MPO = metropolitan planning organization. NHS = National Highway System. RITIS = Regional Integrated Transportation Information System.
Sources: National Performance Management Research Data Set, Massachusetts Department of Transportation, and the Boston Region MPO staff.
FHWA requires states and MPOs to track truck travel time reliability on the Interstate System to better understand the performance of the nation’s freight system. The applicable measure in this case is the Truck Travel Time Reliability Index (TTTR). Like the LOTTR, this measure compares longer (95th percentile) truck travel times to average (50th percentile) truck travel times. The greater the difference between these two travel times on an Interstate segment, the less reliable truck travel on that segment is considered to be. For each Interstate segment, states and MPOs calculate TTTR values for different day-and-time periods and weight the segment length by the maximum applicable TTTR value. 4-25 They then sum these weighted segment lengths for all Interstate segments and divide that total value by the length of the full Interstate network for the applicable geographic area. Like segment-specific TTTR values, the greater this aggregate value is, the more unreliable the network is with respect to truck travel.
In 2022, MassDOT calculated baseline TTTR Index values and established performance targets using CY 2021 truck travel-time data included in the NPMRDS. As with the all-vehicle travel time reliability targets, MassDOT set its two-year and four-year targets equal to the CY 2021 baseline. Table 4-22 displays these values. MPOs are required to set four-year targets for this measure, and the Boston Region MPO board voted to support MassDOT’s four-year TTTR Index target in January 2023. Table 4-22 also includes the Boston region’s CY 2021 baseline index value. As the table shows, the Boston region’s TTTR baseline value is higher than the one for Massachusetts, indicating that truck travel times on the region’s Interstate highway network have been generally less reliable than on Massachusetts’s full Interstate network.
Table 4-22
Baseline Values and Targets for Truck Travel Time Reliability
Network |
Measure |
2021 Measure |
Two-Year Target |
Four-Year Target |
Massachusetts—Interstate Highway System |
Truck Travel Time Reliability Index |
1.61 |
1.80 |
1.75 |
Boston Region—Interstate Highway System1 |
Truck Travel Time Reliability Index |
2.03 |
N/A |
N/A |
Note: The two-year target reflects conditions as of the end of CY 2023, and the four-year target reflects conditions as of the end of CY 2025.
1 The baseline values for the Boston region that are shown in this table were calculated in 2022.
CY = calendar year. MPO = metropolitan planning organization. N/A = not applicable. RITIS = Regional Integrated Transportation Information System.
Sources: National Performance Management Research Data Set, RITIS, the Massachusetts Department of Transportation, and the Boston Region MPO staff.
Figure 4-8 shows the change in TTTR Index values for Interstate Highway System for both Massachusetts and the Boston region between 2017 and 2022. As shown in the charts the TTTR values measures for the Interstate Highway System in Massachusetts were better than the Commonwealth’s two-year and four-year targets. As with the metrics capturing the share of reliable person-miles on the NHS, TTTR values improved for both Massachusetts and the Boston region in 2020, although values increased for both geographies in 2021 and 2022. Performance monitoring will enable the Commonwealth, the MPO, and other stakeholders to respond to post-pandemic changes in truck travel time reliability.
Figure 4-8
Performance Values and Targets for Truck Travel Time Reliability on the Interstate Highway System
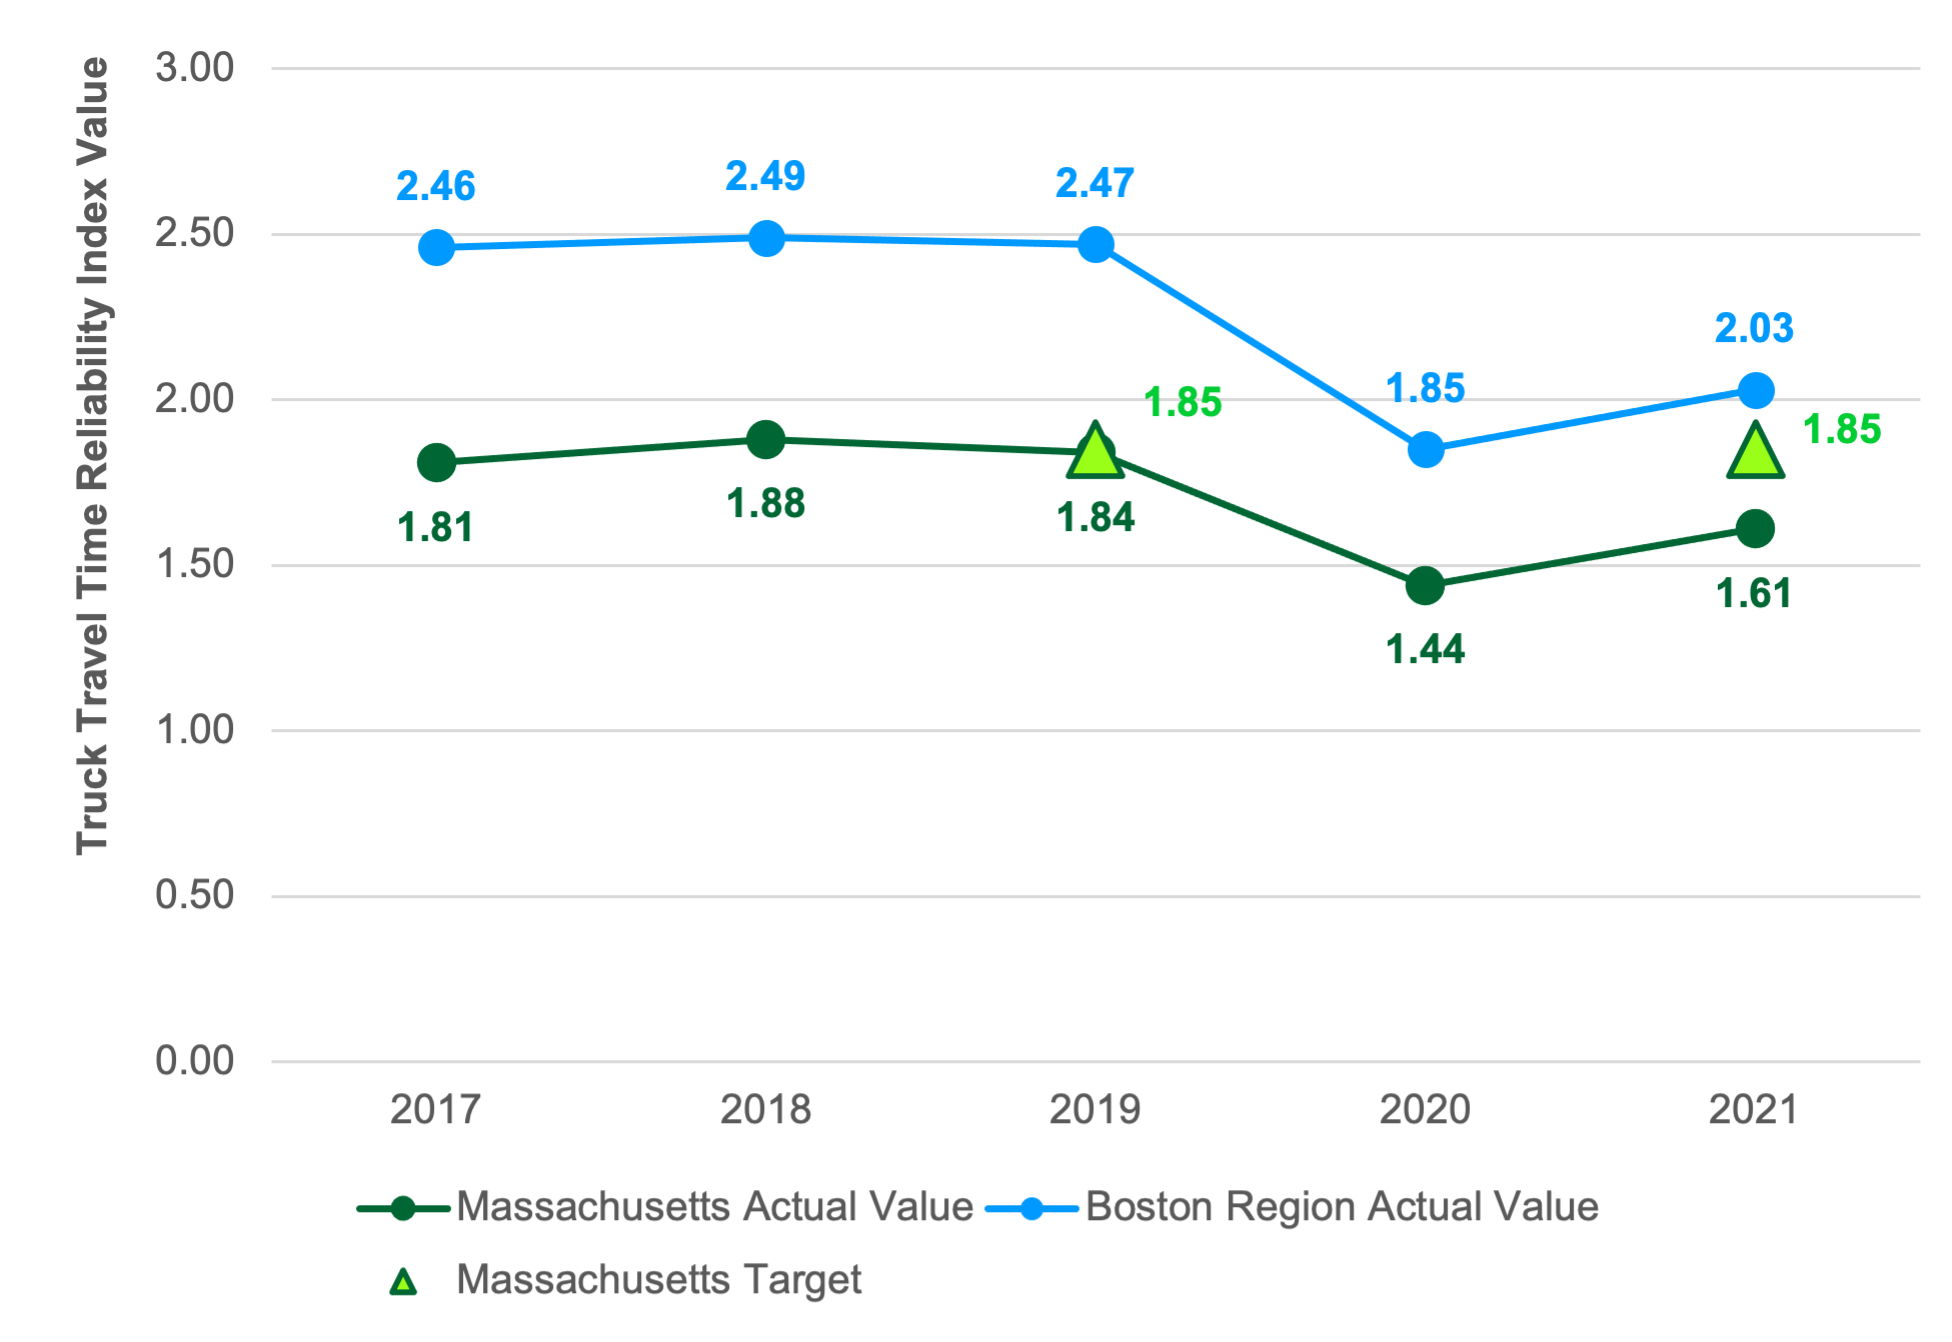
Note: The number of municipalities in the Boston Region MPO area decreased from 101 to 97 in 2018. This change may have affected 2017 values calculated using the RITIS platform in April 2022 as compared to baselines determined when targets were initially set in 2018.
MPO = metropolitan planning organization. RITIS = Regional Integrated Transportation Information System.
Sources: National Performance Management Research Data Set, Massachusetts Department of Transportation, and the Boston Region MPO staff.
MassDOT and the Boston Region MPO also examine mobility using measures they must monitor to meet CMAQ requirements. These measures are designed to help FHWA, states, and MPOs better understand the impacts of CMAQ investments, which are intended to contribute to air quality improvements and provide congestion relief. CMAQ performance measures related to traffic congestion apply to urbanized areas (UZAs) that contain geographic areas designated as nonattainment areas because they do not meet the US Environmental Protection Agency (EPA) standards for criteria air pollutants and precursors from mobile sources. 4-26 The measures also apply to geographic areas, designated as maintenance areas, that have a history of being in nonattainment and are thus required to maintain air quality monitoring and standard conformity processes.
States must be involved in setting targets for CMAQ traffic performance measures if (1) they have mainline highways on the NHS that cross part of a UZA with a population of more than one million; and (2) that UZA contains part of a nonattainment or maintenance area for relevant criteria pollutants. Similarly, MPOs must participate in target setting for the traffic congestion measures if (1) the region contains mainline highways on the NHS that cross part of a UZA with a population of more than one million; and (2) the part of the MPO area that overlaps the UZA contains part of a nonattainment or maintenance area for relevant criteria pollutants. Massachusetts and the Boston Region MPO each meet these respective criteria and, therefore, must be involved in monitoring and setting targets for traffic congestion performance measures for the Boston MA-NH-RI UZA, which encompasses several MPO areas in eastern Massachusetts, New Hampshire, and Rhode Island.
The Boston region included an area (Waltham, Massachusetts) designated as being in maintenance for air pollutant standards in 2021. This designation expired in April 2022; however, the Boston Region MPO must fulfill these performance requirements at least until the FWHA issues an applicability determination related to CMAQ performance requirements (expected in October 2023). Agencies in each UZA that are responsible for these traffic congestion measures set two-year and four-year targets.
The first of these CMAQ traffic congestion measures is annual hours of peak hour excessive delay (PHED) per capita, which estimates the excessive delay experienced by a UZA’s population from travel on the NHS during peak periods. States and MPOs calculate this measure using several component metrics:
The PHED per capita measure is calculated at the Boston MA-NH-RI UZA level by multiplying the hours of excessive delay during peak periods by the number of travelers during peak periods, and then dividing that total by the UZA population.
To understand baseline performance and set targets for this measure, MassDOT and the New Hampshire Department of Transportation (NH DOT) worked with analysts at Cambridge Systematics and, using 2017 NPMRDS data, calculated annual hours of PHED per capita for travel on the NHS in their respective portions of the Boston MA-NH-RI UZA. 4-29 In 2018, the agencies in the Boston MA-NH-RI UZA that are subject to CMAQ performance monitoring requirements—MassDOT, NH DOT, the Boston Region MPO, and the Northern Middlesex Council of Governments (NMCOG)—established two-year and four-year targets that maintain this 2017 baseline value for the annual hours of PHED per capita measure, as shown in Table 4-23.
Table 4-23
Baseline Value and Targets for Annual Hours of Peak Hour Excessive Delay Per Capita in the Boston MA-NH-RI UZA
Geographic Area |
Massachusetts and New |
Boston MA-NH-RI UZA Population (MA and NH only)1 |
2017 Measure Value (Baseline) |
Two-Year Target |
Four-Year Target -21)2 |
Boston Urbanized Area |
80,053,183 |
4,371,476 |
18.30 |
18.30 |
18.30 |
1 Cambridge Systematics aggregated 2012–16 American Community Survey population estimates from the US Census Bureau at the block group level to estimate the population for the portion of the UZA in Massachusetts and New Hampshire, and then inflated this estimate for 2017 by applying information on expected population growth in the Boston Metropolitan Statistical Area between 2016 and 2017.
2 The two-year target reflects conditions as of the end of CY 2019, and the four-year target reflects conditions as of the end of CY 2021.
CY = calendar year. FHWA = Federal Highway Administration. MA = Massachusetts. MPO = metropolitan planning organization. NH = New Hampshire. PHED = peak hours of excessive delay. RI = Rhode Island. UZA = urbanized area.
Sources: National Performance Management Research Data Set, US Census Bureau, FHWA, the Massachusetts Department of Transportation, the New Hampshire Department of Transportation, Cambridge Systematics, and the Boston Region MPO staff.
MassDOT’s 2018 and 2019 estimates of PHED per capita in the Boston MA-NH-RI UZA show increases compared to the baseline value of 18.3 hours of delay per capita from 2017 (22.9 hours per person in 2018 and 25.2 in 2019). As previously mentioned, the initial value and targets for this measure were calculated with a limited amount of historic data, given differences between the NPMRDS data that were available for 2017 compared to 2016 and earlier. Also, MassDOT staff notes that several data-related factors may affect these more recent estimates. For example, the segments included on the NHS network in the NPMRDS vary from set to set, which affects the amount of excessive delay that states and MPOs can account for in their calculations.
While congestion may have increased in the Boston MA-NH-RI UZA in 2018 and 2019, the aforementioned data issues complicate any analysis of trends. Also, the COVID-19 pandemic, along with related public and private sector responses, has impacted travel behavior on all modes since spring 2020. Given these circumstances and uncertainty, when revisiting targets in 2020, the agencies in the Boston MA-NH-RI UZA maintained the existing four-year performance target of 18.3 hours of PHED per capita.
States and MPOs that meet applicability criteria for CMAQ performance requirements must also monitor and set targets for the share of non-single-occupant-vehicle (non-SOV) travel. This measure is calculated at the UZA level. The percent of non-SOV travel performance measure describes the extent to which people are using alternatives to single-occupancy vehicles to travel and, thus, helping to reduce traffic congestion and air pollution from mobile sources.
In 2018, MassDOT, NH DOT, the Boston Region MPO, and NMCOG (the Northern Middlesex MPO) worked collaboratively to set initial targets for this performance measure for the Boston MA-NH-RI UZA using American Community Survey (ACS) five-year period estimates. At that time, these agencies examined changes in the percentage of workers using non-SOV commuting options in the Boston MA-NH-RI UZA between 2012 (2008–12 ACS estimate) and 2016 (2012–16 ACS estimate). These data showed an increase in use of non-SOV commuting options over time. MassDOT calculated a linear trend line for the Boston MA-NH-RI UZA and used that trend line to project expected values as of the end of calendar year (CY) 2019 (the expected 2015–19 ACS estimate) and CY 2021 (the expected 2017–21 ACS estimate).
In 2020, MassDOT, NH DOT, the Boston Region MPO, and NMCOG revisited the targets for the percent of non-SOV travel measure. These agencies examined 2013–17 and 2014–18 ACS data and found that the values reported in the data for these years were higher than the projections they made when setting initial targets. Because of this, they suggested that averages for CY 2019 and CY 2021 would exceed the performance targets established in 2018 and worked to collaboratively adjust the CY 2021 target (which reflects a 2017–21 estimate).
The COVID-19 pandemic, along with related public and private sector responses,
created noticeable impacts on travel patterns in 2020 and sparked uncertainty about future travel patterns in the UZA. For example, in spring 2020, telework rates in Massachusetts increased considerably while transit ridership and traffic volumes experienced a sharp decrease. Throughout the remainder of 2020, 2021, and early 2022, traffic volumes and transit ridership began to increase, although patterns fluctuated in response to changes in COVID-19 cases, outcomes, and related policies from government agencies and employers. Some uncertainty remains regarding the share of people that will be teleworking in the future as employers implement and adjust remote and hybrid workplace policies. However, based on their recent research into remote work activity, MassDOT staff anticipates a general trend towards higher rates of teleworking in the future.
Figure 4-9 shows past non-SOV travel estimates, projections based on a trend line reflecting an approximately seven percent increase in non-SOV travel in the UZA between 2020 and 2025, and proposed targets. This figure also reflects upper and lower-bound estimates and projections, based on estimated margins of error from the ACS. Based on this trend line, staff from these agencies propose a 2023 non-SOV travel target (reflecting a 2019–23 ACS estimate) of 38.8 percent and a 2025 target (reflecting a 2021–25 ACS estimate) of 39.8 percent.
Figure 4-9
Performance Values and Targets for the Percent of Non-SOV Travel in the Boston MA-NH-RI UZA
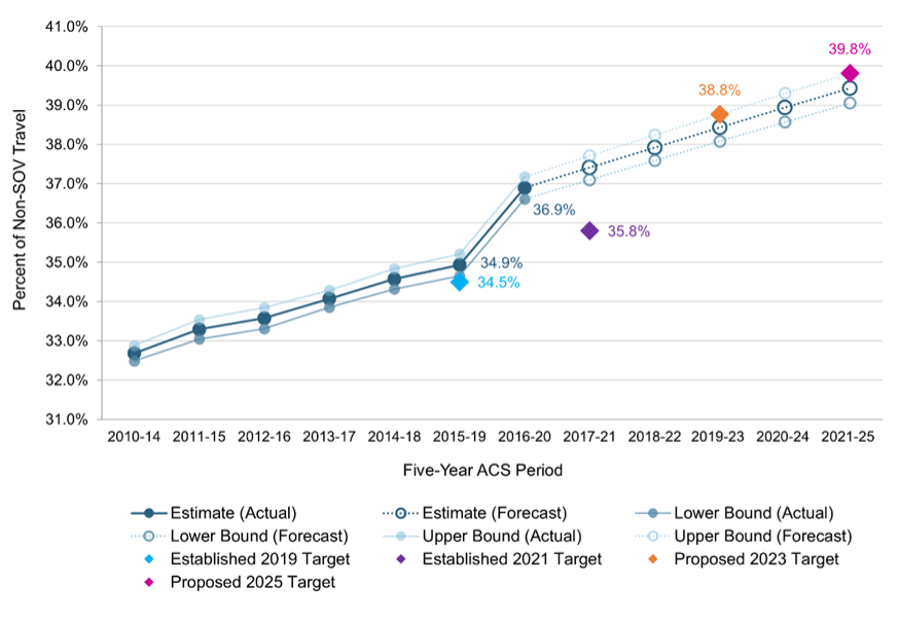
Notes: Values in this figure reflect five-year rolling averages for the percent of non-SOV travel to work for workers ages 16 and older.
ACS = American Community Survey. MA = Massachusetts. MPO = metropolitan planning organization. NH = New Hampshire. Non-SOV = non-single-occupancy vehicle. RI = Rhode Island. UZA = urbanized area.
Sources: US Census Bureau, ACS Five-Year Estimates (Table DP03, “Selected Economic Characteristics”); the Massachusetts Department of Transportation; the New Hampshire Department of Transportation; and the Boston Region MPO staff.
Table 4-24 lists the baseline and performance targets for the percent of non-SOV travel measure.
Table 4-24
Performance Values and Targets for the Percent of Non-SOV Travel in the Boston MA-NH-RI UZA
Geographic Area |
Baseline Value (CYs 2016–20 average) |
Two-Year Target (CYs 2019–23 average) |
Projected Two-Year Target (CYs 2021–25 average) |
Boston UZA |
36.9% |
38.8% |
39.8% |
Note: Values in this table reflect five-year rolling averages for the percent of non-SOV travel to work.
CY = calendar year. MA = Massachusetts. NH = New Hampshire. Non-SOV = non-single-occupancy vehicle. RI = Rhode Island. UZA = urbanized area.
Sources: US Census Bureau, ACS Five-Year Estimates (Table DP03, “Selected Economic Characteristics”); the Massachusetts Department of Transportation; the New Hampshire Department of Transportation; and the Boston Region MPO staff.
The MPO seeks to make investments that help manage capacity on the transportation network and improve mobility options for travelers in a variety of ways, including the following:
When prioritizing projects for funding with Regional Target dollars, the MPO uses evaluation criteria to assess how well each project expands transportation options and mode choice and how it supports mobility. These sets of criteria include items that award points to projects that enhance bicycle and pedestrian accommodations and connections to transit, and that support truck movement. The MPO’s criteria prior to October 2020 granted points to projects that reduced vehicle congestion and delay for transit vehicles. In October 2020, the MPO adopted an updated set of project selection criteria that
The MPO’s Community Connections investment program, which funds first- and last-mile solutions, community transportation, and other related projects, has its own set of evaluation criteria. These criteria focus on connectivity to transit and key destinations and supporting shifts in travel to non-SOV modes.
By electing to support the Commonwealth’s targets for federally required reliability measures and agreeing to the Boston MA-NH-RI UZA targets for the federally required annual hours of PHED per capita and non-SOV travel measures, the MPO agrees to plan and program projects so that they contribute to achieving those targets. It can be challenging to anticipate how transportation projects may affect these performance measures, as they track outcomes that are not only affected by transportation investments but also traveler choices and demand, among other factors.
MPO staff-identified project-related metrics to determine how its Regional Target-funded roadway projects could improve the transportation system in ways that contribute to more reliable, less congested travel on the NHS or that encourage more non-SOV travel. The following project types are recognized:
Table 4-25 summarizes these metrics and expected results for Regional Target corridor, intersection, bicycle and pedestrian, and Community Connections projects. MPO staff developed estimated values for these metrics using available data from functional design reports and other materials provided by project proponents; results from the MPO’s TIP evaluations; 2019 NPMRDS data available in the RITIS platform; and other sources. These estimates aggregate changes in vehicle hours of delay using project-level information on vehicle volumes and changes in delay times at intersections from project improvements.
Table 4-25
Regional Target Projects: Capacity Management and Mobility Performance Metrics
Metric |
Value |
Projects that overlap unreliable NHS segments and that will improve roadway signalization or geometry1 |
9 projects |
Projects that overlap any NHS segments and that will improve roadway signalization or geometry1,2 |
23 projects |
Miles of new sidewalks added |
14.23 miles |
Lane miles of new bicycle accommodations and shared-use paths |
46.87 lane miles |
Number of new transit services3 |
0 transit services |
Number of expanded transit services3 |
1 transit services |
Number of new bikeshare stations |
4 stations |
Projects that improve intermodal connections or access to transit |
49 projects |
1 The MPO staff identified reliable and unreliable segments on the NHS using the 2019 NPMRDS data in the RITIS platform and federal travel time reliability performance thresholds.
2 These metrics exclude Community Connections and Transit Modernization projects.
3 The NewMo Microtransit Service Expansion project is counted separately from Project S10784–Newton Microtransit Service.
MPO = metropolitan planning organization. NHS = National Highway System. NPMRDS = National Performance Management Research Data Set. RITIS = Regional Integrated Transportation Information System.
Source: Boston Region MPO staff.
MassDOT, MBTA, and RTA projects, which are described in Chapter 3, also address capacity management and mobility in the Boston region and may also support improvements on federally required reliability, congestion, and non-SOV travel performance measures.
The MPO will continue to work with MassDOT, the MBTA, the region’s RTAs, other transit service providers, and other stakeholders in the region to improve capacity management and mobility performance. These activities may include the following:
The MPO aims to support clean air and sustainable communities in the Boston region by creating an environmentally friendly transportation system. It pursues this goal by investing in projects that reduce greenhouse gases (GHGs) and other pollutants generated by the transportation sector and minimizing negative environmental impacts from the system.
The MPO recognizes that GHG emissions contribute to climate change. If climate change trends continue as projected, the conditions in the Boston region will include a rise in sea level coupled with storm-induced flooding, and warmer temperatures that would affect the region’s infrastructure, economy, human health, and natural resources. The Commonwealth of Massachusetts is responding to this challenge by taking action to reduce the GHGs produced in the state, including those generated by the transportation sector. To that end, Massachusetts passed its Global Warming Solutions Act (GWSA), which requires reductions of GHGs by 2020, and further reductions by 2050, relative to 1990 baseline conditions. To meet GWSA requirements, the MPO works with MassDOT and other stakeholders to anticipate the GHG impacts of projects included in the TIP, specifically by examining additions or reductions in carbon dioxide (CO2). More details on the MPO’s GHG tracking and evaluation processes are included in Appendix B.
Transportation projects may also help reduce other air pollutants and precursors and support reductions in CO2, volatile organic compounds (VOCs), nitrogen oxides (NOx) and carbon monoxide (CO) by improving traffic flow and bicycle and pedestrian travel. -More detailed information about the MPO’s air quality status and related requirements is available in Chapter 5.
The MPO tracks the air quality benefits of transportation projects to identify projects that may be eligible for CMAQ funds. It describes these CMAQ-funded projects in its CMAQ Performance plans and progress reports; these documents include performance targets for the annual PHED per capita and share of non-SOV travel measures described in the previous section, along with targets for the amount of applicable emissions the MPO expects will be reduced because of CMAQ-funded projects in air quality non-attainment or maintenance areas in the region. The MPO must note how it expects its CMAQ-funded projects to support improvements with respect to relevant performance measures, which reinforces the connection between planning, investments, and expected performance outcomes.
The federally required CMAQ emissions reduction measure, identified in Table 4-26, is the total emissions reduction for applicable pollutants and precursors for CMAQ-funded projects in designated nonattainment and maintenance areas. FHWA requires states and MPOs subject to these CMAQ performance management requirements to establish a baseline for this measure by identifying emissions reductions associated with any CMAQ-funded projects programmed in air quality nonattainment or maintenance areas between FFY 2018 and FFY 2021. These states and MPOs were also required to set two-year and four-year targets for the emissions reductions expected from CMAQ-funded projects programmed in nonattainment or maintenance areas.
For the Boston Region MPO, applicable projects would include obligated CMAQ-funded projects in or overlapping the carbon monoxide limited maintenance area that was in Waltham (the reporting requirement for the MPO relative to this maintenance area expired in 2022). The Boston Region MPO and MassDOT did not program any CMAQ-funded projects in Waltham in the TIP and STIP, respectively, between FFYs 2018 and 2021. As a result, the baseline amount of carbon monoxide reduced by CMAQ-funded projects in this limited maintenance area during this period was zero (0) kilograms per day.
Table 4-26
Baseline Value and Targets for Emissions Reduction from CMAQ Projects in the Boston Region
Performance Measure |
FFYs 2014–17 Measure Value (Baseline) |
Two-Year Target |
Four-Year Target |
Daily kilograms of carbon monoxide emissions reduction from CMAQ projects in Boston region nonattainment or maintenance areas |
0 |
0 |
0 |
CMAQ = Congestion Mitigation and Air Quality Improvement. FFY = federal fiscal year. MPO = metropolitan planning organization.
Source: Boston Region MPO staff.
The MPO uses evaluation criteria to assess the projected transportation-related emissions from each project that is a candidate for Regional Target funding, both for CO2 and other air quality pollutants and precursors, among other environmental considerations. Transportation projects can support reductions in CO2, VOCs, NOx, and CO by improving traffic flow and providing alternatives to SOV travel, including bicycle, walking, and transit options.
Table 4-27 displays the CO2 and other emissions reductions the MPO expects from projects it has programmed using its Regional Target funds. MPO staff estimates emissions for projects using MassDOT’s air quality analysis worksheets for each project type and the EPA’s Motor Vehicle Emission Simulator (MOVES) emission factors.
Table 4-27
Regional Target Projects: Clean Air and Sustainable Communities Performance Metrics
Metric |
Value |
Annual kilograms of CO2 reduced |
11,206,000 kilograms
|
Annual kilograms of other emissions (VOCs, NOx, and CO) reduced |
26,000 kilograms |
Note: These aggregate emission reduction estimates exclude Project 606226–Reconstruction of Rutherford Avenue in Boston, and 607981–McGrath Boulevard Construction. These two projects were included in the air quality modeling results for the Destination 2040 recommended plan. These estimates also exclude Project 110980–Commonwealth Avenue (Route 30) project in Newton and Weston. These aggregate estimates are based on projected future conditions for project locations and have been rounded to the nearest hundred.
CO = carbon monoxide. CO2 = carbon dioxide. MPO = metropolitan planning organization. NOx = nitrogen oxide. VOC = volatile organic compounds.
Source: Boston Region MPO staff.
Starting in FFY 2025, the Transit Modernization Program will include projects that will help reduce emissions by encouraging non-SOV travel or by changing the amount or type of energy these assets use. Similarly, future projects in the Community Connections program will encourage non-SOV travel and emissions reductions by addressing first- and last-mile needs. During the development of the FFY 2024-28 TIP, the MPO voted to program several MBTA projects that fell within the Transit Modernization Program and support non-SOV travel.
MassDOT, MBTA, and RTA projects and programs also support improvements to air quality and the environment. For example, as described in Chapter 3, both the MBTA and MWRTA’s capital programs include capital investments in fleet electrification and EV charging facilities. Appendix B provides more detailed information and assessments of the GHG impacts of MassDOT, MBTA, CATA, and MWRTA projects and programs. MassDOT sets separate CMAQ emissions reduction performance targets and tracks the relationship between its projects and those targets. 4-30
The GWSA and FHWA’s CMAQ performance management requirements create frameworks that reinforce coordination between the MPO, MassDOT, and the region’s transit providers as they make investments to support clean air and sustainable communities. Future performance activities in this area may include the following:
The MPO seeks to ensure that the Boston region’s transportation network provides a strong foundation for economic vitality. Transportation investments can support economic vitality in a variety of ways, such as by supporting freight movement, improving connections to key economic activity sites, and supporting compact development. The MPO’s approach to addressing freight needs is guided in large part by MassDOT’s Freight Plan, which identifies key freight facilities and needs, strategies to improve freight movement, and priority projects.
The Metropolitan Area Planning Council’s (MAPC) regional plan also shapes the MPO’s approach to pursuing economic vitality goals. The recently adopted MetroCommon 2050 plan outlines MAPC’s mobility goal for the region in 2050, which is that “Traveling around Metro Boston is safe, affordable, convenient, and enjoyable.” 4-31 Several subgoals are relevant to economic vitality:
MAPC’s 2020–5 Comprehensive Economic Development Strategy also outlines the goal that “everyone in the region is able to access jobs, goods, and services close to their homes via affordable transportation options, with shorter commutes and fewer transfers.” 4-32
MAPC has worked with its state-level partners at the Executive Office of Housing and Economic Development (EOHED) and the Executive Office of Energy and Environmental Affairs (EOEEA), as well as municipalities, to identify locations throughout the region appropriate for building housing stock and siting employers. These agencies have identified improvements needed to support the outcomes planned for these local, regional, and state-level priority development areas, and this work helps MAPC, the MPO, and state agencies to respond with their investments and technical assistance.
States and MPOs track the federally required truck travel time reliability measure for the Interstate Highway System by using the Truck Travel Time Reliability Index. This measure has the most direct implications for the MPO’s capacity management and mobility goal area; however, this measure is also relevant to the Boston region’s economic vitality. For more details about this measure and associated targets, see the Capacity Management and Mobility Performance section of this chapter.
When evaluating projects that are candidates for Regional Target funding, the MPO assesses how well each project serves areas identified for economic development by state, regional, and local planning entities, such as priority sites designated under Massachusetts Chapter 43D, Massachusetts Opportunity Zones, and transit stations. The MPO also examines whether and how projects in its Complete Streets, Intersection Improvements, Major Infrastructure, and Transit Modernization programs serve areas with a relatively high density of existing development or that provide affordable housing. These assessments are based on MAPC-provided information on targeted development sites and project relationships to areas of concentrated development, along with Commonwealth data and project data from functional design reports and other sources. For the Community Connections program, MPO staff award some points to projects based on the extent to which they connect to activity hubs and residential developments, addressing first- and last-mile needs. Table 4-27 provides some highlights of how Regional Target-funded projects in this TIP address economic vitality.
Table 4-27
Regional Target Projects: Economic Vitality Performance Metrics
Metric |
Value |
Projects that improve access to |
33 projects |
Projects that serve existing employment and population centers1 |
32 projects |
Community Connections projects that connect to activity hubs and residential developments |
13 projects |
1 This metric excludes projects in the MPO’s Community Connections program.
Source: Boston Region MPO staff.
MAPC’s regional land use plan and economic vitality initiatives, USDOT’s freight directives, and MassDOT’s freight planning will all influence strategies that the MPO uses to monitor economic vitality performance going forward. The MPO’s ongoing freight planning work will also play an important role in this process. Future activities may include the following:
Table 4-28 highlights some of the ways that the MPO’s FFYs 2024–28 Regional Target-funded projects support improved performance in the MPO’s various goal areas.
Table 4-28
FFYs 2024–28 TIP Target Program: Projects by the Numbers
Total |
Type |
Impact |
68 |
Lane miles of substandard pavement |
Improve pavement condition |
59 |
Regional target projects |
Improve performance in MPO goal areas including safety, mobility, congestion, and bridge and pavement conditions |
8 |
Bridge structures |
Improve bridge conditions |
4 |
Transit stations |
Improve transit asset conditions |
49 |
Projects that improve intermodal connections or access to transit |
Improve mobility for transit riders |
47 |
New lane miles to bike and shared use path network |
Improve mobility for bicyclists |
33 |
Projects that improve access to targeted development areas |
Increase access to economic opportunity |
14 |
New miles to sidewalk network |
Improve mobility for pedestrians |
4 |
New bikeshare stations |
Increase mobility access |
1 |
Expanded transit service |
Increase mobility for transit riders |
11.2 million kg |
CO2 reduced per year |
Improve air quality |
|
Reduced delay |
Decrease congestion |
38 |
These projects will occur in 38 cities and towns |
Shared benefits throughout the region |
CO2 = carbon dioxide. kg = kilograms.
Source: Boston Region MPO staff.
The three key phases in the MPO’s PBPP process—planning, investing, and monitoring and evaluating—were discussed earlier in this chapter. Within this framework, the MPO’s TIP relates primarily to the first two phases, focusing on the relationship between the goals and objectives and performance requirements in the MPO’s planning framework and ways the MPO will invest its capital dollars in upcoming federal fiscal years. Other MPO activities relate more directly to the monitoring and evaluation phase of PBPP:
The Commonwealth and the region’s transit agencies also have reporting and evaluation responsibilities. MassDOT and the Commonwealth’s Executive Office of Public Safety and Security report roadway safety target information annually to FHWA and NHTSA. MassDOT reports other statewide performance targets and related information to FHWA on a biennial basis via FHWA’s Performance Management Form. The MBTA, MWRTA, and CATA must report their asset inventory and condition data to the NTD and provide information about the progress that has been made with respect to performance measures and targets as compared to previous reports. These transit agencies also regularly report data about safety outcomes to the NTD, and their annual reviews of their PTASPs and safety targets also create opportunities for them to evaluate their performance.
Going forward, the MPO will incorporate the results of these reports and evaluations to use in its future planning and investment activities. These activities may include identifying new ways to bring information about performance into the MPO’s LRTP and TIP development processes, such as by updating project selection criteria or providing information through other means. This work would help the MPO develop scenarios to explore how various transportation investments made through the LRTP could support various goals and performance areas. Over time, the MPO expects that activities like these will help ensure that the MPO’s investments are helping to meet its vision and goals for the region’s transportation system.
4-1 Urbanized areas are defined by the US Census Bureau to represent the urban cores of metropolitan areas. The Boston MA-NH-RI UZA includes the 97 municipalities in the Boston Region MPO and includes portions of neighboring MPOs in eastern Massachusetts and New Hampshire.
4-2 MPO memoranda describing the Commonwealth’s safety targets from prior years are available at www.bostonmpo.org/performance-archive.
4-3 Massachusetts Department of Transportation, Massachusetts Strategic Highway Safety Plan (2023), pg. I, accessed February 21, 2023.
https://www.mass.gov/doc/massachusetts-shsp-2023/download.
4-4 The Commonwealth of Massachusetts’ 2019 Bicycle Transportation Plan is available at www.mass.gov/service-details/bicycle-plan, and the 2019 Pedestrian Transportation Plan is available www.mass.gov/service-details/pedestrian-plan.
4-5 MBTA, CATA, and MWRTA 2023 PTASPs are available on the March 16, 2023, page of the MPO meeting calendar. See https://www.ctps.org/calendar/day/20230316;
SMS is a data-driven approach to managing safety risks. See MBTA, MBTA Transit Safety Plan (December 2022), pg. 14.
4-6 The content of these tables is based on the project design information that was available to MPO staff when the FFYs 2024–28 TIP document was developed. Project extents and features may change as projects advance through the design development and review process.
4-7 For more information about the definitions of these performance measures—including deaths, injuries, or events that may be excluded from totals—see Boston Region MPO staff,
“Transit Safety Performance Requirements and Targets” (March 16, 2023). https://www.ctps.org/data/calendar/pdfs/2023/0316_MPO_Transit_Safety_Targets.pdf.
4-8 MBTA, MBTA Transit Safety Plan, pg. 37.
4-9 MBTA, MBTA Transit Safety Plan, pg. 40.
4-10 MPO staff calculated these VRM estimates using the National Transit Database’s January 2023 Monthly Module Adjusted Data release, available at www.transit.dot.gov/ntd/data-product/monthly-module-adjusted-data-release.
4-11 Specific data sources include the March 6, 2023, Monthly Modal Time Series file (available at https://data.transportation.gov/Public-Transit/Monthly-Modal-Time-Series/5ti2-5uiv), the March 6, 2023, Major Safety Events file (available at https://data.transportation.gov/Public-Transit/Major-Safety-Events/9ivb-8ae9), the 2017-21 Annual Database Vehicle Maintenance files (available at www.transit.dot.gov/ntd/ntd-data), and the January 2023 Monthly Module Adjusted Data Release file (available at www.transit.dot.gov/ntd/data-product/monthly-module-adjusted-data-release).
4-12 MPO staff calculated these VRM estimates using the National Transit Database’s January 2022 Monthly Module Adjusted Data release, available at www.transit.dot.gov/ntd/data-product/monthly-module-adjusted-data-release.
4-13 Specific data sources include the March 6, 2023, Monthly Modal Time Series file (available at https://data.transportation.gov/Public-Transit/Monthly-Modal-Time-Series/5ti2-5uiv , the March 67, 20232, Major Safety Events file (available at https://data.transportation.gov/Public-Transit/Major-Safety-Events/9ivb-8ae9), the 2017-21 Annual Database Vehicle Maintenance files (available at www.transit.dot.gov/ntd/ntd-data), and the January 2023 Monthly Module Adjusted Data Release file (available at www.transit.dot.gov/ntd/data-product/monthly-module-adjusted-data-release).
4-14 The TAMP is a federally required risk-based asset management plan that includes asset inventories, condition assessments, and investment strategies to improve the condition and performance of the NHS, particularly its bridges and pavements. Massachusetts Department of Transportation, Transportation Asset Management Plan (September 2019), accessed March 1, 2023. See: www.mass.gov/doc/2019-transportation-asset-management-plan/download
4-15MassDOT continues to measure pavement quality and to set statewide short-term and long-term targets in the MassDOT Performance Management Tracker using the Pavement Serviceability Index (PSI), which is a different index than IRI.
4-16Under the TIP project selection criteria used before October 2020, staff awarded points to projects that were expected to improve a facility’s ability to function in instances of flooding; protect a facility from sea level rise; strengthen infrastructure against seismic activity; address critical transportation infrastructure; protect freight network elements; or implement hazard mitigation or climate adaptation plans. Staff also awarded points to projects that were expected to improve evacuation or diversion routes or to improve access routes to or near emergency support locations. The MPO’s current TIP evaluation criteria, which are described in Appendix A, also include elements focused on emergency response and resiliency. These criteria increase the emphasis on regional coordination and nature-based solutions, and maintaining connections to an expanded set of critical facilities.
4-17 Federal Transit Administration, “Performance Management” (January 2023), accessed March 7, 2023.
www.transit.dot.gov/PerformanceManagement
4-18 Massachusetts Department of Transportation, MassDOT Fully Accessible Vehicle Guide: An Overview of Accessible Vehicle Specifications (April 2022), accessed March 2, 2023.
www.mass.gov/doc/massdot-fully-accessible-vehicle-guide/download
4-19 FTA, FTA Circular 5010.E “Award Management Requirements” (July 16, 2018), accessed March 2, 2023.
www.transit.dot.gov/regulations-and-guidance/fta-circulars/award-management-requirements-circular-50101e
4-20 The MPO’s CMAQ Performance Plans and progress reports are available at bostonmpo.org/performance.
4-21 The 2017 Massachusetts Freight Plan is available at www.mass.gov/service-details/freight-plan. MassDOT’s 2019 Congestion in the Commonwealth report and accompanying studies are available at www.mass.gov/service-details/congestion-in-the-commonwealth.
4-22 The MBTA’s Focus40 plan is available at www.mbtafocus40.com.
4-23 States and MPOs must calculate LOTTR values for four time periods: weekdays from 6:00 AM to 10:00 AM, weekdays from 10:00 AM to 4:00 PM, weekdays from 4:00 PM to 8:00 PM, and weekend days from 6:00 AM to 8:00 PM.
4-24 FHWA, “Frequently Asked Questions: Target Setting,” accessed March 7, 2023. www.fhwa.dot.gov/tpm/faq.cfm#targ.
4-25 States and MPOs must calculate TTTR Index values for five time periods: weekdays from 6:00 AM to 10:00 AM, weekdays from 10:00 AM to 4:00 PM, weekdays from 4:00 PM to 8:00 PM, weekend days from 6:00 AM to 8:00 PM, and all days from 8:00 PM to 6:00 AM.
4-26 A precursor is a chemical compound that reacts with other chemical compounds in the presence of solar radiation to form pollutants.
4-27 FHWA requires state DOTs and MPOs to use 60 percent of the posted speed limit for the segment or 20 miles per hour, whichever is greater, for the threshold speed.
4-28 FHWA requires states and MPOs to use the period from 6:00 AM to 10:00 AM to represent the morning peak period, but it allows these agencies to choose either 3:00 PM to 7:00 PM or 4:00 PM to 8:00 PM to represent the evening peak period. MassDOT and NH DOT selected the period from 3:00 PM to 7:00 PM to represent the evening peak period for the Boston MA-NH-RI UZA.
4-29 Rhode Island was not included in the calculation of this measure because it does not include any portion of the Boston MA-NH-RI UZA’s NHS network. See FHWA’s Applicability Determination: CMAQ Traffic Congestion and CMAQ On-Road Mobile Source Emissions Measures (23 CFR 490.707 and 490.807), and Change Log: Applicability Determination for CMAQ Measures,” May 22, 2018.
4-30 An On-Road Mobile Source Emissions Reductions Report for Massachusetts is available at www.fhwa.dot.gov/tpm/reporting/state/emissions.cfm?state=Massachusetts.
4-31 For more information about MetroCommon 2050, visit metrocommon.mapc.org.
4-32 Metropolitan Area Planning Council, 2020-2025 Comprehensive Economic Development Strategy, 2021, page 5. Accessed on March 7, 2023, at www.mapc.org/wp-content/uploads/2021/02/Final-CEDS-022521.pdf.
This chapter documents the latest Transportation Improvement Program (TIP) air quality conformity determination for the 1997 Ozone National Ambient Air Quality Standards (NAAQS) and carbon monoxide (CO) NAAQS in the Boston Region Metropolitan Planning Organization (MPO) area. It covers the applicable conformity requirements according to the latest regulations, regional designation status, legal considerations, and federal guidance.
The 1990 Clean Air Act Amendments (CAAA) require MPOs within nonattainment and maintenance areas to perform air quality conformity determinations prior to the approval of Long-Range Transportation Plans (LRTPs) and TIPs, and at such other times as required by regulation. CAAA Section 176(c) (Title 42, United States Code [USC], Section 7506 [c]) requires that federally funded or approved highway and transit activities are consistent with (“conform to”) the purpose of the State Implementation Plan (SIP). Conformity to the purpose of the SIP means that Federal Highway Administration (FHWA) and Federal Transit Administration (FTA) funding and approvals are given to highway and transit activities that
The United States Environmental Protection Agency’s (EPA) transportation conformity rules establish the criteria and procedures for determining whether metropolitan transportation plans, TIPs, and federally supported highway and transit projects conform to the SIP (Title 40, Code of Federal Regulations [CFR], Parts 51.390 and 93).
A nonattainment area is one that the EPA has designated as not meeting certain air quality standards. A maintenance area is a nonattainment area that now meets the standards and has been redesignated as maintaining the standard. A conformity determination is a demonstration that plans, programs, and projects are consistent with the SIP for attaining the air quality standards. The CAAA requirement to perform a conformity determination ensures that federal approval and funding go to transportation activities that are consistent with air quality goals.
The Commonwealth of Massachusetts was previously classified as a nonattainment area for ozone and was divided into two nonattainment areas. The Eastern Massachusetts ozone nonattainment area included Barnstable, Bristol, Dukes, Essex, Middlesex, Nantucket, Norfolk, Plymouth, Suffolk, and Worcester counties. The Western Massachusetts ozone nonattainment area included Berkshire, Franklin, Hampden, and Hampshire counties. With these classifications, the 1990 CAAA required the Commonwealth to reduce its emissions of volatile organic compounds (VOCs) and nitrogen oxides (NOx), the two major precursors to ozone formation, to achieve attainment of the ozone standard.
The 1970 Clean Air Act defined a one-hour NAAQS for ground-level ozone. The 1990 CAAA further classified degrees of nonattainment of the one-hour standard based on the severity of the monitored levels of the pollutant. The Commonwealth of Massachusetts was classified as being in serious nonattainment of the one-hour ozone standard and was required to achieve attainment by 1999. The attainment date was later extended, first to 2003 and a second time to 2007.
In 1997, the EPA proposed a new eight-hour ozone standard that replaced the one-hour standard, effective June 15, 2005. Scientific research had shown that ozone could affect human health at lower levels and over longer exposure times than one hour. The new standard was challenged in court, and after a lengthy legal battle the courts upheld it. The new standard was finalized in June 2004. The new eight-hour standard is 0.08 parts per million (ppm) averaged over eight hours, and this level is not to be exceeded more than once per year. With this new standard, nonattainment areas were again further classified based on the severity of the eight-hour values. Massachusetts was classified as being in moderate nonattainment for the eight-hour standard and again was separated into two nonattainment areas—Eastern Massachusetts and Western Massachusetts.
In March 2008, the EPA published revisions to the eight-hour ozone NAAQS, establishing a level of 0.075 ppm (Volume 73, Federal Register [FR], page 16438; March 27, 2008). In 2009, EPA announced it would reconsider this standard because it fell outside of the range recommended by the Clean Air Scientific Advisory Committee. However, EPA did not take final action on the reconsideration, keeping the standard as 0.075 ppm.
After reviewing data from Massachusetts monitoring stations, EPA sent a letter on December 16, 2011, proposing that only Dukes County be designated as nonattainment for the new proposed 0.075 ppm ozone standard. The Commonwealth of Massachusetts concurred with these findings.
On May 21, 2012, the final rule (77 FR 30088) was published in the Federal Register. This rule defined the 2008 NAAQS as 0.075 ppm, the standard that was promulgated in March 2008. A second rule (77 FR 30160) published on May 21, 2012, revoked the 1997 ozone NAAQS effective one year after the July 20, 2012, effective date of the 2008 NAAQS.
Also, on May 21, 2012, the Federal Register published the air quality designation areas for the 2008 NAAQS. Dukes County was the only area in Massachusetts designated as a nonattainment area. All other Massachusetts counties were designated as attainment/unclassified for the 2008 standard.
On March 6, 2015, EPA published the final rulemaking, “Implementation of the 2008 National Ambient Air Quality Standards (NAAQS) for Ozone: State Implementation Plan Requirements; Final Rule” (80 FR 12264), effective April 6, 2015. This rulemaking confirmed the removal of transportation conformity to the 1997 ozone NAAQS and the replacement with the 2008 ozone NAAQS, which actually set a stricter level of allowable ozone concentration than the 1997 standards and classified Massachusetts (except for Dukes County) as attainment/unclassifiable.
However, on February 16, 2018, the United States Court of Appeals for the District of Columbia Circuit in South Coast Air Quality Mgmt. District v. EPA (“South Coast II,” 882 F.3d 1138) held that transportation conformity determinations must be made in areas that were designated either as nonattainment or maintenance areas for the 1997 ozone NAAQS and attainment for the 2008 ozone NAAQS when the 1997 ozone NAAQS was revoked.
On November 29, 2018, EPA issued Transportation Conformity Guidance for the South Coast II Court Decision (EPA-420-B-18-050, November 2018), which addressed how transportation conformity determinations could be made in these areas. According to the guidance, both Eastern and Western Massachusetts, along with several other areas across the country, were defined as orphan nonattainment areas—areas that were designated as nonattainment areas for the 1997 ozone NAAQS at the time of its revocation (80 FR 12264, March 6, 2015) and as attainment areas for the 2008 ozone NAAQS in EPA’s original designation rule for this NAAQS (77 FR 30160, May 21, 2012). As of February 16, 2019, conformity determinations are required in these areas.
After February 16, 2019, as a result of the court ruling and the subsequent federal guidance, transportation conformity for the 1997 NAAQS—intended as an anti-backsliding measure—now applies to both Massachusetts orphan areas. Therefore, a conformity determination was made for the 1997 ozone NAAQS in all of the Massachusetts MPOs’ FFYs 2020–40 LRTPs. This conformity determination was finalized in July 2019, following all of the MPOs’ endorsements of their LRTPs, and approved by the Massachusetts Divisions of FHWA and FTA on October 15, 2019. This conformity determination continues to be valid for the Boston Region MPO’s FFYs 2024–28 TIP, and Massachusetts’ 2024–28 State Transportation Improvement Program, as each is developed from the conforming 2020–40 LRTPs.
The transportation conformity regulation in 40 CFR § 93.109 sets forth the criteria and procedures for determining conformity. The conformity criteria for TIPs and LRTPs include a demonstration of fiscal constraint (§ 93.108), a basis on the latest planning assumptions (§ 93.110), use of the latest emissions model (§ 93.111), consultation (§ 93.112), provision for the timely implementation of transportation control measures (TCMs) (§ 93.113[b] and [c]), and consistency with an emissions budget and/or interim emissions tests (§ 93.118 and/or § 93.119).
For the 1997 ozone NAAQS areas, transportation conformity for TIPs and LRTPs for the 1997 ozone NAAQS can be demonstrated without a regional emissions analysis, per 40 CFR § 93.109(c). This provision states that the regional emissions analysis requirement applies one year after the effective date of EPA’s nonattainment designation for a NAAQS and until the effective date of revocation of such NAAQS for an area. The 1997 ozone NAAQS revocation was effective on April 6, 2015, and the court for South Coast II upheld the revocation. As no regional emission analysis is required for this conformity determination, there is no requirement to use the latest emissions model, budget, or interim emissions tests.
Therefore, transportation conformity for the 1997 ozone NAAQS for the Boston Region MPO’s FFYs 2024–28 TIP can be demonstrated by showing that the remaining requirements in 40 CFR § 93.109 have been met. The following requirements regarding the use of the latest planning assumptions, consultation, timely implementation of TCMs, and fiscal constraint are defined in Section 2.4 of that guidance and are addressed in the following sections.
The requirement to use the latest planning assumptions in 40 CFR § 93.110 generally applies to regional emissions analyses. In the areas subject to the 1997 ozone NAAQS, the use of latest planning assumptions requirement applies to assumptions about TCMs in an approved SIP. (See the section titled Timely Implementation of Transportation Control Measures below).
The consultation requirements in 40 CFR § 93.112 for interagency consultation and public consultation were addressed. Interagency consultation was conducted with FHWA, FTA, EPA Region 1, the Massachusetts Department of Environmental Protection (DEP), and the other Massachusetts MPOs on March 6, 2019, to discuss the latest conformity-related court rulings and resulting federal guidance. Regular and recurring interagency consultations have been held on (at least) an annual schedule, with the most recent conformity consultation held on March 13, 2023. Ongoing consultation is conducted in accordance with the following items:
Public consultation was conducted consistent with planning rule requirements in 23 CFR § 450. Title 23 CFR § 450.324 and 310 CMR 60.03(6)(h) requires that the development of the TIP, LRTP, and related certification documents provide an adequate opportunity for public review and comment. Section 450.316(b) also establishes the outline for MPOs’ public engagement programs.
The Boston Region MPO's current Public Engagement Plan was endorsed by the MPO board in October 2021 and amended in September 2022. The Public Engagement Plan ensures that the public will have access to the TIP and LRTP and all supporting documentation, provides for public notification of the availability of the TIP and LRTP and the public's right to review the document and comment thereon, and provides a 21-day public review and comment period prior to the adoption of the TIP and LRTP and related certification documents. The plan is available at https://www.bostonmpo.org/public-engagement.
The public comment period for this conformity determination will commence on or about April 20, 2023. During the 21-day public comment period, any comments received will be incorporated into this TIP. This process will allow sufficient opportunity for public comment and for the MPO board to review the draft document. The public comment period will close on or about May 11, 2023, and the Boston Region MPO is expected to endorse this air quality conformity determination on June 1, 2023. These procedures comply with the associated federal requirements.
Timely Implementation of Transportation Control Measures
Transportation control measures were required in the SIP in revisions submitted to EPA in 1979 and 1982. All of these TCMs have been accomplished through construction projects or through implementation of ongoing programs. All of the projects have been included in the Boston Region MPO's TIPs (present and past) as recommended projects or projects requiring further study. Information on the Green Line Extension to Somerville and Medford, which was completed between this and last year’s TIP, is as follows:
The Green Line Extension is a 4.7-mile light rail line, which extended the current Green Line service from a relocated Lechmere Station in East Cambridge to a terminus at College Avenue in Medford, with a spur to Union Square in Somerville. This project had a cost estimate of $2.289 billion. Funding came from a combined $1.99 billion in federal and state funds and pledged contributions totaling approximately $296 million from the Cities of Cambridge and Somerville ($75 million), the Boston Region MPO ($157.1 million), and MassDOT ($64.3 million through Special Obligation Bonds). Cambridge and Somerville were refunded their full $75 million in November 2021.
In early 2017, the MBTA initiated a procurement process for a design-build entity to design and construct the project. In November 2017, approval was received to execute a design-build contract with Green Line Extension contractors. The notice to proceed under the contract was issued in December 2017. The FTA obligated an initial portion ($100 million) of the Capital Investment Grant funds for the project in December 2017, under the 2015 Full Funding Grant Agreement. Additional funds followed. The contract with Green Line Extension contractors was in the amount of $999.7 million.
The primary goals of the project were to improve corridor mobility, boost transit ridership, improve regional air quality, ensure equitable distribution of transit services, and support opportunities for sustainable development in Cambridge, Somerville, and Medford. In addition to the light rail service on two new branches extending from Lechmere Station to Union Square Station and College Avenue Station, the project included the construction of a vehicle maintenance facility and a multiuse path.
By filing an Expanded Environmental Notification Form, procuring multiple design consultants, and publishing both Draft and Final Environmental Impact Reports, MassDOT met the first four interim milestones associated with the Green Line Extension project. Since those filings, MassDOT committed substantial resources to the Green Line Extension project, a top transportation priority of the Commonwealth and the largest expansion of the MBTA rapid transit system in decades. The project then transitioned from the planning and environmental review phases to the design, engineering, and construction phases, and the tasks associated with programming federal funding began.
The timeline for overall project completion, however, was substantially delayed. In the 2011 SIP Status Report, MassDOT reported that the Green Line Extension project would not meet the legal deadline for completion by December 31, 2014. The delay triggered the requirement to provide interim emission reduction offset projects and measures for the period of the delay (beginning January 1, 2015). Working with the Central Transportation Planning Staff, MassDOT and the MBTA calculated the value for reductions of non-methane hydrocarbons, CO, and NOx that would be equal to or greater than the reductions projected to result from the operation of the Green Line Extension during the period of the delay, as specified in the SIP regulation.
In June 2012, MassDOT released a list of potential mitigation ideas received from the public that could be used as offset measures. In the summer and fall of 2012, MassDOT elicited public comments on these potential measures. Then the MBTA created an internal working group to determine a final portfolio of interim mitigation measures to implement by December 31, 2014, the legal deadline for the implementation of the Green Line Extension.
This work resulted in a recommendation to implement the following three interim mitigation measures, which collectively would meet the emissions reduction target for the project:
The Petition to Delay was submitted to the DEP on July 22, 2014, and expanded further on the analysis and determination of the interim offset measures. In a letter dated July 16, 2015, the DEP conditionally approved MassDOT's request to delay the Green Line Extension project and the implementation of the above interim mitigation measures. Both the 2014 Petition to Delay and the July 2015 Conditional Approval are available on MassDOT's website.
The Green Line Extension to Union Square opened for service on March 21, 2022, and the extension to Medford opened on December 12, 2022.
Funding Source: The Commonwealth, FTA via the Full Funding Grant Agreement, and the Boston Region MPO
Transportation conformity requirements in 40 CFR § 93.108 state that TIPs and LRTPs must be fiscally constrained so as to be consistent with the United States Department of Transportation’s metropolitan planning regulations (23 CFR part 450). The Boston Region MPO’s FFYs 2024–28 TIP is consistent with the required fiscal constraints, as demonstrated in this document.
The requirement to perform a conformity determination for CO for the city of Waltham has expired. On April 22, 2002, the EPA classified Waltham as being in attainment for CO emissions. Subsequently, an EPA-approved CO limited maintenance plan was set up through the Massachusetts SIP to ensure that emission levels did not increase. While the maintenance plan was in effect, past TIPs and LRTPs included an air quality conformity determination against a “budget test” (using “hot spot” analyses as needed at the project level) for Waltham. As of April 22, 2022, however, the 20-year maintenance period for this CO area expired and transportation conformity is no longer required for this pollutant in this municipality. This ruling is documented in a letter from EPA dated April 26, 2022.
In summary and based on the entire process described above, the Boston Region MPO has prepared this conformity determination for the 1997 ozone NAAQS in accordance with EPA’s and the Commonwealth of Massachusetts’ latest conformity regulations and guidance. This conformity determination process demonstrates that the FFYs 2024–28 TIP meets the Clean Air Act and Transportation Conformity Rule requirements for the 1997 ozone NAAQS and has been prepared following all the guidelines and requirements of these rules during this period.
Therefore, the implementation of the Boston Region MPO’s FFYs 2024–28 TIP is consistent with the air quality goals of, and in conformity with, the Massachusetts SIP.
The Boston Region Metropolitan Planning Organization (MPO) monitors how the transportation projects it funds affect the region’s most vulnerable populations and those who have been disproportionately affected by the region’s transportation system. This monitoring helps ensure these populations are not disproportionately burdened by or receive disproportionately fewer benefits from MPO projects. This chapter provides the results of analyses conducted for monitoring projects funded with Regional Target funds in the federal fiscal years (FFYs) 2024–28 Transportation Improvement Program (TIP). 6-1 It also includes an overview of the transportation equity (TE) component of the project evaluation process.
In response to federal mandates, the MPO considers six demographic groups to be TE populations—populations that are covered by federal directives and that have been disproportionately underserved and burdened by the transportation system. These mandates are Title VI of the Civil Rights Act of 1964; the Americans with Disabilities Act of 1990; Executive Order 13166—Improving Access to Services for Persons with Limited English Proficiency; and the Age Discrimination Act of 1975. (More information on these mandates can be found in Appendix E.) TE populations include people who identify as a minority, people with low-incomes, people with limited English proficiency (LEP), older adults, young people, and people with disabilities. 6-2
The MPO’s TE goal, established in the most recent Long-Range Transportation Plan (LRTP), Destination 2040, shapes the MPO’s approach to improving transportation outcomes for TE populations. The TE goal is to ensure that all people receive comparable benefits from, and are not disproportionately burdened by, MPO investments, regardless of race, color, national origin, age, income, ability, or sex. The MPO’s practices to achieve this goal are guided by the various federal nondiscrimination and environmental justice laws and regulations. In addition, the MPO strives to go beyond these federal requirements to meet the transportation needs and address disproportionately high and adverse effects of existing transportation investments experienced by TE populations in the Boston region.
As part of this work, the MPO staff analyzes projects that are candidates to receive TIP Regional Target funding individually during the MPO’s annual project evaluation process. Then staff conduct equity analyses on the group of projects that are selected for funding. These reviews allow the MPO to assess how the projects perform relative to the MPO’s TE goal, as well as progress in improving transportation outcomes for TE populations. The remainder of this chapter describes the review processes for Regional Target-funded projects in the FFYs 2024–28 TIP.
The analyses for the FFYs 2024–28 TIP were based on demographic data from the 2020 Decennial Census and the 2017–21 American Community Survey (ACS). Census block groups were the geographic unit of analysis. Results of analyses from previous TIP cycles are also presented in this chapter for comparison. The demographic data sources used in the previous TIP cycles are listed in the footnote.6-3 Transportation analysis zones were the geographic unit of analysis in the previous TIPs.
The MPO’s TE evaluation criteria assess the impacts of projects on TE populations and give higher scores to projects that are expected to provide greater benefits to these populations. This structure allows the MPO to assess transportation outcomes for TE populations, which aligns with the MPO’s equity goal. The TE score as a percentage of a project’s maximum possible score is about 20 percent. For individual project scores, see Appendix A.
As required by federal regulations, the MPO assesses the impacts of all Regional Target-funded projects, as a group, on TE populations. These analyses help the MPO to better understand the extent to which investments meet its TE goal and inform decision-making.
In keeping with its standard practice, the MPO reserved some Regional Target funds in the FFYs 2024–28 TIP to allow flexibility to support projects in certain program areas when projects are identified. Specifically, $8.3 million for the Community Connections and $26 million for the Transit Modernization investment programs, $4 million for Project Design Support, and $6 million for a Bikeshare State-of-Good-Repair Set-Aside have been left unprogrammed. Some of the equity analyses in this chapter do not account for these funds, where noted. Additionally, the analyses in this chapter include only projects funded by the MPO and not projects in the Boston region that are funded by other entities such as Massachusetts Department of Transportation.
Table 6-1 shows the total number of people in the Boston region who belong to each TE population, as well as the percentage of each TE population relative to the Boston region’s population. Values from the FFYs 2023–27 TIP are also shown as a comparison.
Table 6-1
Transportation Equity Populations in the Boston Region
| TE Population | ||||
| FFYs 2023–27 TIP | FFYs 2024–28 TIP | FFYs 2023–27 TIP | FFYs 2024–28 TIP | |
| Minority population | 1,223,835 | 1,223,835 | 36.5% | 36.5% |
| Low-income population | 674,215 | 673,276 | 20.1% | 20.1% |
| People with LEP | 375,848 | 382,182 | 11.2% | 11.2% |
| People with disabilities | 342,552 | 337,229 | 10.2% | 10.2% |
| Older adult population | 232,286 | 224,306 | 6.9% | 6.9% |
| Youth population | 634,550 | 634,153 | 18.9% | 18.9% |
Note: To calculate the TE population values, the population in each block group was controlled to the total 2020 census population count and then summed to calculate the total TE population in the Boston region.
FFY = federal fiscal year. LEP = limited English proficiency. TE = transportation equity. TIP = Transportation Improvement Program.
Source: US Census Bureau.
Figures 6-1 to 6-6 show the percent of each TE population in communities throughout the Boston region. In general, the minority population, people with low incomes, and people with limited English proficiency tend to live closer to or in Boston. On the other hand, people age 75 or older, people age 17 or younger, and people with disabilities are dispersed throughout the region.
Figure 6-1
Percentage of the Minority Population in the Boston Region
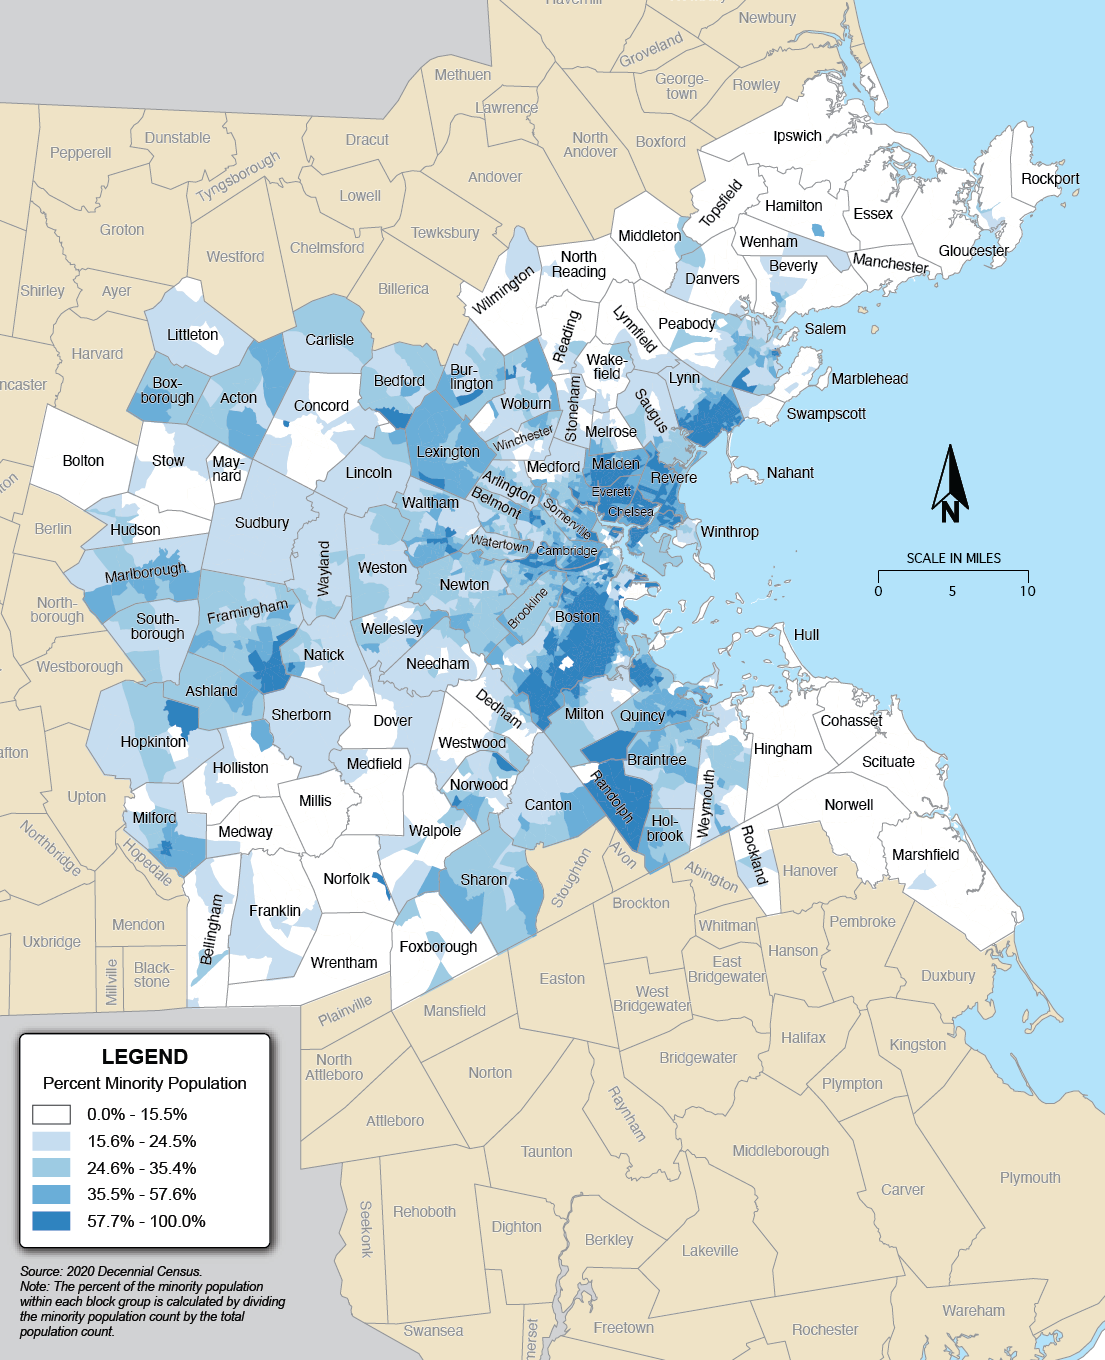
Figure 6-2
Percentage of the Low-income Population in the Boston Region
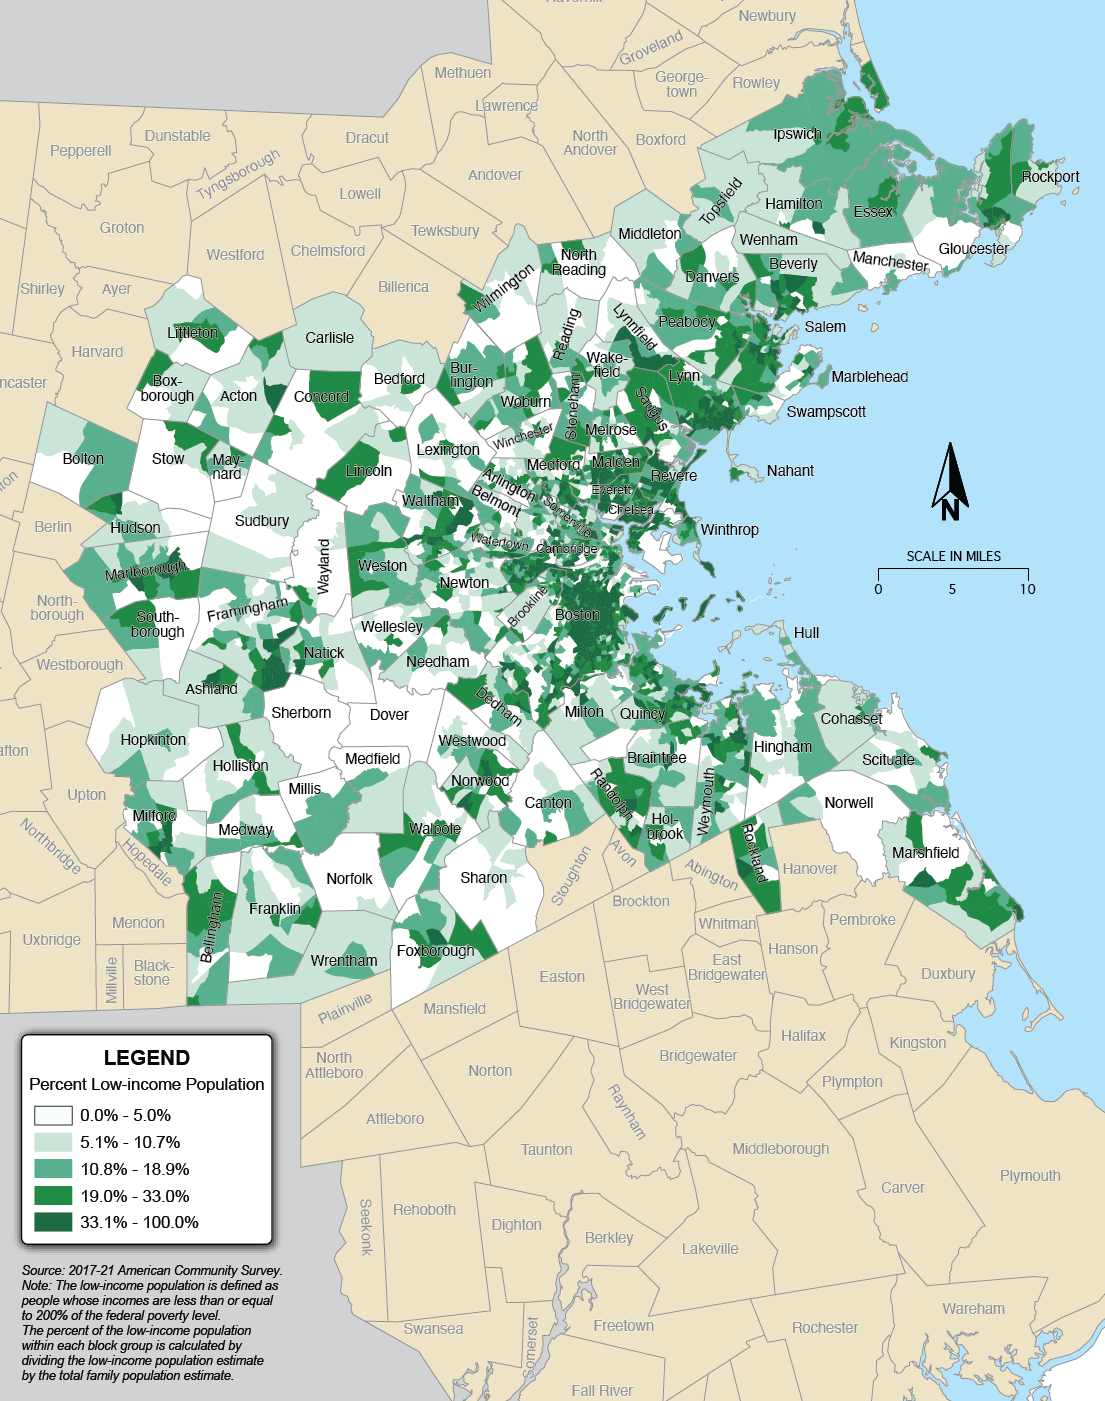
Figure 6-3
Percentage of People with Limited English Proficiency in the Boston Region
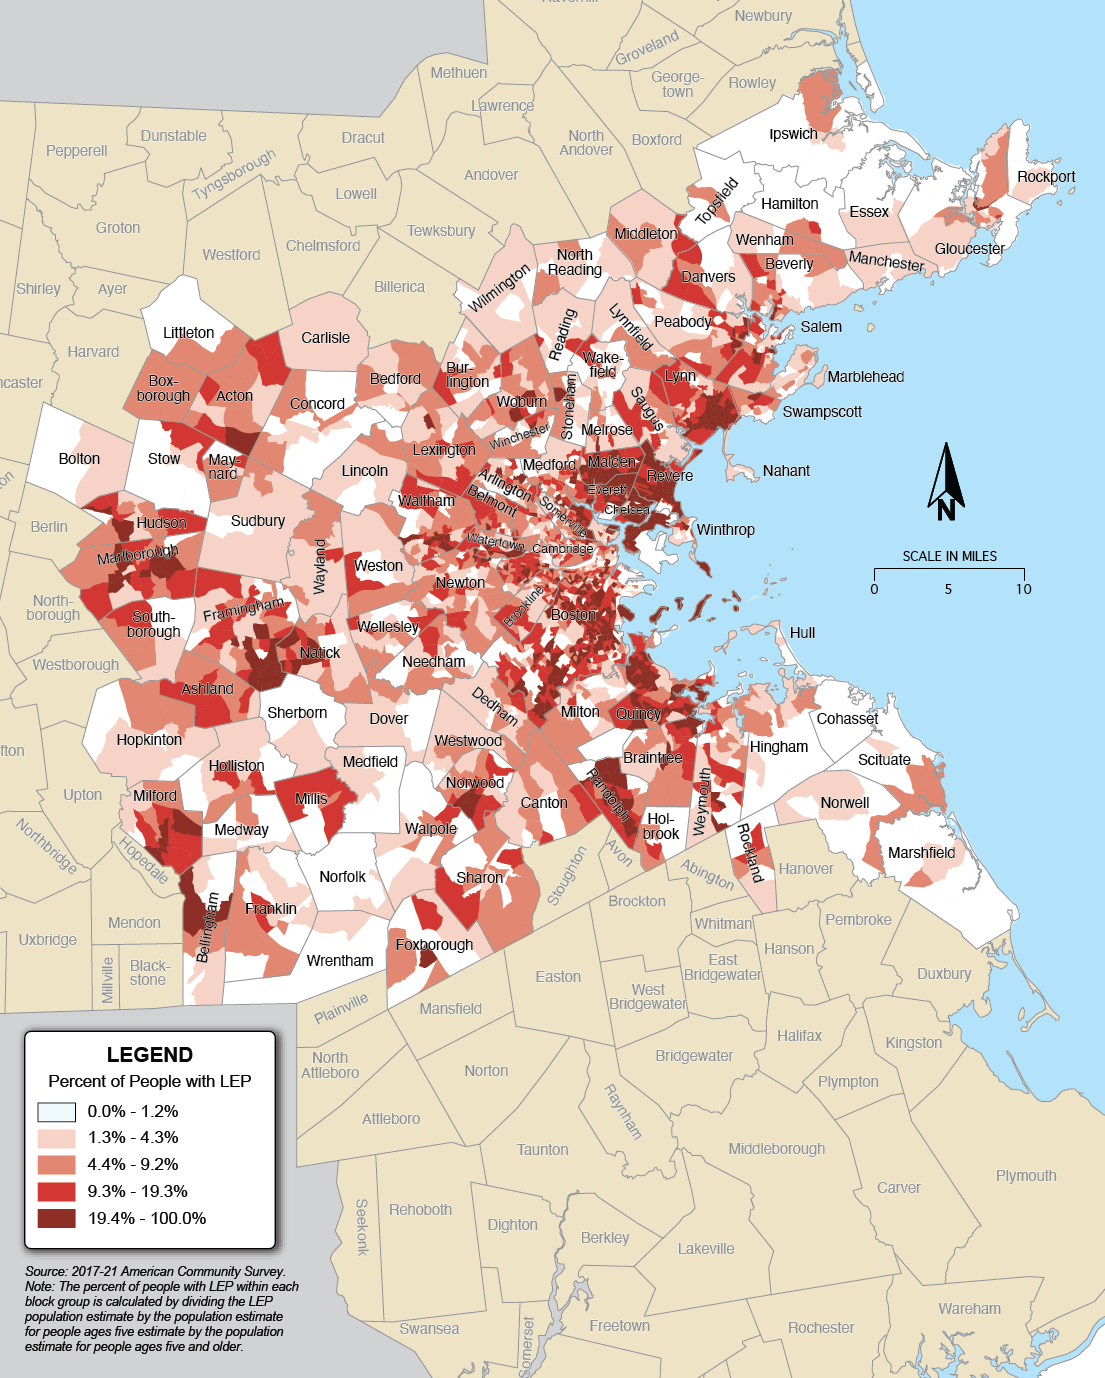
Figure 6-4
Percentage of People with Disabilities in the Boston Region
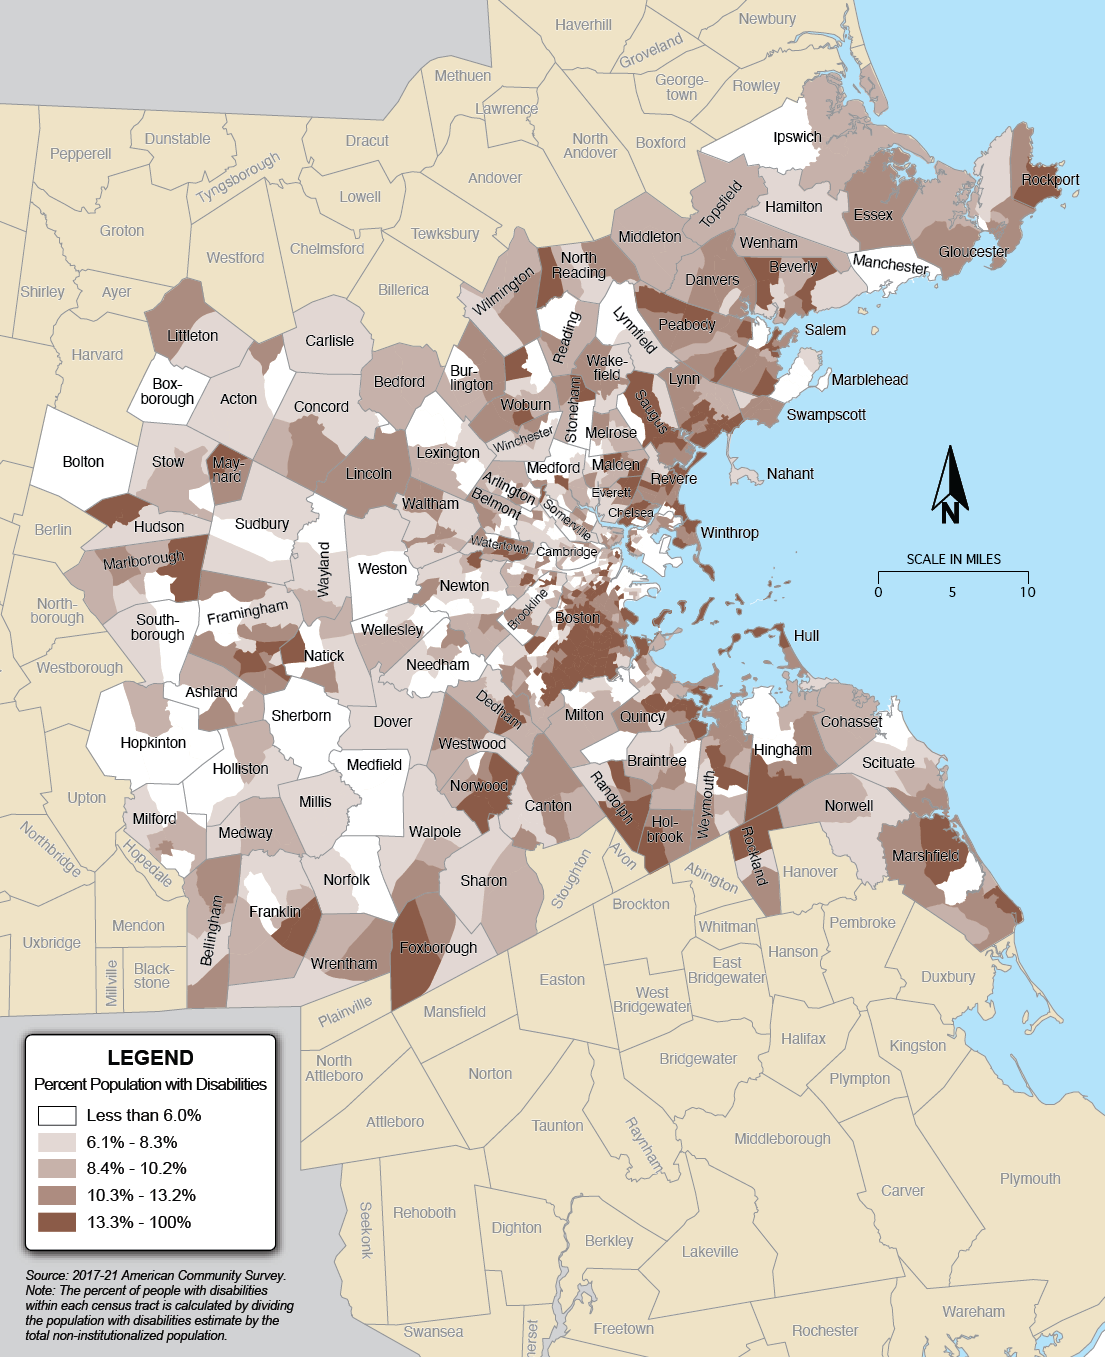
Figure 6-5
Percentage of Older Adults in the Boston Region
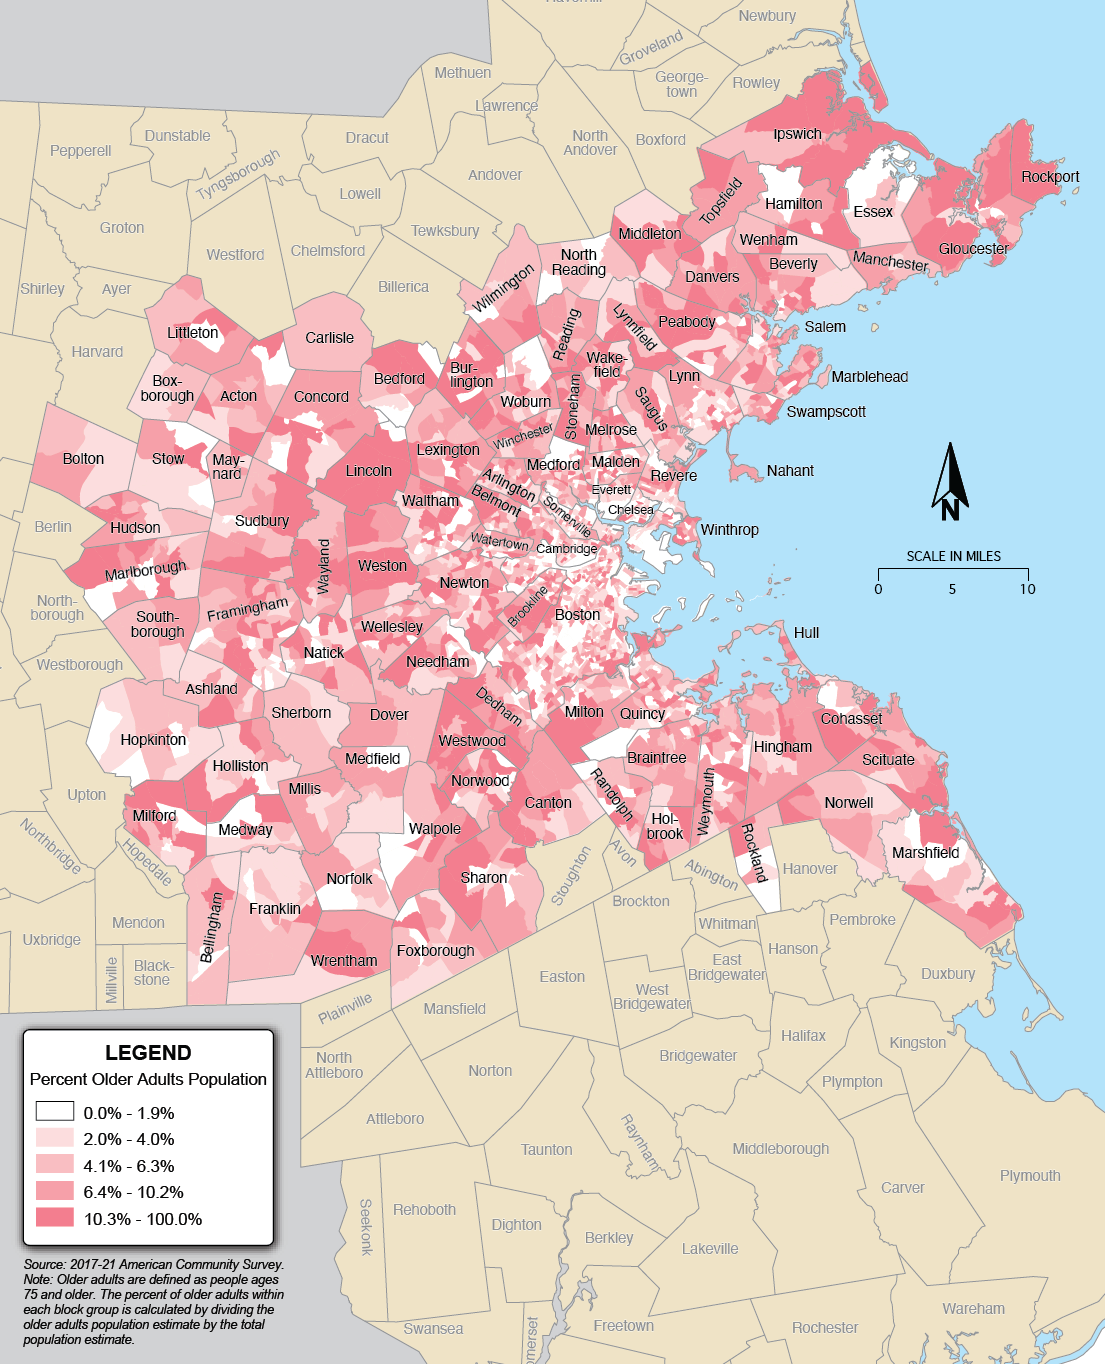
Figure 6-6
Percentage of the Youth Population in the Boston Region
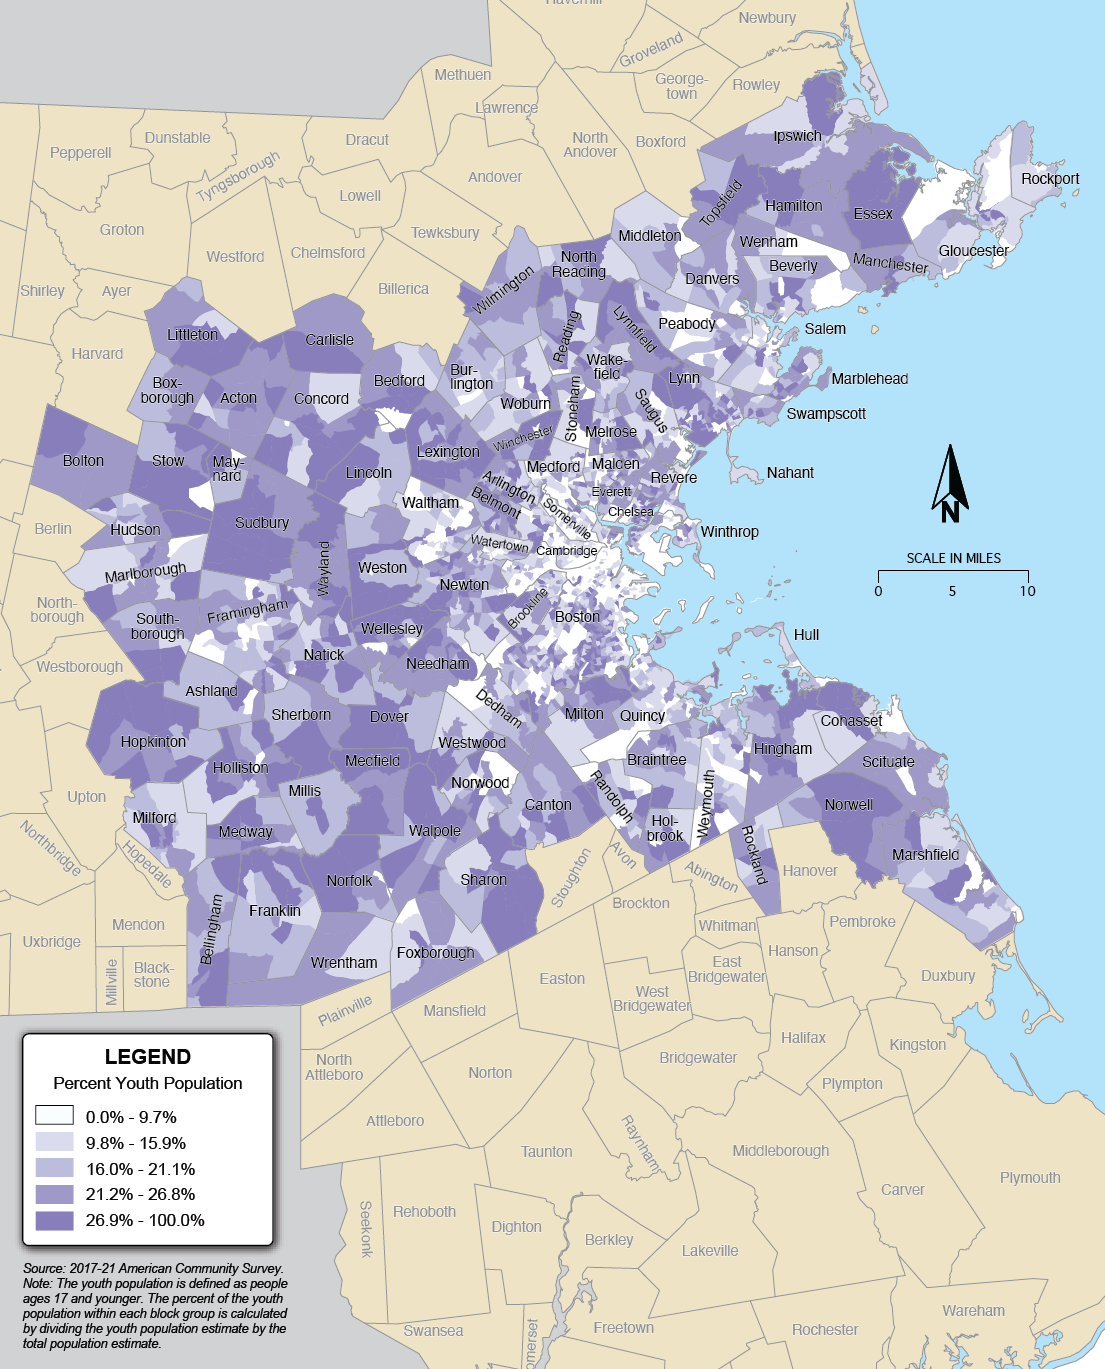
The analyses described in this section assessed which TE populations are likely to be served or impacted by Regional Target-funded projects.6-4 Affected populations are considered those who live nearby, defined as one-half mile, from project extents. Geographic proximity is an approximation that helps determine who is likely to use and be impacted by a project. For some projects, such as those in the Bicycle Network and Pedestrian Connections and Complete Streets Programs, this measure is a reasonable representation as these projects are often designed and located in such a way to serve local residents. For other projects, such as those in the Major Infrastructure Program, this may be a less accurate representation given that many users of these types of roadways or public transit lines live outside of the half-mile boundary. Some impacts, however, are local regardless of investment program, such as pollution from carbon monoxide and other transportation-related emissions. Despite drawbacks, geographical analyses are a readily available approximation of who may be most served and affected by projects funded by the MPO.
Table 6-2 shows the number of each TE population served or impacted by Regional Target-funded projects and the percentage of the total population served, compared to the regionwide population and percent. For the minority population, low-income population, people with LEP, and people with disabilities, the percent of the population served exceeds the regionwide average, indicating projects are serving these populations at least as well as their non-TE counterparts.
Table 6-2
Transportation Equity Populations Served or Impacted by Regional Target Projects
| Table 6-1 | ||||
| Transportation Equity Populations in the Boston Region | ||||
| TE Population | ||||
| FFYs 2023–27 TIP | FFYs 2024–28 TIP | FFYs 2023–27 TIP | FFYs 2024–28 TIP | |
| Minority population | 1,223,835 | 1,223,835 | 36.5% | 36.5% |
| Low-income population | 674,215 | 673,276 | 20.1% | 20.1% |
| People with LEP | 375,848 | 382,182 | 11.2% | 11.2% |
| People with disabilities | 342,552 | 337,229 | 10.2% | 10.2% |
| Older adult population | 232,286 | 224,306 | 6.9% | 6.9% |
| Youth population | 634,550 | 634,153 | 18.9% | 18.9% |
LEP = limited English proficiency. N/A = not available. TE = transportation equity.
Sources: US Census Bureau and 2015–17 MBTA Systemwide Passenger Survey.
Figure 6-7 shows the percentage of TE populations served or impacted (out of the entire population served or impacted) by Regional Target projects in the last five TIPs.6-5 The results show that for most TE populations the percent of the population served or impacted has continued to be above the regional average, demonstrating MPO-funded projects are equitably investing in transportation for these populations. It also indicates that the MPO is progressing toward its goal of prioritizing investments for these TE populations—minority population, low-income population, older adult population, and people with limited English proficiency. In the future, the MPO could invest in more projects that serve youth and people with disabilities, which would help further meet this goal.
Figure 6-7
Change in the Percentage of Transportation Equity Populations Served or Impacted by Regional Target Projects
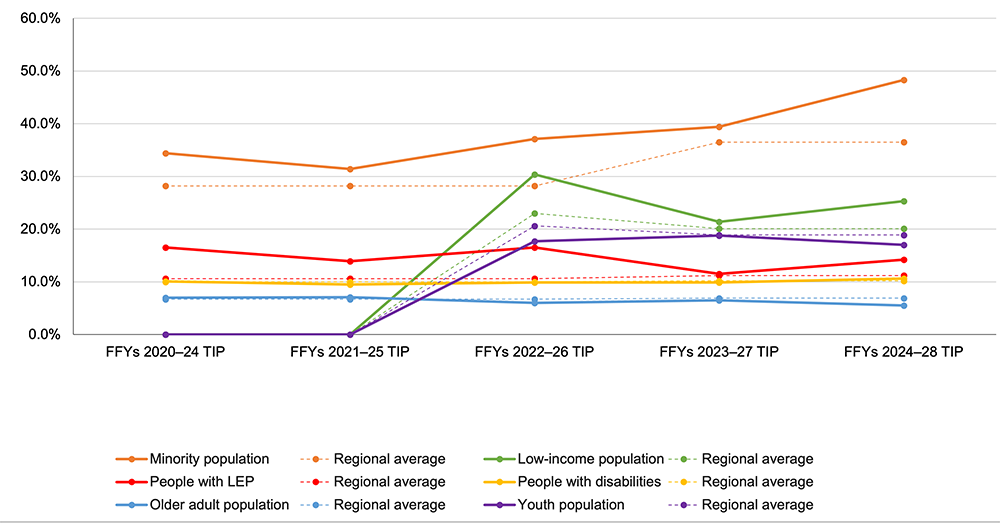
Notes: People age 17 or younger were not considered among the TE population in the MPO’s analyses until the FFYs 2022–26 TIP cycle. Additionally, starting in the FFYs 2022–26 TIP cycle, the low-income population was defined based on poverty status.
FFY = federal fiscal year. LEP = limited English proficiency. TE = transportation equity. TIP = Transportation Improvement Program.
Sources: US Census Bureau and 2015–17 MBTA Systemwide Passenger Survey.
Figure 6-8 shows the percentage of TE populations served or impacted (out of the entire population served or impacted) for each investment program in the FFYs 2024–28 TIP. Some TE populations are likely to benefit from or be impacted by projects in certain investment programs. The results show that the minority and low-income populations are served better by projects in the Transit Modernization, Complete Streets, and Community Connections investment programs, while people with limited English proficiency are best served by projects and Complete Streets and Bicycle and Network and Pedestrian Connections investment programs. By contrast, the youth and older adult populations are far better served by Intersection Improvement projects. For people with disabilities, they are served fairly equally across all investment programs.
Figure 6-8
Percent of Transportation Equity Populations Served or Impacted by Regional Target Projects by Investment Program
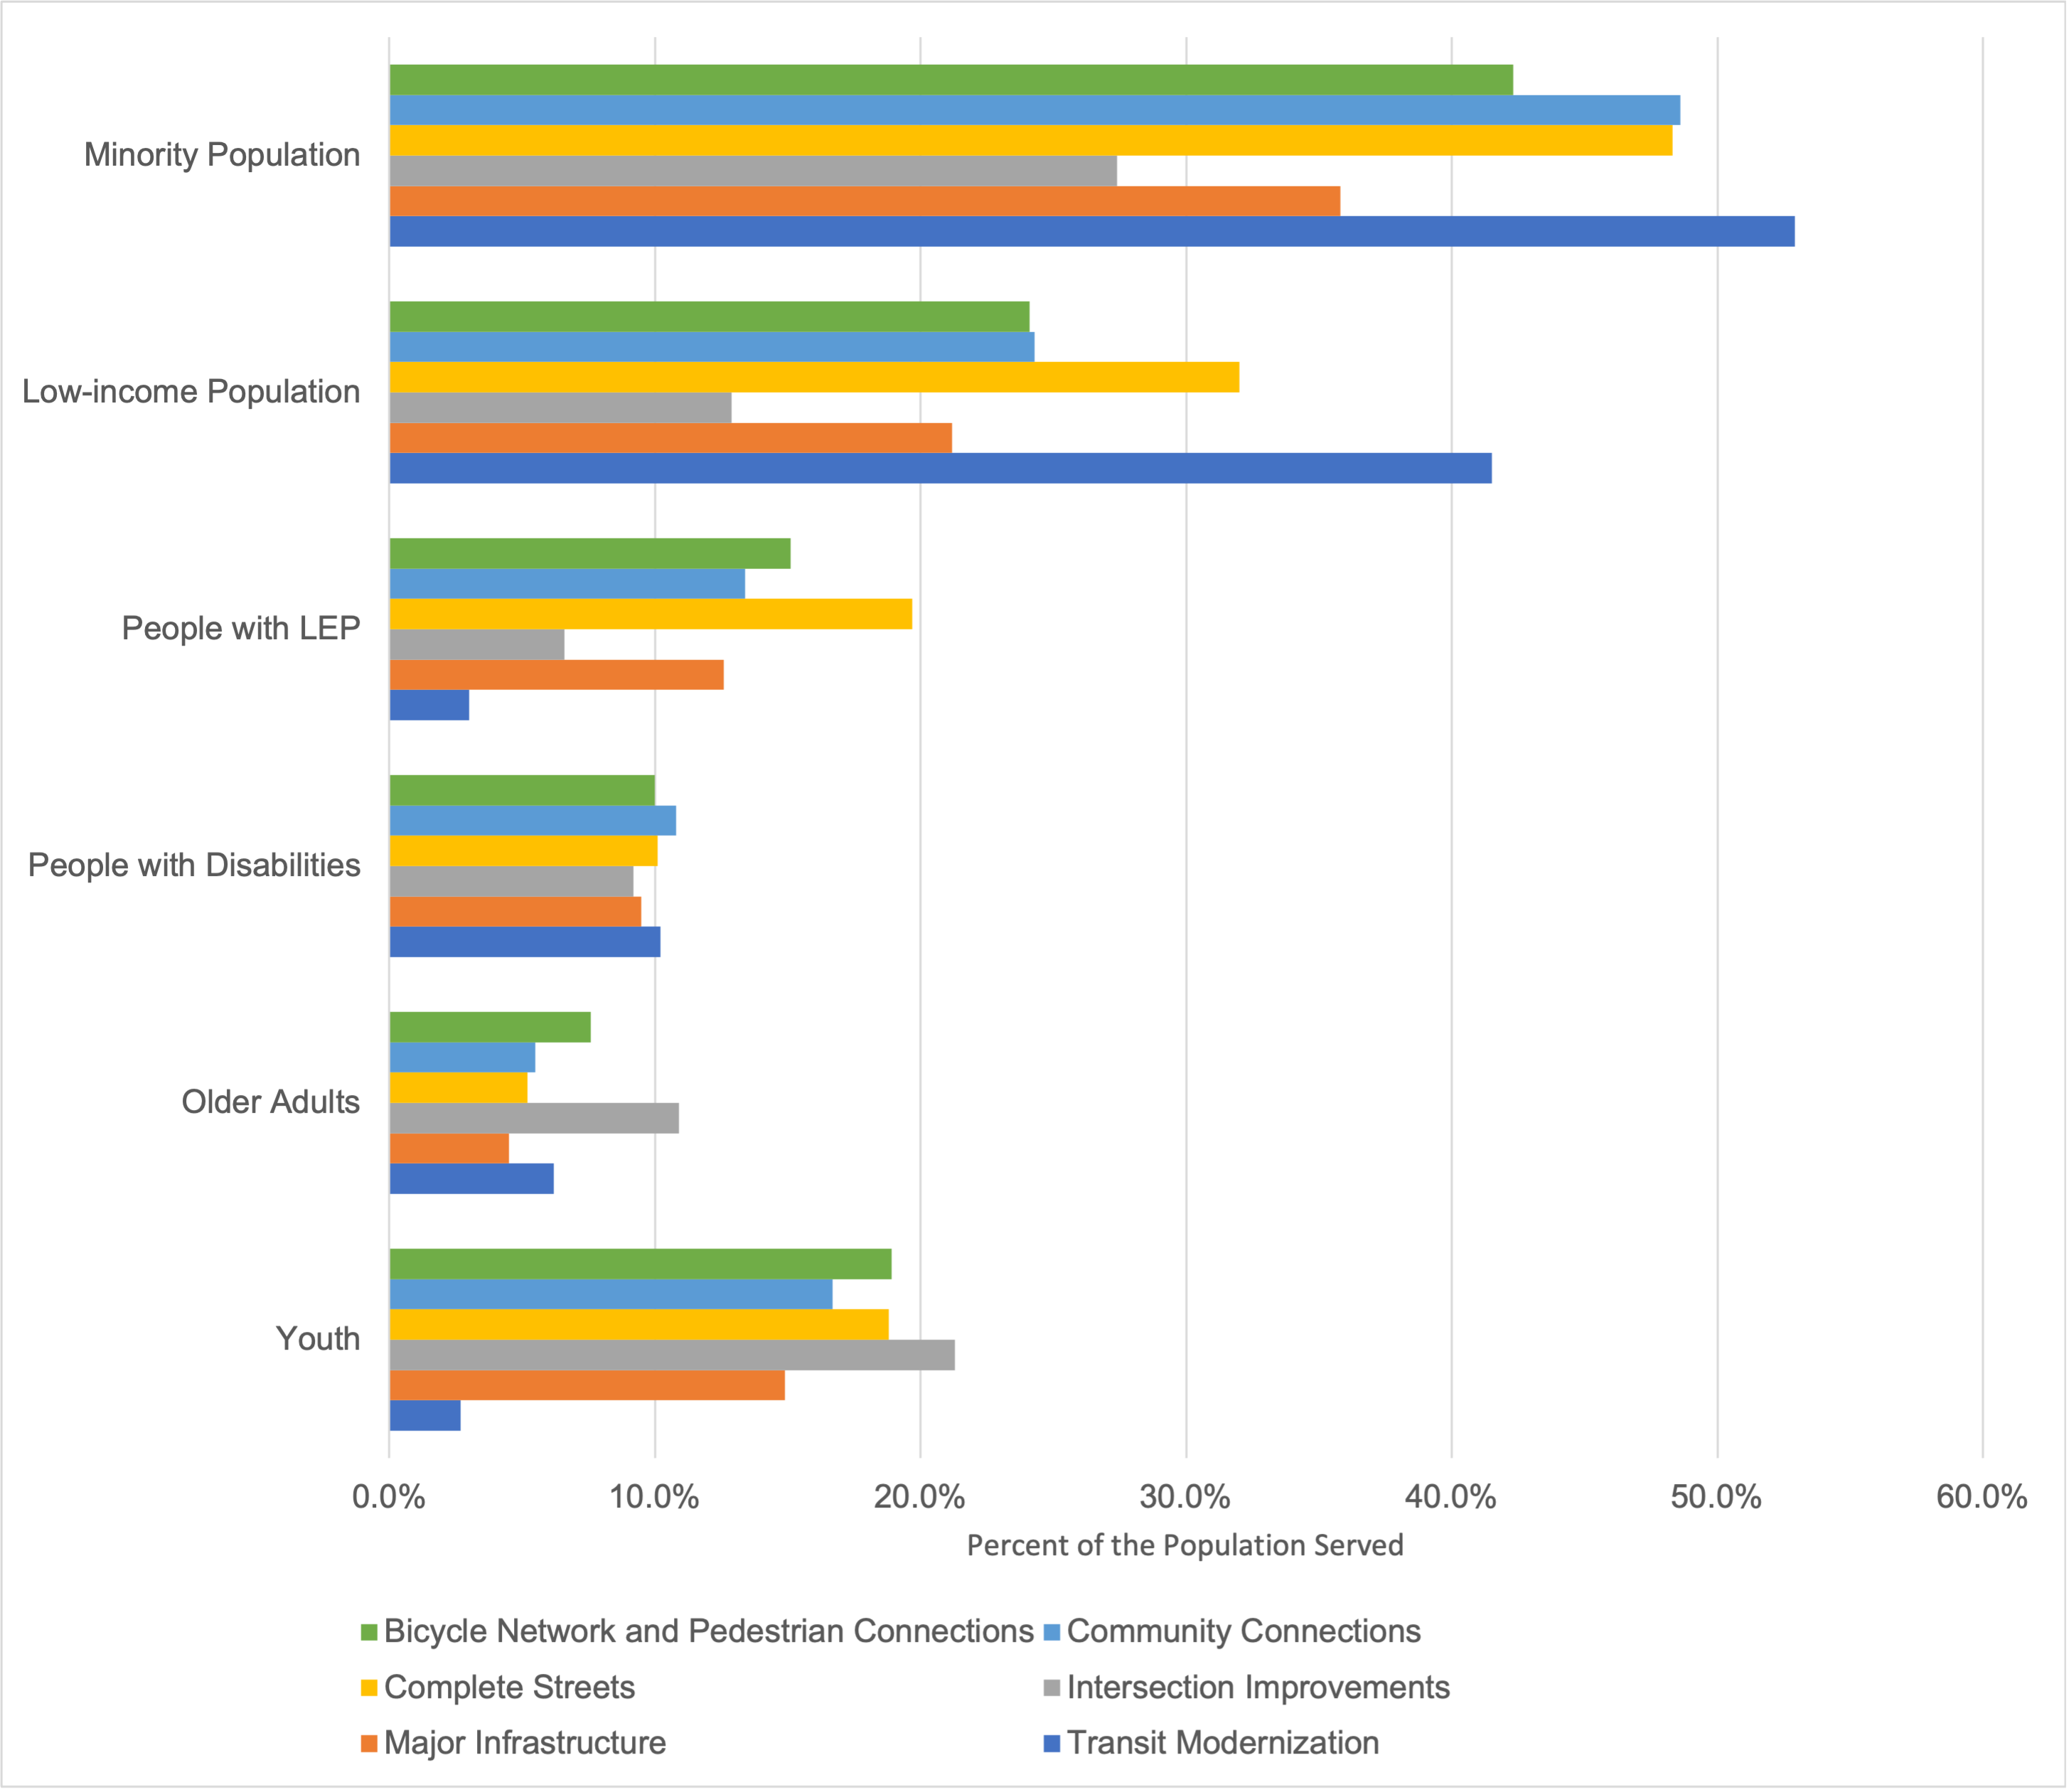
LEP = limited English proficiency.
Sources: US Census Bureau and 2015–17 MBTA Systemwide Passenger Survey.
Figures 6-9a and 6-9b compare the projected emissions reduction that would result from the implementation of Regional Target-funded projects between TE and non-TE populations. 6-6 The charts show the ratio of the emissions reduction between each TE population and the respective non-TE population and are shown for the FFYs 2021–25, 2022–26, 2023–27, and 2024–28 TIPs. Ratios above one indicates that the TE population would receive greater air quality benefits than the non-TE population. Emissions measured for these figures and Table 6-3 include carbon monoxide, volatile organic compounds, and nitrogen oxide.
Figure 6-9a
Reduction in Carbon Monoxide, Volatile Organic Compounds, and Nitrogen Oxide Emissions per 1,000 People
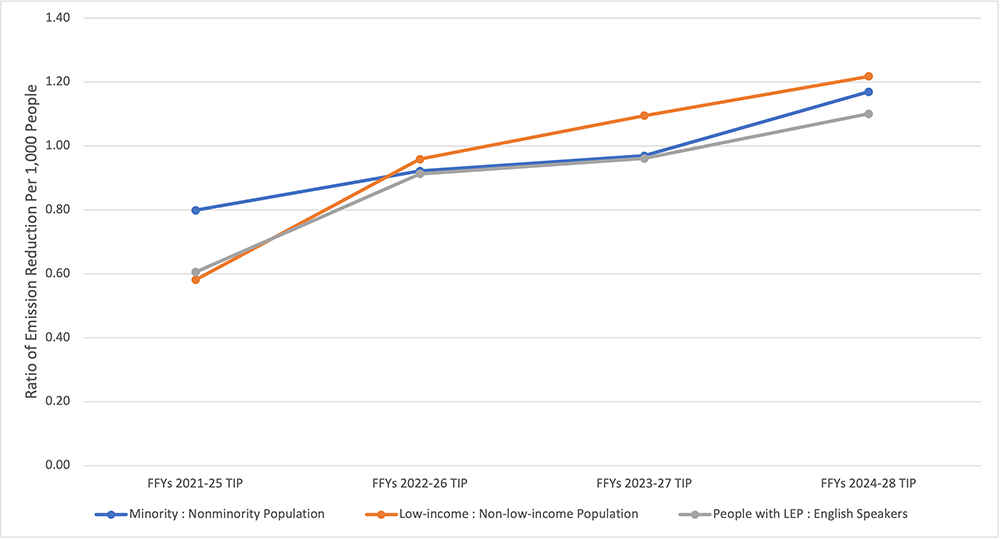
Note: The youth population was not considered a TE population in the FFYs 2021–25 TIP.
FFY = federal fiscal year. LEP = limited English proficiency. TE = transportation equity. TIP = Transportation Improvement Program.
Source: US Census Bureau and Boston Region MPO’s Congestion Mitigation and Air Quality analyses.
Figure 6-9b
Reduction in Carbon Monoxide, Volatile Organic Compounds, and Nitrogen Oxide Emissions per 1,000 People
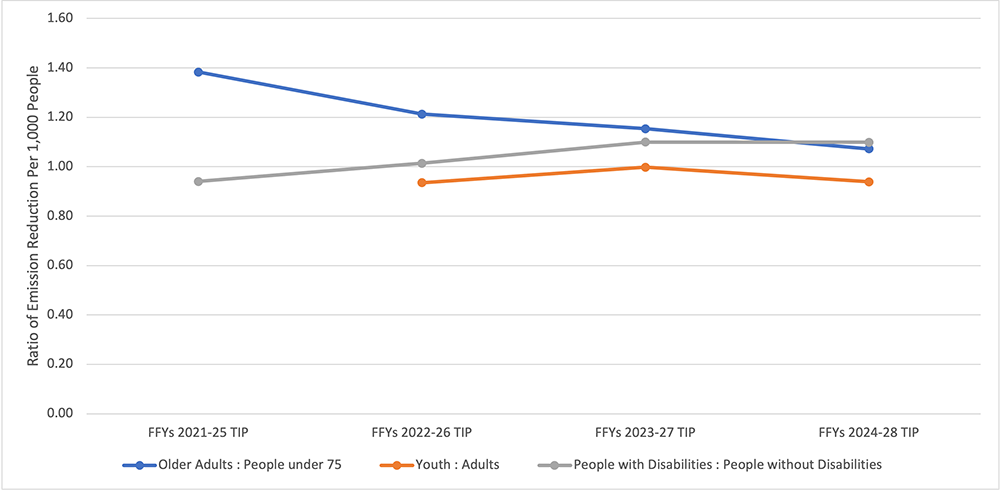
FFY = federal fiscal year. LEP = limited English proficiency. TE = transportation equity. TIP = Transportation Improvement Program.
Source: US Census Bureau and Boston Region MPO’s Congestion Mitigation and Air Quality analyses.
Table 6-3 shows projected emissions reductions for TE and non-TE populations resulting the MPO-funded projects in the TIP. Reductions are reported in kilograms per 1,000 people and are shown for the FFYs 2021–25, 2022–26, 2023–27, and 2024–28 TIPs. The changes shown are for each TIP and are not cumulative across all TIPs.
Table 6-3
Combined Reduction in Carbon Monoxide, Volatile Organic Compounds, and Nitrogen Oxide Emissions per 1,000 People
| Table 6-3 | |||||
| Combined Reduction in Carbon Monoxide, Volatile Organic Compounds, and Nitrogen Oxide Emissions per 1,000 People | |||||
| Population Groups | FFYs 2021-25 TIP | FFYs 2022-26 TIP | FFYs 2023-27 TIP | FFYs 2024-28 TIP | |
| Minority population | -22.8 | -47.6 | -32.2 | -59.2 | |
| Nonminority population | -28.5 | -51.6 | -33.3 | -50.6 | |
| Low-income population | -21.9 | -51.2 | -36.3 | -63.3 | |
| Non-low-income population | -37.7 | -53.4 | -33.1 | -52.0 | |
| People with LEP | -18.0 | -49.1 | -32.3 | -59.2 | |
| People who speak English very well | -29.7 | -53.8 | -33.6 | -53.7 | |
| Older adult population | -36.0 | -60.0 | -37.6 | -56.9 | |
| People under the age of 75 | -26.0 | -49.5 | -32.6 | -53.0 | |
| Youth population | N/A | -47.4 | -32.9 | -50.7 | |
| Adult population | N/A | -50.7 | -32.9 | -54.0 | |
| People with disabilities | -25.5 | -51.2 | -35.9 | -58.1 | |
| People without disabilities | -27.1 | -50.5 | -32.6 | -52.9 | |
FFY = federal fiscal year. LEP = limited English proficiency. N/A = not applicable. TIP = Transportation Improvement Program.
Source: US Census Bureau and Boston Region MPO’s Congestion Mitigation and Air Quality analyses.
The results of the analyses reported in this section show how Regional Target funds are distributed to projects serving TE populations based on the percentage of the population served by the Regional Target-funded projects. The MPO has programmed approximately $6.7 million in Regional Target funding in the FFYs 2024–28 TIP, approximately $5.6 million of which are included in this analysis. 6-7 Like the geographical analyses shown above, this funding distribution analysis assumes that funds allocated to projects near TE populations indicate a benefit.
Table 6-4 shows the percent of funding allocated in the FFYs 2024–28 TIP to Regional Target projects, in the aggregate, that are expected to serve or impact TE populations compared to the share of each TE population within the Boston region. The results show that the percentage of funding allocated is approximately equal to the share of the population in the region for all TE populations, indicating an equitable distribution of funding.
Table 6-4
Percent of Funding Allocated to Transportation Equity Populations
| Table 6-4 | ||
| Percent of Funding Allocated to Transportation Equity Populations | ||
| TE Population | Percentage of Funding Allocated | Percentage of Regionwide Population |
| Minority population | 35.0% | 36.5% |
| Low-income population | 20.7% | 20.1% |
| People with LEP | 11.8% | 11.2% |
| People with disabilities | 10.6% | 10.2% |
| Older adult population | 7.7% | 6.9% |
| Youth population | 18.6% | 18.9% |
LEP = limited English proficiency. TE = transportation equity. TIP = Transportation Improvement Program.
Sources: US Census Bureau, 2015–17 MBTA Systemwide Passenger Survey, and Boston Region MPO.
Figure 6-10 shows the percentage of funding allocated in the last five TIPs to Regional Target projects that are expected to serve or impact TE populations. These data are shown relative to each TE population’s share of their population in the Boston region. The results show that the percent of funding for the minority populations continues to be less than its respective regionwide percentages, although it has improved over the previous year’s TIP. The percent of funding allocated to the other TE populations continues to be approximately equal to their respective regionwide percentages.
Figure 6-10
Change in the Percentage of Funding Allocated to Transportation Equity Populations
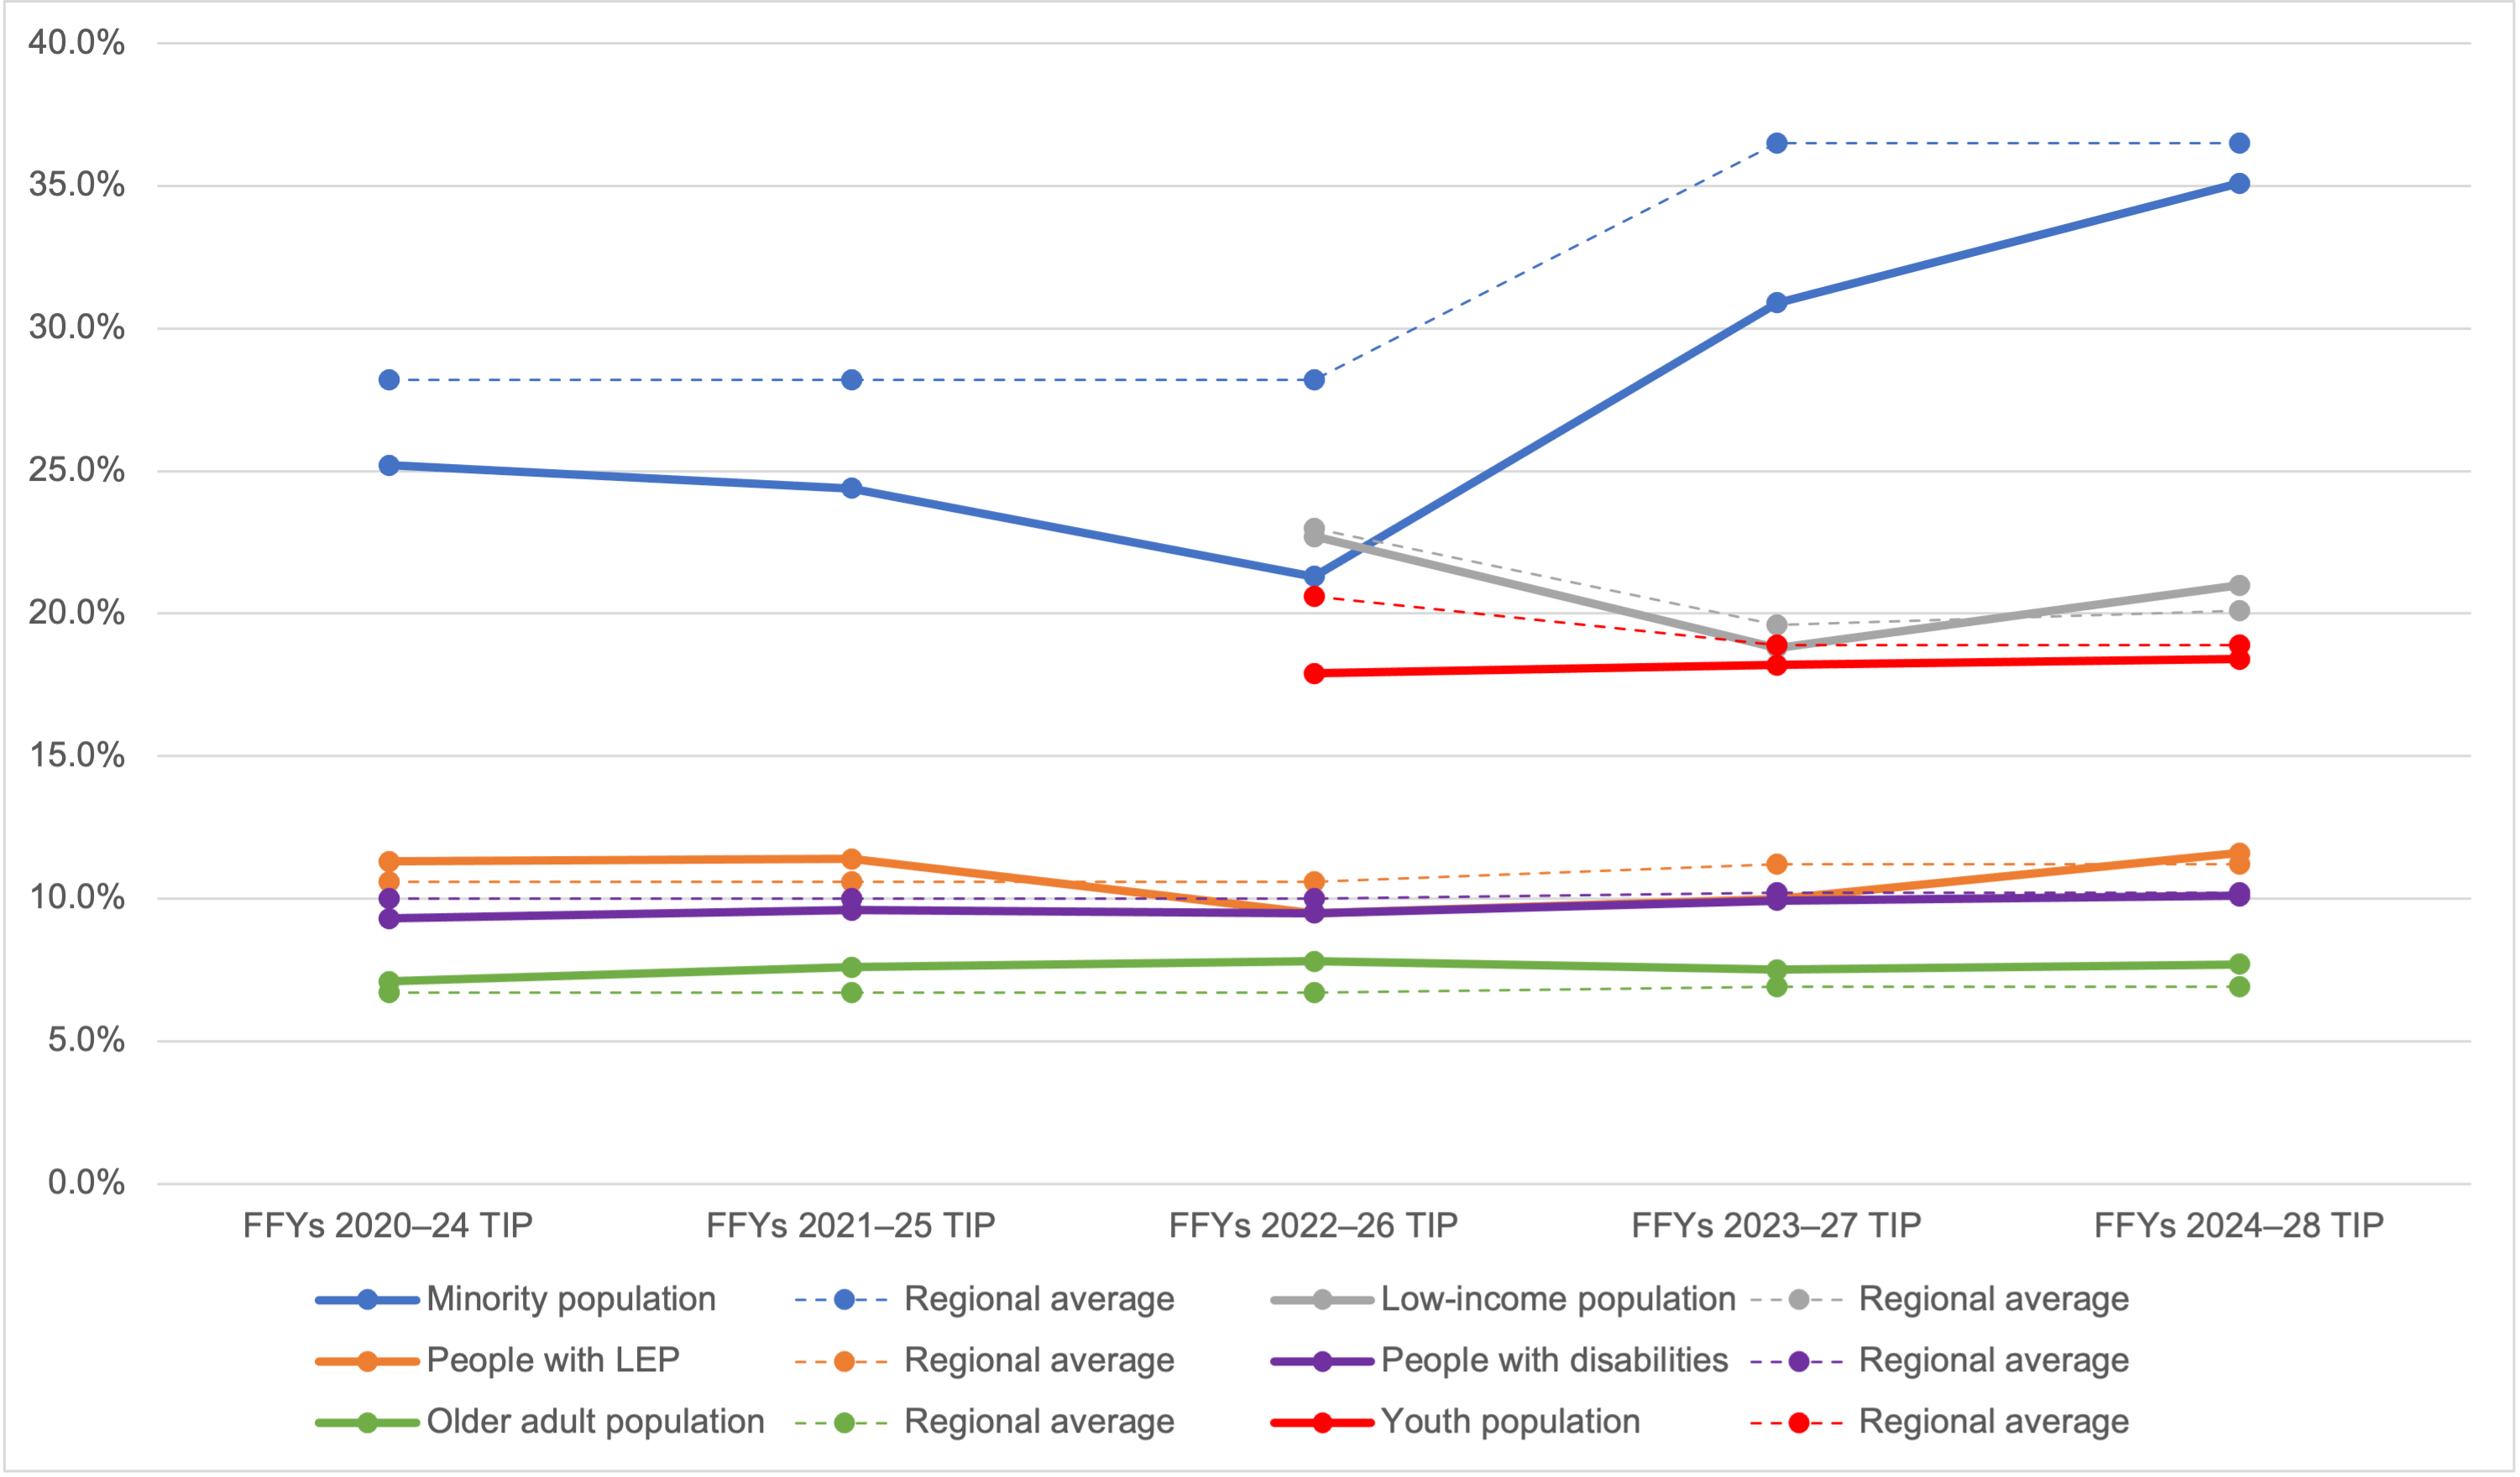
Notes: People age 17 or younger were not considered as a TE population in the MPO’s analyses until the FFYs 2022–26 TIP cycle. Additionally, starting in the FFYs 2022–26 TIP cycle, the low-income population was defined based on poverty status.
FFY = federal fiscal year. LEP = limited English proficiency. TE = transportation equity. TIP = Transportation Improvement Program.
Sources: US Census Bureau, 2015–17 MBTA Systemwide Passenger Survey, and Boston Region MPO.
The MPO will continue to explore more sophisticated methods of identifying specific impacts of projects funded with Regional Target dollars and evaluating, as a group, their benefits and burdens on TE populations. MPO staff has developed a similar analysis for the MPO’s LRTP and will continue to use it to inform updates and refinements to the equity analyses in the TIP. The MPO has completed several studies that will inform the development of these metrics, including Identifying Transportation Inequities in the Boston Region. Analyses developed for the Needs Assessment of the new LRTP, Destination 2050, will also be informative. MPO staff will explore ways to expand these metrics and apply them to equity analyses for other aspects of the MPO’s work.
6-1 Regional Target funds are those federal funds provided to MPOs that are programmed for projects at the discretion of each MPO. The Boston Region MPO has about $700 million in target funding the FFYs 2024–28 TIP.
6-2 TE populations are identified using census data and are defined as follows:
6-3 The following sources for the TE populations were used for the analyses:
FFYs 2022–26 TIP and earlier:
FFYs 2023–27 TIP:
FFYs 2024–28 TIP:
6-4 The analyses of the populations served or impacted include the following projects:
6-5 Starting in the FFYs 2022–26 TIP, the methodology for determining the population within a half mile of projects was updated. A half mile is now measured along the roadway network (excluding limited access highways) rather than as-the-crow-flies, as was done in previous TIPs.
6-6 The air quality analyses in this section include in the following projects, as their air quality impacts were assessed to be minimal or unable to be determined:
6-7 The funding distribution analyses in this section include the following projects: