What is the Vision Zero Action Plan?
Safe Streets and Roads for All (SS4A)
Relation to Other Safety Plans
Key Crash Trends and Emphasis Areas
4. High-Injury and High-Risk Networks
5. Public and Stakeholder Engagement
6. Vision Zero Actions, Policies, and Best Practices
Proven Safety Countermeasures and Best Practices
Boston Region MPO’s Role in Improving Transportation Safety
Appendix A: Terms and Acronyms
Appendix B: Existing Condition Data Analysis
Appendix C: High-Injury Network Methodology
Appendix D: High-Risk (Systemic) Network Methodology
Appendix E: Top Municipal Crash Data Profiles
Appendix F: Stakeholder Engagement Approach and Findings
Appendix G: Policy and Process Research and Findings
Table1 | Relation to Other Strategic Safety Plans
Table 2: Top 10 Municipalities by Fatal and Serious Injury Crash Number (2018–22)
Table 3: Top 10 Municipalities by Fatal and Serious Injury Crash Rate (2018–22)
Table 5 | Crash Scores by Severity
Table 6 | High-Scoring Locations in the ICC Subregion
Table 7 | High-Scoring Locations in the MAGIC Subregion
Table 8 | High-Scoring Locations in the MetroWest Subregion
Table 9 | High-Scoring Locations in the NSPC Subregion
Table 10 | High-Scoring Locations in the NSTF Subregion
Table 11 | High-Scoring Locations in the SSC Subregion
Table 12 | High-Scoring Locations in the SWAP Subregion
Table 13 | High-Scoring Locations in the TRIC Subregion
Table 14 | Vision Zero Task Force Members
Table 15 | Vision Zero Action Plan Engagement Activities
Table 16 | Vision Zero Action Plan Performance Metrics: Fatal and Serious Injury Crashes
Table 17 | Vision Zero Action Plan Performance Metrics: Crash Emphasis Areas
Figure 1: Fatalities and Serious Injuries in the Boston Region
Figure 2 | Safe System Approach Principles and Elements
Figure 3 | Vision Zero Action Plan Development Process
Figure 5 | Total Fatal and Serious Injury Crashes in the Boston Region by Mode, 2018–22
Figure 6 | All Fatal and Serious Injury Crashes in the Boston Region by Roadway Type, 2018–22
Figure 7 | All Fatal and Serious Injury Crashes in the Boston Region by Road Ownership, 2018–22
Figure 8 | Fatal and Serious Injury Crashes by Collision Type, 2018–22
Figure 9 | Proportion of Fatal and Serious Injury Crashes Happening at Night
Figure 10 | Regional High-Injury Network
Figure 11 | Communities of Concern
Figure 12 | Prioritized Regional High-Injury Network
Figure 13 | Prioritized Regional High-Injury Network in the ICC Subregion
Figure 14 | Prioritized Regional High-Injury Network in the MAGIC Subregion
Figure 15 | Prioritized Regional High-Injury Network in the MetroWest Subregion
Figure 16 | Prioritized Regional High-Injury Network in the NSPC Subregion
Figure 17 | Prioritized Regional High-Injury Network in the NSTF Subregion
Figure 18 | Prioritized Regional High-Injury Network in the SSC Subregion
Figure 19 | Prioritized Regional High-Injury Network in the SWAP Subregion
Figure 20 | Prioritized Regional High-Injury Network in the TRIC Subregion
Figure 21 | High-Risk Network Example—Roadway Departure Crashes
Draft June 26, 2025
Final March 5, 2026
This plan was funded in part through grants from the U.S. Department of Transportation (U.S. DOT). Its contents do not necessarily reflect the official views or policies of the U.S. DOT.
About the Boston MPO
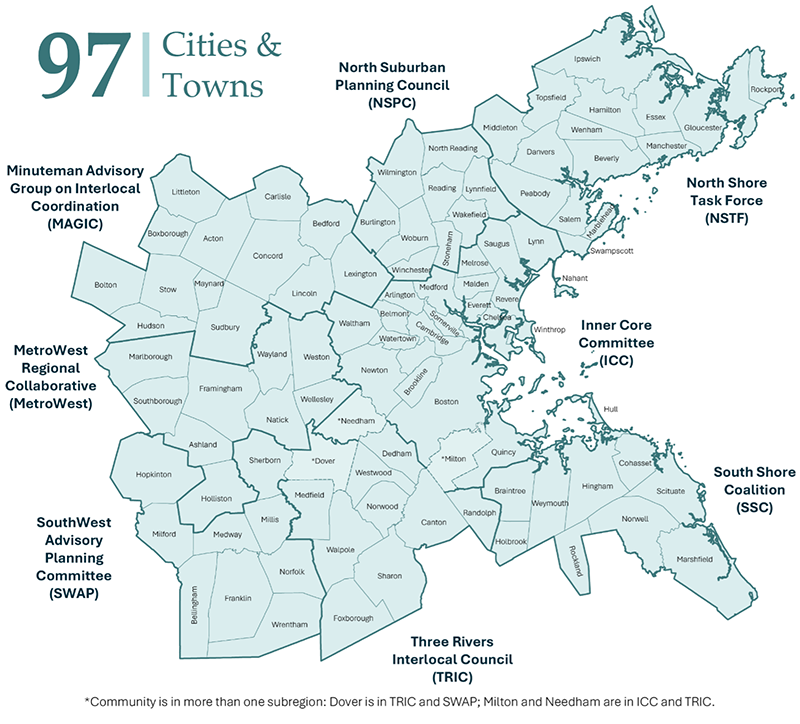
The Boston Region Metropolitan Planning Organization (MPO) is responsible for conducting the federally required metropolitan transportation planning process for the Boston metropolitan area. The MPO encompasses 97 cities and towns, covering approximately 1,360 square miles and stretching from Boston to Ipswich in the north, Marshfield in the south, and to approximately Interstate 495 in the west. Cooperatively selecting transportation programs and projects for funding is a role of the MPO’s 23 voting members, which include state agencies, regional entities, and municipalities. The work of the MPO is performed by the Central Transportation Planning Staff under the direction of the MPO board. The MPO is composed of the following members:
Permanent Members
Elected Members
Nonvoting Members
Acknowledgements
The development of the Boston Region Vision Zero Action Plan is the result of the hard work and expertise of many people. MPO staff recognizes and thanks the following contributors:
MPO Staff
Boston Region Vision Zero Task Force
Massachusetts Department of Transportation
Federal Highway Administration
Consultant Team
Notice of Nondiscrimination Rights and Protections
The Boston Region Metropolitan Planning Organization (MPO) operates its programs, services, and activities in compliance with federal nondiscrimination laws including Title VI of the Civil Rights Act of 1964 (Title VI), the Civil Rights Restoration Act of 1987, and related statutes and regulations. Title VI prohibits discrimination in federally assisted programs and requires that no person in the United States of America shall, on the grounds of race, color, or national origin (including limited English proficiency), be excluded from participation in, denied the benefits of, or be otherwise subjected to discrimination under any program or activity that receives federal assistance. Related federal nondiscrimination laws administered by the Federal Highway Administration, Federal Transit Administration, or both, prohibit discrimination on the basis of age, sex, and disability. The Boston Region MPO considers these protected populations in its Title VI Programs, consistent with federal interpretation and administration.
The Boston Region MPO also complies with the Massachusetts Public Accommodation Law, M.G.L. c 272 sections 92a, 98, 98a, which prohibits making any distinction, discrimination, or restriction in admission to, or treatment in a place of public accommodation based on race, color, religious creed, national origin, sex, sexual orientation, disability, or ancestry. Likewise, the Boston Region MPO complies with the Governor’s Executive Order 526, section 4, which requires that all programs, activities, and services provided, performed, licensed, chartered, funded, regulated, or contracted for by the state shall be conducted without unlawful discrimination based on race, color, age, gender, ethnicity, sexual orientation, gender identity or expression, religion, creed, ancestry, national origin, disability, veteran’s status (including Vietnam-era veterans), or background.
A complaint form and additional information can be obtained by contacting the MPO or at http://www.bostonmpo.org/mpo_non_discrimination. To request this information in a different language or in an accessible format, please contact:
TITLE VI SPECIALIST
Boston Region MPO 10 Park Plaza, Suite 2150 Boston, MA 02116
|
BY TELEPHONE: 857.702.3700 (voice)
For people with hearing or speaking difficulties, connect through the state MassRelay service:
Relay Using TTY or Hearing Carry-over: 800.439.2370 Relay Using Voice Carry-over: 866.887.6619 Relay Using Text to Speech: 866.645.9870
For more information, including numbers for Spanish speakers, visit https://www.mass.gov/massrelay
|
In 2024, nearly 40,000 people were killed in traffic crashes in the United States and hundreds of thousands more were seriously injured. This national roadway safety problem affects us in the Boston region where traffic crashes kill or seriously injure more than 1,000 people per year.
Figure 1: Fatalities and Serious Injuries in the Boston Region
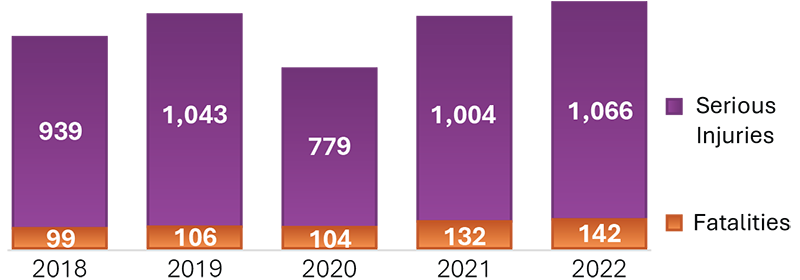
Source: Massachusetts Department of Transportation, IMPACT Crash Data Portal
The Boston Region Metropolitan Planning Organization (MPO) believes that even one death on our roads is too many. That is why we are committed to Vision Zero. Vision Zero is an approach to roadway safety based on the assumption that serious traffic crashes are preventable. Together, we can change how we design, operate, and maintain our streets in order to make the region safe for all road users—people who walk, roll, bike, ride transit, and drive.
The MPO’s Long Range Transportation Plan (LRTP), Destination 2050, set goals to achieve zero transportation-related fatalities and serious injuries and improve safety for all users of the transportation system:
The Boston Region Vision Zero Action Plan reflects the MPO’s commitment to saving lives. This Action Plan builds on transportation planning and safety initiatives already undertaken in the region. This effort will help the MPO and its 97 municipalities navigate the future of roadway safety and communicate clearly with residents about how we can implement roadway safety improvements necessary to save lives.
The traditional approach to roadway safety views traffic deaths and serious injuries as “inevitable side effects of modern life” and refers to these serious crashes as “accidents” (Vision Zero Network). The Vision Zero approach recognizes that serious crashes are not accidents and we can take action to prevent them by proactively prioritizing traffic safety in the way we design our streets and in the policies we enact.
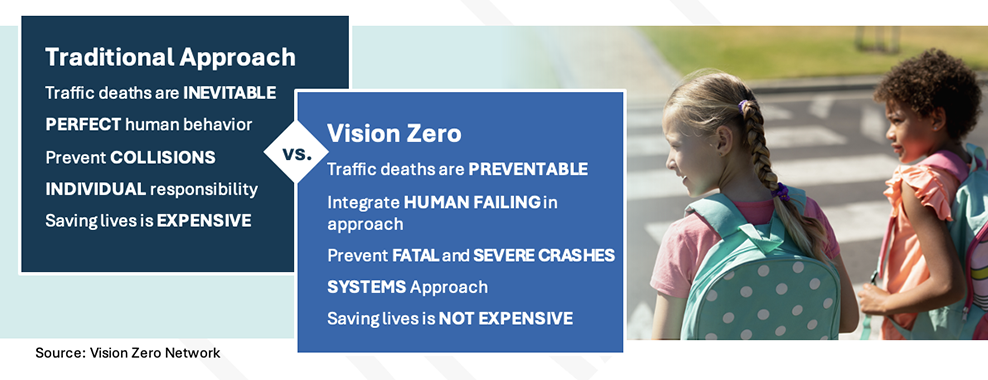
Vision Zero recognizes that people make mistakes and that no one should die or be seriously injured because of a mistake they make while travelling on our roads.
Vision Zero calls on us to work together, across disciplines, to improve roadway safety. Elected officials, policymakers, engineers, planners, first responders, public health professionals, and others all have a part to play. There are many complex factors that contribute to roadway safety and safe mobility, including street design, vehicle speeds, roadway user behaviors, and vehicle technology. We can design roads, update policies, and implement new programs to lessen the severity of crashes. Reaching zero fatalities and serious injuries requires us to set goals and work on actions to implement change in all of these areas.
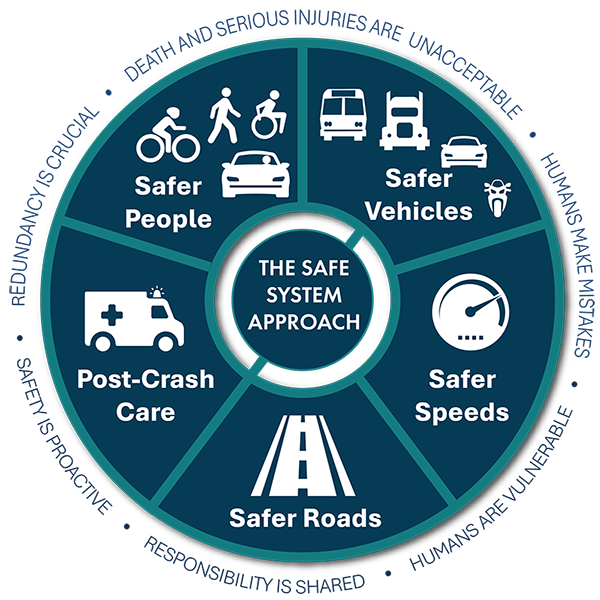
While Vision Zero establishes the goal of zero deaths and serious injuries on our streets, the Safe System Approach, illustrated in Figure 2, provides a more detailed framework for reaching that goal. The Safe System Approach aims to address and mitigate the risks inherent in the transportation system by building and reinforcing multiple layers of protection to both prevent crashes from happening in the first place and minimize the harm caused to those involved when crashes do occur.
This holistic and comprehensive strategy focuses both on human mistakes and vulnerability and promotes a system designed with many redundancies in place to protect all road users. The Safe System Approach also embraces all types of roadway safety countermeasures and acknowledges that a multidisciplinary approach is required to address the full range of possible safety risks. Figure 2 shows how the five Safe System elements—safe road users, safe vehicles, safe speeds, safe roads, and post-crash care—work together to create shared responsibility for the safety of all road users.
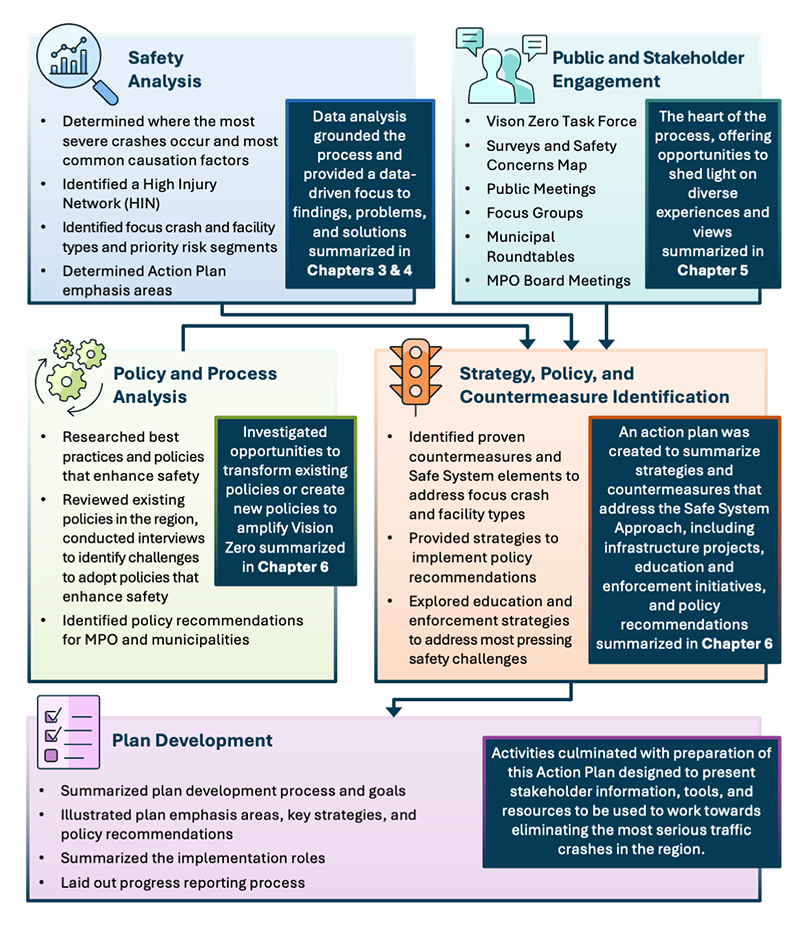
The multistep process used by the Boston Region MPO to develop this Action Plan is shown in Figure 3.
Figure 3 | Vision Zero Action Plan Development Process
Several other transportation and safety plans were referenced during the creation of this Vision Zero Action Plan, as noted in Table 1.
Table1 | Relation to Other Strategic Safety Plans
Resource |
|
This Action Plan will address safety needs documented in the Boston Region MPO’s Long-Range Transportation Plan (LRTP). The LRTP also sets a goal of achieving zero crash fatalities in the region by 2050. |
|
This Action Plan is aligned with the Metropolitan Area Planning Council’s 2021 regional land use and policy plan, which sets the goals of having safe transportation and healthy and safe neighborhoods. |
|
This Action Plan suggests priority corridors that could develop into projects funded through the MPO’s capital plan. |
|
This Action Plan aligns with the needs and actions identified in Massachusetts’ 2050 Transportation Plan. |
|
This Action Plan’s safety analysis, emphasis areas, and proposed strategies and countermeasures are consistent with the goals of MassDOT’s SHSP. Actions in the plan incorporate actions in the SHSP assigned to MPOs and regional planning agencies. |
|
This Action Plan lists many infrastructure safety projects that may be eligible for support from MassDOT’s HSIP. |
|
Vision Zero Plans and Safety Studies by the region’s cities and towns |
Several municipalities that are MPO members have developed their own Vision Zero Plans, which were consulted for the development of this Action Plan. This Action Plan provides additional projects and countermeasures that these cities and towns can adopt:
Other municipalities are in the process of developing plans or demonstration projects, including Chelsea, Needham, Peabody, Qunicy, and Watertown. Additional municipalities applied for SS4A funding during the FY 2025 application round, including Marblehead, Newton, and Malden. The MPO will continue to coordinate closely with all municipalities to incorporate local priorities and support municipalities in making the changes necessary to reach Vision Zero. |
An in-depth safety analysis, provided in Appendix B, forms a critical foundation for this Vision Zero Action Plan. This analysis identified where and why crashes are occurring across the Boston region, helped the MPO to assess current safety performance, supported data-driven decision-making by stakeholders and the Vision Zero Task Force, and guided the development of targeted safety strategies.
To better understand current crash patterns and the contributing factors associated with the most common and overrepresented crash types, the most recent five-year crash data (2018–22) were analyzed to help identify key factors that may contribute to future crashes.0F1
Data Sources
1. Historical data (1980–2022) from the U.S. DOT Fatality Analysis Reporting System (FARS)
2. Most recent five years (2018–2022) of available data from the MassDOT Open Data Portal and the MassDOT IMPACT tool
Nearly 1,000 people are killed or seriously injured in crashes in the Boston region every year. For development of the Action Plan, the MPO focused on crashes that occur on state- and municipal-owned roads, excluding crashes along interstates, expressways, and other fully access-controlled roadways. This approach allows us to focus actions on interventions that can lower driving speeds and make travel by vulnerable road users safer. Figure 4 shows the fatalities and serious injuries from 2018–22 excluding crashes on access-controlled roads. The remainder of the analysis in the action plan is focused on this same subset of roadways.
Figure 4 | Fatalities and Serious Injuries in the Boston Region, excluding Interstates and Access-Controlled Roadways
Source: Massachusetts Department of Transportation, IMPACT Crash Data Portal.
In addition to the number of serious crashes and the people impacted by crashes, it’s important to consider the modes most involved in fatal and serious crashes. Figure 5shows the breakdown of these crashes by mode from 2018 through 2022. Bicyclists, pedestrians, and motorcyclists are at significantly higher risk for serious injury or death when involved in crashes with motor vehicles.
Figure 5 | Total Fatal and Serious Injury Crashes in the Boston Region by Mode, 2018–22
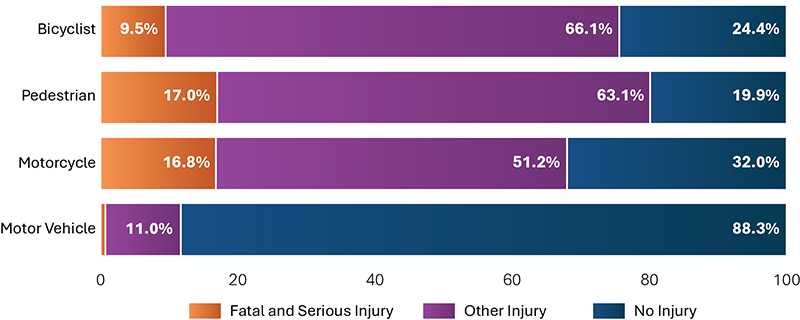
Source: Massachusetts Department of Transportation, IMPACT Crash Data Portal.
Crashes result in significant costs. These costs are borne not just by victims and survivors but by our entire community in the form of insurance premiums, taxes, congestion-related costs, and workplace losses. From 2018 through 2022 in the Boston region alone, crashes incurred an estimated total cost of $26.5 billion, averaging $5.3 billion per year. Of that total, $12.2 billion (or 46 percent) came from fatal and serious injury crashes.
As part of our crash analysis, we identified the top 10 municipalities with the highest crash numbers and the highest crash rates in the region.2 These data only reflect crashes on non-access controlled roadways.
Table 2: Top 10 Municipalities by Fatal and Serious Injury Crash Number (2018–22)
Municipality |
Fatal and Serious Injury Crashes |
Percent of Total |
Percent Change (2018–22) |
FSI Crash Rate per 100,000 Residents |
Boston1 |
320 |
8.0% |
-58.3% |
47 |
Lynn |
237 |
5.9% |
-39.7% |
234 |
Quincy |
155 |
3.9% |
-9.1% |
153 |
Cambridge |
129 |
3.2% |
-22.6% |
109 |
Newton |
115 |
2.9% |
33.3% |
129 |
Revere |
92 |
2.3% |
38.9% |
148 |
Malden |
87 |
2.2% |
50.0% |
131 |
Chelsea |
83 |
2.1% |
91.7% |
204 |
Framingham |
83 |
2.1% |
73.3% |
115 |
Weymouth |
79 |
2.0% |
90.0% |
138 |
1 Due to crash reporting issues, the total number of crashes and fatal and serious injury crashes for the City of Boston are under-reported to the Registry of Motor Vehicles (RMV). The true crash rates in the City are estimated to be higher than shown in this table.
FSI = fatal and serious injury.
Source: Massachusetts Department of Transportation, IMPACT Crash Data Portal, 2020 population estimates from the US Census Bureau.
Table 3: Top 10 Municipalities by Fatal and Serious Injury Crash Rate (2018–22)
Municipality |
Fatal and Serious Injury Crashes |
Percent of Total |
Percent Change (2018–22) |
FSI Crash Rate per 100,000 Residents |
Sherborn |
19 |
0.5% |
200.0% |
431 |
Wrentham |
44 |
1.1% |
55.6% |
361 |
Dover |
16 |
0.4% |
-33.3% |
270 |
Millis |
21 |
0.5% |
50.0% |
248 |
Middleton |
24 |
0.6% |
33.3% |
245 |
Lynn |
237 |
5.9% |
-39.7% |
234 |
Rockland |
38 |
1.0% |
-11.1% |
213 |
Topsfield |
14 |
0.4% |
33.3% |
213 |
Saugus |
61 |
1.5% |
-38.5% |
213 |
Chelsea |
83 |
2.1% |
91.7% |
203 |
FSI = fatal and serious injury.
Source: Massachusetts Department of Transportation, IMPACT Crash Data Portal, 2020 population estimates from the US Census Bureau.
In addition to understanding which municipalities have the most serious crashes, crash data can also tell us what type of streets have the most serious crashes. Figure 6 shows that principle and minor arterials have the highest proportion of fatal and serious injury crashes in the Boston region. Crashes involving people walking, rolling, and bicycling are also more prevalent on principal and minor arterials—where fast vehicles and nonmotorized traffic mix, often in a dangerous way.
Most roads in the Boston region are managed, or owned, by either a municipality, the Massachusetts Department of Transportation (MassDOT), or the Department of Conservation and Recreation (DCR) . Figure 7 shows that most fatal and serious injuries occur on locally owned roads. This suggests a significant proportion of improvements to advance safety are actionable by municipalities in the region.
Figure 6 | All Fatal and Serious Injury Crashes in the Boston Region by Roadway Type, 2018–22
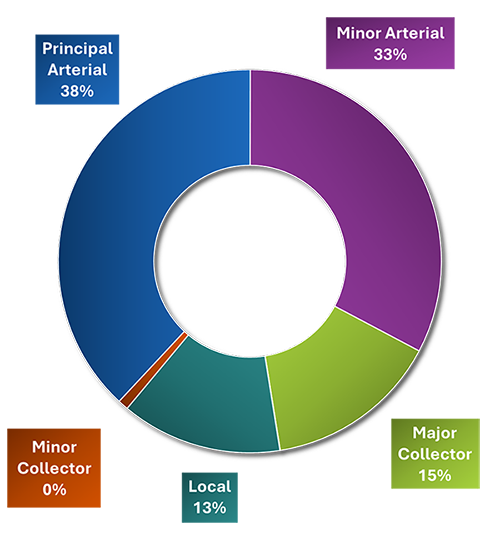
Figure 7 | All Fatal and Serious Injury Crashes in the Boston Region by Road Ownership, 2018–22
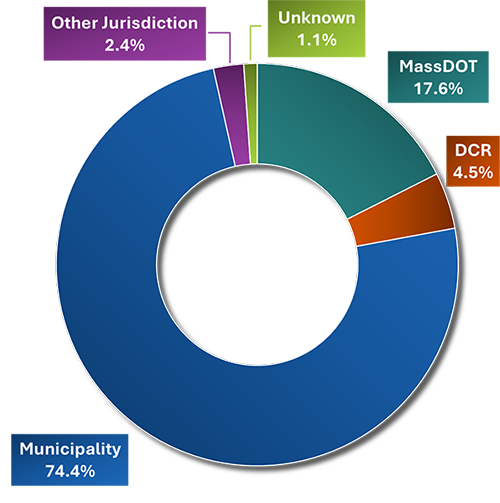
Source: Massachusetts Department of Transportation, IMPACT Crash Data Portal.
Figure 8 illustrates that nearly 60 percent fatal and serious injury crashes involved two or more vehicles and approximately 40 percent were single-vehicle crashes. Among single-vehicle crashes resulting in a fatality or serious injury, the most common first harmful events were collisions with pedestrians (35 percent of single-vehicle crashes).
Figure 8 | Fatal and Serious Injury Crashes by Collision Type, 2018–22
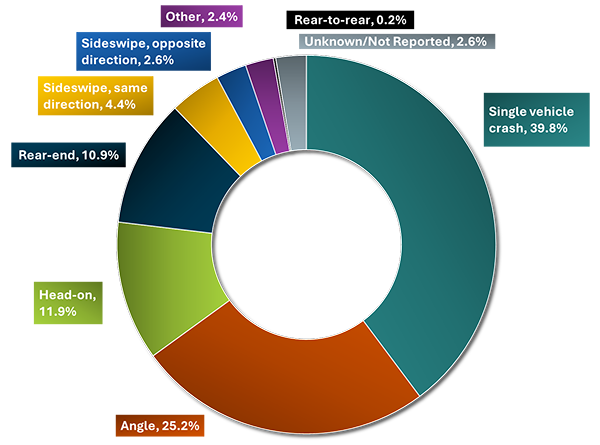
Source: Massachusetts Department of Transportation, IMPACT Crash Data Portal.
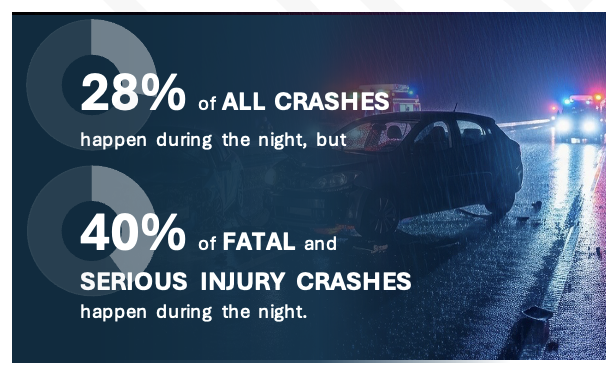
The data also show that crashes that happen at night are disproportionately more likely to result in fatalities or serious injuries, often due to increased impaired driving and speeding.
Figure 9 | Proportion of Fatal and Serious Injury Crashes Happening at Night
To further determine the major crash types this Action Plan should focus on, the MPO examined emphasis areas (also called contributing crash factors) for the Commonwealth identified in the Massachusetts Highway Safety Improvement Program (HSIP), which offer a helpful framework for identifying common crash issues, analyzing contributing factors, and linking them with a set of targeted countermeasures and strategies.1F3
Table 4, provides the number of fatal and serious injury crashes in the Boston region and Massachusetts according to emphasis area and the percentage of change between 2018 and 2022. Data in this table do not include crashes along interstates, expressways, other fully access-controlled roadways, or ramps.
Table 4 | Emphasis Areas
| Massachusetts HSIP Emphasis Area |
Boston Region |
Massachusetts |
|||
|---|---|---|---|---|---|
| Number of Fatal and Serious Injury Crashes |
Percent of Total Fatal and Serious Injury Crashes |
Percent Change from 2018 to 2022 |
Percent of Total Fatal and Serious Injury Crashes |
Percent Change from 2018 to 2022 |
|
Intersections |
1,756 |
44.1% |
7.0% |
39.7% |
15.6% |
Lane Departure |
842 |
21.1% |
42.8% |
25.9% |
37.7% |
Older Drivers |
837 |
21.0% |
23.5% |
20.0% |
18.5% |
Pedestrians |
781 |
19.6% |
-3.9% |
14.9% |
11.0% |
Younger Drivers |
449 |
11.3% |
53.7% |
12.7% |
52.2% |
Motorcyclists |
424 |
10.6% |
62.9% |
14.5% |
58.6% |
Distracted Driving |
314 |
7.9% |
36.5% |
8.9% |
23.4% |
Bicyclists |
300 |
7.5% |
92.3% |
5.1% |
60.9% |
Impaired Driving |
277 |
6.9% |
23.9% |
8.3% |
48.0% |
Large Vehicles |
215 |
5.4% |
20.0% |
5.3% |
27.2% |
Speeding |
205 |
5.1% |
90.6% |
6.6% |
84.8% |
Occupant Protection |
182 |
4.6% |
37.5% |
4.8% |
15.0% |
Note: Percentages bolded are greater than the corresponding percentage in the entire Commonwealth of Massachusetts. Data in the table does not include crashes along Interstates, expressways, other fully access-controlled roadways, or ramps.
HSIP = Highway Safety Improvement Program.
Source: Massachusetts Department of Transportation, IMPACT Crash Data Portal.
Based on these data showing the prevalence of certain factors in the region’s fatal and serious injury crashes, the increasing rates of crashes observed over the past five years, and stakeholder input, the MPO’s Vision Zero Action Plan focuses on Intersections, Roadway Departure, Vulnerable Road Users, Older Drivers, Speeding, and Large Vehicles as key contributing crash factors to guide the focus of strategies and actions.
For more information on the existing conditions data and analysis, see Appendix B.
In addition to analyzing crash data to understand the causes of serious crashes and the roadway user types affected, using the crash data to develop high-injury and high-risk networks is a Vision Zero best practice that allows roadway owners and decision-makers to focus limited resources in the areas with the most problems.
The MPO carried out a network screening to identify and classify sites with road safety risks using a two-part approach. By addressing both locations with a history of serious crashes (specific safety needs) as well as locations with a high risk of future serious crashes (systemic safety needs), we can build a Safe System.
High-Injury Network (HIN)
A crash data-based approach that identifies locations with the highest concentrations of past fatal and serious injury crashes based on historical crash data. This method targets locations with the greatest potential for safety improvement and supports site-specific safety issue diagnosis and countermeasure development.
High-Risk (Systemic) Network (HRN)
A proactive approach that focuses on sites with the highest risk of future fatal and serious injury crashes based on the presence of contributing risk factors from a systemwide perspective. This method enables the implementation of low-cost proven countermeasures across the network to prevent future severe crashes.
The HIN is based on 2018–22 data from the Registry of Motor Vehicles (RMV) and takes into account the following considerations:
To account for the differences in crash severity, crashes were weighted if they were more severe or if they involved vulnerable road users. Table 5 shows how each crash was scored along a corridor to develop the HIN.
Table 5 | Crash Scores by Severity
| KABCO Severity Category |
Non-VRU Crash Score |
VRU Crash Score |
|---|---|---|
Fatal Injury (K) |
15 |
22.5 |
Suspected Serious Injury (A) |
15 |
22.5 |
Suspected Minor Injury (B) |
2 |
3 |
Possible Injury (C) |
1 |
1.5 |
VRU = vulnerable road user.
Source: Boston Region MPO.
More details on how the HIN was developed are in Appendix C.
This network crash analysis resulted in two categories of severity of high-injury roads in the region:
The HIN provides valuable insight into how severe crashes are distributed across the roadway network. Regionally, HIN corridors make up just 7 percent of the roadway network by mileage, yet they account for approximately 65 percent of fatal and serious injury crashes between 2018 and 2022.
As shown in Figure 10, the regional HIN is heavily concentrated in and around the Inner Core Committee (ICC) subregion. This pattern is likely influenced by higher traffic volumes and levels of pedestrian and bicycle activity in the area, which lead to more frequent interactions among roadway users and a greater potential for conflicts.
To provide a more context-sensitive understanding of corridors with severe crash concerns, subregional and municipal HINs were also developed. These finer-scale networks can support local municipalities in prioritizing safety improvements based on localized crash patterns. Municipalities can also partner with neighboring communities to implement coordinated safety projects along corridors that span municipal boundaries.
Figure 10 | Regional High-Injury Network
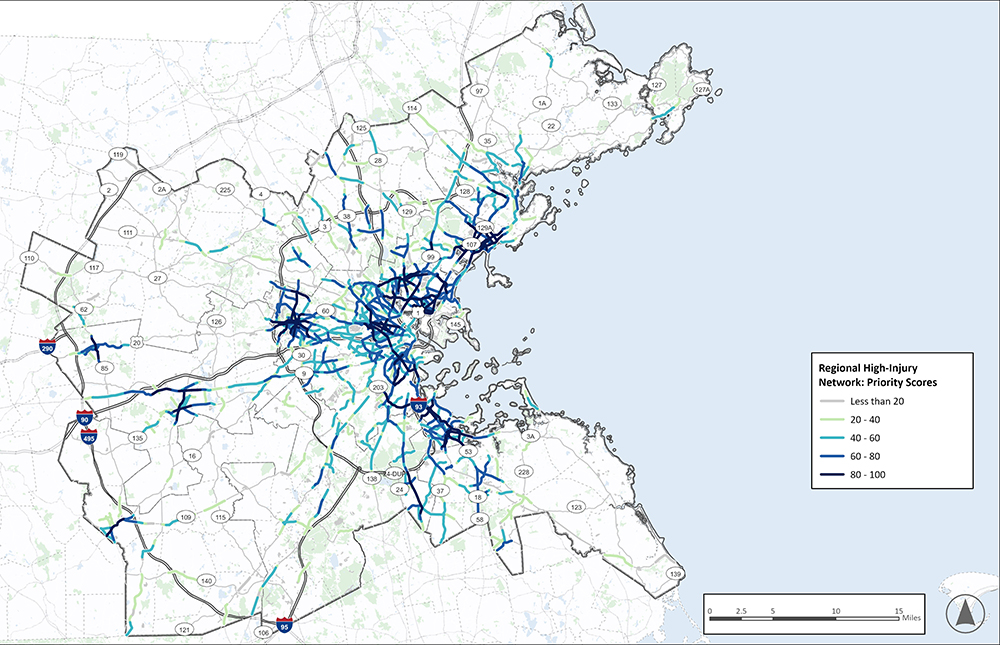
Note: Data from MassDOT IMPACT tool do not include fully access-controlled roadways and ramps.
Source: Massachusetts Department of Transportation, IMPACT Crash Data Portal and MassDOT Road Inventory 2022.
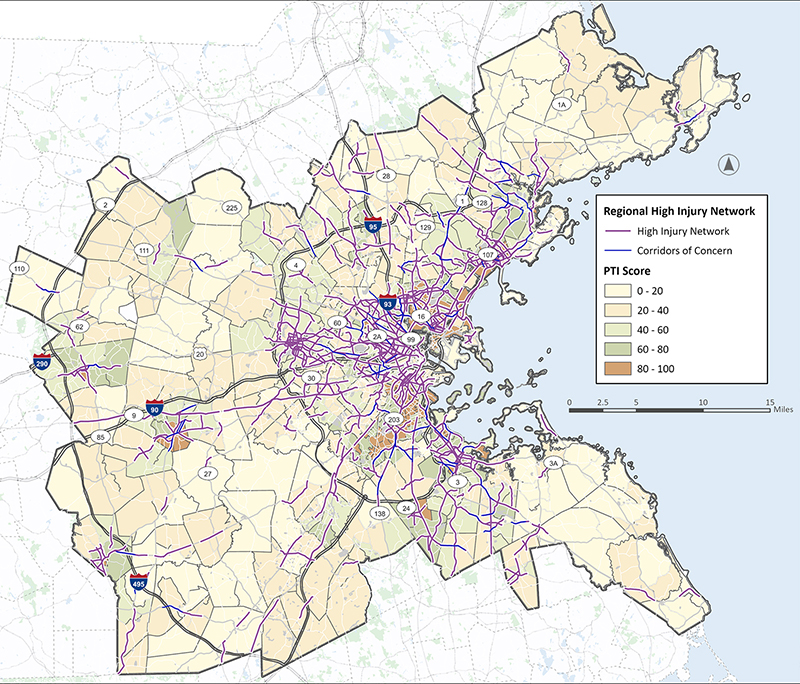
To identify neighborhoods with a disproportionate amount of unsafe infrastructure, the regional High-Injury Network was compared to the geographic distribution of Communities of Concern (CoCs). This analysis confirmed that census tracts with higher concentrations of residents with low income, who are minorities, or who have limited English proficiency contain a disproportionate share of dangerous roadway miles.
A scoring system was employed to provide a framework for roadway owners and municipalities to prioritize safety investments in the highest-need areas. To ensure a fair prioritization of these areas, a “CoC score” was assigned to each census tract by ranking its population shares against all other tracts in the region. These individual rankings were averaged into a single score and then categorized into four levels of need based on their distribution. Figure 11 shows the categorization of tracts into four levels of marginalization: most marginalized (top 25th percentile or 75th–100th percentile), more marginalized (50th–75th percentile), less marginalized (25th–50th percentile), and least marginalized (bottom 25th percentile or 0–25th percentile).
The percentile rank of each census tract was then incorporated into the prioritization of HINs. This allows transportation agencies to focus safety improvement efforts on areas where they are most needed, and ensures that the prioritization process aligns with the MPO’s vision of building an equitable transportation system, with an emphasis on improving outcomes for populations disproportionately exposed to dangerous roadways. Appendix C includes more detail on the methodology used for this analysis and the findings.
Figure 11 | Communities of Concern
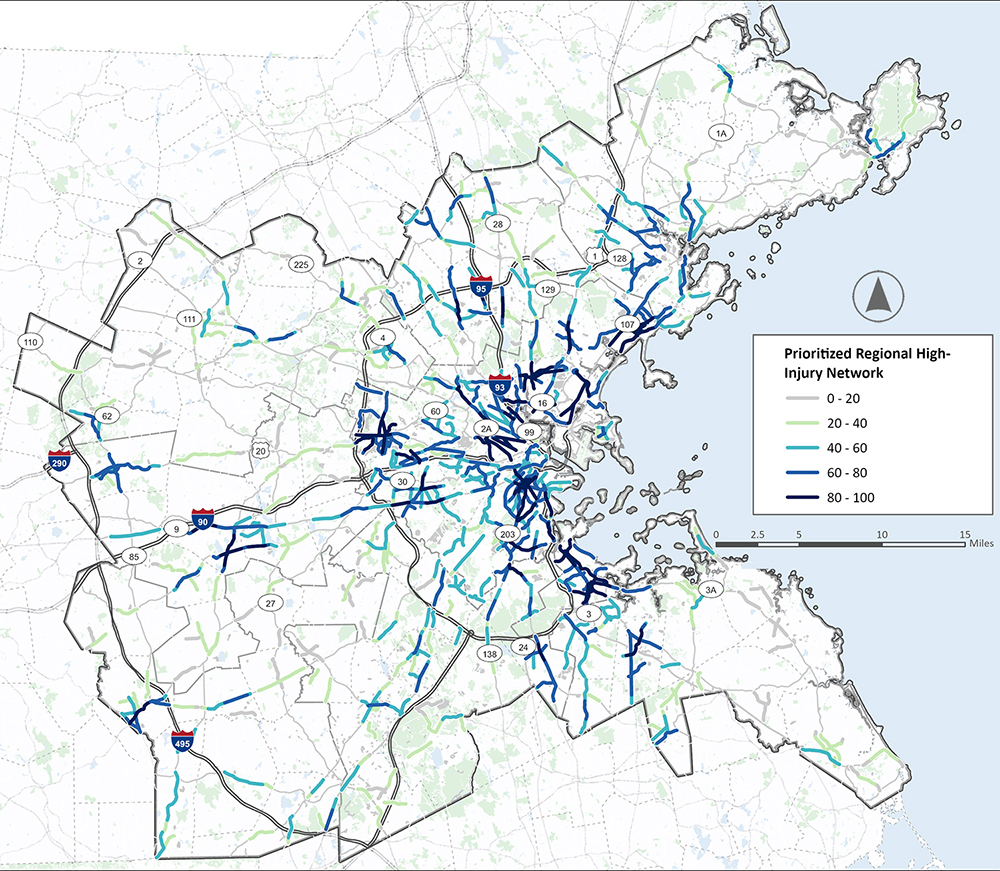
The Prioritized High-Injury Network was developed to further prioritize the high-crash locations of the HIN (both at the regional and municipal levels). The network screening methodology combined scores based on percentile rank and scores based on a fixed number of points assigned if a location was in proximity to certain important facilities and services.
For the following factors, the network was prioritized based on how a section of the HIN compared to other locations on the HIN:
Points were also assigned based on whether high-crash locations were in the vicinity of these important facilities and services:
The methodology to develop the prioritized score for corridors and intersections on the regional and municipal HIN is described in detail in Appendix C. The regional prioritized network and corridor scoring is shown in Figure 12.
Figure 12 | Prioritized Regional High-Injury Network
The following maps and tables identify the highest-scoring priority corridors within each of the eight subregions in the Boston region. The identification of these top scoring corridors in each subregion helps illustrate how the MPO can use the Prioritized HIN to start to focus in on the highest crash corridors that are in proximity to transit, schools, CoCs, and other locations that are important to improve access to. The next steps for what the MPO and municipalities can do to address safety concerns in these locations are detailed in the list of actions in Chapter 6.2F
Figure 13 | Prioritized Regional High-Injury Network in the ICC Subregion
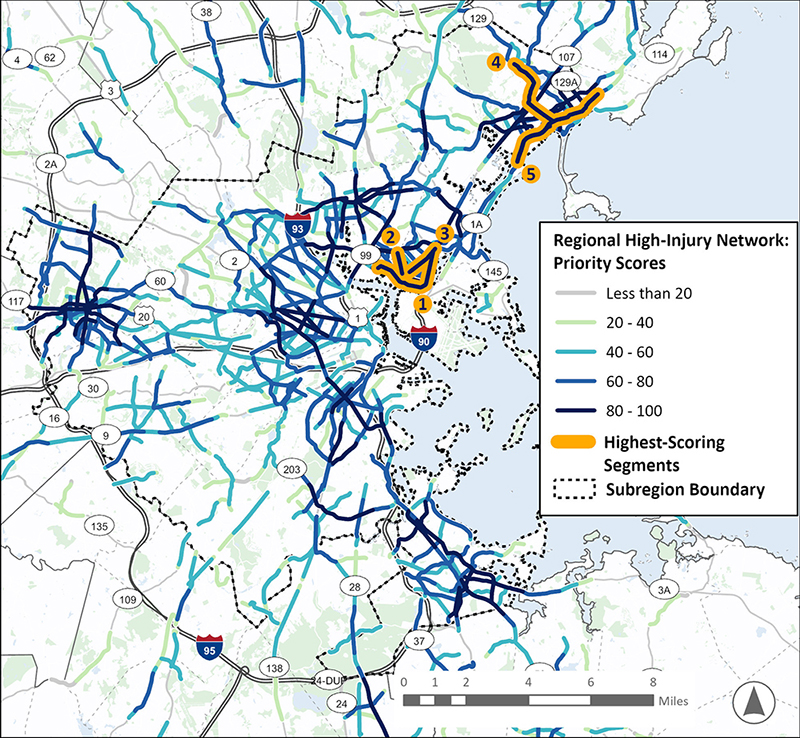
Table 6 | High-Scoring Locations in the ICC Subregion
Rank |
Road |
From |
To |
Jurisdiction |
Municipality |
1 |
Eastern Ave./ Marginal St./ Williams St. |
Clinton St. |
Market St. |
Local |
Chelsea |
2 |
Everett Ave. |
Walnut St. |
Revere Beach Pkwy. |
Local |
Chelsea |
3 |
Broadway |
Revere Beach Pkwy. |
Washington Ave. |
Local |
Chelsea |
4 |
SR 129 |
Broad Street |
Frederick Circle |
Local |
Lynn |
5 |
SR 1A |
Revere line |
Swampscott line |
DCR/Local |
Lynn |
ICC = Inner Core Committee.
Source: Boston Region MPO.
Figure 14 | Prioritized Regional High-Injury Network in the MAGIC Subregion
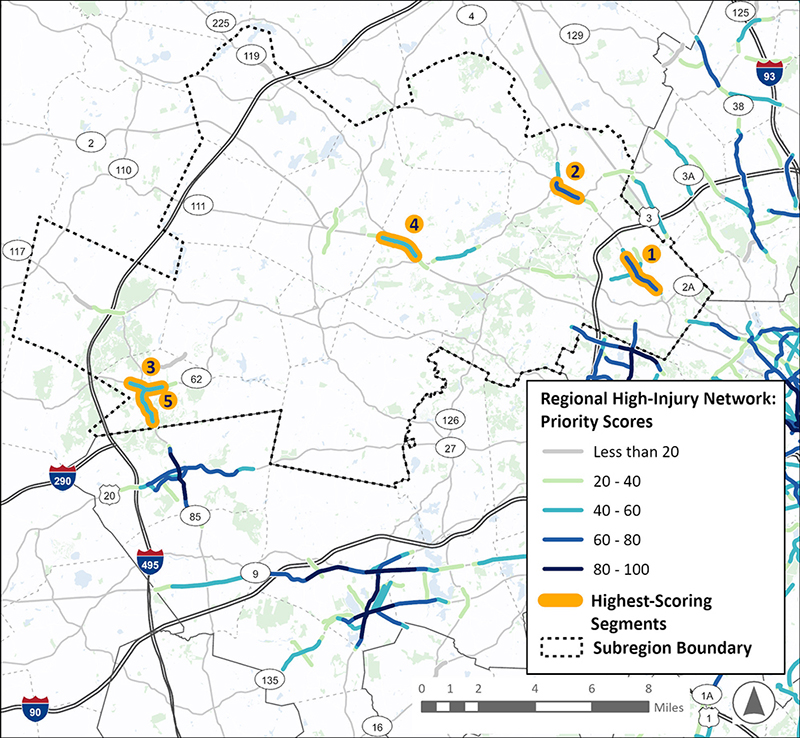
MAGIC = Minuteman Advisory Group on Interlocal Coordination.
Source: Boston Region MPO.
Table 7 | High-Scoring Locations in the MAGIC Subregion
Rank |
Road |
From |
To |
Jurisdiction |
Municipality |
1 |
Massachusetts Ave./Bedford St. (SR 4) |
Percy Rd. |
Larchmont Lane |
Local |
Lexington |
2 |
Great Rd./ North Rd. (SR 4) |
Lane Ave. |
Carlisle Rd. |
MassDOT/ Local |
Bedford |
3 |
Main St./Central St. (SR 62) |
Tower St. |
Coolidge St. |
Local |
Hudson |
4 |
SR 2 |
Acton line |
MBTA tracks |
MassDOT |
Concord |
5 |
Washington St. |
Main St. |
Hudston St. |
Local |
Hudson |
MAGIC = Minuteman Advisory Group on Interlocal Coordination.
Source: Boston Region MPO.
Figure 15 | Prioritized Regional High-Injury Network in the MetroWest Subregion
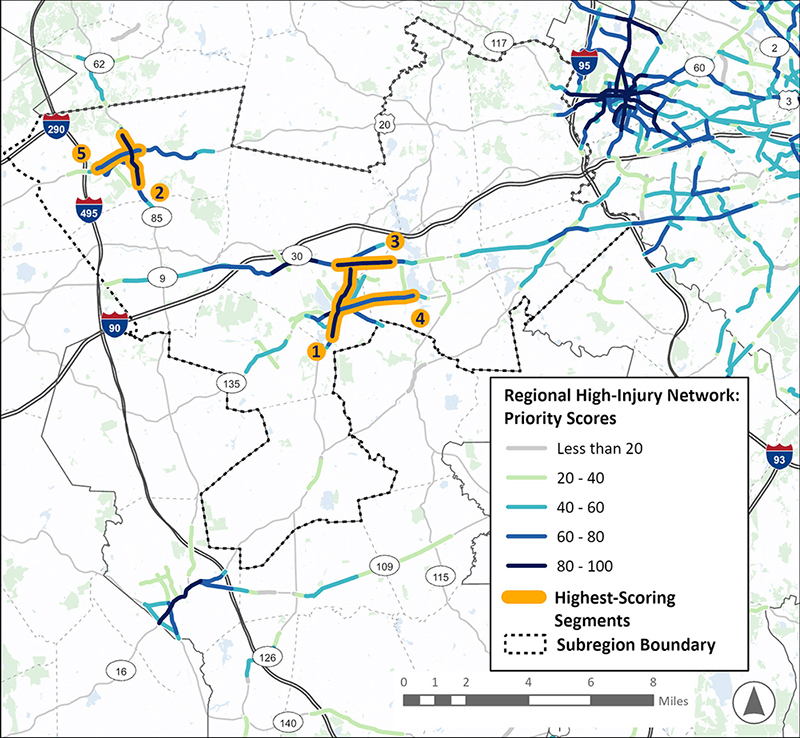
Table 8 | High-Scoring Locations in the MetroWest Subregion
Rank |
Road |
From |
To |
Jurisdiction |
Municipality |
1 |
Concord St./ Hollis St. (SR 85) |
Corregidor Rd. |
Nipmuc Rd. |
Local |
Framingham |
2 |
Bolton St./ Maple St. (SR 85) |
Agoritsas Dr. |
South St. |
MassDOT/ Local |
Marlborough |
3 |
SR 9 |
Lockland Ave. |
Strathmore Rd. |
Local |
Framingham/Natick |
4 |
W Central St./ Waverly St (SR 135) |
Second St. |
Fountain St. |
MassDOT |
Framingham |
5 |
Lincoln St. |
Lakeside Ave. |
E Main St. |
Local |
Marlborough |
MetroWest = MetroWest Regional Collaborative.
Source: Boston Region MPO.
Figure 16 | Prioritized Regional High-Injury Network in the NSPC Subregion
\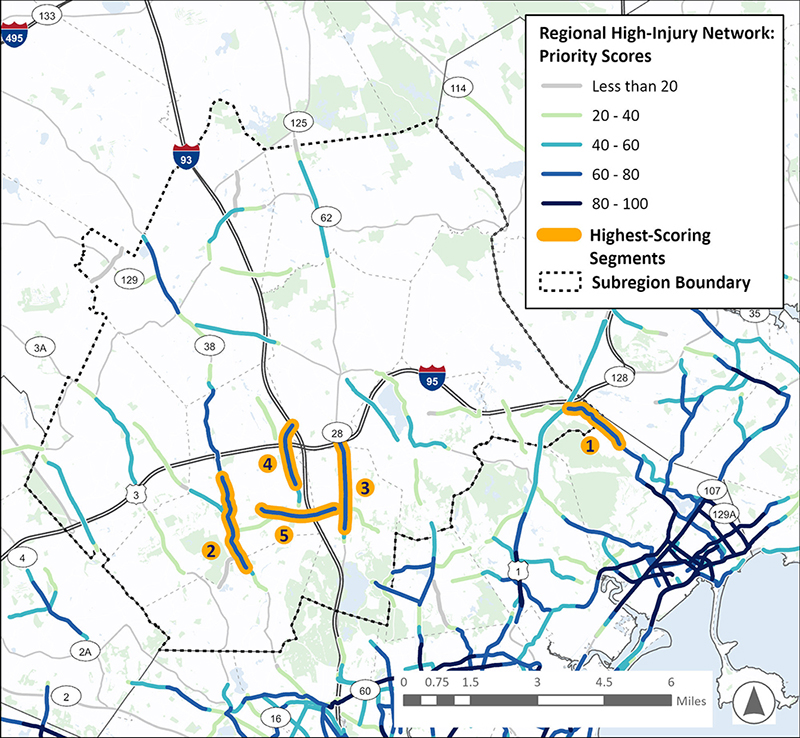
Table 9 | High-Scoring Locations in the NSPC Subregion
Rank |
Road |
From |
To |
Jurisdiction |
Municipality |
1 |
Salem St. |
Condon Circle |
Canterbury Rd. |
MassDOT |
Lynnfield |
2 |
Main St. |
Eaton Ave. |
Cross St. |
Local |
Woburn |
3 |
Main St. |
Reading line |
Linden St. |
MassDOT/ Local |
Stoneham |
4 |
Washington St. |
Border Rd. |
Marilyn Ct. |
MassDOT/ Local |
Woburn |
5 |
Montvale Ave. |
I-93 |
Montvale Ln. |
Local |
Woburn |
NSPC = North Suburban Planning Council.
Source: Boston Region MPO.
Figure 17 | Prioritized Regional High-Injury Network in the NSTF Subregion
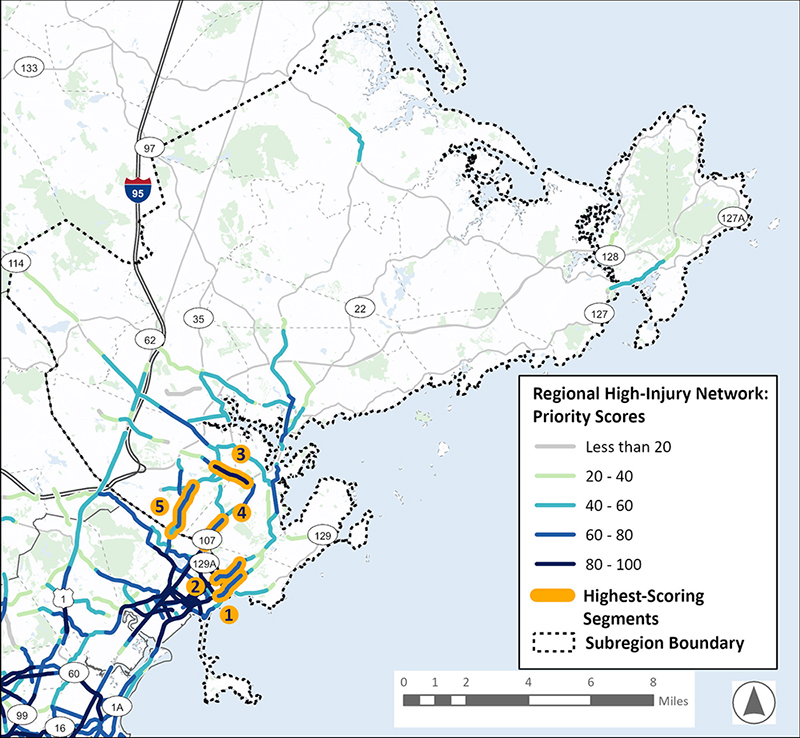
Table 10 | High-Scoring Locations in the NSTF Subregion
Rank |
Road |
From |
To |
Jurisdiction |
Municipality |
1 |
Essex St. |
Lynn line |
Boulder Way |
Local |
Swampscott |
2 |
SR 1A |
Lynn line |
Farragut Rd. |
MassDOT/ Local |
Swampscott |
3 |
Boston St./ Main St./ Lowell St. |
Bridge St. |
Church St. |
Local |
Salem/ Peabody |
4 |
Western Ave./ Highland Ave. (SR 107) |
Lynn line |
Verona St. |
MassDOT |
Salem |
5 |
Lynn St. |
Lynn line |
Washington St. |
Local |
Peabody |
NSTF = North Shore Task Force.
Source: Boston Region MPO.
Figure 18 | Prioritized Regional High-Injury Network in the SSC Subregion
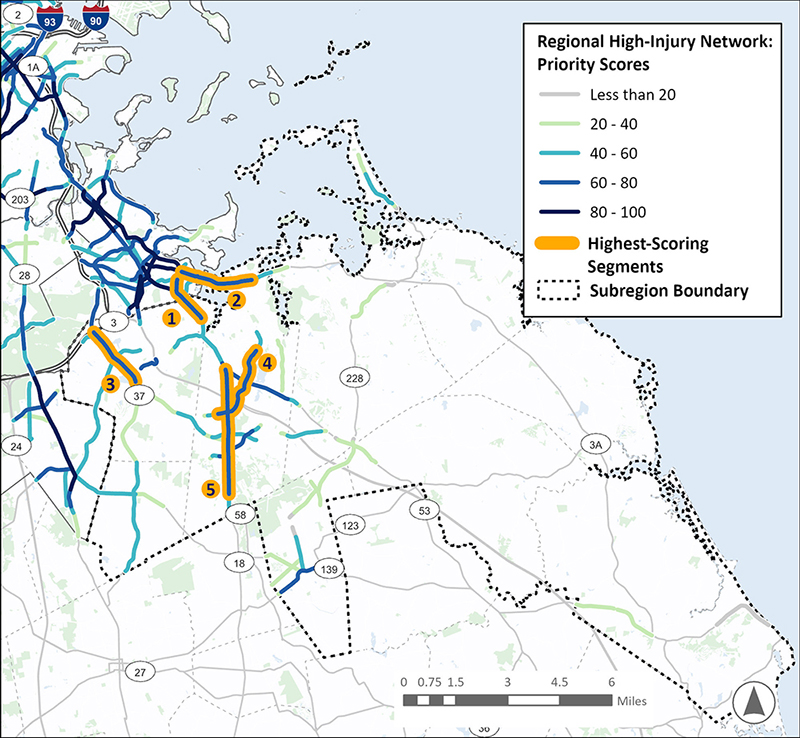
Table 11 | High-Scoring Locations in the SSC Subregion
Rank |
Road |
From |
To |
Jurisdiction |
Municipality |
1 |
Quincy Ave. |
Bickford Rd. |
Dewey Rd. |
MassDOT |
Braintree |
2 |
Bridge St. |
Braintree line |
Green St. |
MassDOT |
Weymouth |
3 |
Franklin St./ Granite St. (SR 37) |
SR 128 |
Pearl St. |
MassDOT |
Braintree |
4 |
Middle St./ West St. |
Charles St. |
Mill St. |
Local |
Weymouth |
5 |
Main St. |
Washington St. |
Trotter Rd. |
MassDOT |
Weymouth |
Source: Boston Region MPO.
Figure 19 | Prioritized Regional High-Injury Network in the SWAP Subregion
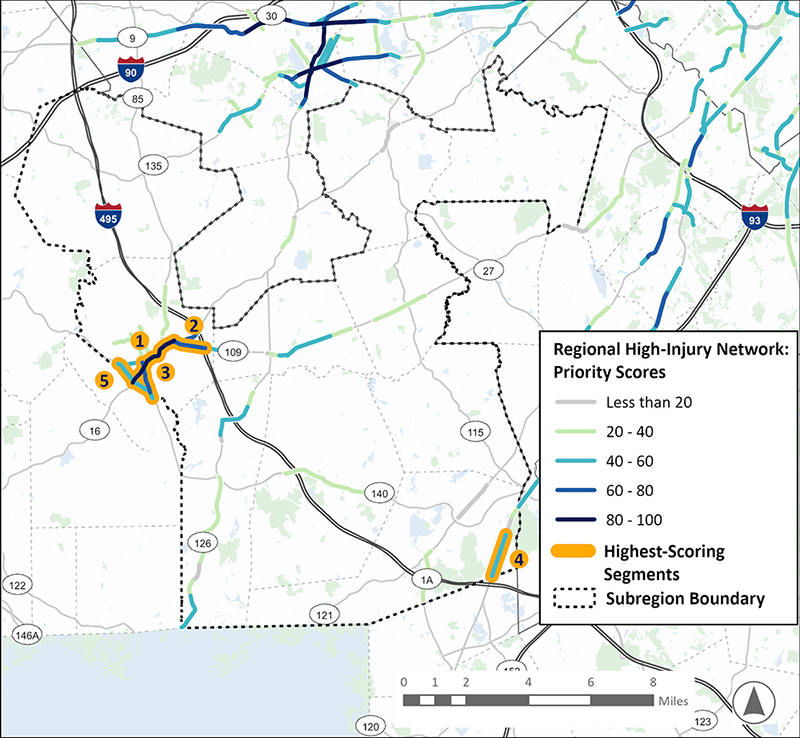
Table 12 | High-Scoring Locations in the SWAP Subregion
Rank |
Road |
From |
To |
Jurisdiction |
Municipality |
1 |
Main St./E Main St. (SR 16) |
Hopedale line |
Prairie St. |
MassDOT/ Local |
Milford |
2 |
Medway Rd. |
E Main St. |
I-495 |
Local |
Milford |
3 |
S Main St. |
Hopedale line |
West St. |
MassDOT/ Local |
Milford |
4 |
Washington St. |
Madison St. |
Myrtle St. |
MassDOT |
Wrentham |
5 |
Prospect St./ Cape Rd. (SR 140) |
West St. |
S Main St. |
MassDOT |
Milford |
SWAP = SouthWest Advisory Planning Committee.
Source: Boston Region MPO.
Figure 20 | Prioritized Regional High-Injury Network in the TRIC Subregion
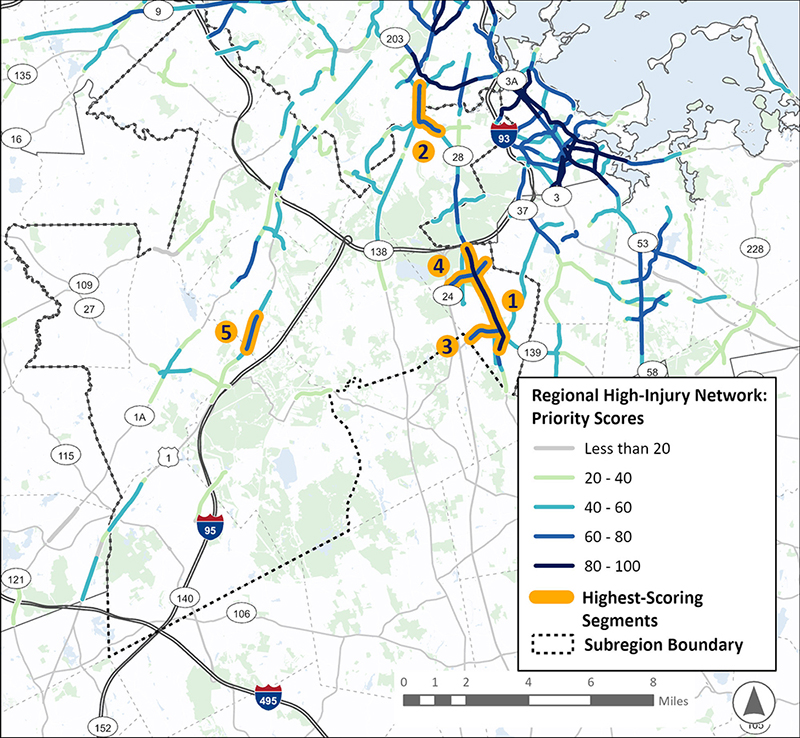
Table 13 | High-Scoring Locations in the TRIC Subregion
Rank |
Road |
From |
To |
Jurisdiction |
Municipality |
1 |
N Main St./ S Main St. (SR 28) |
I-93 |
Fairview Ave. |
MassDOT |
Randolph |
2 |
Blue Hills Pkwy./Brook Rd. (SR 28) |
Boston line |
Central Ave. |
DCR/Local |
Milton |
3 |
Mazzeo Dr./ Warren St. (SR 139) |
Thomas Patten Dr. |
N. Main St. |
Local |
Randoph |
4 |
Canton St./ Reed St./ Pond St. |
Irving Rd. |
Morse St. |
Local |
Randolph |
5 |
US 1 |
Vanderbilt Ave. |
Walpole line |
MassDOT |
Norwood |
TRIC = Three Rivers Interlocal Council.
Source: Boston Region MPO.
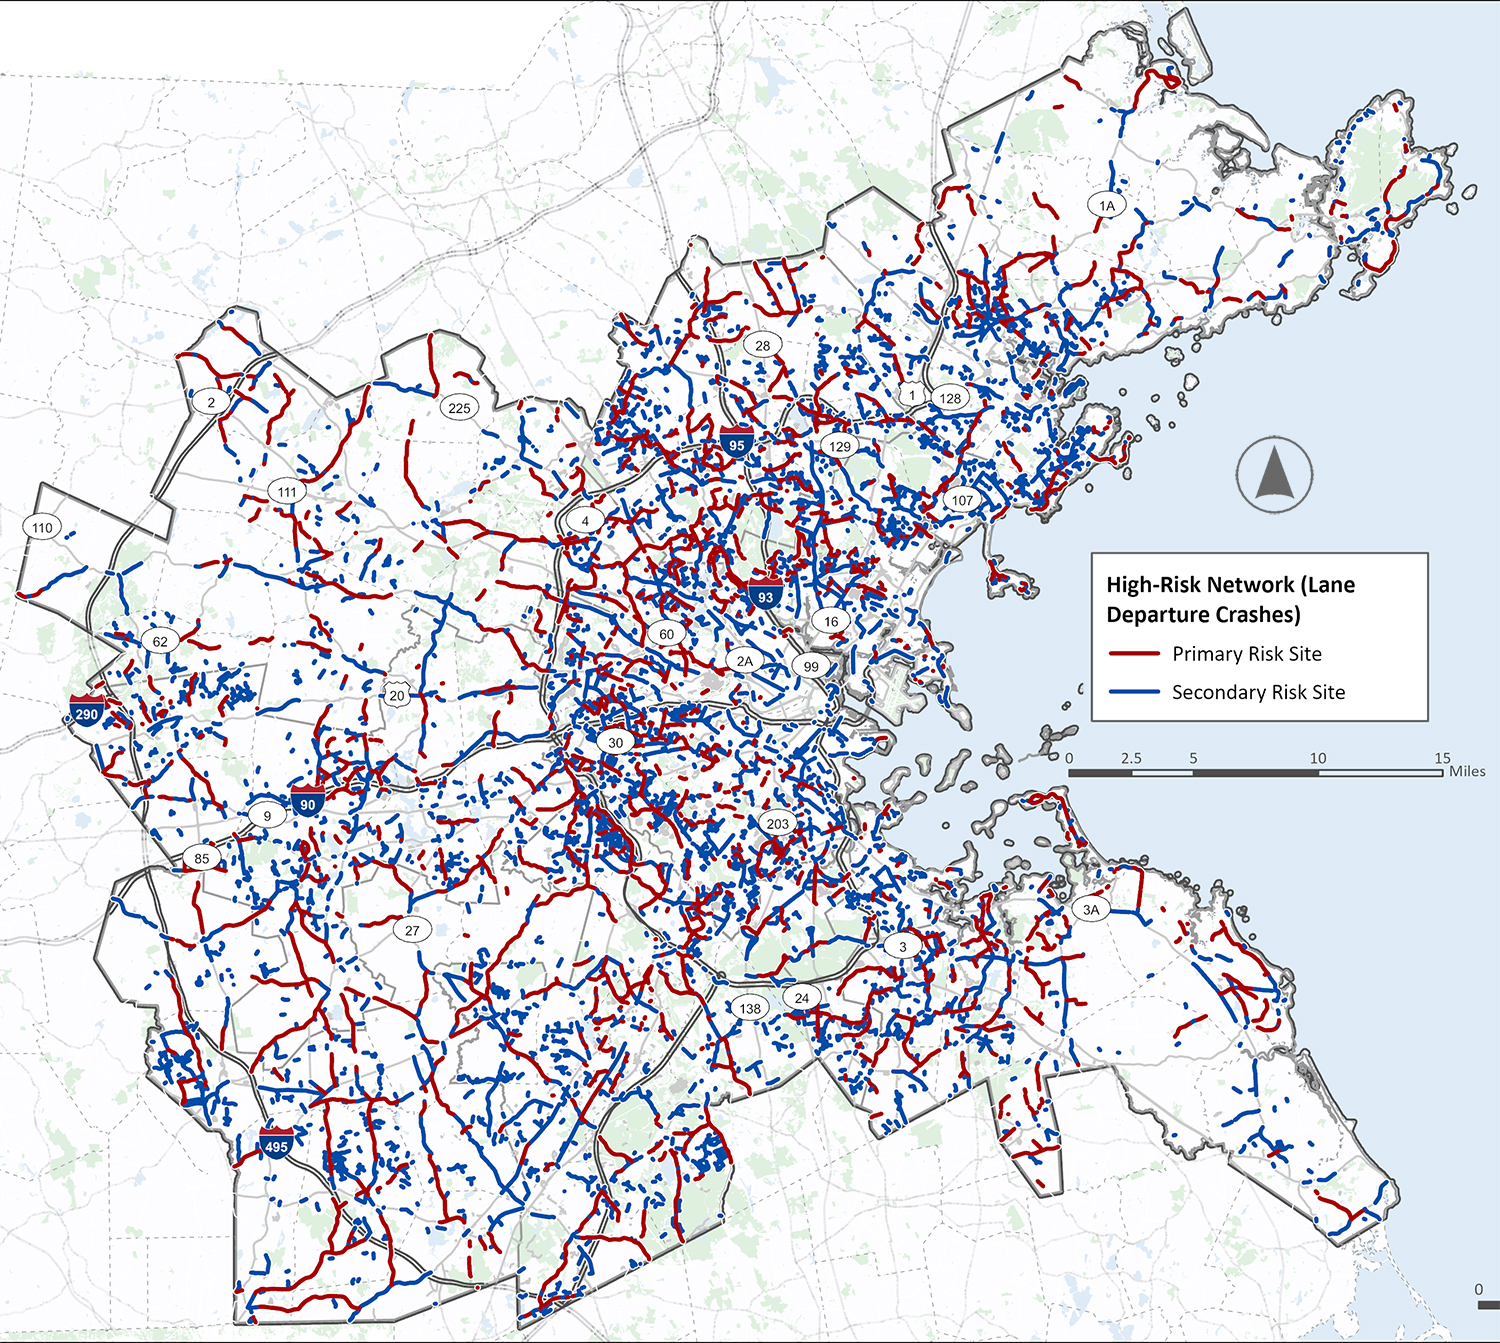
While the HIN identifies locations with a history of fatal and serious crashes, the High-Risk Network (HRN) focuses on locations with a high risk of severe crashes, regardless of crash history. Corridors and intersections on the HRN were identified as locations with roadway features in common with locations in the region that had the most severe crashes. Road owners can use the HRN proactively to prioritize these high-risk locations for preventative safety improvements before severe crashes occur.
The process to develop the HRN followed the process recommended by the Federal Highway Administration (FHWA) in its Systemic Safety User Guide. MassDOT’s IMPACT Risk-Based Network Screening Tool and methodology reports were the primary data sources. MassDOT’s process and the process used for this Vision Zero Action Plan identifies facility types where crashes are most likely to occur, then calculates a risk score for locations with higher risk scores that are more likely to have crashes of a specific type. The risk scores are then used to categorize either intersections, segments, or municipalities into the following types:
Six of these networks were developed, one for each of the region’s key contributing crash factors (Intersections, Roadway Departure, Vulnerable Road Users, Older Drivers, Speeding, and Large Vehicles). The MPO used MassDOT’s methodology to analyze risk related to intersection crashes, VRU crashes, roadway departure crashes, and older driver crashes. To better address MPO-specific safety concerns and Vision Zero focus areas, as part of this Action Plan the MPO developed distinct methodologies to analyze risk related to speeding crashes and large vehicle crashes. These methodologies, along with a summary of sites by jurisdiction, risk category, and all underlying data are described in more detail in Appendix D.
Figure 21 shows an example of the HRN for roadway departure crashes.
Figure 21 | High-Risk Network Example—Roadway Departure Crashes
As described throughout this chapter, the Boston Region Vision Zero Action Plan uses two key tools: the Prioritized HIN (developed both at the regional and municipal levels) and the HRN. The Prioritized HIN can help roadway owners and stakeholders pinpoint locations that have already proven to be dangerous, guiding a deeper look into why those crashes occurred. The HRN, on the other hand, offers a proactive approach by identifying locations with characteristics known to contribute to crashes even if there has not been a high number of reported crashes yet. As the MPO and municipalities work to implement the Vision Zero Action Plan, the priority high-injury and high-risk areas will guide project prioritization, selection, and design. The maps and tables of the highest scoring corridors in each subregion show how the prioritized corridors will guide the region to work with cities, towns, MassDOT and DCR to focus safety improvements in the areas most likely to reduce fatal and serious injury crashes. Specific actions in Chapter 6 direct the MPO and municipalities to refer to the HIN and HRN, as well as specific crash type analysis, to guide the site specific and systemic implementation of countermeasures at priority locations.
Given the local and state context that needs to be considered during project development, the regional Action Plan takes an approach of identifying priority areas (see Chapter 4), identifying priority actions (Chapter 6), and assigning a framework for future implementation rather than selecting specific corridor projects. Under this approach, the responsibility for selecting and designing projects remains flexible, allowing the region and municipalities to work together to apply priority actions in the most appropriate locations. By focusing on high-need areas and proven safety strategies first, this collaborative process ensures that the plan’s goals are translated into site-specific improvements that address local conditions.
The Vision Zero dashboard on the MPO’s website, provides an interactive tool designed to help stakeholders understand priority locations and specific safety issues: https://www.bostonmpo.org/visionzero.
In addition, Municipal Profiles were created for the municipalities with the top crash numbers and top crash rates in the region to help illustrate how the priority HIN, existing conditions data, and stakeholder engagement can help us understand the top safety challenges in a municipality. (See the Municipal Profiles in Appendix E.) The profiles describe common infrastructure, behavioral, operational, and modal safety challenges specific to each municipality as well as the top effective infrastructure countermeasures to address the specific safety concerns.
Engagement is crucial to develop a successful Vision Zero Action Plan that directly addresses the region’s transportation safety challenges. By engaging a diverse group of stakeholders, the MPO was able to collect meaningful insight into their major safety concerns and identify what the Action Plan should focus on. Engagement activities also identified potential and preferred solutions that can make the Boston region’s streets safer for all people who walk, roll, bike, ride transit, and drive.
As communities in the Boston region range from relatively rural towns (such as Dover) to larger urban centers (e.g., Boston and Cambridge), the MPO developed an engagement strategy with goals to ensure input was collected from the wide array of diverse perspectives within the MPO’s planning area
The engagement activities included meetings of a task force; outreach to municipalities; interviews with state and municipal planners, public health practitioners, law enforcement, and public works staff; interviews with stakeholders; public surveys; and a virtual public forum. A range of communication tools were used to provide updates, collect input, and invite stakeholders to participate in the Action Plan development: the Vision Zero webpage on the MPO’s website, emails to a public distribution list, social media posts, the Community Partners Toolkit, and the Vision Zero email newsletter.
Appendix F describes the purpose of each individual engagement activity or communication tool and provides an overview of the participants involved in each engagement activity, as well as the intended audience or type of attendee.
Vision Zero Task Force input was key to shaping an action plan that shifts the region away from the status quo. Task force members brought perspectives from municipalities; school systems; pedestrian, bike, accessibility, and public health organizations; and state and federal transportation agencies. In addition to the full task force, the MPO also designated three subcommittees focused on safety analysis, engagement, and policy. The members of the task force are listed in Table 14 .
Table 14 | Vision Zero Task Force Members
| Name |
Title |
|---|---|
Daniel Albert, Ph.D. |
Historian, Writer, Resident of Marblehead |
Maha Aslam |
Project Manager, Transit and Streets, LivableStreets Alliance |
Ari Belathar |
Former Executive Director, Boston Cyclists Union |
Kristopher Carter |
Chief Possibility Officer, MassDOT |
Jacqueline DeWolfe |
Former Director of Mobility Policy and Program Development, MassDOT |
Alex Epstein |
Somerville Alliance for Safe Streets Steering Committee |
Charlotte Fleetwood |
Senior Transportation Planner, Boston Transportation Department |
JR Frey |
Town Engineer, Town of Hingham |
James Fuccione |
Executive Director, Massachusetts Healthy Aging Collaborative |
Catherine Gleason |
Former Public Policy Manager, LivableStreets Alliance |
Tina Hein |
Vice Chair, Select Board, Town of Holliston; Massachusetts Safe Routes to School Outreach Coordinator |
Brendan Kearney |
Co-Executive Director, WalkMassachusetts |
Jeremy Marsette |
Town Administrator, Town of Sherborn |
Galen Mook |
Executive Director, MassBike |
Shavel’le Olivier |
Executive Director, Mattapan Food and Fitness Coalition |
Kathryn Quigley |
Deputy Director of Strategic Planning, MBTA Systemwide Accessibility |
Brad Rawson |
Director, Mobility Division, City of Somerville |
Katarina Torres Radisic |
Community Organizer, Riders Transportation Access Group (RTAG) |
Ryan Williams |
City Councilor, City of Melrose |
Stephen Winslow |
City Councilor, City of Malden |
The participation of task force members informed several essential sections of the Action Plan’s development. The task force guided public and stakeholder engagement, the safety analysis, policy and process review, and selection of strategies and countermeasures for implementation.
Across all activities, participants included members of the general public, municipal planners and engineers, municipal law enforcement officers, other municipal staff, individuals with disabilities, Aging Service Access Point staff, Chambers of Commerce staff, and members of community-based and advocacy organizations. Table 15 lists all major engagement activities and who was involved.
Table 15 | Vision Zero Action Plan Engagement Activities
| Engagement Activity |
Dates Completed |
Purpose |
Number of Attendees/ |
Type of Attendee/Audience |
|---|---|---|---|---|
Task Force |
February 13, 2024 October 2, 2024 October 9, 2024 December 16, 2024 December 19, 2024 February 3, 2025 May 2, 2025 June 16, 2025 |
Provide input and guidance about the development of the Vision Zero Action Plan, including meetings with safety analysis, engagement, and policy subcommittees. |
18 task force members |
Representation from multiple levels of municipal leadership; advocates for walking, biking, schools, and accessibility; and state and federal partners |
Municipal Survey |
Opened: Closed: |
Collect input from municipal staff about transportation safety issues, challenges to improving safety, and priorities. Paired with municipal virtual office hours. |
Submissions from 36 municipalities |
Planners, city councilors, public works staff, town engineers, and housing and economic development staff |
Municipal Virtual Office Hours |
September 25, 2024, 11:00 AM |
Collect input from municipal staff about transportation safety issues, challenges to improving safety, and priorities. Office hours were paired with the municipal survey. |
6 attendees |
Planners, city councilors, public works directors, town engineers, transportation planners, and housing and economic development staff |
Public Survey |
Opened: Closed: |
Collect input from members of the general public about perceived transportation safety concerns and desired solutions. |
761 submissions from people who live across 58 municipalities within the region |
General public |
Safety Concerns Comment Map |
Opened: Closed: |
Collect input from members of the public about perceived transportation safety concerns and desired solutions at specific locations throughout the region. |
921 submissions identifying 3,952 safety concerns across 55 municipalities within the region |
General public |
Virtual Public Forum |
January 29, 2025, 6:00 PM |
Present overview and purpose of Vision Zero Action Plan and region’s safety data. Learn about the public’s perspectives on safety challenges, concerns, and solutions. |
37 attendees |
General public |
High-Injury Network Municipal Virtual Office Hours |
March 3, 2025 March 6, 2025 |
Discuss the draft HIN and HRN methodology and maps. |
14 attendees on March 3 and 8 attendees on March 6 |
Municipal planners, public works directors, town engineers, and law enforcement |
Policy Interviews |
November 2024 through May 2025 |
Identify policies and processes that might be missing, that inhibit safety, or that require additional resources for successful implementation. |
13 interviews |
Municipal planners, public works directors, town engineers; Massachusetts Department of Conservation and Recreation; and Massachusetts Executive Office of Public Safety and Security’s Office of Grants and Research |
Focus Group—Adults with Disabilities |
April 14, 2025, 5:30 PM |
Understand how stakeholders with disabilities that impact their mobility travel and maneuver safely around the region. |
8 attendees |
Adults with Disabilities in the Boston region |
Aging Services Access Point (ASAP) Providers Roundtable and follow-up Older Adults Survey |
April 16, 2025, 2:00 PM |
Understand how older adults travel and their perceptions about traffic safety challenges and needs in the region. |
7 attendees (Discussion) 2 submissions (Survey) |
ASAP directors and staff |
Discussion on Roadway Safety—Chambers of Commerce |
April 17, 2025, 2:00 PM |
Understand the business community’s perceptions of safety challenges and efforts to improve safety. |
3 attendees 1 follow-up conversation |
Chambers of Commerce staff |
Municipal Roundtable—Law Enforcement |
May 8, 2025, 10:00 AM |
Discuss potential solutions and strategies to address identified safety issues, from an enforcement perspective. |
5 attendees |
Municipal law enforcement |
Municipal Roundtable—Departments of Public Works and Planning |
May 9, 2025, 10:00 AM |
Discuss potential solutions and strategies to address identified safety issues, from a municipal perspective. |
7 attendees 1 follow-up conversation |
Municipal planners and public works staff |
Virtual Public Forum |
June 26, 2025, |
Present draft Action Plan and address initial feedback and questions. |
28 attendees |
General public |
Community events during public review period |
June 26, 2025 – July 27, 2025 (formal public review; continued engagement into mid-August) |
Go to communities and talk about the street safety, people’s concerns and priorities, and the Vision Zero Action Plan. |
131 people |
General public |
Municipal conversations during public review period |
June 26, 2025 – July 27, 2025 (formal public review; continued engagement into mid-August) |
Discuss priority corridors, safety data, and key actions with municipal staff |
15 municipalities |
Municipal planning, engineering, and public works staff |
Across all engagement efforts, several key takeaways emerged about dangerous driver behaviors, roadway design and maintenance needs, policies influencing roadway safety, and funding gaps. The sections below summarize the input we received from stakeholders.
People shared their mistrust of other road users. For example, people walking and rolling do not trust that people driving will stop for them at intersections or crosswalks; people riding bicycles do not trust that drivers will give them enough space or keep bicycle lanes free of barriers (such as parked cars); and, people driving do not trust other people on the road to drive unimpaired or distraction-free.
TOP REPORTED DRIVER BEHAVIOR CONCERNS:
Stakeholders told us that roadway design and infrastructure conditions play key roles in their travel patterns and mode choices. Roadway designs that allow people driving to speed can decrease awareness of people walking, rolling, and riding bicycles and make people feel unsafe. When people feel unsafe biking, walking or rolling they reported that they are more likely to travel by motor vehicle. At the same time, some people said that when they are driving, they feel unsafe due to confusing roadway geometry coupled with speeding and aggressive behaviors from other people driving.
TOP REPORTED INFRASTRUCTURE CONCERNS:
Public policy and decision-making processes determine what safety priorities people and organizations will focus on. While the Commonwealth and the Boston region have many proactive and supportive safety policies and processes, stakeholders identified several policy areas where change is needed. Organizations that will lead and support policy changes include the Boston Region MPO, municipalities, MassDOT, the Department of Conservation and Recreation, the Massachusetts General Court, and advocacy and nonprofit organizations.
POLICY AND PROCESS SUGGESTIONS:
Many municipal staff stakeholders, including planners, public works staff, and law enforcement officers, identified a lack of funding and funding inflexibility as critical challenges to undertaking more roadway safety improvements. This sentiment was expressed in many engagement activities, including the municipal survey, virtual office hours, interviews, and roundtables. Stakeholders want to address roadway safety in a holistic and comprehensive manner but have insufficient resources to do so. While quick-build, low-cost improvements can improve safety outcomes in some cases, many proven safety countermeasures are resource- and time-intensive. Staff capacity can also be a challenge, especially for smaller municipal departments with many shared responsibilities.
This Vision Zero Action Plan offers a comprehensive set strategies, countermeasures, and implementation resources to address regional traffic safety challenges identified throughout the Action Plan development process.
In addition to making our streets safer through design and policy changes, achieving the goals of the regional Vision Zero Action Plan requires a fundamental shift in how residents move through the Boston region. Historically, our transportation network has been optimized for the speed and volume of single-occupancy vehicles, a design philosophy that inherently increases the frequency and severity of crashes. By actively promoting mode shift—transitioning trips from private automobiles to transit, walking, and biking—we directly reduce "exposure," or the total number of vehicle-miles traveled (VMT). Fewer cars on the road translates to fewer opportunities for conflict between vehicles and vulnerable road users. When we prioritize the growth of sustainable modes, we improve mobility for all roadway users and reduce the vehicle traffic that contributes to the dangerous roadway conditions.
The Vision Zero Action Plan integrates this concept by encouraging the redesign of our streets to support multimodal use, utilizing proven safety countermeasures such as separated bike lanes and improved pedestrian crossings. By reallocating road space to accommodate a more diverse split of travel modes, the MPO aims to lower average vehicle speeds and create a self-enforcing environment where human error no longer results in fatal outcomes.
Achieving Vision Zero in the Boston region necessitates a rethinking of how our streets are designed and how drivers operate their vehicles. While the MPO plays an important role in achieving its regional safety goals through research, education, and engagement, the most impactful actions center on tangible changes to the physical infrastructure. By actively redesigning our streets to prioritize the safety and comfort of those outside a vehicle, we can inherently slow down traffic and create environments that encourage walking, rolling, cycling, and public transit use. This action plan is our first step towards encouraging all municipalities to implement traffic-calming measures that effectively reduce vehicle speeds. It is vital that local policies and practices support, rather than hinder, the deployment of such critical safety interventions across our communities.
The actions discussed in the following tables in this chapter are organized by the six contributing crash factors that are the focus of this Action Plan (Intersections, Roadway Departure, Vulnerable Road Users, Older Drivers, Speeding, and Large Vehicles). These actions include policies, process changes (including education and engagement), and infrastructure strategies to address the top safety concerns in the region. Each section includes actions that the MPO will take as well as key actions that the MPO encourages municipalities to take over the next 5 years to reduce deaths and serious injuries on our streets. Each action also identifies a lead agency for implementation (either the Boston Region MPO or municipalities) and supporting partners.
Actions in the tables are assigned a timeframe: short-term (1–3 years); medium-term (3–5 years); or long-term: 5 or more years. These designations indicate the target window during which the MPO or its municipal partners aim to initiate or launch a specific strategy. However, these timeframes should be viewed as "start dates" rather than "expiration dates." Because the pursuit of zero roadway fatalities and serious injuries is an iterative process, many of the actions listed are not one-time tasks; rather, they represent foundational shifts in policy, design, and engagement that will require sustained effort well beyond their initial implementation window.
A "short-term" designation identifies immediate priorities that must be undertaken to build momentum, but these actions will often be repeated, refined, and scaled throughout the life of the plan. To ensure accountability and transparency, the MPO will utilize an annual reporting framework to measure the progress of each action. This recurring evaluation will allow for the development of evolving "next steps" for implementation, ensuring that the plan remains responsive to new data, emerging technologies, and the unique needs of the region’s communities.
Cross-cutting actions span across every emphasis area to reflect the MPO’s commitment to saving lives. Cross-cutting action items reinforce the guiding principles of the Safe System Approach: death and serious injuries are unacceptable, humans make mistakes, humans are vulnerable, responsibility is shared, safety is proactive, and redundancy is crucial.
| Action |
Lead |
Support |
Timeframe |
Type of Action |
|---|---|---|---|---|
Develop safety data dashboard to help municipal staff understand local crash data, key crash causes and risks, and best practice interventions to address those roadway safety challenges. |
Boston Region MPO |
Municipalities |
Short-term |
Process |
Develop engaging messaging and educational materials to raise awareness about key crash causes and best practice interventions (including street design changes), as well as new and existing rules for roadway users. Ensure that materials are provided in multiple languages and use plain language that is easily understandable by residents and roadway users in the region. |
Boston Region MPO |
Municipalities |
Short-term |
Process |
Provide annual progress reports on the Regional Vision Zero Action Plan implementation. Annual reporting could include holding an annual Vision Zero review conference as well as surveying municipalities to understand local implementation. |
Boston Region MPO |
Municipalities |
Short-term |
Process |
Transition the MPO's Regional Vision Zero Task Force to a Regional Action Plan Implementation Task Force. |
Boston Region MPO |
|
Short-term |
Process |
Work with municipalities, MassDOT, and public health stakeholders to involve public health professionals in roadway safety efforts, including local public health staff and epidemiologists, and staff from the Massachusetts Department of Public Health's Injury Prevention and Control Program. |
Boston Region MPO |
Municipalities/MassDOT Metropolitan Area Planning Council’s Public Health Team |
Short-term |
Process |
Work with municipalities, Chambers of Commerce, and other stakeholders to develop roadway safety educational materials to facilitate communication and engagement with the business community. |
Boston Region MPO |
Municipalities |
Short-term |
Process |
Develop engagement strategy and plan for ongoing stakeholder engagement throughout Vision Zero Action Plan implementation. |
Boston Region MPO |
Vision Zero Task Force |
Short-term |
Process |
Track state legislative changes related to roadway safety and communicate priority bills and safety impacts to stakeholders. Key priority legislative changes to track include automated speed; red light and bus/bike lane moving violation enforcement; changes to drivers education requirements (including for older and younger drivers); seat belt usage enforcement; and, legal protections for vulnerable road users. |
Boston Region MPO |
Vision Zero and Safe Streets Advocates
|
Short-term |
Process |
Coordinate with MassDOT on implementation of Strategic Highway Safety Plan actions. |
Boston Region MPO |
MassDOT |
Short-term |
Process |
Coordinate with municipalities and the task force to plan and lead informational tours of successful traffic-calming and roadway safety interventions as peer learning opportunities. |
Boston Region MPO |
Municipalities / MassDOT |
Short-term |
Process |
Through the MPO's FY 2024 SS4A grant or other funding sources, partner with municipalities on safe-streets- related supplemental planning and demonstration projects. |
Boston Region MPO |
Municipalities / MassDOT |
Short-term |
Process |
Research and work with municipalities on land use and parking reforms that support the development of compact, walkable neighborhoods, and reduce car dependency. |
Boston Region MPO |
Municipalities |
Medium-term |
Process |
Create a toolkit of engineering countermeasures, including typical dimensions and specifications or standard drawings, drawing from local best practices (Boston, Cambridge, and Somerville guides), MassDOT, National Association of City Transportation Officials (NACTO), Federal Highway Administration (FHWA), and American Association of State Highway and Transportation Officials (AASHTO), International Road Assessment Programme (iRAP), and the Global Designing Cities Initiative. |
Boston Region MPO |
MassDOT |
Medium-term |
Process |
Conduct further analysis of the prioritized HIN and coordinate with municipalities to understand key crash types, locations (intersection vs. corridor), and causes, and to develop interventions (including quick-build solutions). |
Boston Region MPO |
Municipalities / MassDOT |
Medium-term |
Process |
Work to align MPO planning and programming with Vision Zero goals and Safe System principles. Specific areas of alignment could include review of the Transportation Improvement Program process and a Vision Zero screening tool for new programs and projects. To support mode shift, investments in safe and reliable alternatives to driving should be prioritized. These include protected bike lanes, secure bicycle and micromobility parking, and frequent and accessible public transit. |
Boston Region MPO |
|
Medium-term |
Process |
Plan and host peer exchanges to share best practices and problem-solving with municipal planners, departments of public works, law enforcement, emergency responders, elected officials, school leaders, and first responders. Consider hosting a regional freight last-mile delivery forum similar to the one that Cambridge hosted in 2018. |
Boston Region MPO |
Municipalities |
Medium-term |
Process |
Research the potential of new technology solutions and share information and recommendations with municipal and state partners, including intelligent speed assist and intelligent transportation system technologies such as adaptive signal control and vehicle-to-infrastructure communication. Prioritize research based on top fatal and serious injury crash causes. |
Boston Region MPO |
Municipalities / MassDOT |
Medium-term |
Process |
Work with MassDOT and municipal and advocate stakeholders to set specific key performance indicators for safety improvements in the region. |
Boston Region MPO |
Municipalities / MassDOT |
Medium-term |
Process |
Conduct a data gap analysis and explore public health datasets (e.g., hospital records, EMS data, syndromic surveillance, trauma registries, license data from the Registry of Motor Vehicles) to explore and analyze further the causes of injury. Part of this should include further discussions with MassDOT to understand crash reporting forms and the process for getting crash reports from municipalities. |
Boston Region MPO |
|
Medium-term |
Process |
Partner with school districts, municipalities, Safe Routes to School (SRTS) and advocacy organizations to develop educational resources and programs for students. |
Boston Region MPO |
Municipalities, School Districts, SRTS, and advocate groups |
Medium-term |
Process |
Coordinate with municipalities to plan and implement a crash analysis process so the MPO can help municipalities understand the specific causes and injury types, and how to prevent serious injuries through infrastructure changes. |
Boston Region MPO |
Municipalities |
Long-term |
Process |
Incorporate HIN and HRN data and analysis into corridor reconstruction and maintenance projects so that safety improvements and best practices can be integrated with every municipal project, as appropriate. |
Municipalities |
MassDOT / Boston Region MPO |
Short-term |
Process |
Adopt a local Vision Zero policy and goal that includes targets and key performance indicators for reducing fatal and serious injury crashes. |
Municipalities |
Boston Region MPO |
Short-term |
Policy |
Work with MPO staff to request technical assistance for planning and design of intersection and corridor safety improvements. |
Municipalities |
Boston Region MPO |
Short-term |
Process |
Establish a municipal Vision Zero Task Force or Working Group to foster a collaborative, data-driven, and equitable approach to traffic safety within the municipality and to review serious crashes when they do occur. |
Municipalities |
Boston Region MPO |
Medium-term |
Process |
Implement a systemic program to assess and improve street lighting, prioritizing locations with documented nighttime crashes involving vulnerable road users. This includes evaluating existing lighting levels, identifying dark or poor contrast zones, and deploying modern, high-efficiency lighting solutions to create safer conditions. |
Municipalities |
Boston Region MPO |
Long-term |
Process |
Note: Short-term timeframes are 1-3 years, medium-term are 3-5 years, and long-term are 5+ years.
Intersection safety is a cornerstone of any effective action plan, as intersections are frequently points of conflict and high-severity crashes. The goal is to design intersections that are forgiving of human error and minimize vehicle speed involved in potential collisions.
| Action |
Lead |
Support |
Timeframe |
Type |
|---|---|---|---|---|
Develop prioritized list of high-crash intersections and coordinate with municipalities to develop safety interventions. Consider using International Road Assessment Programme (iRAP) analysis tools to assess and prioritize locations for intervention. |
Boston Region MPO |
Municipalities / MassDOT |
Short-term |
Process |
Develop a best practice signal policy or signal policy toolkit to support municipalities to use as they update, develop, and implement local traffic signal policies. |
Boston Region MPO |
|
Medium-term |
Policy |
Develop and implement a traffic safety signal policy and prioritization framework that includes guidelines for municipal signal changes such as protected left turns, leading pedestrian intervals, pedestrian and cyclist detection and phasing, accessible pedestrian signals, signal-timing optimization for safety, clearance intervals, and emergency vehicle pre-emption, and transit signal priority. Local signal policies should be focused on giving more walk time and reducing delay for pedestrians. Such changes should be prioritized in areas with high volumes of vulnerable road users or in areas already designated as Safety Zones under Chapter 90, Section 17C. Municipalities can leverage signal policy guidance developed by the MPO. |
Municipalities |
Boston Region MPO |
Medium-term |
Policy |
Improve crosswalk visibility by installing high-visibility crosswalks or raised crosswalks at all high-volume intersection crossings, focusing on intersections near priority destinations (such as schools, senior centers, hospitals, and transit stops). |
Municipalities |
MassDOT |
Medium-term |
Infrastructure |
Improve sightlines at intersections for people driving and walking or rolling (daylighting intersections) by installing pavement markings and physical delineation near crosswalks. |
Municipalities |
MassDOT / Boston Region MPO |
Medium-term |
Infrastructure |
Install “No Turn on Red” signage at signalized intersections prioritizing intersections on the Prioritized HIN and HRN and in locations with high risk for intersection and VRU crashes. Couple installation of additional signage with communications to residents and drivers about changes to turn policies. |
Municipalities |
MassDOT |
Medium-term |
Infrastructure |
Adopt citywide “No Turn on Red” policy. Couple policy change with communications to residents and drivers about policy changes. |
Municipalities |
MassDOT / Boston Region MPO |
Medium-term |
Policy |
Coordinate with the MBTA to improve safety at at-grade rail crossings on the Prioritized High-Injury Network and High-Risk Network. |
Municipalities |
MBTA / Boston Region MPO |
Medium-term |
Infrastructure |
Note: Short-term timeframes are 1-3 years, medium-term are 3-5 years, and long-term are 5+ years.
Roadway departure crashes, where a vehicle leaves the traveled way and often strikes a fixed object, overturns, or enters a ditch, are a significant contributor to fatalities and serious injuries. This Action Plan will implement a multifaceted approach to prevent these crashes by recommending more forgiving roadsides, improved driver awareness, and steps to address common contributing factors.
| Action |
Lead |
Support |
Timeframe |
Type |
|---|---|---|---|---|
Use the High-Injury Network and High-Risk Network to develop list of top locations for roadway departure crashes and roadway departure crash risk. |
Boston Region MPO |
Municipalities |
Short-term |
Process |
Work with municipalities to complement infrastructure improvements with targeted educational campaigns to address behavioral factors contributing to roadway departures, including partnering with state agencies and advocacy groups to conduct public awareness campaigns on the dangers of distracted and drowsy driving, and to enhance outreach and education about the Massachusetts Hands-Free Law. |
Boston Region MPO |
Municipalities |
Medium-term |
Process |
Address high-crash and high-risk areas for roadway departures by implementing context sensitive best practices based in the safe system approach. Consider interventions such as widening shoulders and increasing the distance to fixed objects; pavement friction treatments; rumble strips; new or upgraded guardrails/barriers; road diets; or narrowed lane widths. |
Municipalities |
MassDOT |
Medium-term |
Infrastructure |
Note: Short-term timeframes are 1-3 years, medium-term are 3-5 years, and long-term are 5+ years.
Vulnerable road users are disproportionately affected by traffic crashes, often sustaining severe or fatal injuries due to their lack of physical protection. The MPO, through this Action Plan, is committed to creating a transportation system that prioritizes the safety and comfort of all vulnerable road users, making walking, biking, and rolling safe and accessible modes of travel for everyone.
| Action |
Lead |
Support |
Timeframe |
Type |
|---|---|---|---|---|
Work with universities and municipal partners to research and develop an approach to measure the impact of unsafe roadway infrastructure on pedestrians and bicyclists. |
Boston Region MPO |
Municipalities |
Medium-term |
Process |
Adopt a Complete Streets policy and leverage MassDOT Complete Streets funding opportunities to prioritize and improve walking and biking infrastructure. |
Municipalities |
|
Short-term |
Policy |
Using the Regional Active Transportation Plan, prioritize closing identified gaps in the bicycle and pedestrian network aligned with the High-Injury Network and High-Risk Network. Focus on prioritizing connections to transit, schools, hospitals, and commercial centers. Consider using International Road Assessment Programme (iRAP) analysis tools to assess and prioritize locations for intervention. |
Municipalities |
Boston Region MPO/ |
Short-term |
Infrastructure |
Develop a policy requiring traffic control guidance and design to improve safety for pedestrians and cyclists traveling through municipal-project work zones, ensuring temporary facilities are safe and clear. |
Municipalities |
Boston Region MPO |
Short-term |
Policy |
Participate in the MassDOT Safe Routes to School (SRTS) program and encourage community groups, committees, or the municipality to join the Massachusetts SRTS Alliance. |
Municipalities |
Short-term |
Process |
|
Improve the safety and visibility of mid-block crosswalks by assessing their spacing and considering installation of signage, high-visibility pavement markings, rapid rectangular flashing beacons (RRFBs) or HAWK signals along high-speed corridors and in proximity to priority destinations. Consider using iRAP analysis tools to assess and prioritize locations for intervention. |
Municipalities |
MassDOT |
Medium-term |
Infrastructure |
Incorporate standards for traffic calming and safety improvements for vulnerable road users in development review processes and approvals. |
Municipalities |
|
Medium-term |
Policy |
Work with the Safe Routes to School program to expand educational campaigns and training programs for children and adults focusing on bicyclists and pedestrian skill education, safety-related training, helmet use, etc. |
Municipalities |
Boston Region MPO |
Medium-term |
Process |
Identify and publish a prioritized winter maintenance network for people rolling, walking and biking. Evaluate expanding municipal snow clearance to eliminate gaps in the VRU network. |
Municipalities |
|
Medium-term |
Process |
Work to implement the use of school bus cameras to enforce the existing No Passing Law. |
Municipalities |
School Districts |
Long-term |
Policy |
Adopt a local Safe Streets Ordinance that prioritizes the construction of safe infrastructure for vulnerable road users including installation goals, integration with street reconstruction projects, Complete Streets principles, and signal changes such as leading pedestrian intervals, and other best practices. |
Municipalities |
Boston Region MPO |
Long-term |
Policy |
Note: Short-term timeframes are 1-3 years, medium-term are 3-5 years, and long-term are 5+ years.
Older adults, whether as pedestrians, drivers, or transit users, face unique challenges in the transportation system, often due to vision, hearing, reaction time, or physical mobility. This Action Plan aims to create a transportation environment that is safe, accessible, and accommodating for our aging population, ensuring their continued mobility and independence. The Action Plan’s strategies will address both infrastructure and behavioral aspects to mitigate risks for older adults and older drivers.
| Action |
Lead |
Support |
Timeframe |
Type |
|---|---|---|---|---|
Use crash and risk data to prioritize locations to address the safety of older adults and to target messaging campaigns. |
Boston Region MPO |
Municipalities/ |
Short-term |
Process |
Collaborate with MassDOT and the Registry of Motor Vehicles to help share information and resources about safe driving for older adults, including resources from AAA, AARP, and the MIT AgeLab. |
Boston Region MPO |
Municipalities/MassDOT/Registry of Motor Vehicles |
Medium-term |
Process |
Partner with municipal, state and national organizations to educate older adults and their families about advanced vehicle safety features (e.g., blind spot monitoring, lane keeping assist, and automatic emergency braking) and encourage the adoption of vehicles equipped with these technologies. |
Boston Region MPO |
Municipalities/Councils on Aging/MassDOT |
Medium-term |
Process |
Continue to invest in research and planning that expands and improves public transit options, paratransit services, and community-based transportation programs tailored to the needs of older adults, reducing their reliance on private vehicles. |
Boston Region MPO |
Long-term |
Process |
|
Coordinate with the MBTA to facilitate "travel training" programs that help older adults learn to use public transportation safely and confidently. |
Boston Region MPO |
Municipalities/Councils on Aging/Regional Transit Authorities |
Long-term |
Process |
Note: Short-term timeframes are 1-3 years, medium-term are 3-5 years, and long-term are 5+ years.
Speed is the single most critical factor in crash severity. The faster a vehicle is traveling, the greater the kinetic energy involved in a collision; thus, the higher the likelihood of severe injury or fatality for all road users, especially vulnerable ones. This Action Plan provides for a comprehensive approach to managing speed through infrastructure design, policy changes, and targeted enforcement, ensuring that speeds are safe and appropriate for all roadway contexts.
| Action |
Lead |
Support |
Timeframe |
Type |
|---|---|---|---|---|
Expand guidance and provide resources for municipalities to perform speed data collection more effectively, enabling data-driven identification of speeding hot spots and evaluation of countermeasure effectiveness. |
Boston Region MPO |
Municipalities/ |
Short-term |
Process |
Develop and disseminate public awareness materials highlighting the dangers of speeding and the direct correlation between speed and crash severity for all road users. |
Boston Region MPO |
Municipalities/ |
Short-term |
Process |
Research required speed-limiter devices for repeat and/or reckless speeding offenders. |
Boston Region MPO |
MassDOT |
Medium-term |
Process |
Help spread awareness of and implement MassDOT’s speed management guidance to collect information and analyze data, establish target speeds, design roadways for speed control and separation, set speed limits, and build a community-wide safety culture. |
Boston Region MPO |
Municipalities |
Medium-term |
Process |
Provide guidance to municipalities to develop traffic-calming prioritization protocols to help municipal staff communicate to colleagues and residents about when and where traffic-calming interventions should be implemented. |
Boston Region MPO |
Municipalities |
Medium-term |
Process |
Coordinate with municipalities and MassDOT to identify pilot locations for automated speed and red light safety cameras. Pilot locations should be prioritized based on crash data and the presence of high volumes of vulnerable road users. |
Boston Region MPO |
Municipalities/ |
Medium-term |
Process |
Adopt a 25 mile per hour (mph) speed limit in municipal-owned high-density and business districts, as authorized by Chapter 90, Section 17C of the Massachusetts General Laws. |
Municipalities |
Short-term |
Policy |
|
Establish safety zones and school zones along municipal-owned roadway corridors to lower speed limits to 20 mph. |
Municipalities |
Short-term |
Policy |
|
Prioritize traffic-calming street design changes on local and collector streets in areas at a high-risk for speeding-related crashes, such as residential neighborhoods, school zones, and commercial districts. Traffic-calming interventions include road diets, raised intersections or crosswalks, speed humps, narrowing travel lanes, low traffic neighbohoods and gateway treatments. |
Municipalities |
MassDOT/ |
Medium-term |
Infrastructure |
Prioritize locations where pilot or quick-build traffic-calming projects would be appropriate. Collect before-and-after data to evaluate the project and communicate findings with stakeholders and residents. Consider using International Road Assessment Programme (iRAP) tools to conduct baseline assessments of sites and measure safety impact post intervention. |
Municipalities |
Boston Region MPO |
Medium-term |
Process |
Note: Short-term timeframes are 1-3 years, medium-term are 3-5 years, and long-term are 5+ years.
Large vehicles, including commercial trucks, buses, and municipal fleets, present unique safety challenges due to their size, weight, blind spots, and longer stopping distances. Crashes involving large vehicles often result in severe outcomes, particularly for vulnerable road users. This Action Plan provides a commitment to mitigating these risks by promoting safer vehicle design, implementing robust fleet policies, and designing infrastructure that accounts for the operational characteristics of large vehicles.
| Action |
Lead |
Support |
Timeframe |
Type |
|---|---|---|---|---|
Develop educational materials that municipalities can use for awareness campaigns for commercial motor vehicle (CMV) drivers and other road users on how to better share the roadway, interact with large trucks, and improve safety for all (e.g., Share the Road Campaigns). |
Boston Region MPO |
Municipalities/ |
Short-term |
Process |
Research and share regional and national best practices for delivery-related curb management solutions. Draw on the experience of municipalities in the region, such as Somerville and Boston, that are already implementing innovative approaches to these challenges. |
Boston Region MPO |
|
Short-term |
Process |
Develop a model safe fleet transition plan for municipalities to understand best practices and consider for local adoption. |
Boston Region MPO |
Municipalities |
Short-term |
Process |
Research best practice approaches for municipalities to "right-size" emergency vehicle fleets. |
Boston Region MPO |
|
Short-term |
Process |
Collaborate with MassDOT to promote local adoption of safety measures on large vehicles and municipal fleets according to Massachusetts Acts of 2022 Chapter 358—An Act to Reduce Fatalities. Measures include installing side guards, backup cameras, and cross-over mirrors, and prohibiting hazardous aftermarket devices such as bull bars and lifted suspensions. Provide guidance to municipalities on effectively incorporating these safety requirements into residential parking permit programs to encompass privately owned vehicles. |
Boston Region MPO |
MassDOT |
Medium-term |
Process |
Bring MassDOT Lab's municipal fleet-focused "Try and Drive" event to several locations across the region, bringing department of public works (DPWs) representatives from nearby municipalities to experience high-vision vehicle design and learn from leading DPWs. |
Boston Region MPO |
MassDOT |
Medium-term |
Process |
Explore adding safety criteria to regional procurement specifications for municipal procurement efforts, such as direct vision star rating minimums, or other "buying guide" opportunities.
Refer to New York City's Safe Fleet Transition Plan for a model: https://www.mapc.org/public-works-collective-purchasing-program/. |
Boston Region MPO |
Metropolitan Area Planning Council/ Municipalities |
Medium-term |
Process |
Work with MassDOT and the Registry of Motor Vehicles to develop and implement continued driver training for licensed drivers, including Commercial Motor Vehicle licenses as well as other license classes. Development of this training should involve refresher courses at regular intervals to ensure all drivers receive updated information as regulations, technologies, and street designs change. Specific supplemental courses should include courses such as the Safe Urban Driving Training implemented by Transport for London: https://ops.fhwa.dot.gov/publications/fhwahop18019/fhwahop18019.pdf. |
Boston Region MPO |
MassDOT / Registry of Motor Vehicles |
Long-term |
Process |
Establish clearly defined and safely designed loading/unloading zones. |
Municipalities |
Short-term |
Process |
|
Increase education of municipal staff on new safety features of fleet vehicles. |
Municipalities |
Boston Region MPO |
Medium-term |
Process |
Explore opportunities during fleet purchasing to encourage smaller vehicles and vehicles with features that better protect vulnerable road users.
Safety features that should be prioritized include:
|
Municipalities |
Boston Region MPO |
Medium-term |
Process |
Adopt a “safe fleet” policy that outlines municipal fleet owners’ commitment to safer vehicles with higher direct vision and other safety technologies. This policy should draw on Boston's and New York City's Safe Fleet Transition Plans and should include the following:
|
Municipalities |
Boston Region MPO |
Medium-term |
Policy |
Note: Short-term timeframes are 1-3 years, medium-term are 3-5 years, and long-term are 5+ years.
Safety improvements in the region should be guided by the data analysis, prioritized HIN and HRN mapping (see Chapter 4), and stakeholder engagement feedback (see Chapter 5). The National Highway Traffic Safety Administration (NHTSA) and the Federal Highway Administration (FHWA) provide guidance on the application and impact of Proven Safety Countermeasures to address speeding, pedestrian and bicyclist safety, roadway departures, intersections, and cross-cutting safety improvements. These measures should be considered for widespread implementation to address unsafe infrastructure and dangerous driving in the region.
Additional resources for best practices include the following:
Some strategies require legislative changes in the Massachusetts General Court. As Action Plan implementation continues, the MPO will track roadway safety bills and help communicate the role and importance of these policies to stakeholders. Listed below are some of the key laws identified through our research and stakeholder engagement as being important for advancing transportation safety improvements in the Boston region and the Commonwealth. There are several important roadway safety bills currently being considered by the General Court’s Joint Committee on Transportation. Appendix G includes more detail on the policy research conducted for this Action Plan.
In addition to laws currently being considered by the Massachusetts Legislature, the Vision Zero Task Force recommended that the MPO and municipalities remain aware of and consider advocating for the following best practice policies and roadway safety innovations:
In addition to the MPO’s Transportation Improvement Program (see https://www.bostonmpo.org/tip), other programs are available to provide funding to implement projects described in this Action Plan. Projects may be implemented as safety-focused projects or as part of other, broader initiatives, depending on the countermeasure and project.
Achieving the goal of eliminating fatal and serious injury crashes by 2050 will require collaboration and sustained effort among all regional transportation safety stakeholders, including planners, road owners, maintenance, law enforcement, first responders, the public, advocacy groups, engineers, policymakers, emergency medical services, and community-based organizations.
The MPO will continue to play a critical role in enhancing transportation safety by leading implementation of several Vision Zero action items to advance the region toward a Safe System.
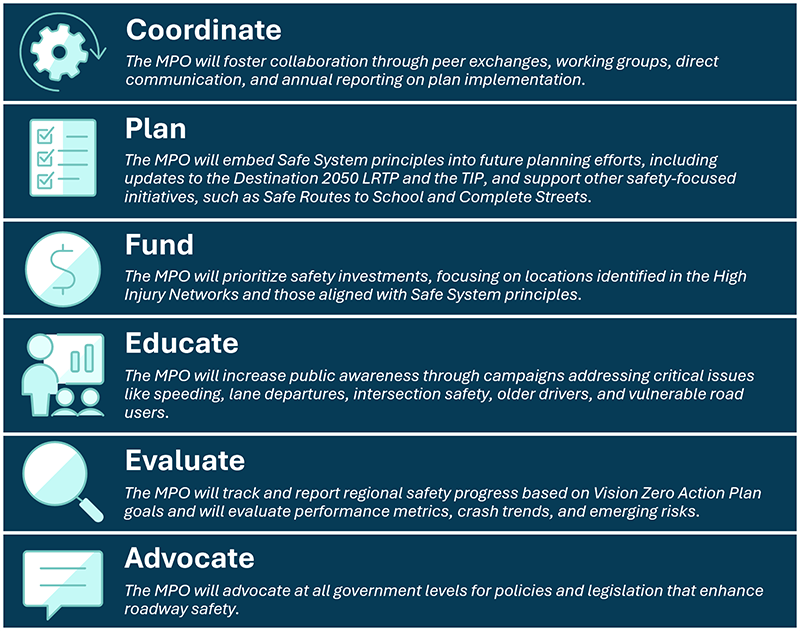
The MPO will utilize this Action Plan to track and report regional safety progress based on Action Plan goals, using both outputs and outcomes on an annual basis. Outputs track and report on the progress of the MPO in supporting, promoting, and leading safety initiatives, programs, policies, plans, and projects. Outcomes evaluate the effectiveness of safety programs and investments in reducing crash frequency and severity, and evaluation findings are used to strengthen successful strategies and revise or discontinue ineffective ones.
In addition to tracking the MPO’s progress on the actions in Chapter 6, the MPO will track performance annually through quantitative analysis of the performance metrics listed in Table 16 and Table 17. While similar metrics are tracked statewide in the Strategic Highway Safety Plan, these metrics will be tracked specifically for the Boston region and publicly reported by the MPO.
Table 16 | Vision Zero Action Plan Performance Metrics: Fatal and Serious Injury Crashes
Metric |
Baseline Excluding Interstates and Fully Access-controlled Roadways |
Baseline All Roads |
Number of Fatal Crashes |
85 |
113 |
Number of Fatalities |
89 |
117 |
Rate of Fatal Crashes (per 100,000 population) |
2.5 |
3.4 |
Number of Serious Injury Crashes |
715 |
841 |
Number of Serious Injuries |
840 |
966 |
Rate of Serious Injury Crashes (per 100,000 population) |
21.3 |
25.5 |
Vulnerable Road User Fatalities |
28 |
36 |
Vulnerable Road User Serious Injuries |
191 |
205 |
Notes: Population from 2020 US Census is 3,357,194.
Vulnerable road users include categories from MassDOT IMPACT crash database of bicyclists, pedestrians, other vulnerable road users, and persons on personal conveyance.
Source: MassDOT IMPACT crash database.
Table 17 | Vision Zero Action Plan Performance Metrics: Crash Emphasis Areas
Metric |
Baseline Excluding Interstates and Fully Access-controlled Roadways |
Baseline All Roads |
Number of Fatal and Serious Injury (FSI) Crashes Involving Large Vehicles |
41 |
59 |
Number of FSI Crashes Involving Older Drivers |
158 |
184 |
Number of FSI Crashes Involving Speeding |
37 |
52 |
Number of FSI Crashes Involving Intersections |
336 |
358 |
Number of FSI Crashes Involving Roadway Departure |
157 |
201 |
Number of FSI Crashes Involving Vulnerable Road Users |
206 |
225 |
Source: MassDOT IMPACT crash database.
The Boston Region Vision Zero Action Plan represents a critical step forward in our commitment to eliminating traffic fatalities and serious injuries by 2050. Through a thorough analysis of crash data, extensive public and stakeholder engagement, and a review of policy and infrastructure needs, we identified key areas of concern such as intersections, roadway departures, and the heightened vulnerability of pedestrians and cyclists. This Action Plan is a regional roadmap built on the Safe System Approach, recognizing that human error is inevitable and that our transportation system must be designed with multiple layers of protection to ensure everyone's safety.
Moving forward, the success of this Vision Zero Action Plan hinges on sustained collaboration and proactive implementation. The Boston Region MPO will continue to play a central role in coordinating efforts, embedding Safe System principles into future planning, and prioritizing investments in high-risk areas. We will also focus on educating the public, evaluating our progress against clear performance metrics, and researching and providing information to stakeholders about necessary legislative changes. This plan provides a regional framework, but its impact will be measured by the collective actions taken by all stakeholders—from state agencies and municipalities to community organizations and individual road users.
chieving Vision Zero is a shared responsibility, demanding a unified commitment from everyone who uses and shapes our roadways. We urge all stakeholders to actively engage with the strategies and countermeasures outlined in this plan. By working together, leveraging the identified data, and adopting the Safe System Approach, we can transform our streets into safer, more equitable spaces for all. Your active participation is not just encouraged, it is essential to reach Vision Zero in the Boston region.
Boston Region Vision Zero Action Plan:
A Roadmap to Safer Streets
For more information, visit our website!
1 The summaries in this section do not include crashes along Interstates, expressways, other fully access-controlled roadways, or ramps unless otherwise noted.
2 Per MassDOT IMPACT crash data, the City of Waltham has the highest number of fatal and serious injury crashes and the highest crash rate, but this is likely an overcounting error as the annual number of fatalities and serious injuries was, on average, more than 10 times higher during the period of 2019 to 2022 compared to the period of 2013 to 2018. For this reason, Waltham is not included in Tables 2 and 3.
3 Massachusetts Highway Safety Improvement Program, MassDOT. Source: https://www.mass.gov/info-details/highway-safety-improvement-program.