2 Case Study Interview Themes: Pandemic Challenges and Recovery Strategies
3 Where Do CBDs Go from Here? Recommendations for Pandemic Recovery
Elizabeth Harvey
Paul Christner
Heyne Kim
Blake Acton
Kate Parker-O’Toole
Ken Dumas
Meghan O’Connor
The preparation of this document was supported by the Boston Region MPO through MPO Combined Pl and §5303 #112310.
Central Transportation Planning Staff is directed by the Boston Region Metropolitan Planning Organization (MPO). The MPO is composed of state and regional agencies and authorities, and local governments.
January 2022
For general inquiries, contact
Central Transportation Planning Staff
State Transportation Building
Ten Park Plaza, Suite 2150
Boston, Massachusetts 02116
857.702.3700
The Boston Region Metropolitan Planning Organization (MPO) operates its programs, services, and activities in compliance with federal nondiscrimination laws including Title VI of the Civil Rights Act of 1964 (Title VI), the Civil Rights Restoration Act of 1987, and related statutes and regulations. Title VI prohibits discrimination in federally assisted programs and requires that no person in the United States of America shall, on the grounds of race, color, or national origin (including limited English proficiency), be excluded from participation in, denied the benefits of, or be otherwise subjected to discrimination under any program or activity that receives federal assistance. Related federal nondiscrimination laws administered by the Federal Highway Administration, Federal Transit Administration, or both, prohibit discrimination on the basis of age, sex, and disability. The Boston Region MPO considers these protected populations in its Title VI Programs, consistent with federal interpretation and administration. In addition, the Boston Region MPO provides meaningful access to its programs, services, and activities to individuals with limited English proficiency, in compliance with U.S. Department of Transportation policy and guidance on federal Executive Order 13166.
The Boston Region MPO also complies with the Massachusetts Public Accommodation Law, M.G.L. c 272 sections 92a, 98, 98a, which prohibits making any distinction, discrimination, or restriction in admission to, or treatment in a place of public accommodation based on race, color, religious creed, national origin, sex, sexual orientation, disability, or ancestry. Likewise, the Boston Region MPO complies with the Governor's Executive Order 526, section 4, which requires that all programs, activities, and services provided, performed, licensed, chartered, funded, regulated, or contracted for by the state shall be conducted without unlawful discrimination based on race, color, age, gender, ethnicity, sexual orientation, gender identity or expression, religion, creed, ancestry, national origin, disability, veteran's status (including Vietnam-era veterans), or background.
A complaint form and additional information can be obtained by contacting the MPO or at http://www.bostonmpo.org/mpo_non_discrimination.
To request this information in a different language or in an accessible format, please contact
Title VI Specialist
Boston Region MPO
10 Park Plaza, Suite 2150
Boston, MA 02116
civilrights@ctps.org
By Telephone:
857.702.3702 (voice)
For people with hearing or speaking difficulties, connect through the state MassRelay service:
Relay Using TTY or Hearing Carry-over: 800.439.2370
Relay Using Voice Carry-over: 866.887.6619
Relay Using Text to Speech: 866.645.9870
For more information, including numbers for Spanish speakers, visit https://www.mass.gov/massrelay
MPO staff gratefully acknowledge the following people who participated in an interview or a focus group. This guidebook was made possible thanks to their voluntary participation, insight, and guidance.
Municipal case study interviewees:
Focus group participants:
Thanks also to Liz Biskar, at the Massachusetts Department of Transportation, for her insights into the Shared Streets and Space Grant Program.
The Goals of this Guidebook
This guidebook is the result of the Boston Region Metropolitan Planning Organization’s (MPO) study Access to Commercial Business Districts II. The aim of the study was to gain an understanding of the impacts of the COVID-19 pandemic on transportation access to and in commercial business districts (CBD) in the Boston region and develop recommendations that support recovery. This guidebook is a product of that work. It takes a holistic view on the forces that will likely affect CBD recovery. Rather than looking at transportation in CBDs in a silo, it considers the role of other areas, such as public health, climate change, housing, commercial real estate, and the economy, since recovery cannot be achieved independent of these forces. While the recommendations in this guidebook relate specifically to transportation, they were developed by considering the possible long-term effects of these and other societal forces. By doing so, it helps planners think about how these forces will drive the future of transportation in Boston area CBDs and provides tools for shaping a resilient, equitable, and sustainable future.
Guidebook Content
The guidebook contains four chapters. Chapter One is an introduction and brief review of how the COVID-19 pandemic has affected CBDs. Chapter Two describes the themes heard from interviewees who work at Boston area municipalities about challenges their CBDs faced during the pandemic and actions undertaken to address them. Chapter Three contains recommendations that were developed using exploratory scenario planning, which is ideal for situations where there is a high level of uncertainty, focusing on forces that will likely drive the future strategies and actions that can best respond to these forces.
Review of Pandemic Impacts Affecting CBDs
Since the first case was confirmed in the United States in January 2020, the COVID-19 pandemic has reached all corners of the country and has threatened the lives and livelihoods of many people and their families. Although the development and distribution of vaccines has reduced the spread of the virus, Massachusetts continues to grapple with recovering from the worst of the pandemic, and the unpredictable threat of coronavirus variants in the future. The last year has shown that COVID-19 is more than a public health issue—it has impacted all aspects of society, including transportation.
Transportation Trends
On March 23, 2021, Governor Charlie Baker signed a state stay-at-home order, dramatically altering, among other things, familiar transportation patterns. This included a reduction in peak-hour commutes, traffic congestion, and public transit ridership. On the other hand, walking and bicycling rose in popularity, evident in BlueBikes ridership, which has steadily increased outside downtown Boston after an initial downturn.1 In response to these trends, public transit service schedules have been altered and numerous pedestrian and bicycling facilities have popped up across the Boston region. Some bicycle and pedestrian improvements have been made possible by an increase in state and federal funding and the use of quick-build or pilot projects to get these facilities on the ground as fast as possible. As these changes have been spurred by the pandemic, it remains to be seen which projects will last and which will fade.
Teleworking Trends
A 2020 study shows that prior to the pandemic, up to 40 percent of US jobs were telework-compatible, representing 45 percent of earned income in the country.2 Remote working was not new for some office workers, although only about five percent of workers worked remotely prior to the pandemic in the Boston region.3 While complete statistics on the number of people teleworking in the Boston region during the pandemic are scarce, the data suggest that many workers whose job tasks are compatible with teleworking have done so. A survey of workers who were mostly employed in office-oriented jobs in the Boston region in 2020 found that 77 percent worked remotely at least a few days a week. The same survey showed that 68 percent of workers said they wanted to continue to do so at least a few days a week after the pandemic.4 Additionally, the 2021 report, Preparing for the Future of Work in Massachusetts, finds that approximately one-third of the state’s workforce could effectively work remotely. As of April 2021, 40 percent of adults live in households where at least one adult worked remotely. If this trend continues, it could have wide-ranging effects, including the commercial real estate market, geographic housing demand, and foot traffic in CBDs. 5 However, while the Boston region has a significant number of telework-compatible jobs, it also has many that are not: two of the top three industries in the Boston region—healthcare and social services and educational services—generally have limited potential for remote work.6
Housing Demand and Residential Preferences
A shift in population growth from Boston and the immediate surroundings to suburban and rural areas was already taking place before the pandemic.7 The pandemic has accelerated the trend as some employees left the city when their employers transitioned to remote work. These trends have led to further growth outside of large US cities during the pandemic: 82 percent of urban cores saw more people moving out, while 91 percent of suburban counties saw more people moving in, including the Boston metro area.8 This shift could affect the demand for public transit in the region’s urban core and in the suburban and rural areas that are growing. The impacts of this trend, particularly as it concerns commuting, will likely come into focus as companies establish permanent teleworking arrangements.
Economic Impacts
One of the hardest hit groups during the pandemic were small businesses that were wholly reliant on downtown foot traffic. In 2020, the number of small businesses in Massachusetts was down by 44 percent.9 The pandemic has also accelerated retail trends that were already affecting CBDs. CBDs have long been competing with big-box retailers and their viability has been increasingly under threat in recent years with the rise of electronic commerce (e-commerce). In 2020 alone, e-commerce grew nearly 35 percent, accounting for 21.3 percent of total retail sales.10
Throughout the pandemic, businesses sought creative ways to stay afloat, such as offering contactless deliveries, pursuing digital advertising, and implementing safety protocols. Challenges remain for these downtown businesses and companies as changes in other trends evolve, from changes to commuting patterns to the willingness of consumers to shop in stores. In addition, questions around the best use of curb space will persist with the new interest in walking and bicycling, outdoor dining, and pick-up/drop-off (PUDO) zones.
Inequity of COVID-19 Infections
The pandemic perpetrated existing social inequities and had a disproportionate impact on communities of color in Massachusetts. Between March and August 2020, age-adjusted data reveal that Black, Hispanic, and Asian populations experienced death rates that were 1.3 to 3 times higher than the White residents.11 Combined, these populations account for 27 percent of Massachusetts residents; however, they make up nearly two-thirds of total reported COVID-19 cases in the state as of July 2021.12 Community-wide data show that places that are majority-minority, such as Chelsea, Everett, and Lynn, saw the highest COVID-19 infection rates throughout the pandemic. The same majority-minority communities that experienced an initial spike in infection rate have a high share of low-income households and frontline workers, further suggesting many dimensions of health inequity in Massachusetts.13
Across the job market, service jobs have been hit the hardest and are struggling to rebound, including those in the restaurant, lodging, healthcare and social assistance, and retail industries.14 For these populations, continued transportation assistance is critical to carry on with their lives in times of uncertainty. Ridership on key bus routes serving low-income communities and communities of color has been more stable than other transportation modes.15 Transportation plays an important role in helping communities recover from job loss and can help ensure more equitable economic growth.
In the face of these challenges, communities must explore creative ways to adapt to new realities and help their CBDs thrive. Transportation is a key component in these efforts. Guided by the stories of 12 case study CBDs across the Boston region, this guidebook is designed to help decision-makers pursue strategies that effectively address these challenges and uncertainties and to build resilient CBDs, regardless of the path the pandemic recovery takes.
To understand the challenges Boston area CBDs have experienced (related to the pandemic) and the strategies used to address them, MPO staff developed case studies of 12 CBDs by interviewing 11 municipal representatives (one person was interviewed for both Boston CBDs).The CBDs were chosen based on several factors: level of public transit access, types of jobs, environmental justice (EJ) population, pandemic impacts, input from staff and the MPO board, and geographic distribution. This chapter describes the key themes that emerged from these interviews. These themes informed the recommendations for recovery developed in Chapter Four.
The 12 CBDs chosen as case studies were:
[call out]
This Guidebook’s Appendices contain a detailed description of how these CBDs were chosen, and profiles of these CBDs, including their locations, key indicators related to demographics, transportation, and remote work potential.
[end call out]
Figure 2.1 shows the location of the CBDs in the Boston region.
Figure 2.1
Case Study Locations
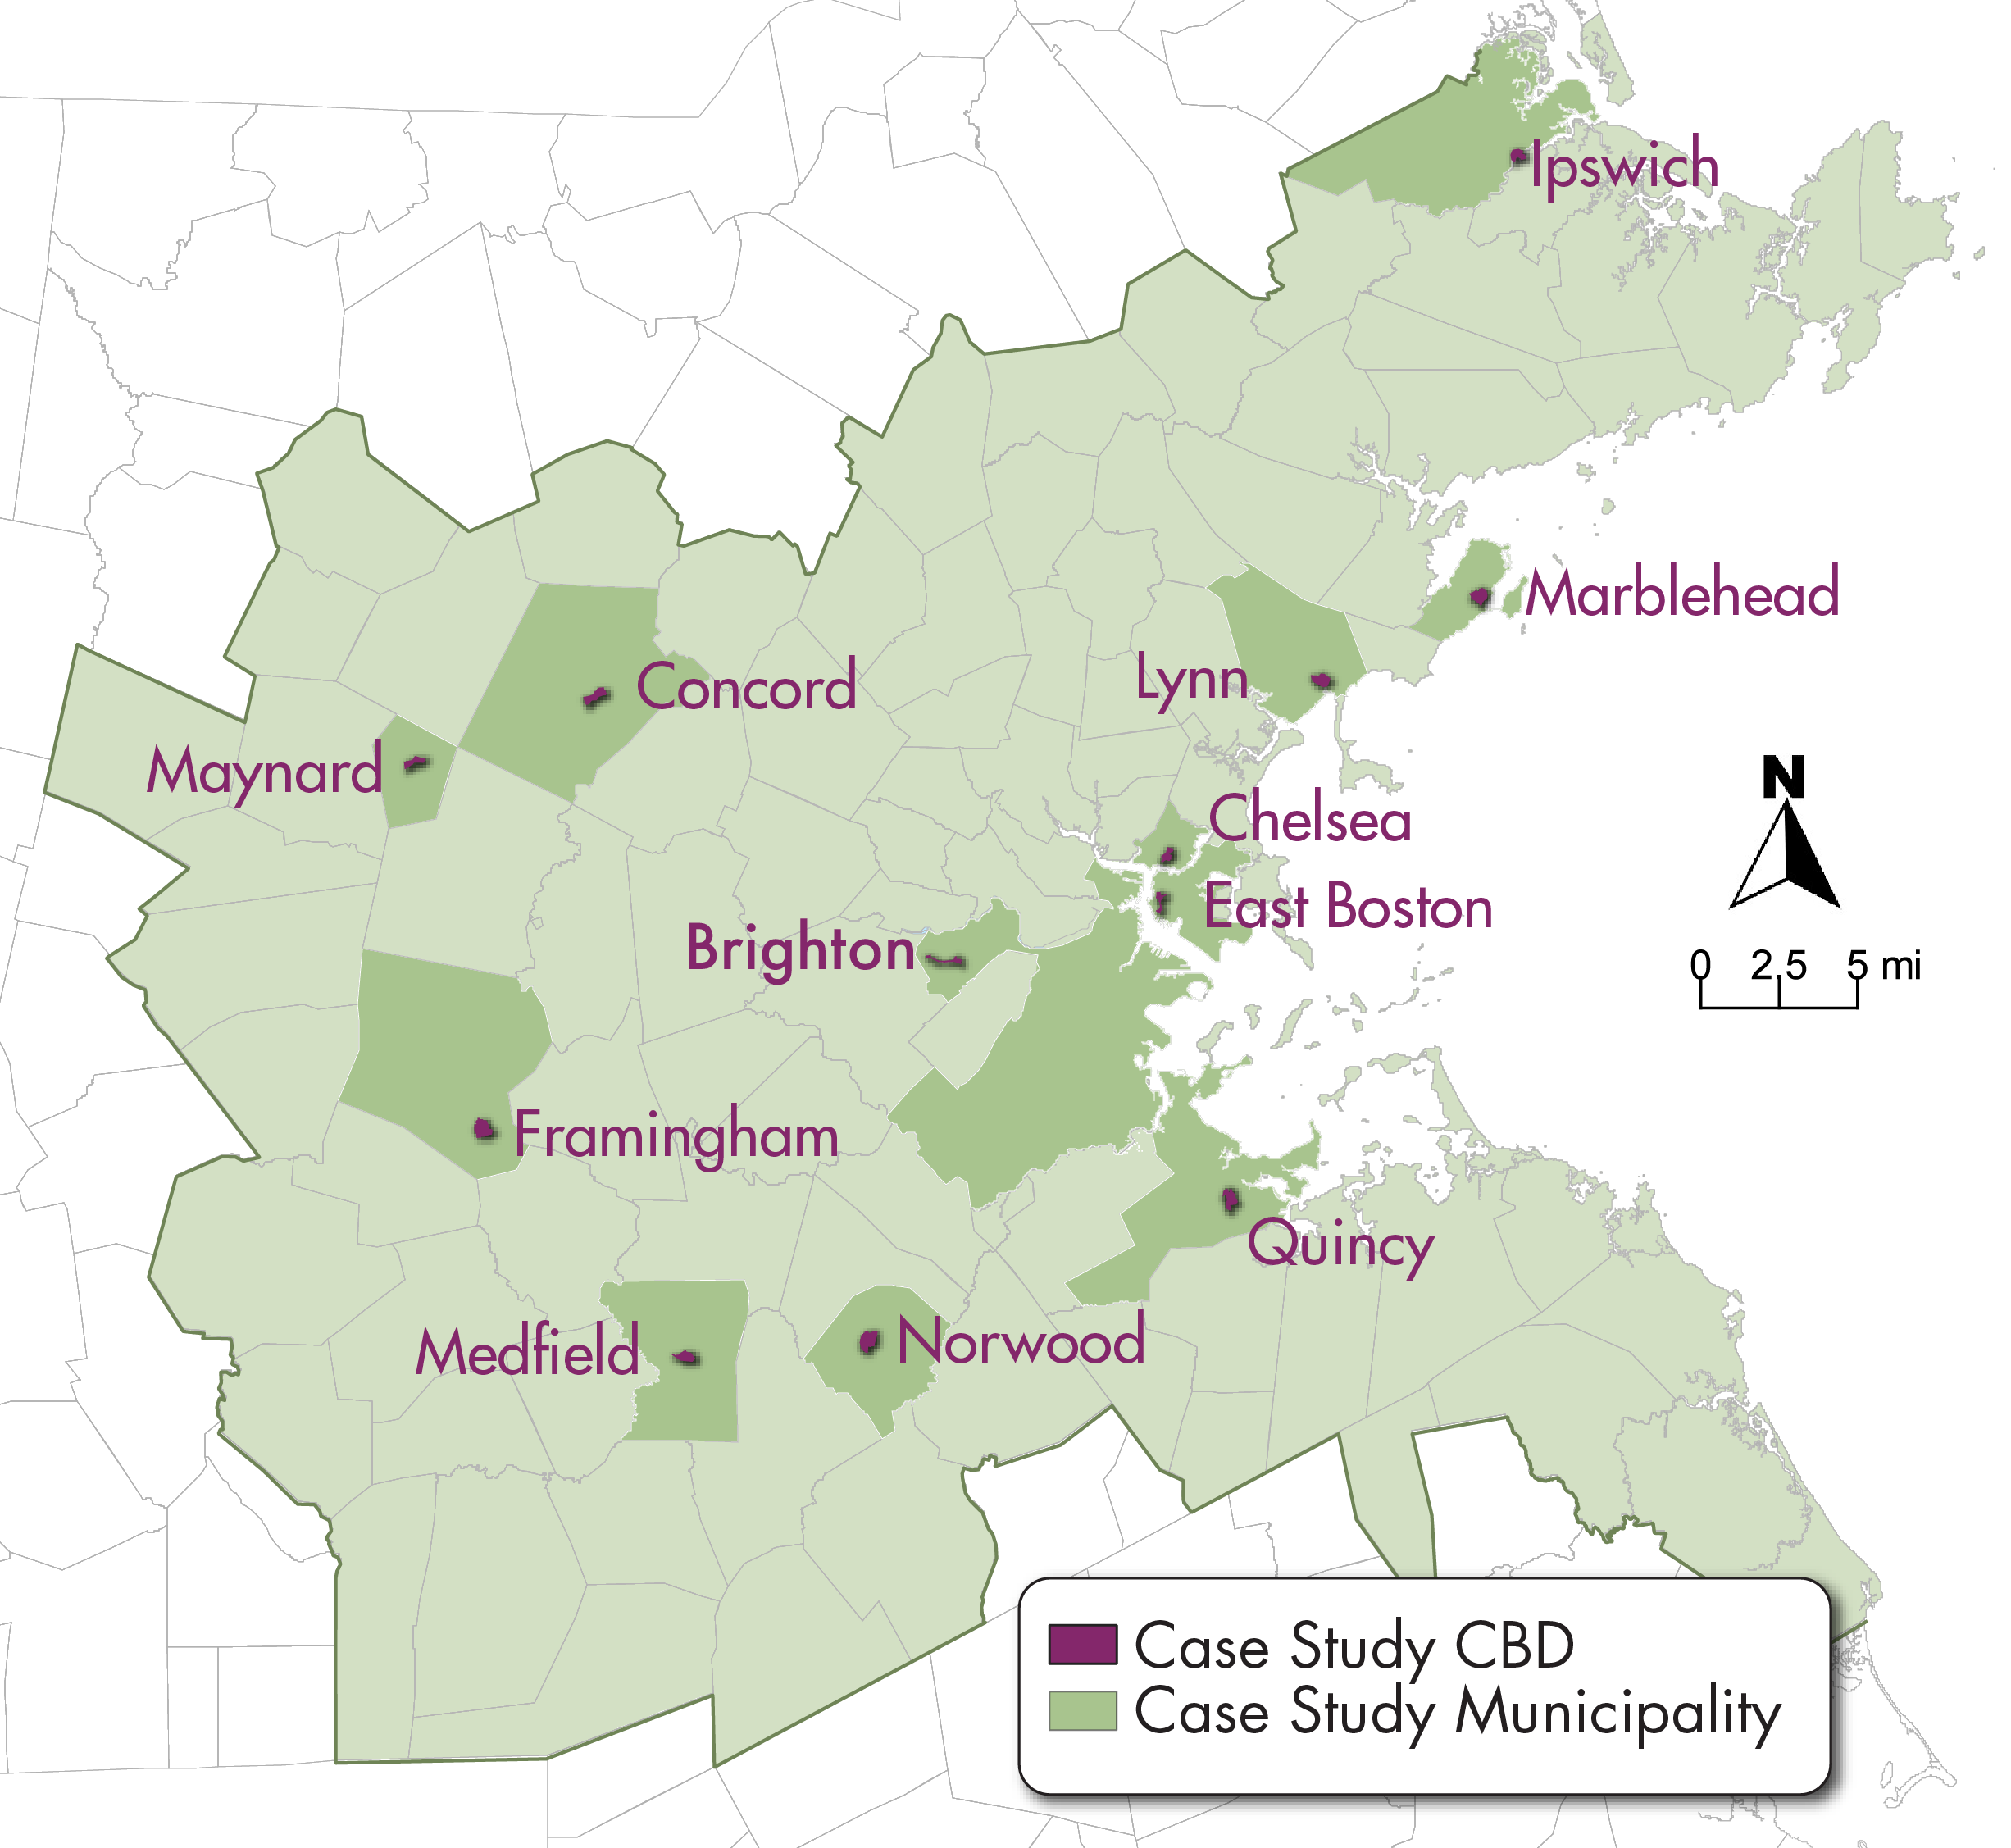
While some impacts of the COVID-19 pandemic have been felt across the region, not all impacts have been equally distributed. Differences in local economy, demographics, geography, infrastructure, and transportation options means that each municipality has faced its own unique set of transportation and economic challenges, as well as responses and solutions.
Life Under COVID-19: Economic and Transportation Challenges in CBDs in 2020
This section describes some of the economic and transportation challenges that the case study municipalities encountered during the pandemic.
Economic Challenges
The economic challenges described by interviewees related to the survival of businesses in CBDs due to changes in shopping patterns and health concerns. In response, some businesses adapted their business models to better serve customers who could not or who did not feel safe shopping in person. Some businesses that supported traditionally “in-person” jobs have changed their business models to limit the amount of time employees are in contact with customers and to increase delivery options. Changes like these, if permanent, could increase the amount of delivery vehicle traffic and decrease how often people visit CBDs to shop at physical stores.
While every municipality has had more people working remotely at least part of the time since March 2021, some were affected by this shift more than others, depending on the mix of businesses in their CBD.
For other municipalities, there were concerns about the effects of the sudden expansion of teleworking for businesses whose employees largely worked in an office prior to the pandemic. A few of the case study municipalities are home to company headquarters and/or major office parks, both which pose a particular challenge given the large number of employees who work out of those locations.
Transportation Challenges
Pandemic impacts to transportation have included changes to commuting patterns, public transit use, and amount of foot traffic in CBDs. Tourism has also been affected both positively and negatively—while the number of visitors was down throughout 2020, there has been a greater demand for outdoor recreation.
Strategies and Actions Used During the Pandemic
This section describes some of the strategies and actions used by the case study municipalities to address the economic and transportation challenges created by the pandemic.
Develop Cross-Sector Partnerships
Several municipalities worked closely with other municipal departments and the business community to support recovery efforts.
Leverage Municipal Strengths and Opportunities
Nearly all interviewees discussed undertaking recovery efforts that focused on their municipality’s strengths. Often, this was related to helping local businesses thrive. Several interviewees noted a greater sense of community and appreciation for local values and strengths.
Implement Quick-Build Projects
Many municipalities received a SS&S grant, which enabled the quick implementation of bicycle, pedestrian, transit, and other improvements to outdoor spaces to allow for safer travel during the pandemic. Some of these quick-build projects effectively served as pilot projects, which test new infrastructure in real time to help determine whether to make it permanent. Some of the projects are described under “Permit Outdoor Dining” and “Invest in Pedestrian and Bicycle Improvements,” below.
Permit Outdoor Dining
One of the most common infrastructure investments during the pandemic was permitting outdoor dining in public rights-of-way (ROWs). All interviewees reported establishing an outdoor dining program. These programs were generally considered successful and sparked interest in creating permanent programs.
Invest in Pedestrian and Bicycle Improvements
Many pedestrian and bicycle projects implemented during the pandemic were built on an accelerated schedule because of the increased interest and need for active transportation facilities and the newly available state and federal funding.
Invest in Placemaking Improvements
Placemaking is a planning and design process for investing in a community’s assets and histories while centering public engagement, with the goal of improving the economic, social, and environmental health of the community. It can take the form of many different types of investments, including transportation.
Opening Up the Commonwealth: Goals for Pandemic Recovery
Active Transportation and Public Space Goals
In general, the outdoor dining program was a big success and, in some municipalities, discussions are already underway on formalizing the program with a clear set of parameters on elements, such as design, accessibility, and maintenance.
Public Transit Goals
In several CBDs, a high share of essential workers has meant that public transit ridership remained robust during the pandemic. These municipalities seek to improve service and related infrastructure for these workers.
Barriers to Pandemic Recovery
Changing Remote Work Patterns
Changes to remote work patterns were of particular concern for those municipalities with a significant office-based workforce. Because of the presence of office parks and/or company headquarters, Ipswich, Quincy, and Framinghamexpressed concerns and uncertainty over the long-term impacts of the shift to remote work for many of the employees at these companies. This could affect not only their continued use of the buildings in these towns, but also the sustainability of businesses that rely on employees patronizing them.
Lack of Guidance for Creating New Programs
Several interviewees shared the uncertainty around and creativity needed to implement programs, especially around outdoor dining on public rights-of-way, that had little precedent in their municipality. They were therefore keen to share knowledge and work with others to create standard processes for these programs. Ipswich and Norwoodare interested in identifying design standards for public rights-of-way that are converted to outdoor dining spaces, parklets, and other similar uses, so that there is an aesthetic consistency that matches the town’s character.
Parking Concerns
While removing parking spaces received much less pushback than expected, this was not universal. Marblehead used a SS&S grant to create outdoor dining spaces for several restaurants. While the program was popular during the pandemic when traffic and parking demand was low, the town’s narrow roads and sidewalks meant there was limited space to accommodate both on-street parking and outdoor dining. The program’s popularity has prompted interest in exploring changes that would be necessary to make it permanent.17
Funding and Staff Capacity
Design and engineering can be a big financial commitment for many municipalities. A loss of revenue and high demand for emergency relief only made it difficult for some municipalities to move larger projects forward.
What Worked? Advice from Interviewees
[call out]
Be willing to experiment with new ideas and processes.
Use quick-build projects to get real-time public input and measure performance.
Pursue creative avenues for public engagement to reach more people.
Pursue collaboration with other municipalities to increase access to grants, undertake larger projects, and improve transportation connections.
Take advantage of funding opportunities to advance pre-pandemic agenda.
[end call out]
One of the themes that emerged from the interviews, focus group, and literature review conducted for this guidebook was that there is a lot of uncertainty around how the pandemic will shape transportation access to and in CBDs long term, and that recovery will require not only addressing transportation concerns, but concerns around housing, jobs, real estate, public health, and EJ.
This uncertainty—particularly since it is caused by an area outside of the traditional realm of transportation planning, public health—is unique and unprecedented. It calls for planners to look beyond conventional planning processes to ones that are long-term, multisectoral, and that encourage creativity and holistic thinking. Planning processes must address the uncertainty of the moment while enabling the development of actionable recommendations. Exploratory scenario planning (XSP) is one such tool. The XSP framework is specifically designed to support decision-making where there is a significant amount of uncertainty and where there are multiple, interconnected forces at play. Staff used a modified version of XSP to develop the recommendations in this guidebook, with the goal of providing planners and other decisionmakers with actionable investments (including both process-oriented and infrastructural) to help build resilient communities that thrive regardless of what the future brings.
The first part of this chapter describes the XSP process that staff used to develop these recommendations. It is structured so that readers can see an example of how such a process is carried out should they wish to undertake XSP. The second part contains the recommendations, including resources—both financial and narrative—under each recommendation.
XSP: A Brief Primer
The Federal Highway Administration defines XSP as
Scenarios designed around uncertain futures [to] help identify potential ‘what-ifs’ that can be assessed and considered relative to how they might positively or negatively impact community and transportation goals. From these insights, participants can identify a set of resiliency strategies or key actions that are beneficial regardless of which future scenario comes to be.18
Because of its adaptability, XSP has been used by many actors, from state departments of transportation, to MPOs, to the national park service, to the US military. The XSP processes acknowledge that while the future cannot be known, practitioners can seek to understand the drivers that will affect the future and identify robust strategies and actions that will allow communities, businesses, or other entities to thrive no matter what the future ends up being.
A full XSP process typically consists of engaging a stakeholder group over several workshops centered around a focal question of interest to the group. The group brainstorms driving forcesthat will likely affect the future and that relate to the focal question. The driving forces are then divided into critical certainties and critical uncertainties. These are used to develop several possible future scenarios that are most relevant to the focal question. Finally, the group identifies no- or low-regret and high-impact actions that they, or other actors, could pursue to respond to the threats and desirable opportunities identified in each scenario.19
One of the benefits of XSP is that it is a flexible framework; an XSP process can range from a multiyear process using complex modeling tools to a thought exercise spanning several weeks, depending on the resources and tools available. For this guidebook, staff undertook a lightweight, modified version of XSP, the steps for which are shown in Figure 3.1. It is modified in that, instead of stakeholder workshops, staff used input from the municipal interviews, the focus group, and a literature review to work through the process.
Figure 3.1
Modified Exploratory Scenario Planning Process
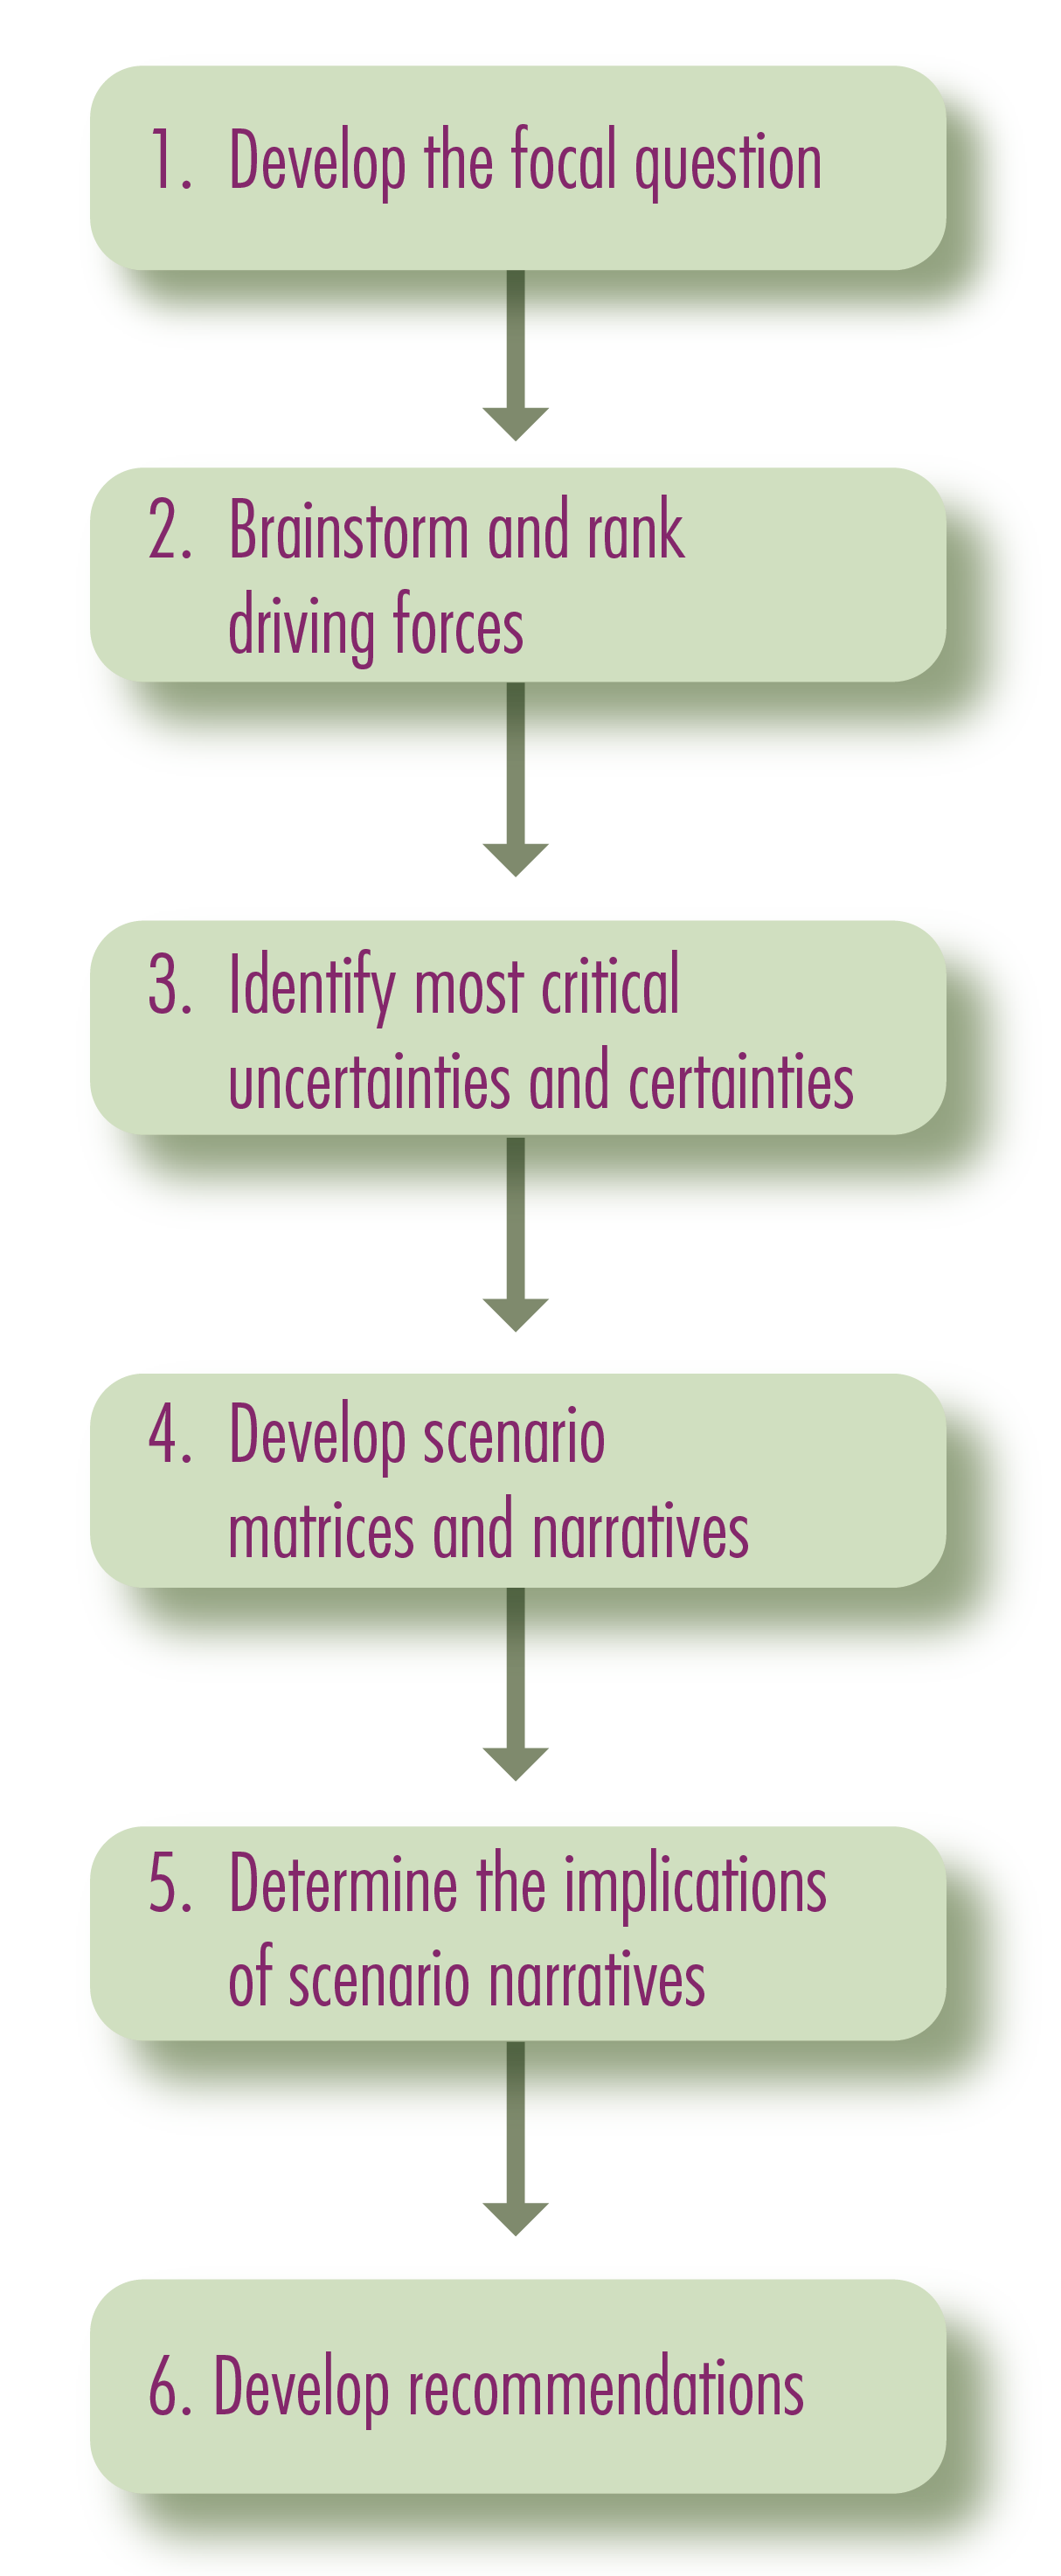
Note: Adapted from How to Use Exploratory Scenario Planning (XSP): Navigating an Uncertain Future. Lincoln Institute of Land Policy, August 2020.
[call out]
Driving Forces: drivers of economic, demographic, social, environmental, or technological change that are relevant to the focal question
Focal Question: question that frames the mission of a particular XSP process
Critical Certainties: driving forces that are inevitable or known
Critical Uncertainties: driving forces that are likely, but for which the magnitude and/or direction are uncertain
Scenario: a distinct potential future developed based on the projected outcome of selected uncertainties
[end call out]
Guiding Principles for Developing Recommendations
The recommendations in this chapter are grounded in several guiding principles regarding priorities for the Boston region’s transportation system. These principles support the transportation vision set by the Boston Region MPO, supported with extensive public input, in its most recent Long-Range Transportation Plan, Destination 2040. The vision states that
The Boston Region Metropolitan Planning Organization envisions a modern, well-maintained transportation system that supports a sustainable, healthy, livable, and economically vibrant region. To achieve this vision, the transportation system must be safe and resilient; incorporate emerging technologies; and provide equitable access, excellent mobility, and varied transportation options.
The following principles, which are consistent with the vision, were used to guide the specific strategies and actions described in this chapter. The recommendations seek to
Using XSP to Develop Recovery Scenarios and Recommendations
Developing the Focal Question
The focal question frames the mission of the XSP process. For this guidebook, it was developed based on the scope of work developed for this study. For the XSP process undertaken for this guidebook, the focal question was:
How can CBDs in the Boston region build resilient transportation infrastructure and processes that allow them to recover from COVID-19 and its impacts on transportation access to and within CBDs?
Brainstorming and Ranking Driving Forces
Staff then identified the driving forces that are most likely to shape the future of transportation in Boston region CBDs. The driving forces relate to transportation, as well as other areas, such as public health, economic development, and housing, that will have bearing on the future. These were then organized based on 1) how uncertain they are, and 2) their importance to the focal question. While the ranking is not definitive, it provides a sense of which driving forces may be of most concern to pandemic recovery in CBDs. Figure 3.2 shows the ranking of driving forces by level of uncertainty (y-axis) and level of importance to the focal question (x-axis).
Figure 3.2
Driving Forces Ranked by Importance and Uncertainty
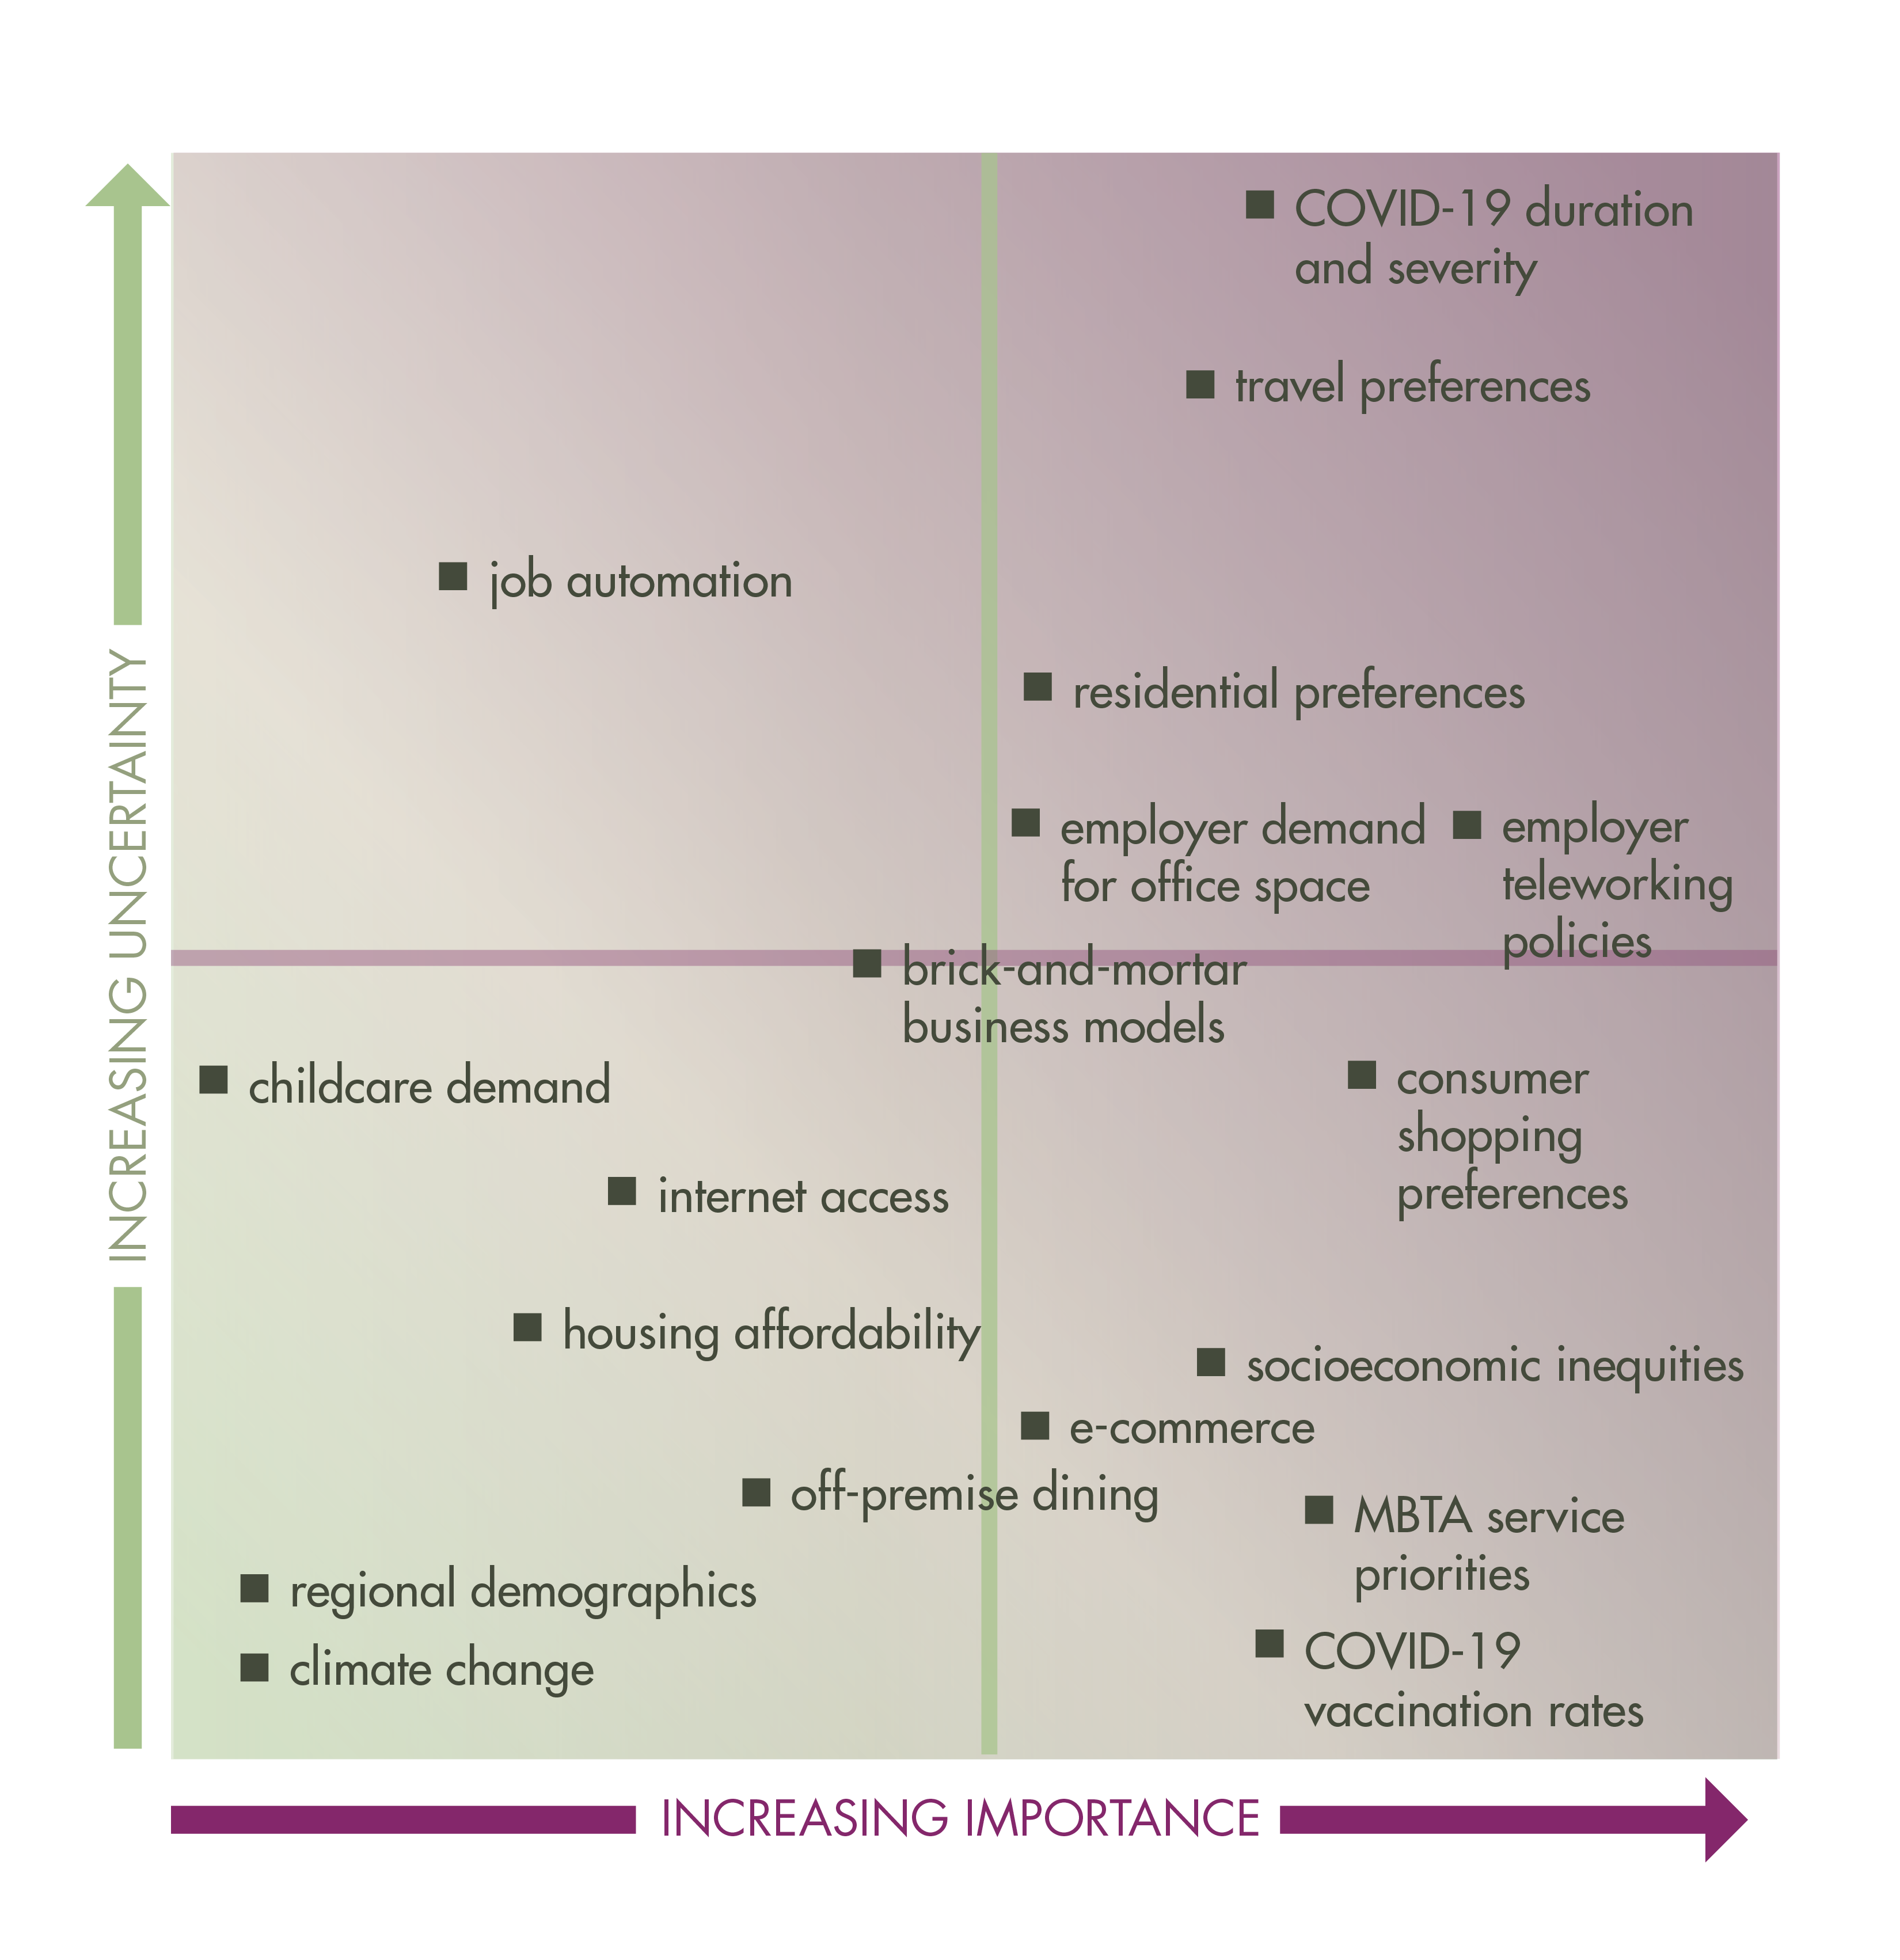
MBTA = Massachusetts Bay Transportation Authority
Identifying Critical Uncertainties and Certainties
Using the driving forces shown in Figure 3.2, staff identified those that are critical certainties and those that are critical uncertainties. Critical certainties are already occurring or will happen—they are common to all futures—while critical uncertainties are those forces that would lead to divergent futures depending on their direction and magnitude.20 Of the driving forces shown in Figure 3.2, those that are both certain and important (lower right quadrant) are critical certainties and those that are both uncertain and important (upper right quadrant) are critical uncertainties.
Table 3.1 lists the driving forces in those two quadrants and identifies whether they are critical certainties or critical uncertainties. Note that the driving forces in the upper and lower left quadrants are not unimportant. They are simply less relevant to the focal question and therefore can be set aside for the purposes of this guidebook.
For space purposes, the driving forces are not described in-depth here; see the Appendices for a discussion of the current trends and possible impacts of these driving forces on CBD recovery.
Table 3.1
Summary of Driving Forces, Critical Certainties, and Critical Uncertainties
Category |
Driving Forces |
Description |
Critical Certainty |
Critical Uncertainty |
Public Health |
COVID-19 vaccination rates |
Vaccination rates in the Boston region are high |
x |
|
|
COVID-19 duration and severity |
Length of the pandemic, severity of outbreaks, and whether worse virus variants emerge |
|
x |
Transportation |
Travel preferences |
Residents’ preference for driving versus walking or bicycling versus public transit |
|
x |
|
MBTA service priorities |
MBTA is prioritizing shifting to a regional rail service model for commuter rail and improving service for transit-critical populations |
x |
|
Jobs and Economy |
Employer teleworking policies |
Employer policies regarding the extent to which employees can telework |
|
x |
|
Consumer shopping preferences |
Consumer preferences for shopping in CBDs compared to other options (such as malls or other large shopping centers and online) |
|
x |
|
Brick-and-mortar business models |
CBD businesses adapting their business models to address consumer safety concerns regarding COVID-19 and resulting shopping preferences |
|
x |
|
Socioeconomic inequities |
Continuing income wealth gaps, particularly for people of color |
x |
|
|
E-Commerce |
Growth of online shopping |
x |
|
Real Estate/Housing |
Residential preferences |
Preferences among the region’s residents for where they want to live, particuarly as it pertains to the urban core compared to suburban and rural areas |
|
x |
|
Employer demand for office space |
Employers preference for office space for their workforce, particularly in CBDs |
|
x |
CBD = commercial business district. MBTA = Massachusetts Bay Transportation Authority.
Developing Scenario Matrices and Narratives
Once critical uncertainties are identified, each can be placed on an axis with desirable outcomes on one side and undesirable ones on the other. For example, Figures 3.3a and 3.3b show the axes for two uncertainties: employer teleworking policies and the economic success of CBDs. The actual future will likely fall somewhere between the two extremes for any given uncertainty.
Figure 3.3a
Defining the Uncertainty Axis: Employer Teleworking Policies
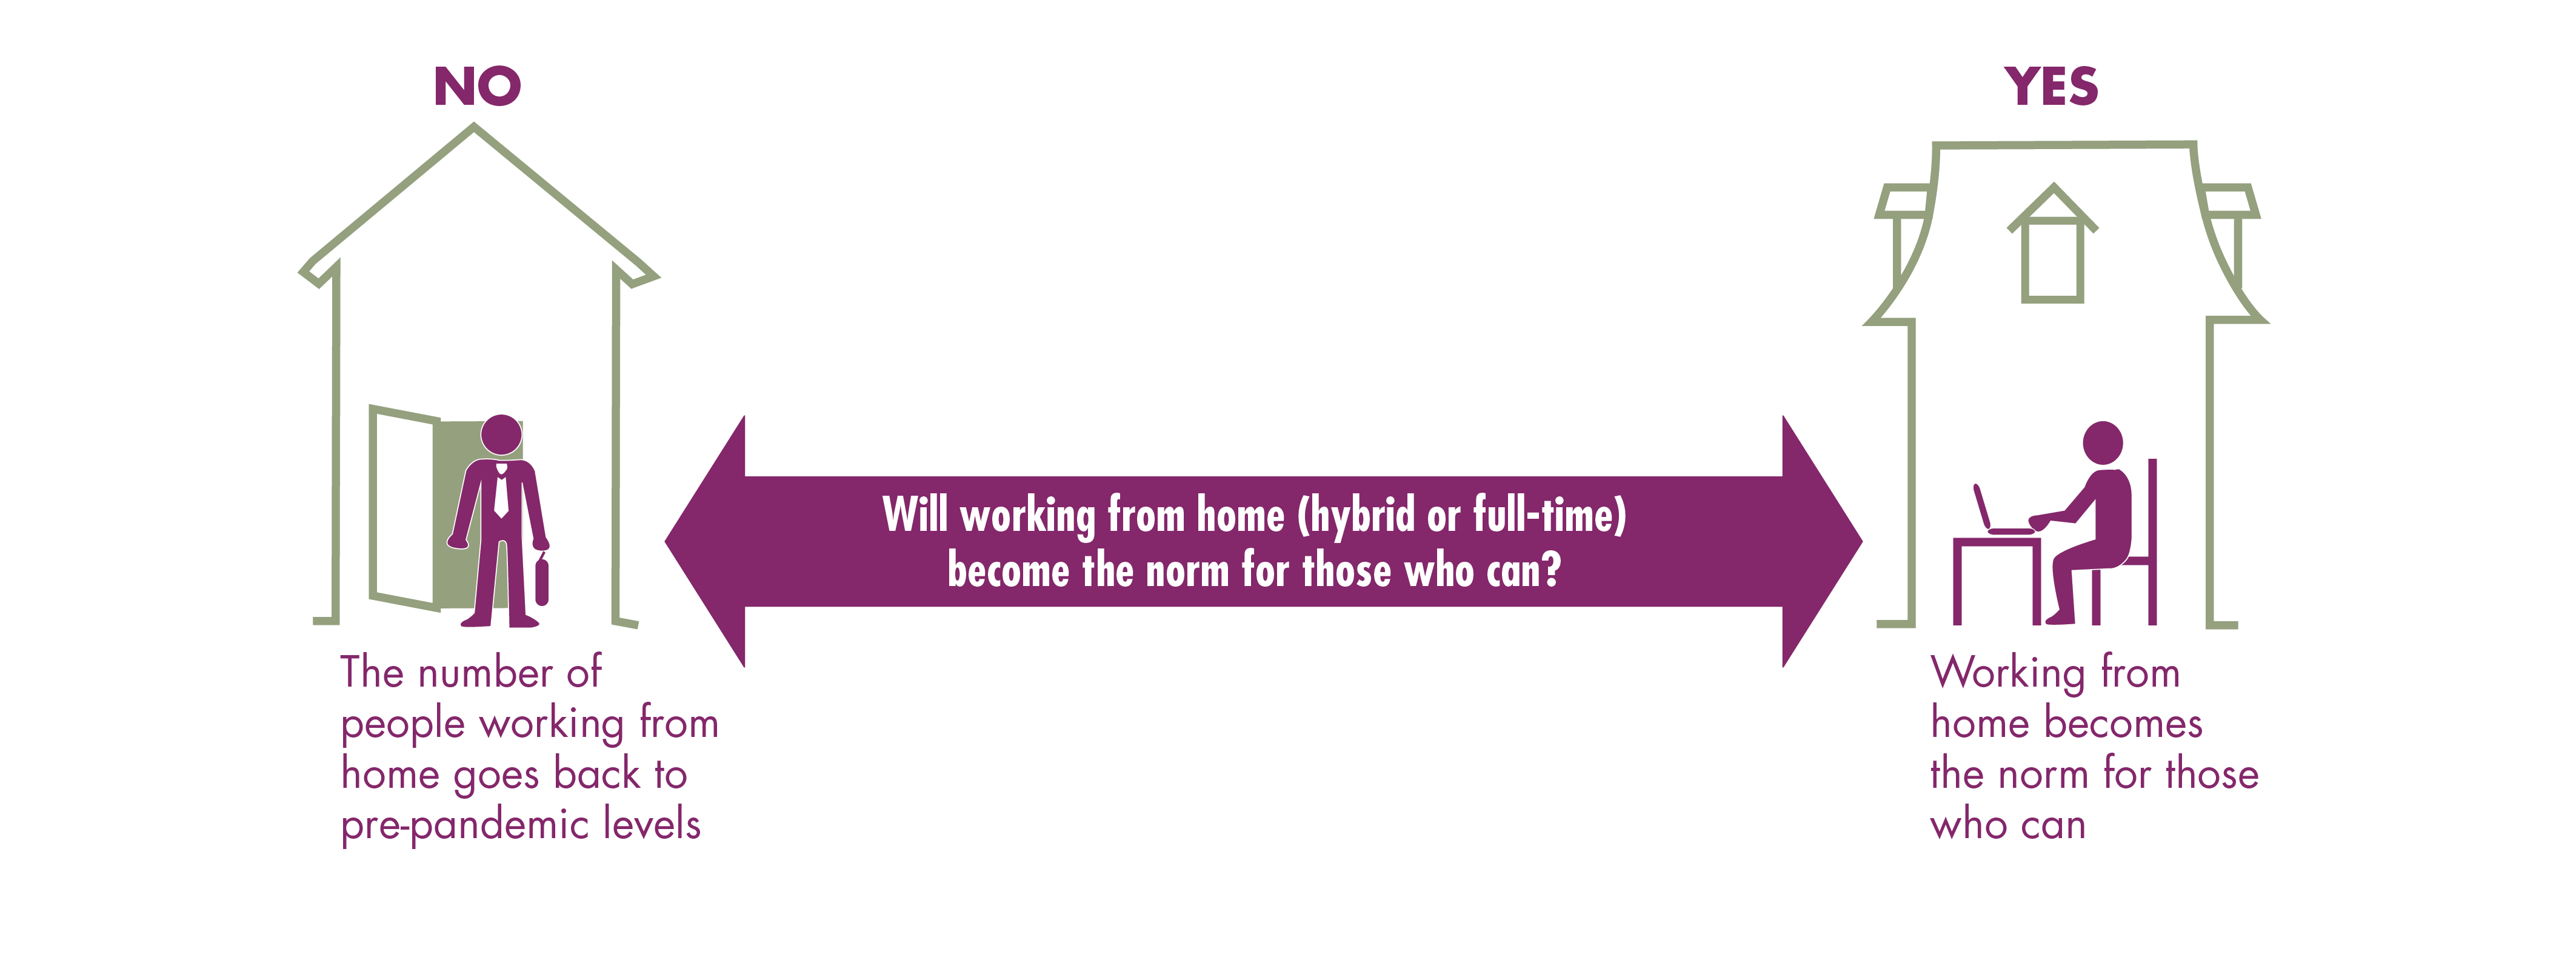
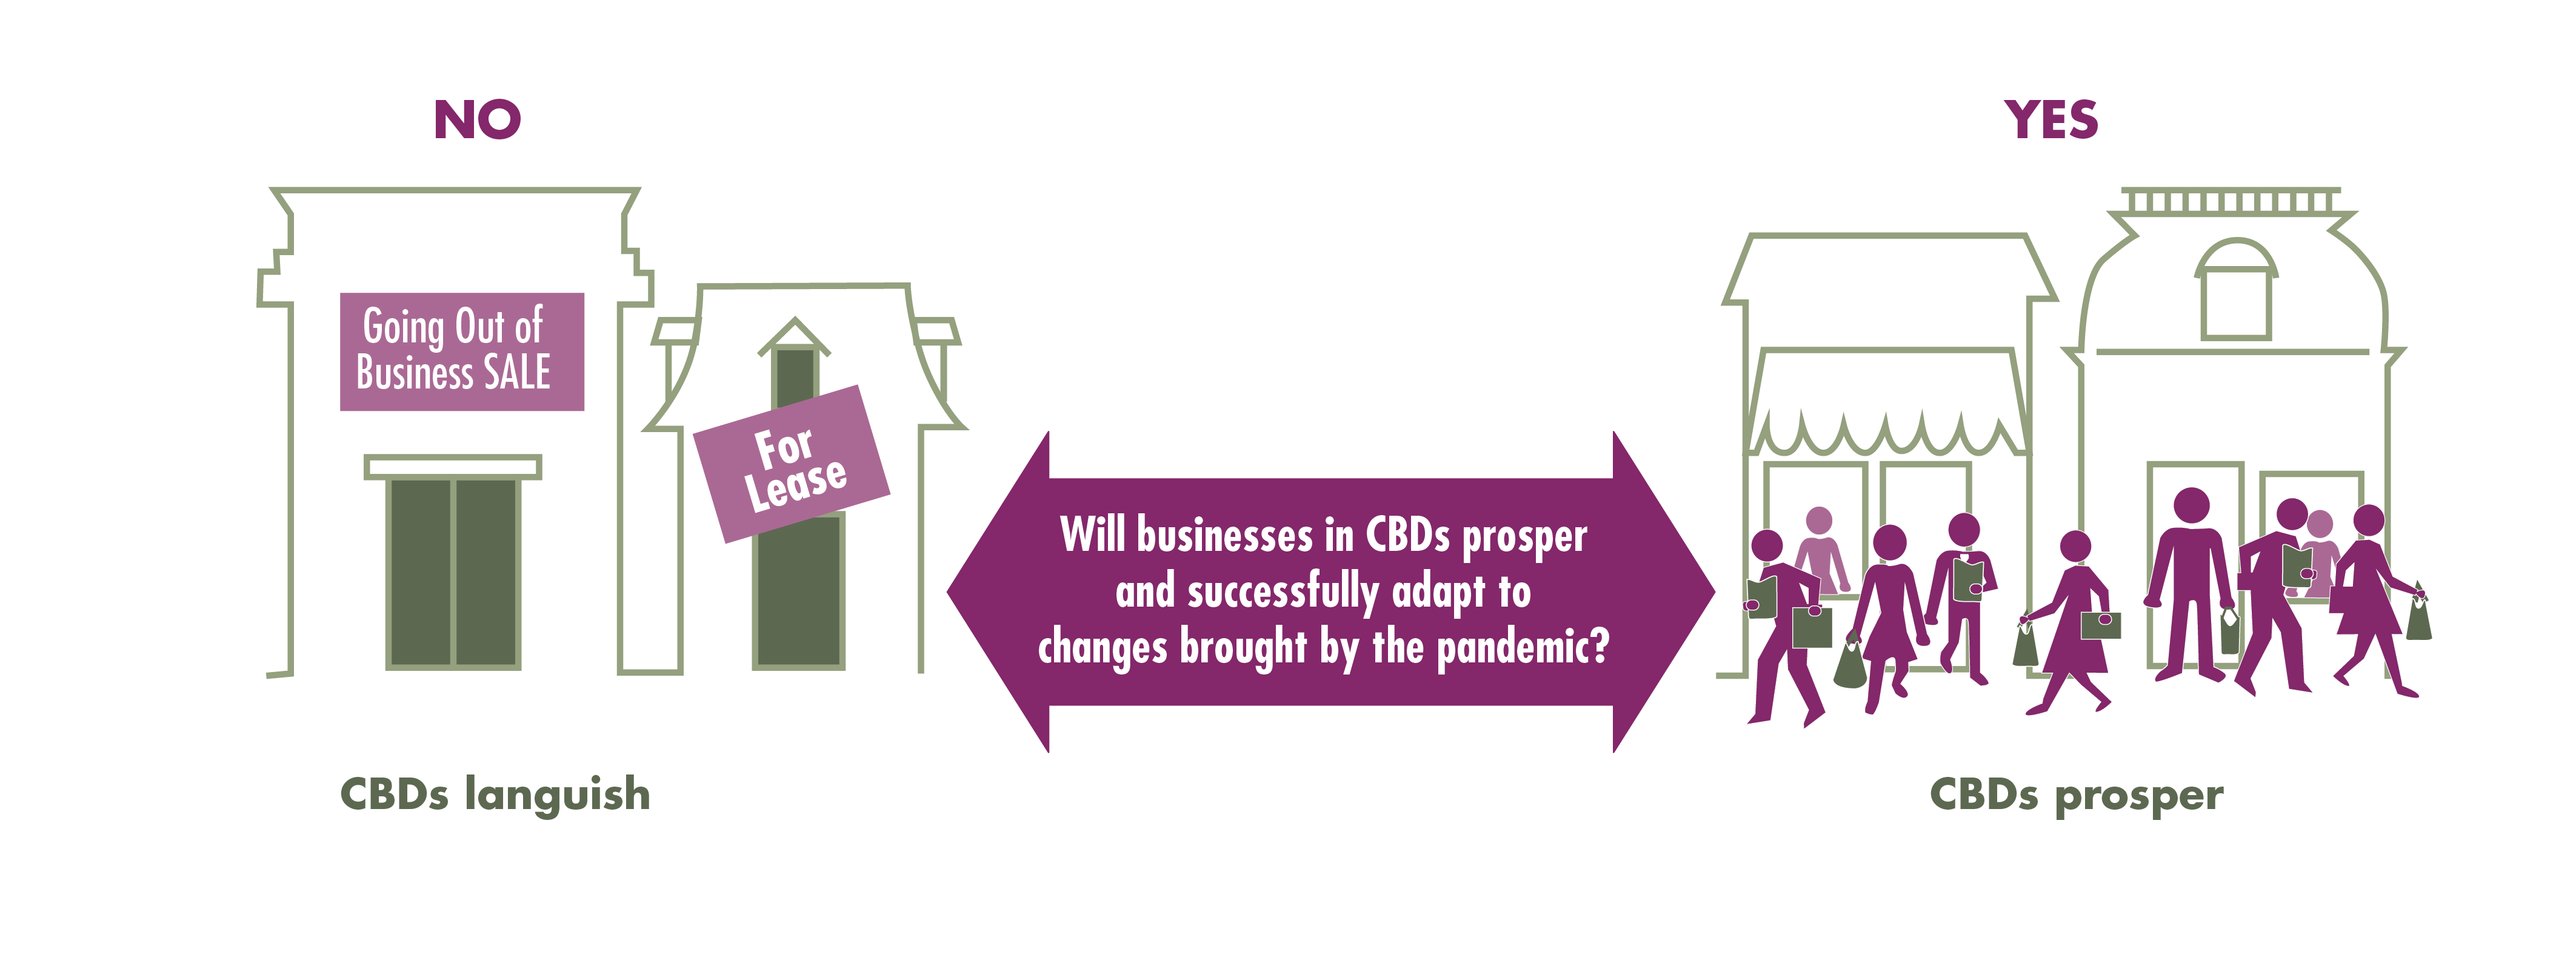
Figure 3.3b
Defining the Uncertainty Axis: The Economic Success of Commercial Business Districts
Using these two uncertainties, staff then crossed the two axes to create the uncertainty matrix shown in Figure 3.4. The goal of the matrix is to produce four plausible, relevant, and divergent scenarios—one in each quadrant. There are many possible scenarios that could be developed using the uncertainties presented in Table 3.1. These two uncertainties were chosen since they are the most relevant to the focal question and are independent of each other.
Staff then crafted narratives for each of the four scenarios, one for each of the quadrants in Figure 3.4. The narratives describe what the Boston region could look like under that future scenario and the roles the previously described certainties and uncertainties could play in it. These narratives do not describe what will happen but serve as a thought exercise to better understand how the different certainties and uncertainties could interact if the extremes on each uncertainty axis (Figures 3.3a and 3.3b) come to pass.
Figure 3.4
Scenario Matrix: The Number of People Working Remotely and Commercial Business District Prosperity
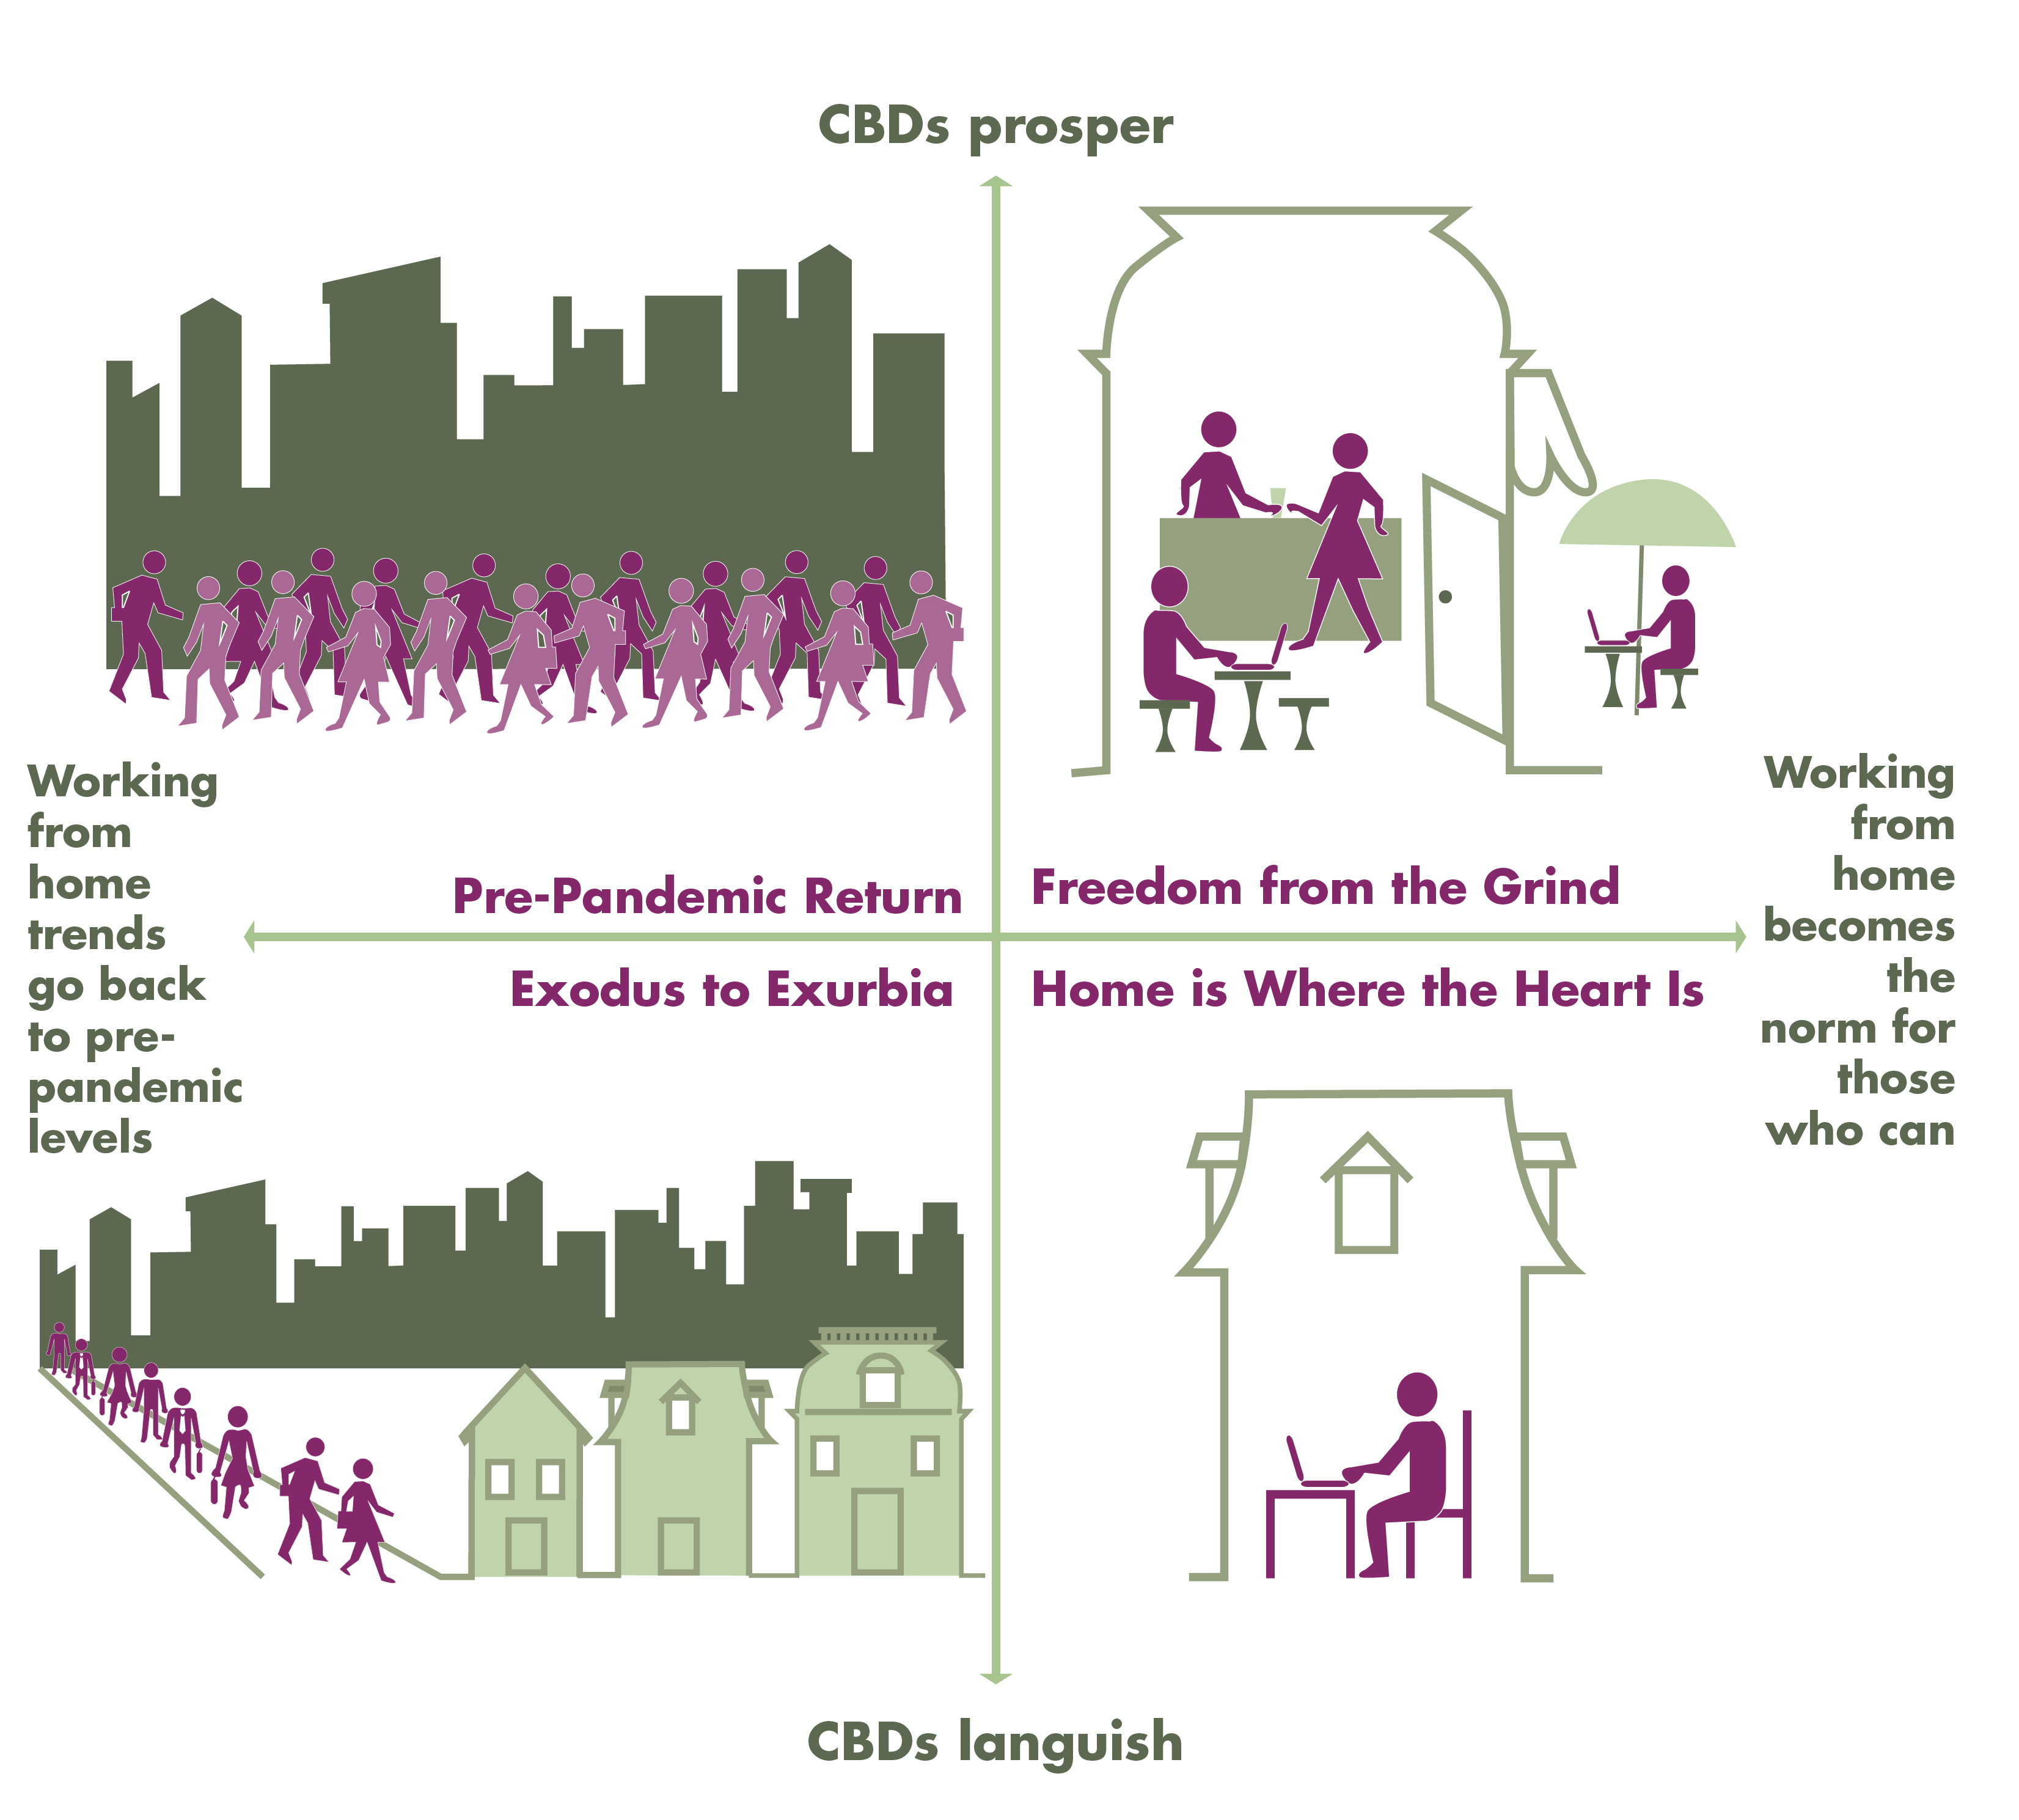
* While it is an imprecise term, “white collar worker” is used in this guidebook as shorthand for those who work predominantly in a professional office environment and are likely able to work from home for at least part of their work week.
CBD = commercial business district.
[4 call out boxes are attached to this figure]
[Pre-pandemic Return call out 1]
The pandemic has receded quickly in Massachusetts because of the high vaccination rate. Eager to put that memory behind them, employers call their workers back to the office. Workers who moved to smaller towns or rural areas during the pandemic respond by moving back to the Boston area. The region’s CBDs respond by leveraging their strengths to draw new visitors and residents and continuing to build outdoor public space and active transportation infrastructure. However, state policies are not in place to support new housing development and there is little interest from municipalities to take it up on their own. This exacerbates housing demand, making it even more difficult to find affordable housing. The MBTA and other regional transit authorities struggle to adapt services quickly enough to serve low-income residents as they seek more affordable communities. Investment in a true regional rail system proves popular for white collar commuters, but the dichotomy with the poor service for the disenfranchised furthers inequities in an already inequitable region.
[end call out 1]
[ Exodus to Exurbia call out 2]
The number of people working remotely returns to pre-pandemic levels, but CBDs are left behind. The pandemic is over, or COVID-19 is a low-key endemic disease and employers decide that they want employees in the office, at least most of the time. But workers who experienced remote work during the pandemic preferred it. Some switch jobs so they can have a shorter commute. Others continue to commute to Boston and other inner core municipalities. CBDs further out are taking advantage of this shift, but the cost is high as gentrification takes hold in towns where it had not been a problem before. Meanwhile, CBDs closer to Boston are struggling with this shift. Commuter rail stations in inner core CBDs have lower ridership, while additional stations further afield are being planned. With such long commutes, workers have less and less time to spend in their new communities.
[end call out 2]
[Freedom from the Grind call out 3]
Pandemic or not, CBDs have the amenities people want. Most people in the region are vaccinated and the pandemic has receded or has become a low-grade endemic illness. However, workers who are able plan to continue working remotely most of the time. With the regular nine-to-five commute less common, traffic patterns established during the pandemic remain: weekday traffic dispersed throughout the day and weekend traffic is high. The MBTA adapts: a regional rail system serves those who need to travel to the office (although ridership is low) and weekend recreational trips. Redesigned bus routes meet the needs of essential workers. With more time on their hands, people who work remotely move to communities with lots of amenities, outdoor space, community activities, and arts and entertainment. Many CBDs thrive, although without commitment to building more affordable housing, some become very expensive and unaffordable for all but the wealthy. A few CBDs are not able to participate in this prosperity, having not capitalized on the opportunity to support active transportation, placemaking efforts, and outdoor amenities that were so critical during the pandemic.
[end call out 3]
[Home is Where the Heart is call out 4]
Working remotely is much more common, while CBDs languish and struggle to recover economically from COVID-19. In this future, the pandemic is still raging or has become serious and endemic. Commute traffic has maintained its pandemic-era patterns: dispersed throughout the weekday and highest on the weekends as people stick to their vehicles for recreational trips. Public transit ridership is middling, successfully serving the essential workers who need it most, but without the need to go to the office, white collar workers have for the most part stopped riding in favor of individual transportation modes.* They have also moved out of the inner core municipalities, favoring more rural and small-town communities since they no longer have a daily commute. Residents are still nervous about being in close quarters with other people since very little effort has been made to expand the pandemic era creation of wider sidewalks, new bike lanes, and more public space in general.
[end call out 4]
Determining the Implications of Scenario Narratives to Develop Recommended Strategies and Actions
With the development of these narratives, staff assessed the implications of each scenario on CBD and transportation recovery. Low- or no-regret strategies and actions were identified that could address the threats and support desirable opportunities in most or all scenarios. Threats include continued racial and economic inequities, increases in congestion, and climate change. Opportunities include continued preference for bicycling and walking, a public transit network that meets the needs of essential workers, and more pedestrian traffic in CBDs. Table 3.2 lists these recommendations and their relationship to the driving forces.
Table 3.2
Recommended Strategies and Actions and their Relationship to Driving Forces
| Recommended Strategy or Action |
COVID-19 Duration and Severity |
Travel Preferences |
Employer Teleworking Policies |
Consumer Shopping Preferences |
Brick-and-mortar Business Models |
Residential Preferences |
MBTA Priorities |
Employer Demand for Office Space |
||||||||
|---|---|---|---|---|---|---|---|---|---|---|---|---|---|---|---|---|
Collaborate with Other Municipalities |
Negligible support |
Supports adaptation |
Supports adaptation |
Negligible support |
Negligible support |
Negligible support |
Supports adaptation |
Negligible support |
||||||||
Develop Cross-Sector Partnerships |
Negligible support |
Negligible support |
Negligible support |
Negligible support |
Supports adaptation |
Negligible support |
Supports adaptation |
Supports adaptation |
||||||||
Develop a Curb Management Plan |
Negligible support |
Supports adaptation |
Negligible support |
Supports adaptation |
Supports adaptation |
Negligible support |
Negligible support |
Supports adaptation |
||||||||
Establish Municipal Processes for Outdoor Dining Programs |
Supports adaptation |
Negligible support |
Negligible support |
Supports adaptation |
Supports adaptation |
Negligible support |
Negligible support |
Supports adaptation |
||||||||
Incorporate Climate Resiliency into all Projects |
Negligible support |
Negligible support |
Negligible support |
Negligible support |
Negligible support |
Negligible support |
Negligible support |
Negligible support |
||||||||
Leverage Municipal Strengths and Opportunities |
Negligible support |
Negligible support |
Supports adaptation |
Supports adaptation |
Supports adaptation |
Supports adaptation |
Supports adaptation |
Supports adaptation |
||||||||
Implement Quick-build Projects |
Supports adaptation |
Supports adaptation |
Negligible support |
Supports adaptation |
Supports adaptation |
Supports adaptation |
Negligible support |
Negligible support |
||||||||
Improve Access to Outdoor Public Spaces |
Supports adaptation |
Supports adaptation |
Supports adaptation |
Negligible support |
Negligible support |
Supports adaptation |
Supports adaptation |
Negligible support |
||||||||
Invest in Pedestrian and Bicycle Improvements |
Supports adaptation |
Supports adaptation |
Supports adaptation |
Supports adaptation |
Supports adaptation |
Negligible support |
Supports adaptation |
Supports adaptation |
||||||||
Invest in Public Transit Infrastructure that Supports Service for Essential Workers |
Negligible support |
Supports adaptation |
Supports adaptation |
Supports adaptation |
Supports adaptation |
Supports adaptation |
Supports adaptation |
Supports adaptation |
||||||||
Pursue Equitable Public Engagement Strategies |
Negligible support |
Negligible support |
Negligible support |
Negligible support |
Negligible support |
Negligible support |
Supports adaptation |
Negligible support |
||||||||
Support Improved Access toward the Implementation of a Regional Rail System |
Negligible support |
Supports adaptation |
Supports adaptation |
Negligible support |
Supports adaptation |
Supports adaptation |
Supports adaptation |
Supports adaptation |
||||||||
Note: Only driving forces that are uncertain are included.
MBTA = Massachusettts Bay Transportation Authority
These recommendations focus on transportation that can be initiated or implemented by municipalities. Housing, land use, and other types of actions are included to encourage municipalities to consider the interactions between different areas of planning and how these departments can support a municipality’s transportation goals.
Recommended Strategies and Actions
This section describes the recommendations from Table 3.2 in more detail. The recommendations are organized into two categories: programmatic/infrastructural and systematic. Each recommendation box contains a brief description of the recommendation, examples from the case studies (see the guidebook’s Appendices), approximate implementation timeframes, and links to resource documents, funding, and technical assistance opportunities. Time frames are estimates for completion, and may vary. Short-term time frames are about one year, medium-term time frames are about one to three years, and long-term time frames are more than three years.
The funding and technical assistance opportunities listed have consistent funding streams. Grant programs that are COVID-specific and whose continuance are uncertain have not been included. For these and a full list of funding opportunities in Massachusetts, see the MassDOT funding for community transportation website and the Commonwealth’s community grant finder. In addition, Grants.Gov contains a full database of grants available from the federal government. Grant information is current as of September 2021.
Systematic
Recommendations
Collaborate with Other Municipalities
Some grant programs explicitly recommend collaboration with other municipalities, including MassDOT’s Community Transit Grant Program. In addition to helping secure grant funding, collaboration improves transportation access between municipalities since an individual’s trips are not limited to their municipality. An example of a successful partnership is the CrossTown Connect Transportation Management Association, which is a public-private partnership that provides several shuttle services in the northwestern part of the Boston Region MPO area.
Example from Case Studies:
Implementation Timeframe: Medium
Resources:
Funding Opportunities and Technical Assistance:
Develop Cross-Sector Partnerships
Because transportation touches many aspects of the built environment, collaboration between municipal departments is critical to implementing many transportation projects. Doing so can streamline processes, develop effective and creative solutions, and reduce costs. Collaborating can also help smooth out the implementation of transportation projects or programs and address potential problems ahead of time. In addition, during a time of new challenges and rapid changes, regular collaboration with other departments can lead to innovative solutions.
Examples from Case Studies
Implementation Timeframe: Medium
Resources:
Funding Opportunities and Technical Assistance:
Develop a Curb Management Plan
Developing a curb management plan standardizes the use of curb space to align with municipal goals and community needs. While on-street parking may be desirable for some, it is often not the best use of a space that is in high demand from other curb uses. This includes local delivery trucks, ride-hailing vehicles, bus stops, parklets, green infrastructure, road safety measures, such as bulb-outs, and more recently, on-street dining. Before and after studies can help identify the transportation modes used to access a CBD and the impact of a management plan. Using processes developed to implement quick-build projects during the pandemic could be replicated by testing out pilot curb management strategies to identify the most effective ones and generate business support.
Examples from Case Studies:
None
Implementation Timeframe: Short
Resources:
Funding Opportunities and Technical Assistance:
None
Establish Municipal Processes for Outdoor Dining Programs
Providing space for outdoor dining—whether for public parklets or an individual restaurant—sits at the nexus of transportation and economic development. Existing public ROWs (usually parking spaces, sidewalks, or low-trafficked streets) are usually repurposed. The COVID-19 pandemic has prompted an expansion of these efforts, with minimal pushback and significant public support. Developing an outdoor dining program can help support local businesses, reduce car traffic, and increase foot traffic downtown. Keys to success include:
Example from Case Studies:
Implementation Timeframe: Short
Resources:
Funding Opportunities and Technical Assistance:
Incorporate Climate Resiliency into all Projects
Because climate change is already affecting the Boston region, it is critical that transportation projects are built to be resilient in the face of these impacts (flooding, for example). Investing in bicycling, walking, and public transit facilities can also reduce greenhouse gas emissions, as can increasing the amount of green space. Investment should prioritize those communities that are especially vulnerable due to their location (such as near water bodies that frequently flood) and whose residents are more susceptible to negative impacts and less able to adapt to climate change effects (such as people with low-incomes and the elderly).
Examples from Case Studies
None
Implementation Timeframe: Long
Resources:
Funding Opportunities and Technical Assistance:
Leverage Municipal Strengths and Opportunities
Understanding a municipality’s strengths and opportunities—whether they are economic, environmental, historic, or transportation-related—can help planners identify funding programs to apply to, and program and projects that leverage those strengths and opportunities. Planners should also consider possible threats, such as climate change, as well as opportunities to make investments that capitalize on the municipality’s strengths, such as outdoor recreational space. XSP can help with this, as can a more formal assessment, such as a strength, weaknesses, opportunities, and threats (SWOT) analysis or a community needs assessment.
Examples from Case Studies:
Implementation Timeframe: Long
Resources:
Funding Opportunities and Technical Assistance:
Below are two examples that require applications to consider municipal strengths and opportunities:
Pursue Equitable Public Engagement Strategies
Public engagement should reflect the needs and backgrounds of residents and prioritize communities that have been denied participation in and benefits of transportation. Doing so also creates buy-in, which is especially important for investments or programs that are new or unfamiliar to residents. Engagement should be done as early in the project development process as possible. While public engagement can be time consuming, it is critical to the success of any project and, more importantly, helps ensure that the transportation investment addresses the needs of residents, especially those who have historically been disenfranchised in the transportation planning process. Strategies should include:
Examples from Case Studies:
Implementation Timeframe: Medium
Resources:
Funding Opportunities and Technical Assistance:
Programmatic and Infrastructural Recommendations
Implement Quick-build Projects
The success of the SS&S Grant Program demonstrated the public’s desire for shared outdoor spaces. Some municipalities used SS&S grants to pilot roadway changes to determine the viability of making these projects permanent. Initiating a project as a pilot is a low-risk, low-cost way to test ideas and engage the public in the development of new transportation improvements. While none of the municipalities interviewed formally evaluated SS&S projects, Arlington conducted two consumer surveys (one in 2020 and one in 2021) to get feedback on safety measures that would encourage residents to shop at local businesses. In both surveys, more than three-quarters of respondents indicated that the creation of parklets or other outdoor spaces would make them more likely to support small businesses. With this support, Arlington applied for and received a SS&S grant to make permanent a public parklet that initially had been installed as a temporary measure with funding from a previous round of the SS&S program.
Example from Case Studies:
Implementation Timeframe: Short
Resources:
Funding Opportunities and Technical Assistance:
Improve Access to Outdoor Public Spaces
With increased interest in outdoor recreation, planners should invest in multimodal access to outdoor public spaces. In particular, planners should improve access for people with low incomes or who are transit-dependent by investing in public transit, bicycle, and pedestrian access to these green spaces that have proven so critical to peoples’ health and well-being. In addition, as automobile traffic returns near to pre-pandemic levels, providing safe access to people who walk, bicycle, or use an assistive mobility device can help mitigate the impacts and reduce the levels of traffic in CBDs.
Examples From Case Studies:
Implementation Timeframe: Medium
Resources:
Funding Opportunities and Technical Assistance:
Invest in Pedestrian and Bicycle Improvements
The experience of the COVID-19 pandemic has demonstrated that investing in pedestrian and bicycle infrastructure is one of the most effective ways of not only reducing the spread of the virus, but also providing recreation at a time when indoor options were not safe. Bicycle and pedestrian infrastructure can help support public transit ridership by providing safe access to public transit for workers who rely on access critical bus, rapid transit, and commuter rail.
Examples from Case Studies:
Implementation Timeframe: Medium
Resources:
Funding Opportunities and Technical Assistance:
Invest in Placemaking Improvements
An effective placemaking process capitalizes on a community’s assets and histories, centers public engagement, and improves the economic, social, and environmental health of the community. Transportation plays an important role; building new bicycle facilities, limiting, or shifting the location of parking, and improving sidewalk accessibility are all examples of placemaking investments. Outdoor dining (both public and private space) can be considered one type of placemaking improvement. Its success suggests that the best use of curb space in CBDs is not always on-street parking.
Examples from Case Studies:
Implementation Timeframe: Medium
Resources:
Funding Opportunities and Technical Assistance:
Invest in Public Transit Infrastructure that Supports Service for Essential Workers
In the immediate aftermath of the Massachusetts stay-at-home order in March 2020, public transit use dropped, and the remaining passengers were largely essential workers. Public transit, particularly bus service, was and continues to be a critical lifeline. Pandemic-era investments in supporting these services should continue, including bus shelters, dedicated bus lanes, and TSP, which lead to more reliable service and faster travel times for passengers.
Examples from Case Studies:
Implementation Timeframe: Long
Resources:
Funding Opportunities and Technical Assistance:
Support the Implementation of a Regional Rail System
Among the various public transit modes that operate in the Boston region, the commuter rail system likely faces the most uncertain future regarding service levels and ridership. The MBTA has updated commuter rail schedules and service levels to better support “non-peak” riders and essential workers, shifting toward what is considered a more “regional rail” type service. Further, the pandemic has changed travel patterns such that traffic is more spread out during the weekdays and is often highest on the weekends. These changes represent an opportunity for municipalities to work closely with the MBTA to build back service that meets these new realities, and the transportation infrastructure that connects and supports MBTA services. Given the low use of commuter parking lots, municipalities should consider whether parking remains the best use of this land. Opportunities for integrating commuter rail stations into the fabric of the town through better bicycle and pedestrian access—especially for those stations that are in CBDs—could be pursued as alternatives to parking, thereby bringing more foot traffic to commercial areas.
Examples from Case Studies:
Implementation Timeframe: Medium
Resources:
Funding Opportunities and Technical Assistance:
As the pandemic persists and continues to evolve, planners will inevitably be making decisions based on incomplete information. XSP could ease this process by identifying uncertainties that would serve as a basis for a range of recommendations tailored for desirable outcomes. It allows municipalities to efficiently reallocate their limited resources to implementing strategies for a maximum benefit. Now is a testing ground for planners to navigate an increasingly unpredictable and vulnerable world and make impactful decisions. With the new knowledge and tools, planners could be more deliberate about their actions in uncertain times, and in doing so, contribute to envisioning and building a more resilient future for their communities.
Since the pandemic is still ongoing at the time of publication, a critical question remains on how communities responded to the development of the critical uncertainties. A possible next step for the MPO could therefore be to consolidate and analyze the trend of municipalities’ recovery processes and the consistency with their initial goals and predictions. In line with this effort, the MPO could establish metrics that would capture the effectiveness of government interventions and business practices in quantifiable terms. Work by MPO staff is currently under way to explore uncertainties related to the pandemic and post-pandemic travel behaviors. The results of this work will be integrated into the MPO’s travel demand model and allow for a better understanding of the pandemic’s impacts on travel behavior.
In addition, as part of public outreach, municipalities could further expand on the work undertaken for the focus group and open a dialogue with their businesses to get direct feedback on municipal responses to the pandemic and solicit ideas for future municipal support of local economy.
Appendix A – Case Studies of Commercial Business Districts (CBD)
CBD Selection
The locations of CBDs in the Boston region were initially determined through the 2019 MPO study Transportation Access Studies of Commercial Business Districts. Twelve CBDs were chosen as case studies for this guidebook based on several factors, including the level of public transit access, types of jobs, environmental justice (EJ) population, pandemic impacts, input from staff and the MPO board, and geographic distribution. This section describes each factor that was considered during this process.
Type of Public Transit Access
In the 2019 study, staff developed a model to identify Boston region CBDs. The resulting CBDs were then grouped into six categories based on the types of public transit services that were available, and other attributes that affect mode choice. These six categories were used in this guidebook to help select case study locations, and two from each category of the following categories were selected:
Jobs that Could be Conducted Remotely
Staff developed a remote work impact ratio (RWIR) for each municipality as a proxy for estimating the potential economic impact to CBDs from a high remote-work scenario.22 To determine the RWIR for each CBD, the number of telework-compatible jobs within the CBD was first derived by multiplying the number of jobs in the CBD with the proportion of telework-compatible jobs.23 The resulting number was then divided by the number of households within the same CBD. CBDs with a higher RWIR may experience greater changes to businesses and commuting patterns as they have more jobs that could be performed remotely relative to the number of households. In CBDs with a low RWIR, there are more households compared with the number of jobs that could be performed remotely.24
EJ Populations
Staff also considered the share of EJ populations (people with low incomes and people of color) when selecting CBDs for case studies. Staff sought to include some CBDs where there is a significant EJ population.
Pandemic Impacts
Communities with high rates of COVID-19 infections were also considered in case study selection, with the aim of including some communities that were among the hardest hit. In several cases, although not all, communities that had high rates of COVID-19 infections also had large EJ populations and/or a low RWIR (a large portion of the population whose jobs could not be accomplished remotely). Table A.1 shows the total COVID-19 caseload per 100,000 residents in each of the case study municipalities. (Data are only available for the municipality in which each CBD is located, not the CBDs themselves.) Lynn and Chelsea had the highest rates of COVID-19 last winter among the case study municipalities, and Ipswich and Maynard the lowest.
Table A.1
Two-week COVID-19 Caseload per 100,000 Population
| Municipality |
Population |
*Total Case Count |
Case Count per |
|---|---|---|---|
Boston |
675,647 |
73,440 |
10,870 |
Chelsea |
40,787 |
9,037 |
22,157 |
Concord |
18,491 |
1,148 |
6,208 |
Framingham |
72,362 |
8,524 |
11,780 |
Ipswich |
13,785 |
821 |
5,956 |
Lynn |
101,253 |
17,685 |
17,466 |
Marblehead |
20,441 |
1,400 |
6,849 |
Maynard |
10,746 |
652 |
6,067 |
Medfield |
12,799 |
618 |
4,829 |
Norwood |
31,611 |
2,963 |
9,373 |
Quincy |
101,636 |
7,756 |
7,631 |
Notes: COVID-19 caseload rates are per 100,000 people. They are calculated by dividing the total number of confirmed COVID-19 cases in each municipality by the population of the municipality and multiplying the result by 100,000. The rate will be different from those calculated using the population provided in the Massachusetts Department of Public Health data as this guidebook uses population from the 2020 US Census.
* Includes the total number of documented cases in each municipality that occurred between January 1, 2020, and
August 13, 2021.
Sources: Massachusetts Department of Public Health. 2020 US Decennial Census.
Input from MPO Board Members
Staff distributed a survey to the MPO board members for additional input on the CBD selection process. The survey asked respondents to choose any number of the CBDs from a preliminary list for each level of transit access category and provide their reasons for their selection.
Geographic Distribution
Demographic distribution was considered to ensure that the final selection reflects the geographic diversity of the Boston region.
Final Selection of CBD Case Studies
Using these criteria, two CBDs were chosen in each of the six public transit access categories:
Interview Process
Once the case study CBDs were selected, MPO staff conducted interviews with municipal staff at the corresponding municipalities. A total of 11 (one was conducted for both Brighton and East Boston) hour-long interviews were conducted from late June 2021 to mid-August 2021.
The interviews focused on three topic areas:
Profiles of Case Study CBDs
Each of the 12 CBD profiles include a description of the CBD, a map showing its location, and population and job statistics.25 To better understand the makeup of jobs within each CBD, the profiles include each CBD’s RWIR and an estimate of the percent of jobs in the CBD theoretically able to work remotely based on their industry sector. The lower the percentage of remote jobs and the lower the RWIR, the less that CBD may be affected by teleworking trends.
The extent to which employees work remotely at least part time in the long term could have a significant impact on the future of CBDs—on their businesses, the demand for housing, and travel behavior, among others. An important part of this dynamic is whether a job can be done away from the job site based on the types of tasks that need to be completed. In general, jobs with the highest potential for remote work are those whose tasks can largely be done on a computer or another digital interface. To better understand this dynamic in each CBD, the community profiles list the three industry sectors with the most jobs and identifies their effective potential for remote work.
“Effective potential” is the percent of time spent working remotely where there is no loss of productivity. The symbology indicates the effective potential for remote work. The darker the blue shade, the greater percent of work hours could be spent working remotely without productivity loss.
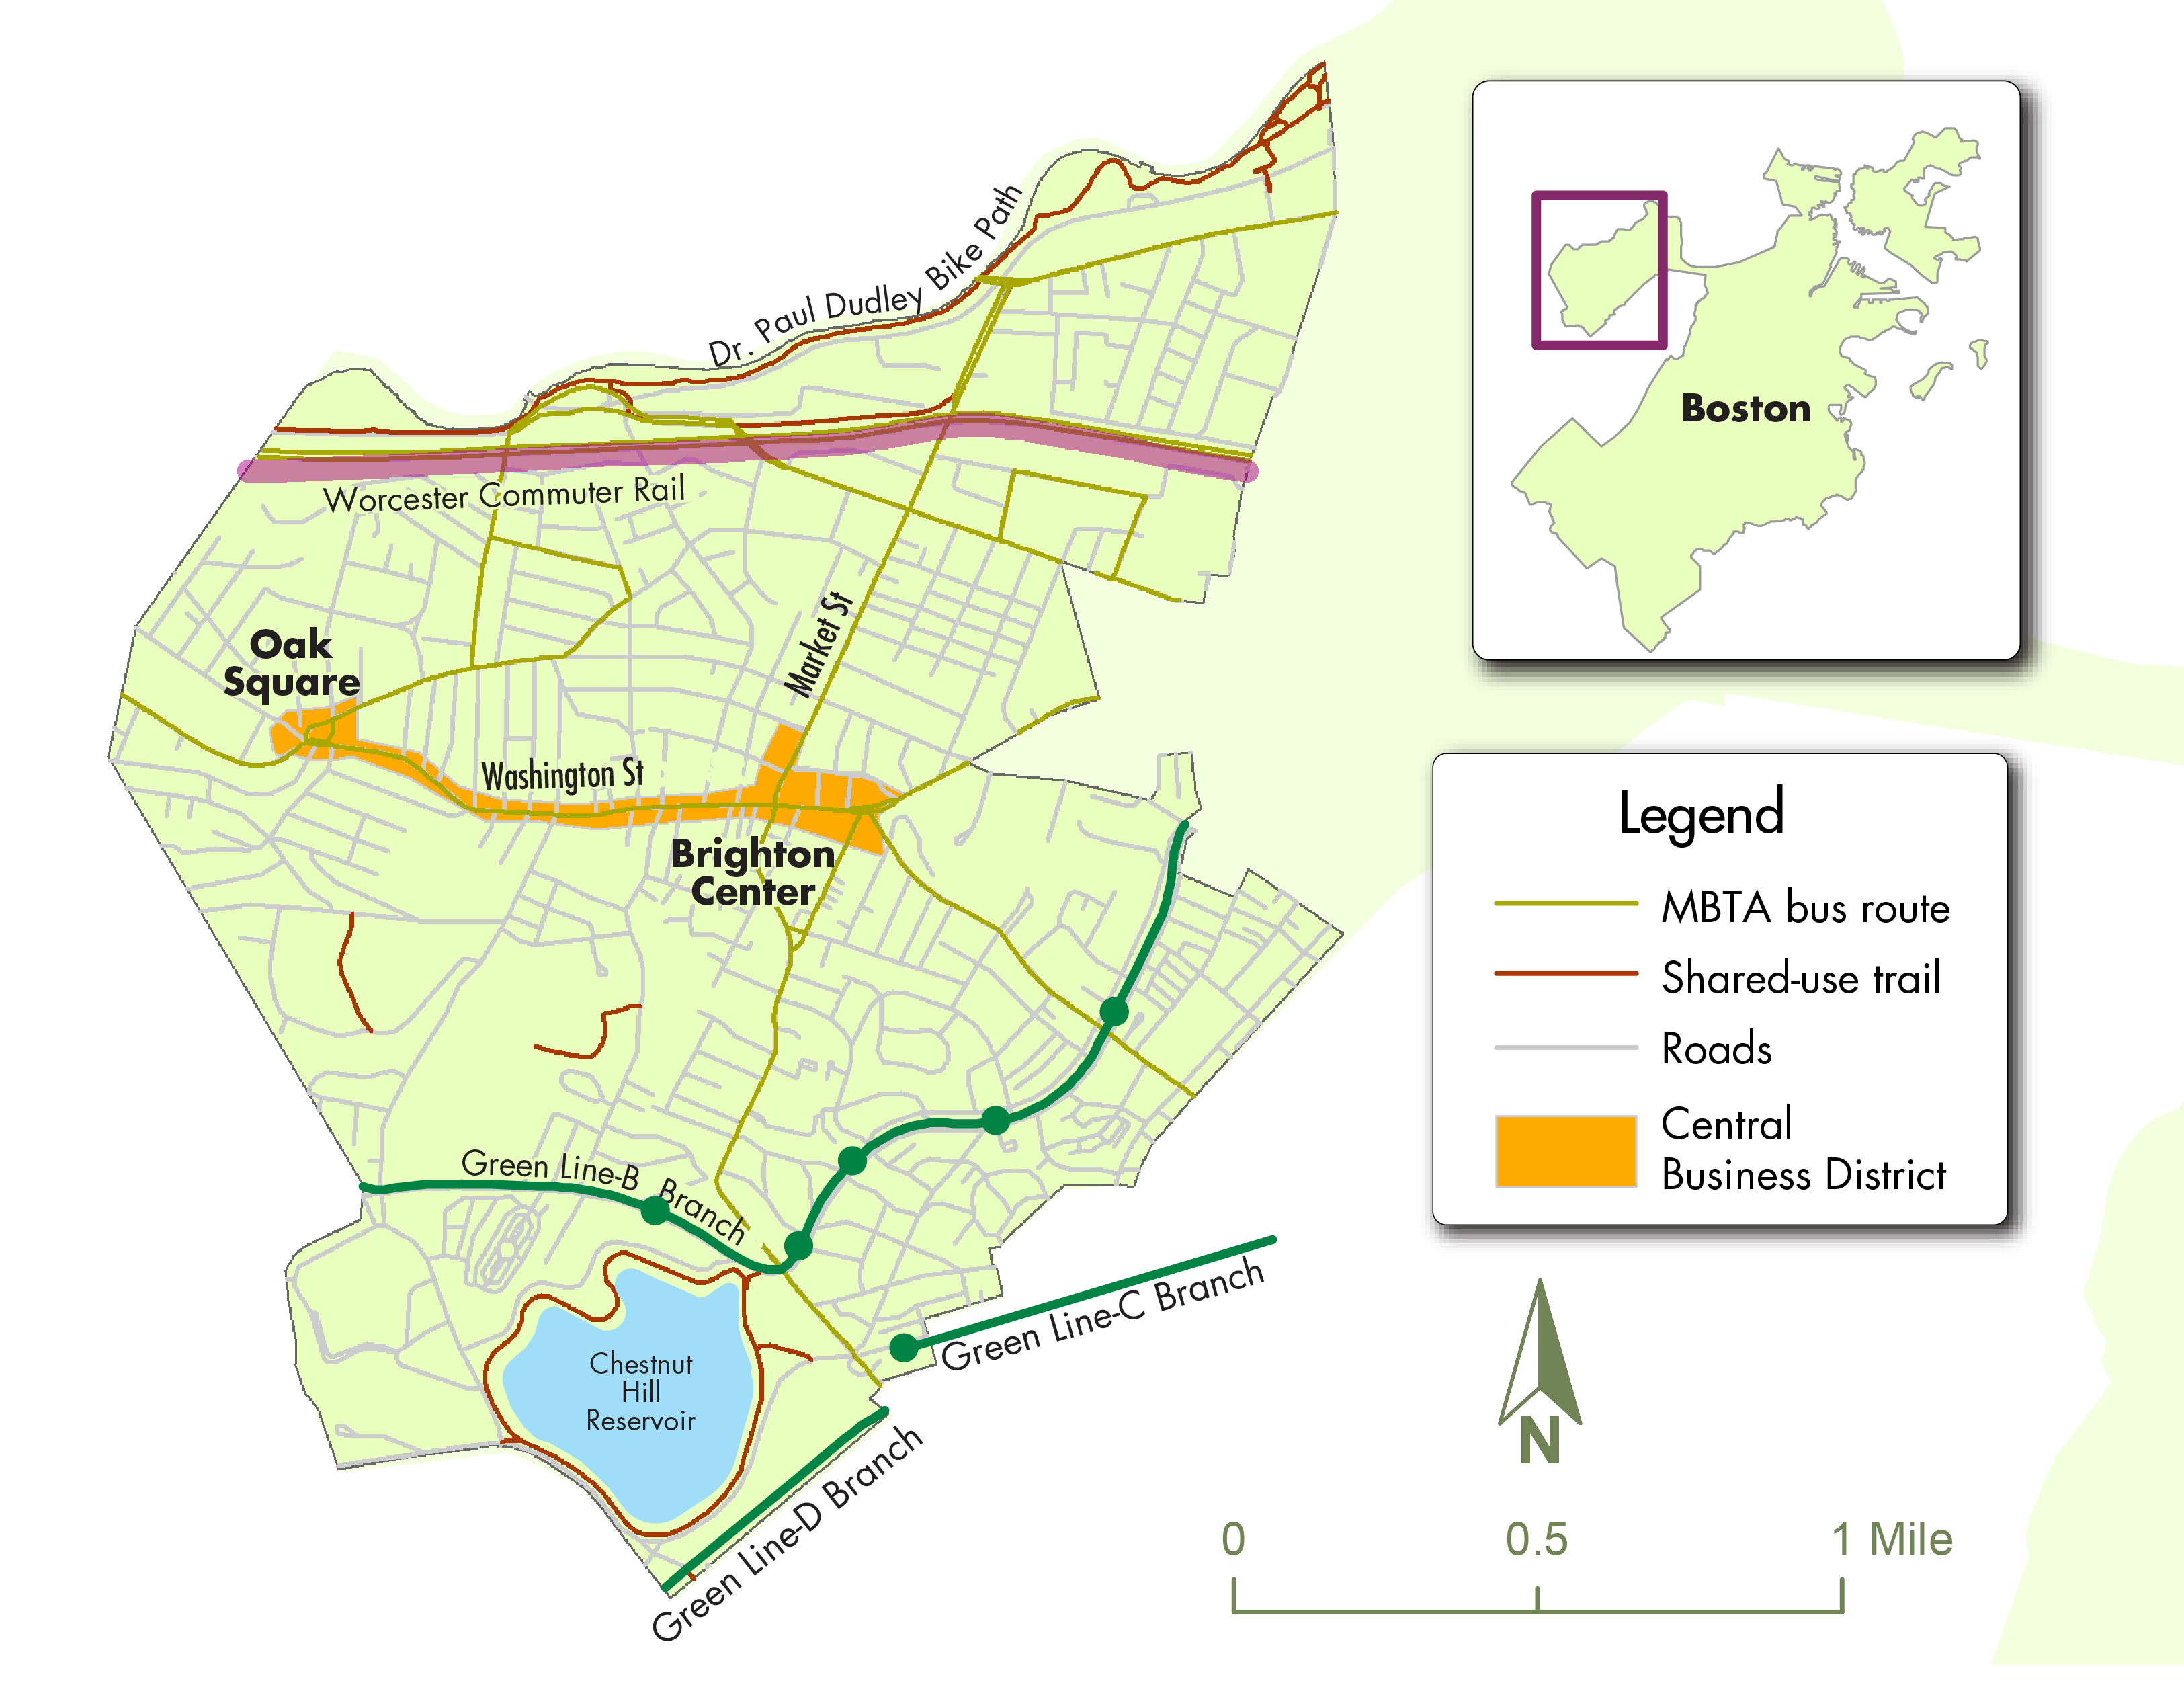
Brighton (Boston)
The main avenues in Brighton are arterial roadways that have a high density of retail-oriented businesses. The neighborhood is served by several bus routes, as well as the B branch of the rapid transit Green Line. Located near several universities, Brighton has a large student population and industrial uses close to the Charles River. The neighborhood is experiencing an influx of young professionals, along with businesses that cater to them.
Figure A.1
Brighton Commercial Business Districts
Key Indicators
| Indicator |
Brighton CBD |
Boston |
|---|---|---|
Population |
14,561 |
675,647 |
Percent minority population |
36.3% |
52.9% |
Percent low-income population |
21.9% |
40.3% |
Percent of jobs that could be |
24.7% |
N/A |
Remote work impact ratio |
0.19 |
N/A |
Top three industry sectors: |
Healthcare and
|
Healthcare and
|
CBD = commercial business district. N/A = not applicable.
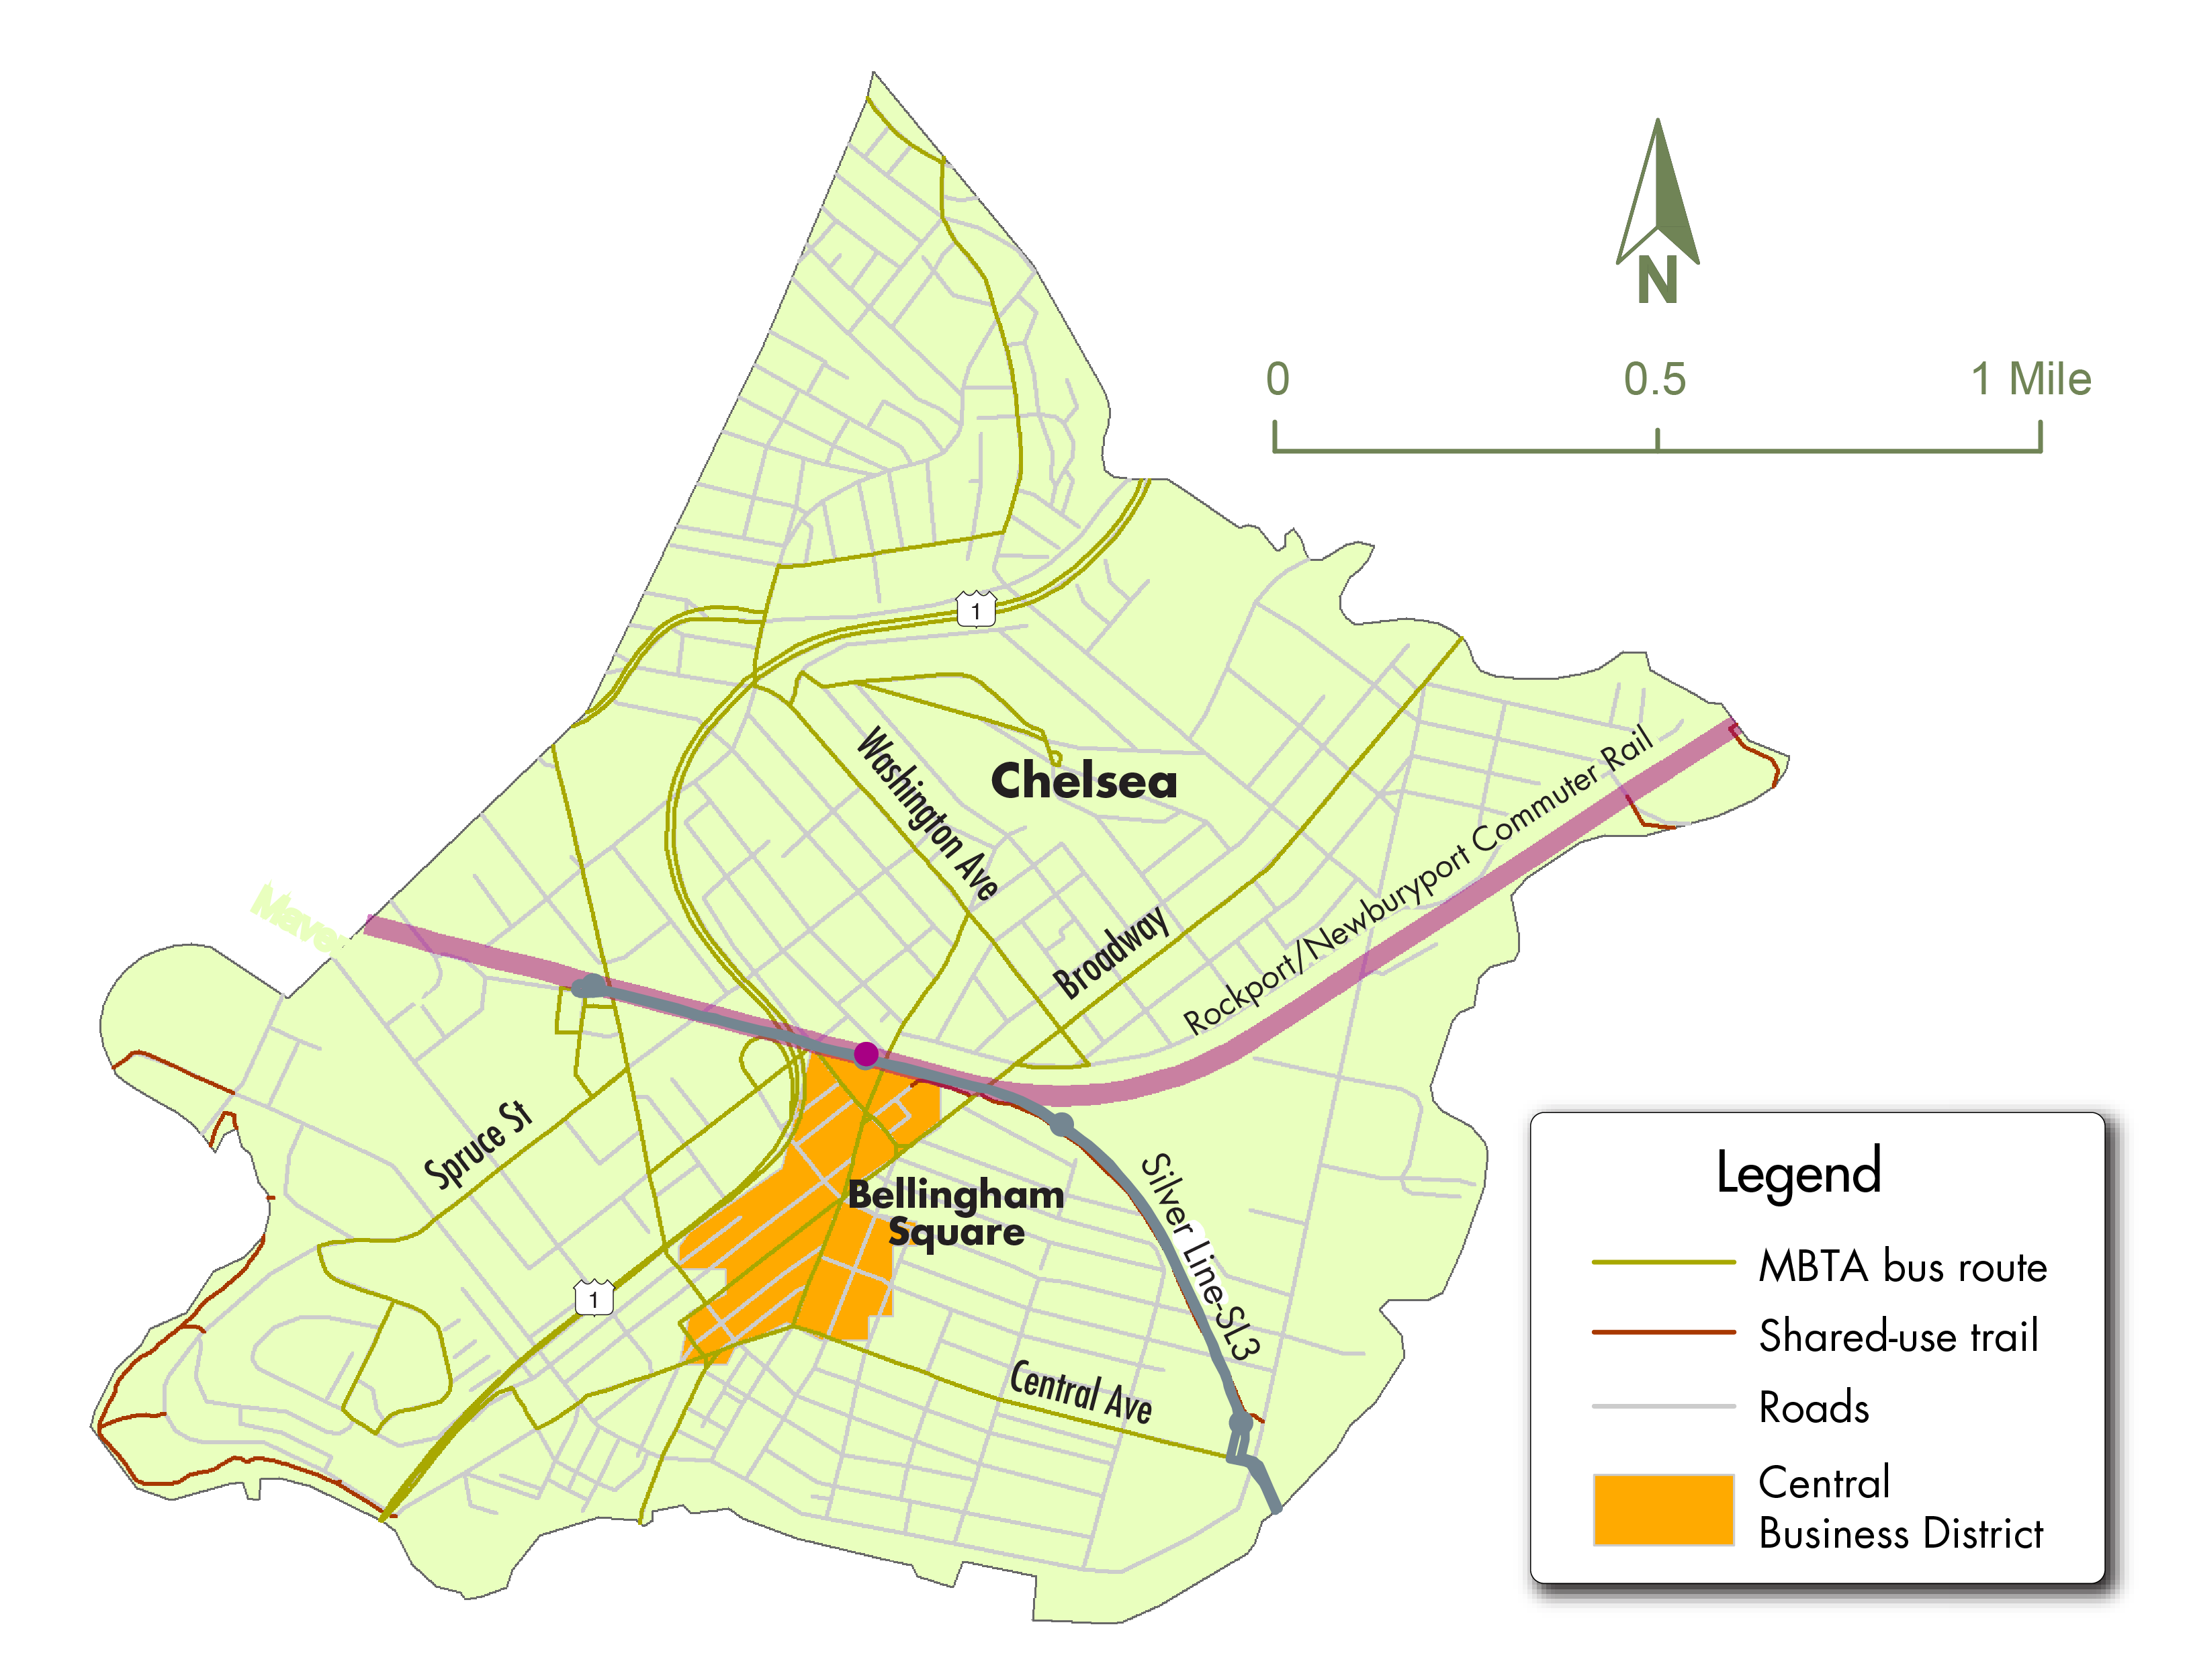
Chelsea
The Chelsea CBD runs mostly along either side of Broadway. It is a key regional public transit hub, served by several public transit routes, including the Newburyport/Rockport commuter rail line, the Silver Line, and about a half-dozen bus routes, which are among some of the most heavily used in the region. It is also home to the Chelsea Greenway. There is a high density of residential and commercial uses, along with a large EJ community.
Figure A.2
Chelsea Commercial Business Districts
Key Indicators
| Indicator |
Chelsea CBD |
Chelsea |
|---|---|---|
Population |
17,456 |
40,787 |
Minority population |
87.9% |
72.6% |
Low-income population |
45.2% |
41.7% |
Percent of jobs that could be |
29.5% |
N/A |
Remote work impact ratio |
0.40 |
N/A |
Top three industry sectors: |
Public administration Administrative and support and waste Educational services |
Healthcare and social assistance Public Retail trade |
CBD = commercial business district. N/A = not applicable.
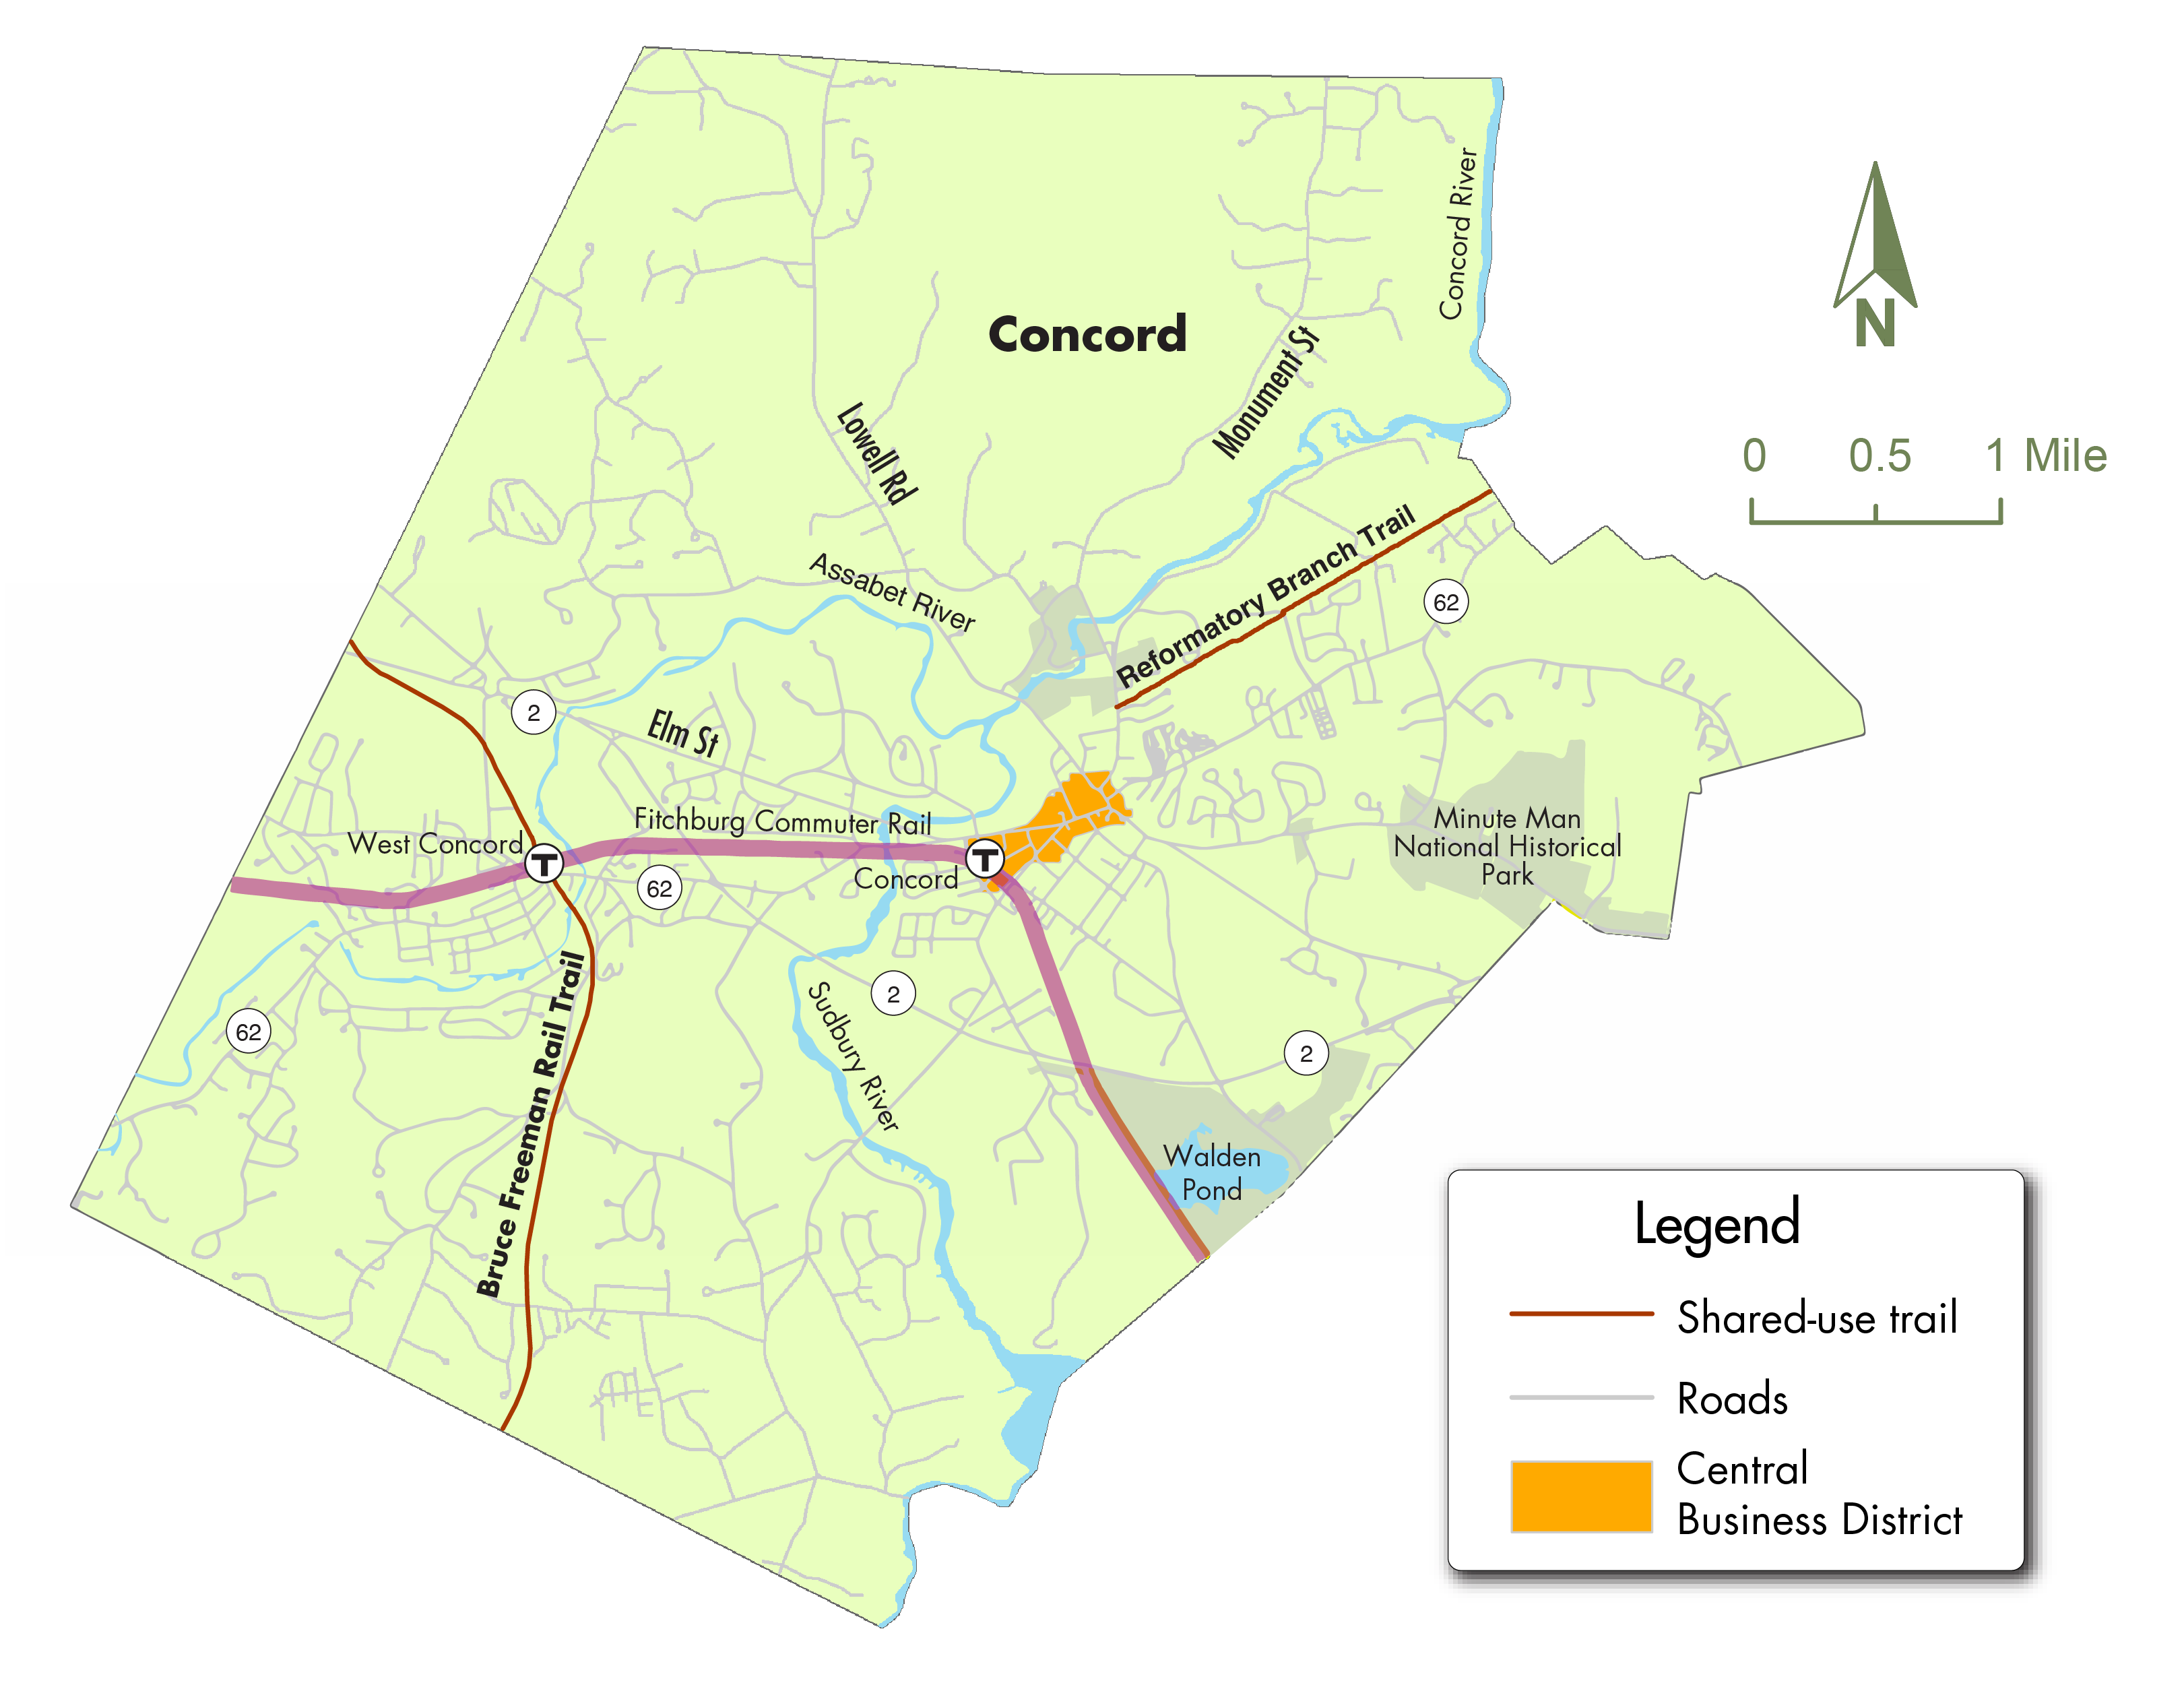
Concord
Concord’s main CBD is largely in the area directly north of the Concord commuter rail station. In addition to its historical attractions, a significant portion of the town is preserved in open space, including the Minuteman National Historic Park and Walden Pond, among others. There are also smaller parks adjacent to the historic Concord Center dedicated to the events of the Revolutionary War and writers that have called Concord home. CBD businesses have long served these historical attractions with thriving restaurants, arts, and retail businesses.
Figure A.3
Concord Commercial Business District
Key Indicators
Indicator |
Concord CBD |
Concord |
Population |
1,313 |
18,491 |
Minority population |
14.5% |
17.1% |
Low-income population |
7.6% |
7.4% |
Percent of jobs that could be |
30.2% |
N/A |
Remote work impact ratio |
1.18 |
N/A |
Top three industry sectors: |
Accommodation and food services 0% – 19% Retail trade Educational services |
Healthcare and social assistance Educational services Professional, scientific, and technical services |
CBD = commercial business district. N/A = not applicable.
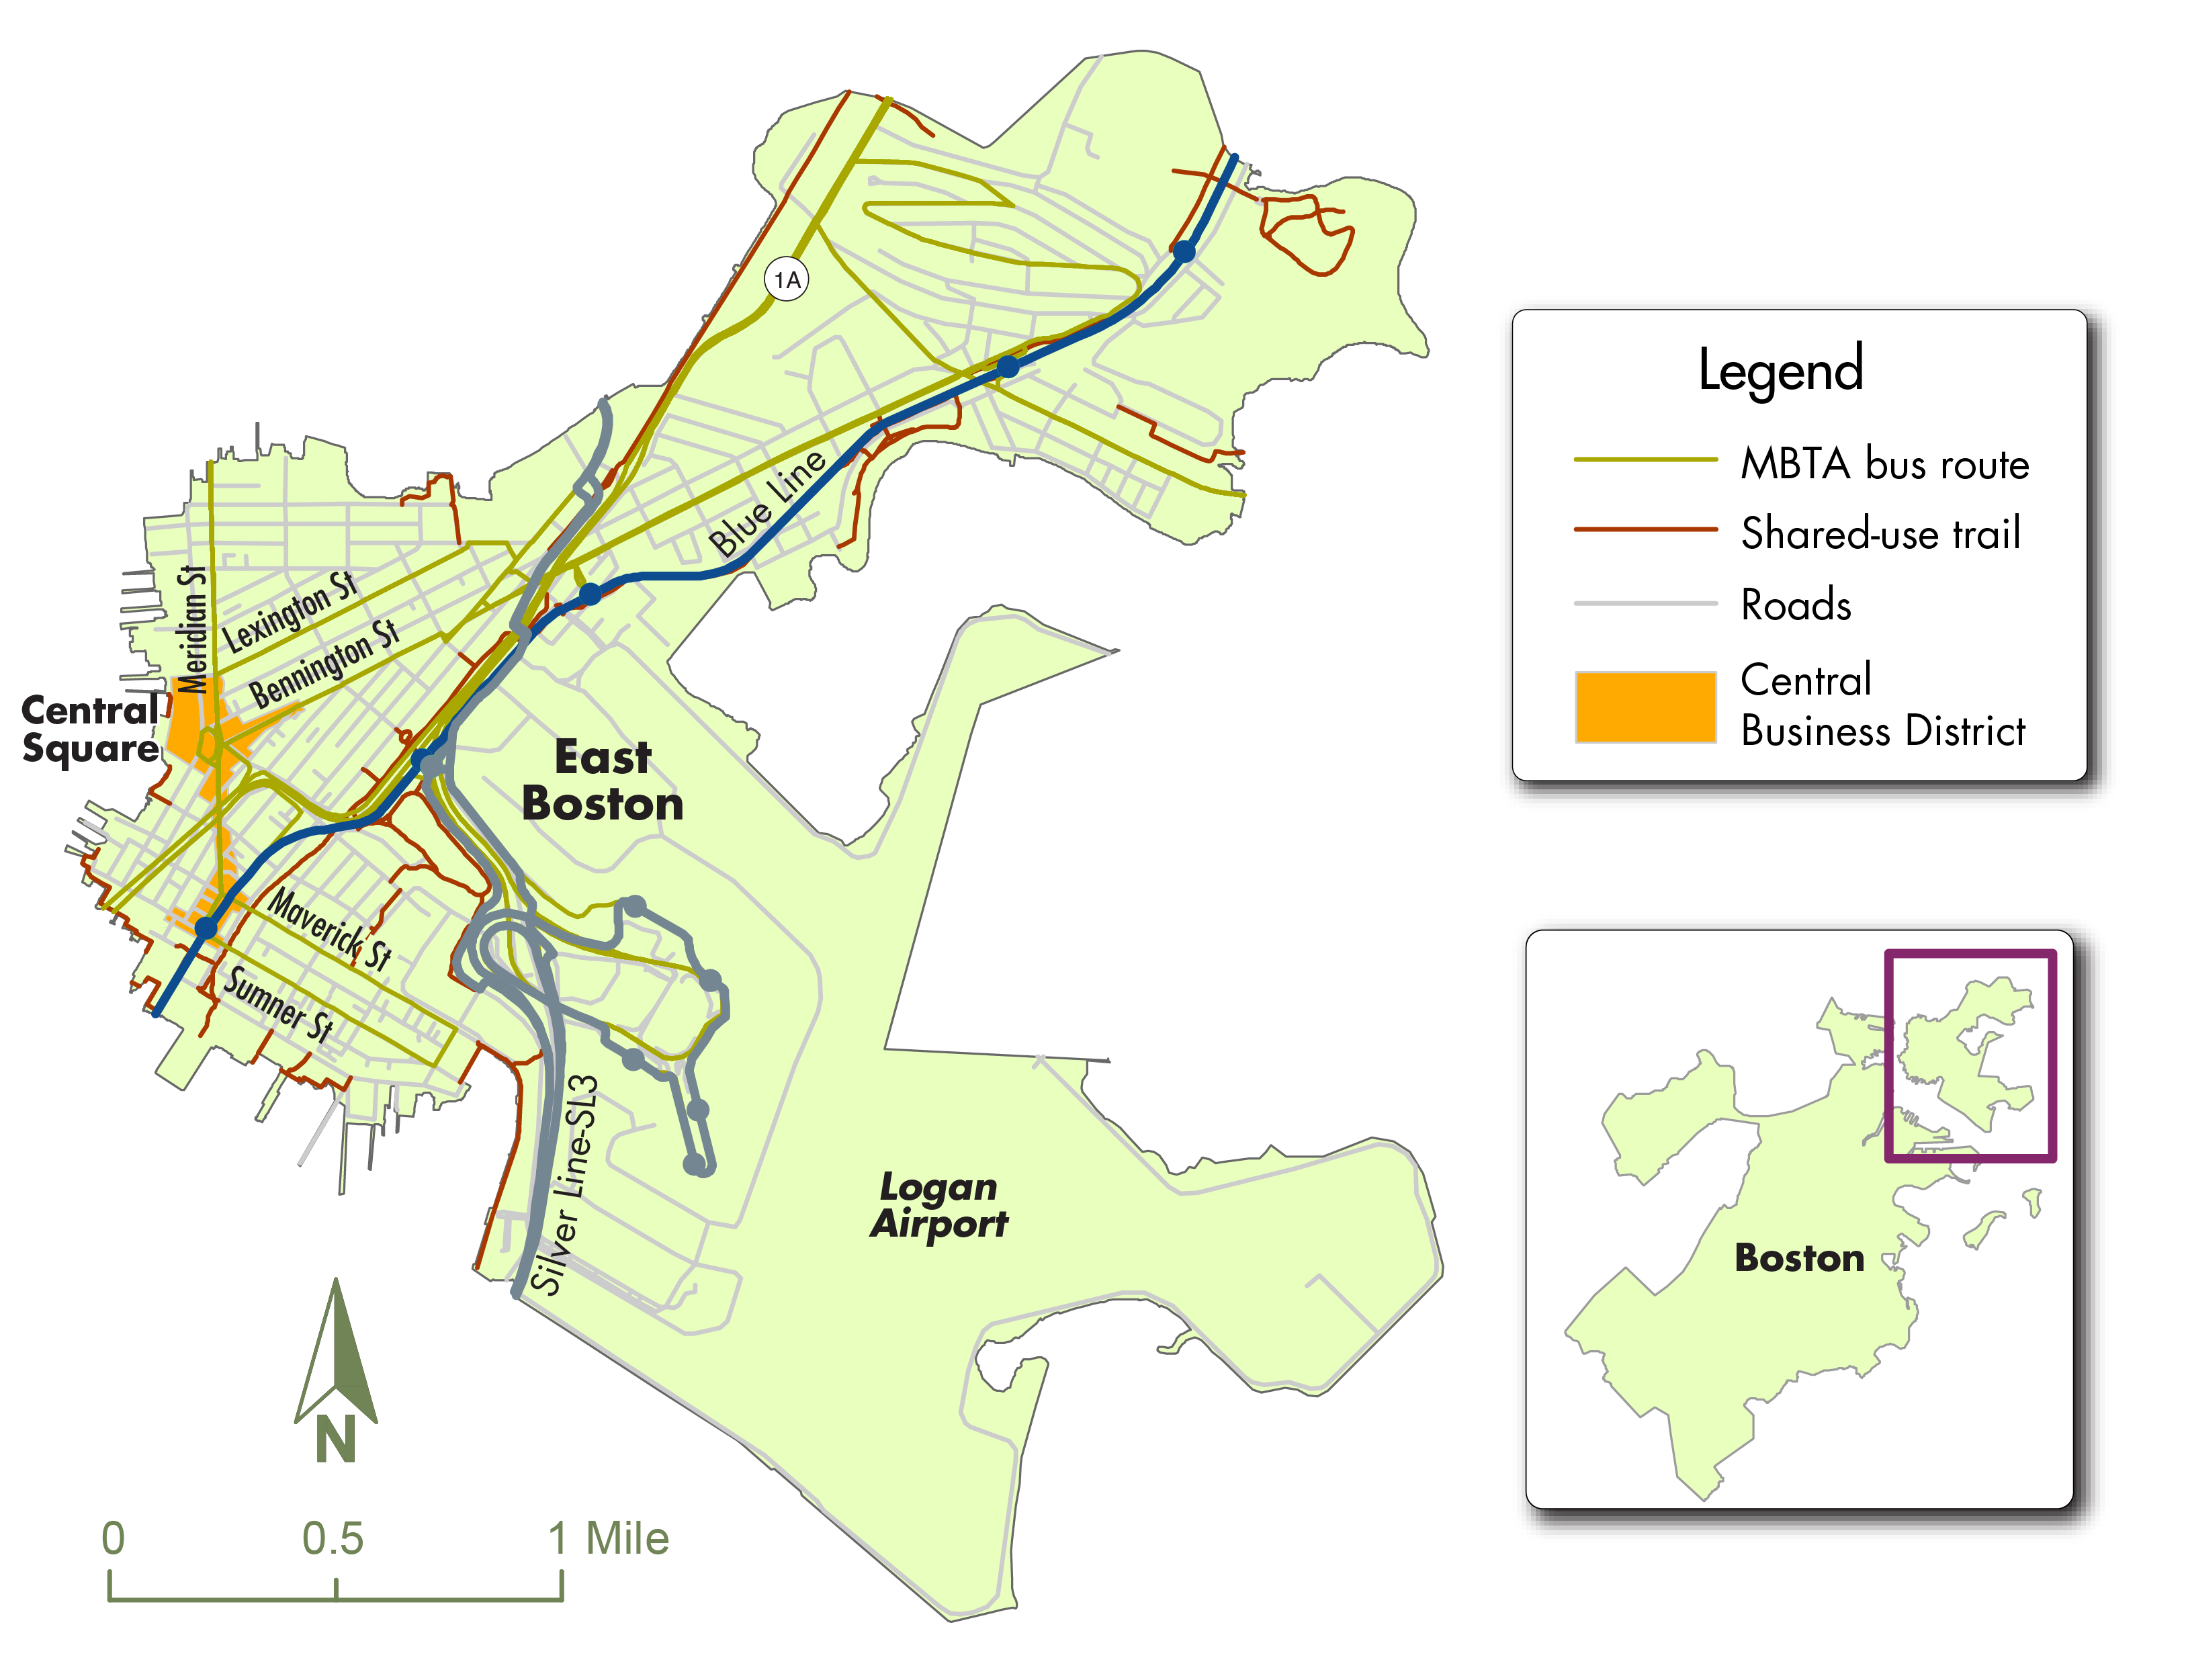
East Boston (Boston)
The main commercial roadway in East Boston is Chelsea Street, which has a high density of retail-oriented businesses and restaurants. East Boston has a large Latino population and a growing Muslim population, along with a variety of businesses that serve these populations. The neighborhood is also adjacent to Logan International Airport and other industries close to the waterfront. East Boston is starting to see an influx of young professionals and accompanying businesses that serve them.
Figure A.4
East Boston Commercial Business District
Key Indicators
| Indicator |
East Boston CBD |
Boston |
|---|---|---|
Population |
20,612 |
675,647 |
Percent minority population |
65.4% |
52.9% |
Percent low-income Population |
43.0% |
40.3% |
Percent of jobs that could be |
23.5% |
N/A |
Remote work impact ratio |
0.11 |
N/A |
Top three industry sectors: |
Healthcare and social assistance 20% – 39% Accommodation and food services Retail trade |
Healthcare and social assistance Educational Accommodation and food services |
CBD = commercial business district. N/A = not applicable.
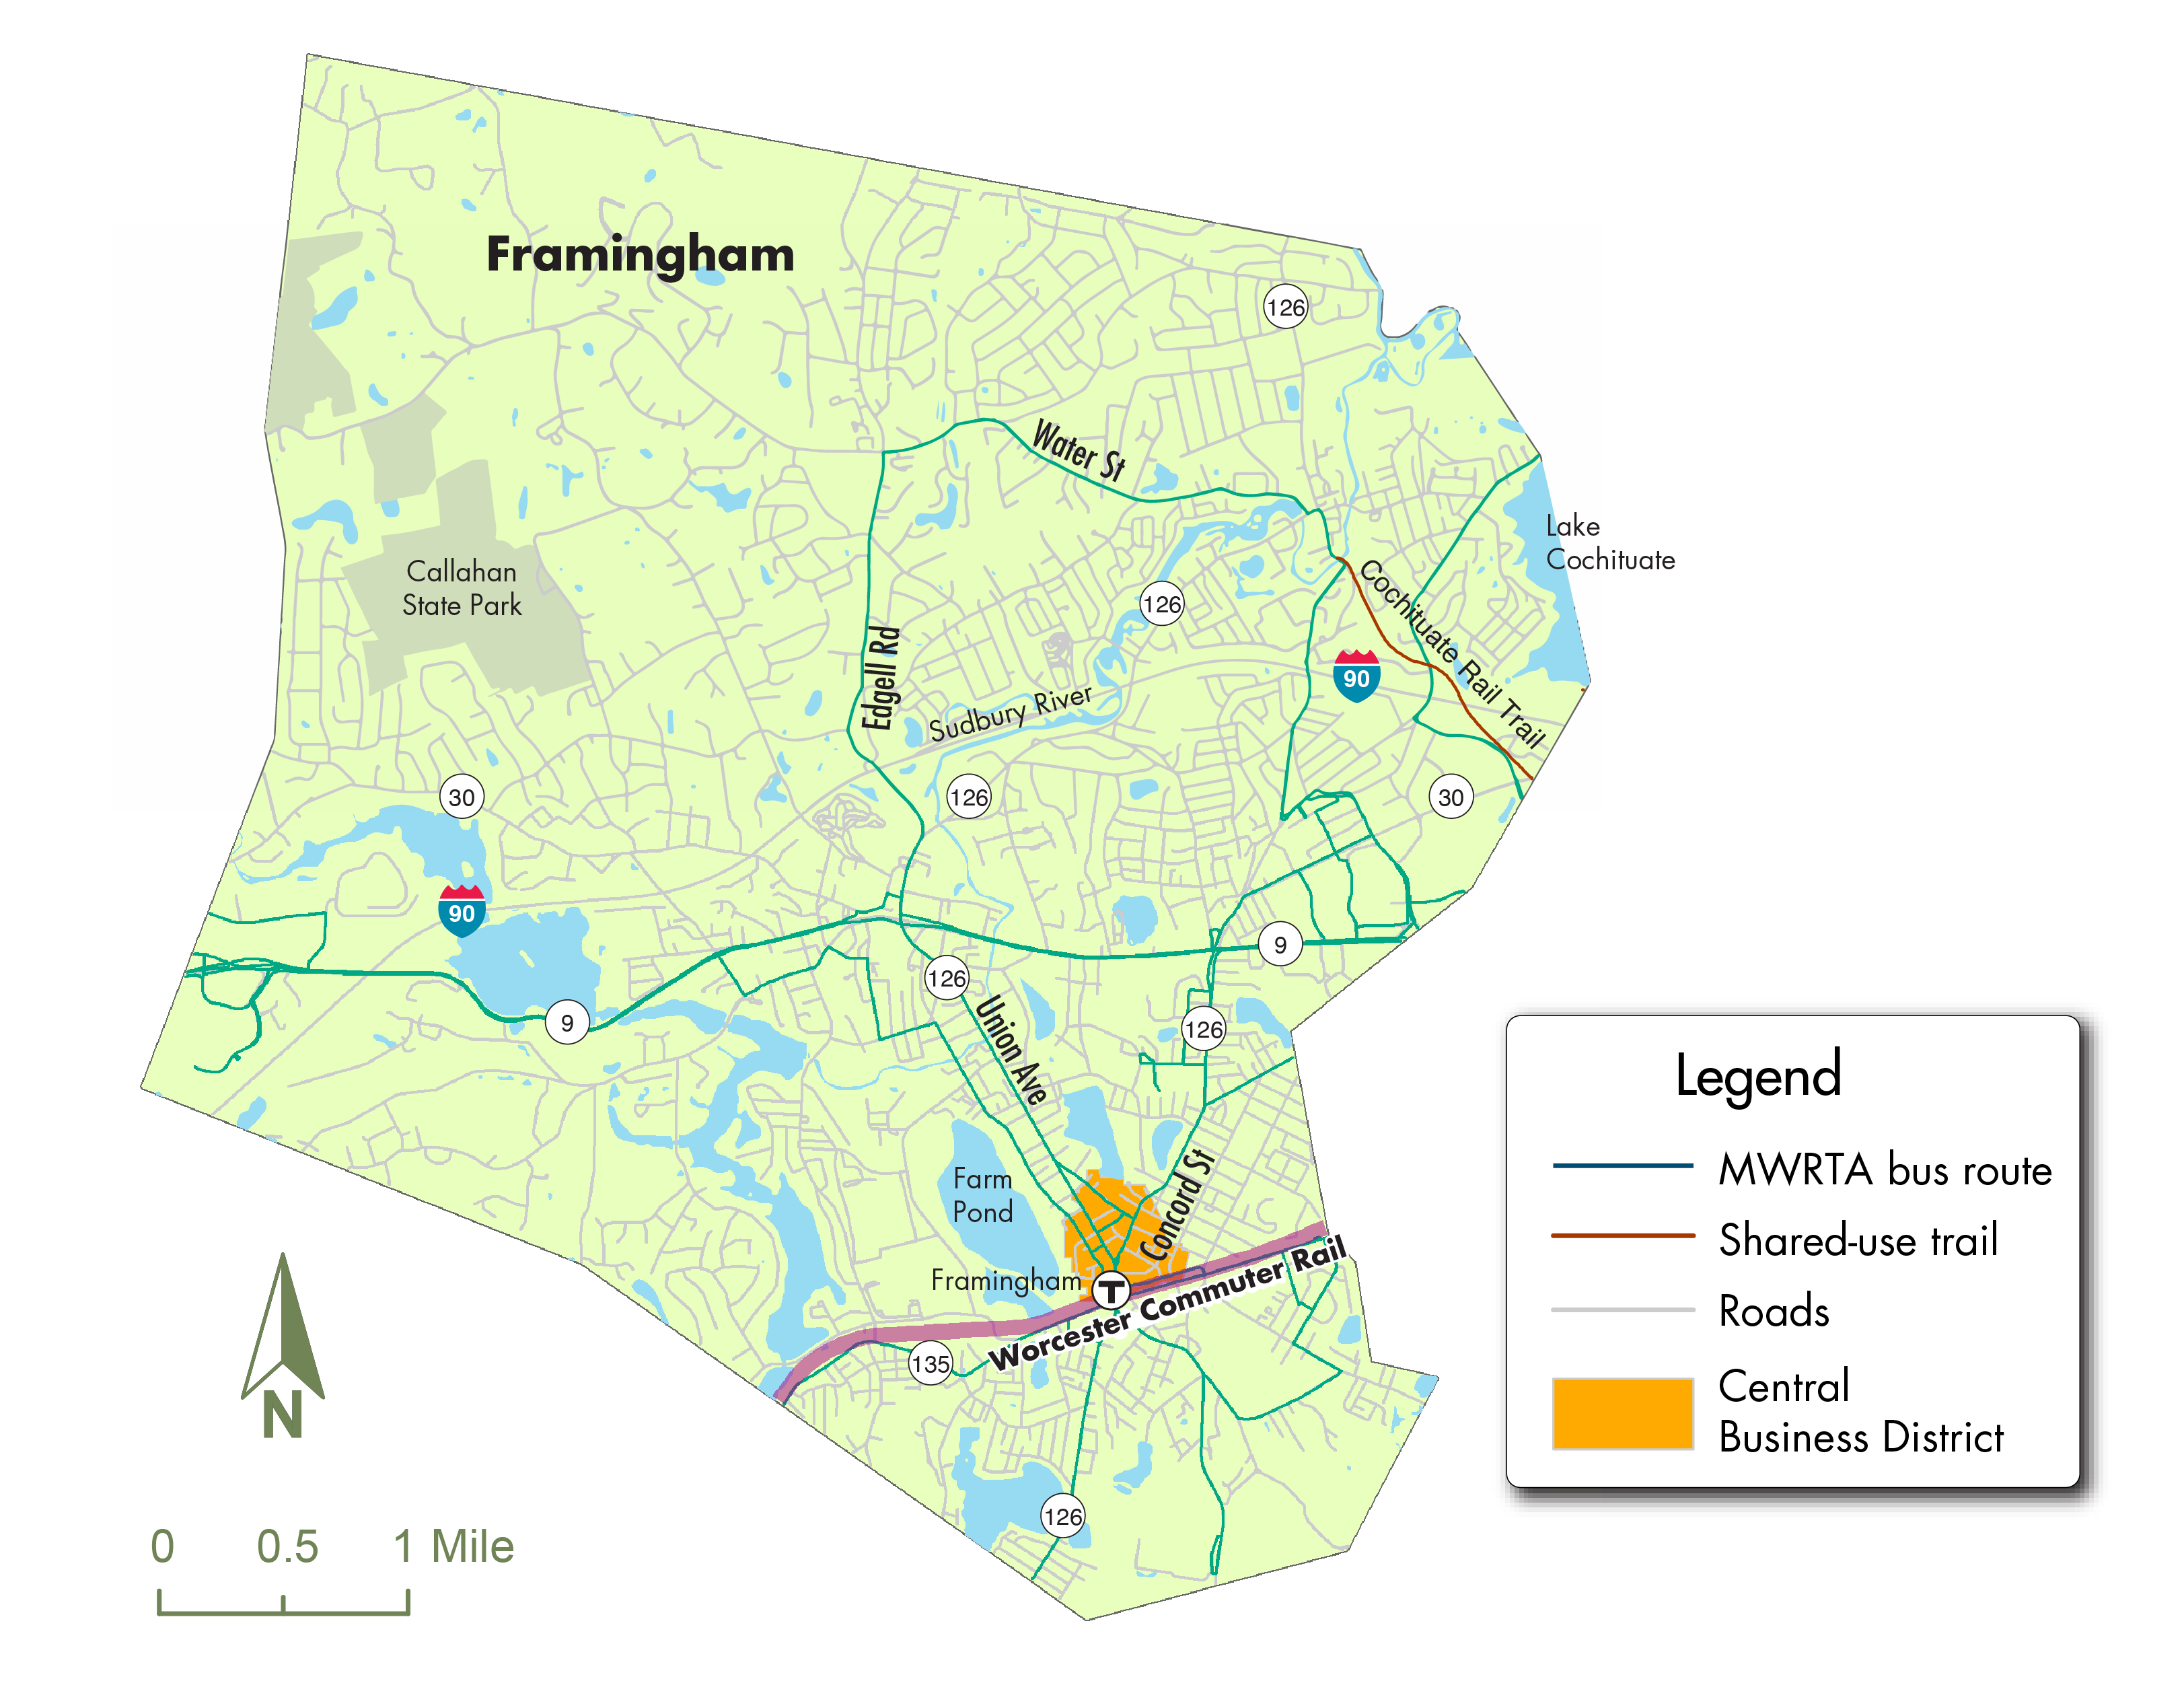
Framingham
Served by several major transportation routes, Framingham’s CBD has a commuter rail station, several MetroWest Regional Transit Authority bus routes, and is split by Route 135 and 126. Storefronts in the CBD are dominated by retail and restaurants and some second-floor service businesses, such as insurance and tax preparation. Historically, the CBD has largely been dominated by commercial properties, but that is starting to change. In the past few years, there has been a significant increase in the number of residential units, with about 1,000 new units and many more scheduled to follow.
Figure A.5
Framingham Commercial Business District
Key Indicators
| Indicator |
Framingham CBD |
Framingham |
|---|---|---|
Population |
5,021 |
72,362 |
Minority population |
68.1% |
43.8% |
Low-income population |
45.4% |
22.2% |
Percent of jobs that could be |
34.7% |
N/A |
Remote work impact ratio |
0.88 |
N/A |
Top three industry sectors: |
Health care and social assistance Public administration Administrative and support and waste management and remediation services |
Management of companies and enterprises Healthcare and social assistance Retail trade |
CBD = commercial business district. N/A = not applicable.
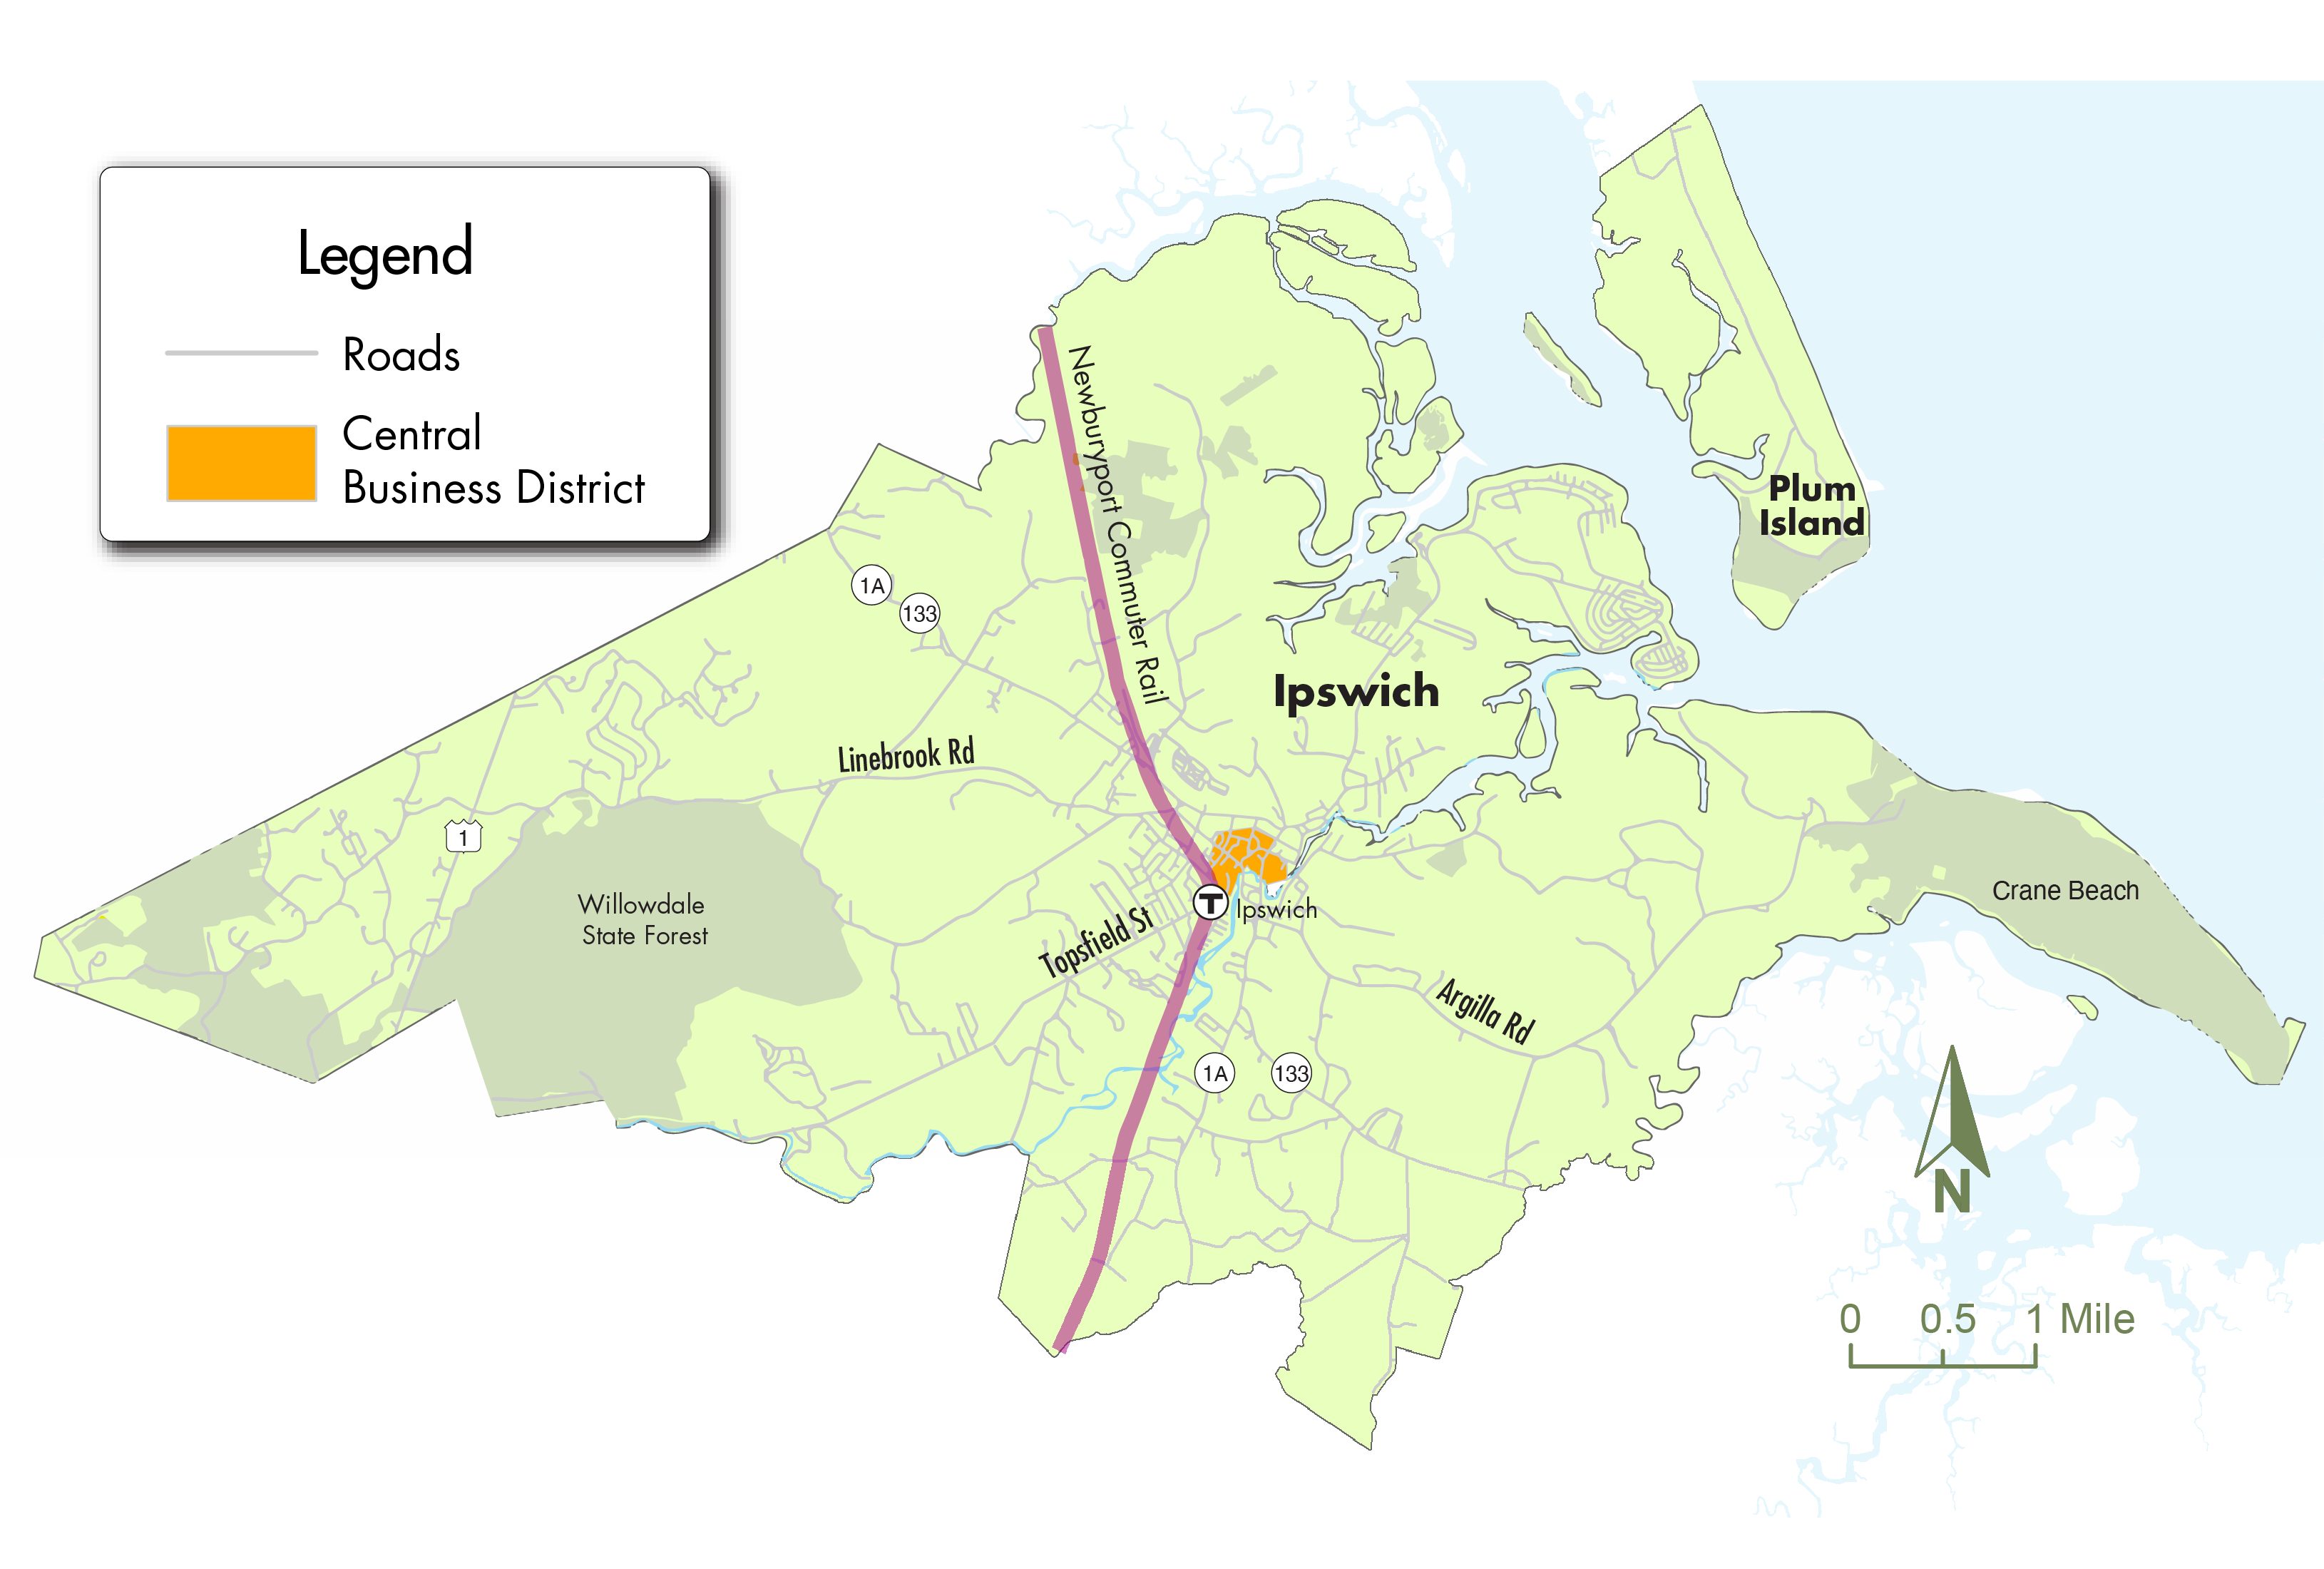
Ipswich
Ipswich is an old town with a dense commercial business district and a lot of open space. These elements make it a tourist destination, but it also has a wide variety of businesses, including the headquarters for EBSCO, the publishing company. Like many CBDs profiled here, buildings in the CBD are mostly multiuse with retail on the first floor and residences on the second. Just outside of the immediate downtown are several service and trade industries and residential areas. A commuter rail station downtown serves Ipswich residents who commute to Boston, and employees of EBSCO and other businesses who commute to Ipswich.
Figure A.6
Ipswich Commercial Business District
Key Indicators
| Indicator |
Ipswich CBD |
Ipswich |
|---|---|---|
Population |
1,967 |
13,785 |
Minority population |
12.3% |
8.2% |
Low-income population |
19.0% |
15.8% |
Percent of jobs that could be |
56.9% |
N/A |
Remote work impact ratio |
1.43 |
N/A |
Top three industry sectors: |
Information Public administration Accommodation and food services - |
Information Manufacturing Other services (excluding public administration) |
CBD = commercial business district. N/A = not applicable.
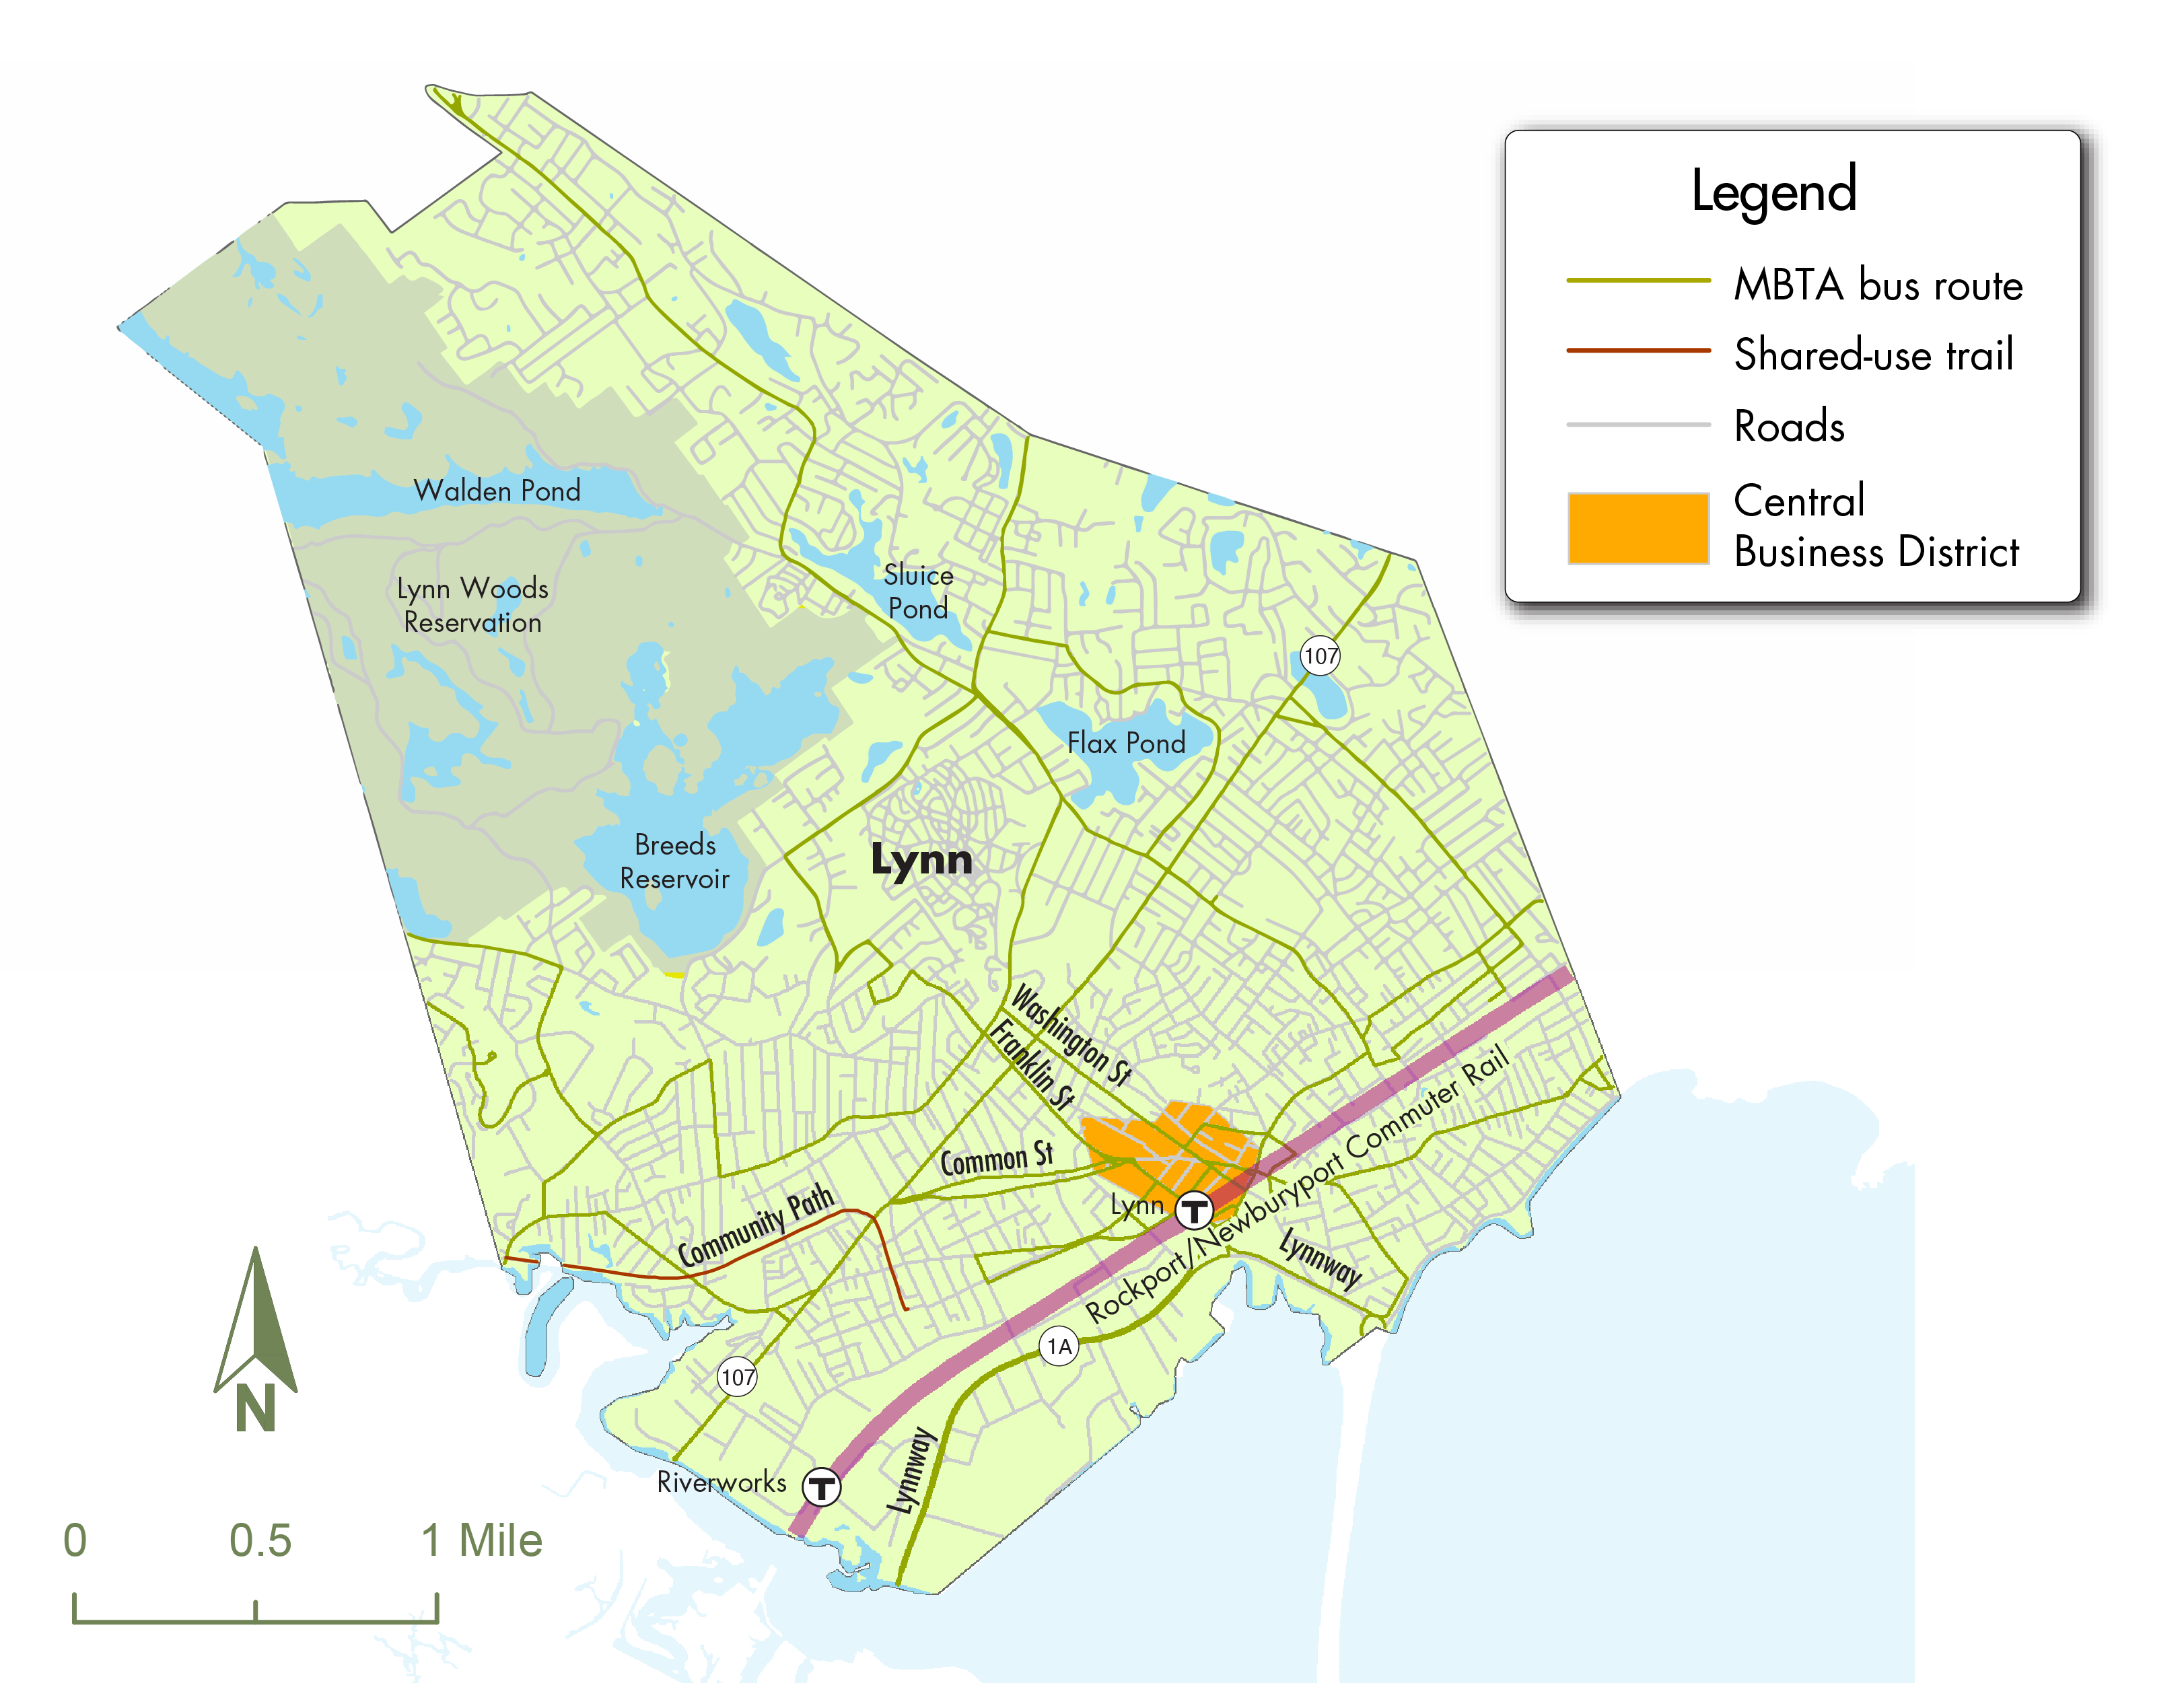
Lynn
Lynn’s CBD is centered around its commuter rail station. Like many post-industrial cities, Lynn has a mix of old buildings that have been turned into adaptive reuses. While the city suffered from disinvestment in the mid-to-late 20th century, there has since been a long-term effort to bring back businesses. Buildings that used to house theaters and shopping destinations have been turned into restaurants, a multicultural center, and a community health center. Although this reinvestment has brought business activity downtown, there is now concern about the displacement of low-income residents and the lack of affordable housing.
Figure A.7
Lynn Commercial Business District
Key Indicators
| Indicator |
Lynn CBD |
Lynn |
|---|---|---|
Population |
15,157 |
101,253 |
Minority population |
77.5% |
61.8% |
Low-income population |
54.8% |
37.3% |
Percent of jobs that could be done at home |
28.3% |
N/A |
Remote work impact ratio |
0.39 |
N/A |
Top three industry sectors: |
Healthcare and social assistance Public administration Educational services |
Healthcare and social assistance Manufacturing Retail trade |
CBD = commercial business district. N/A = not applicable.
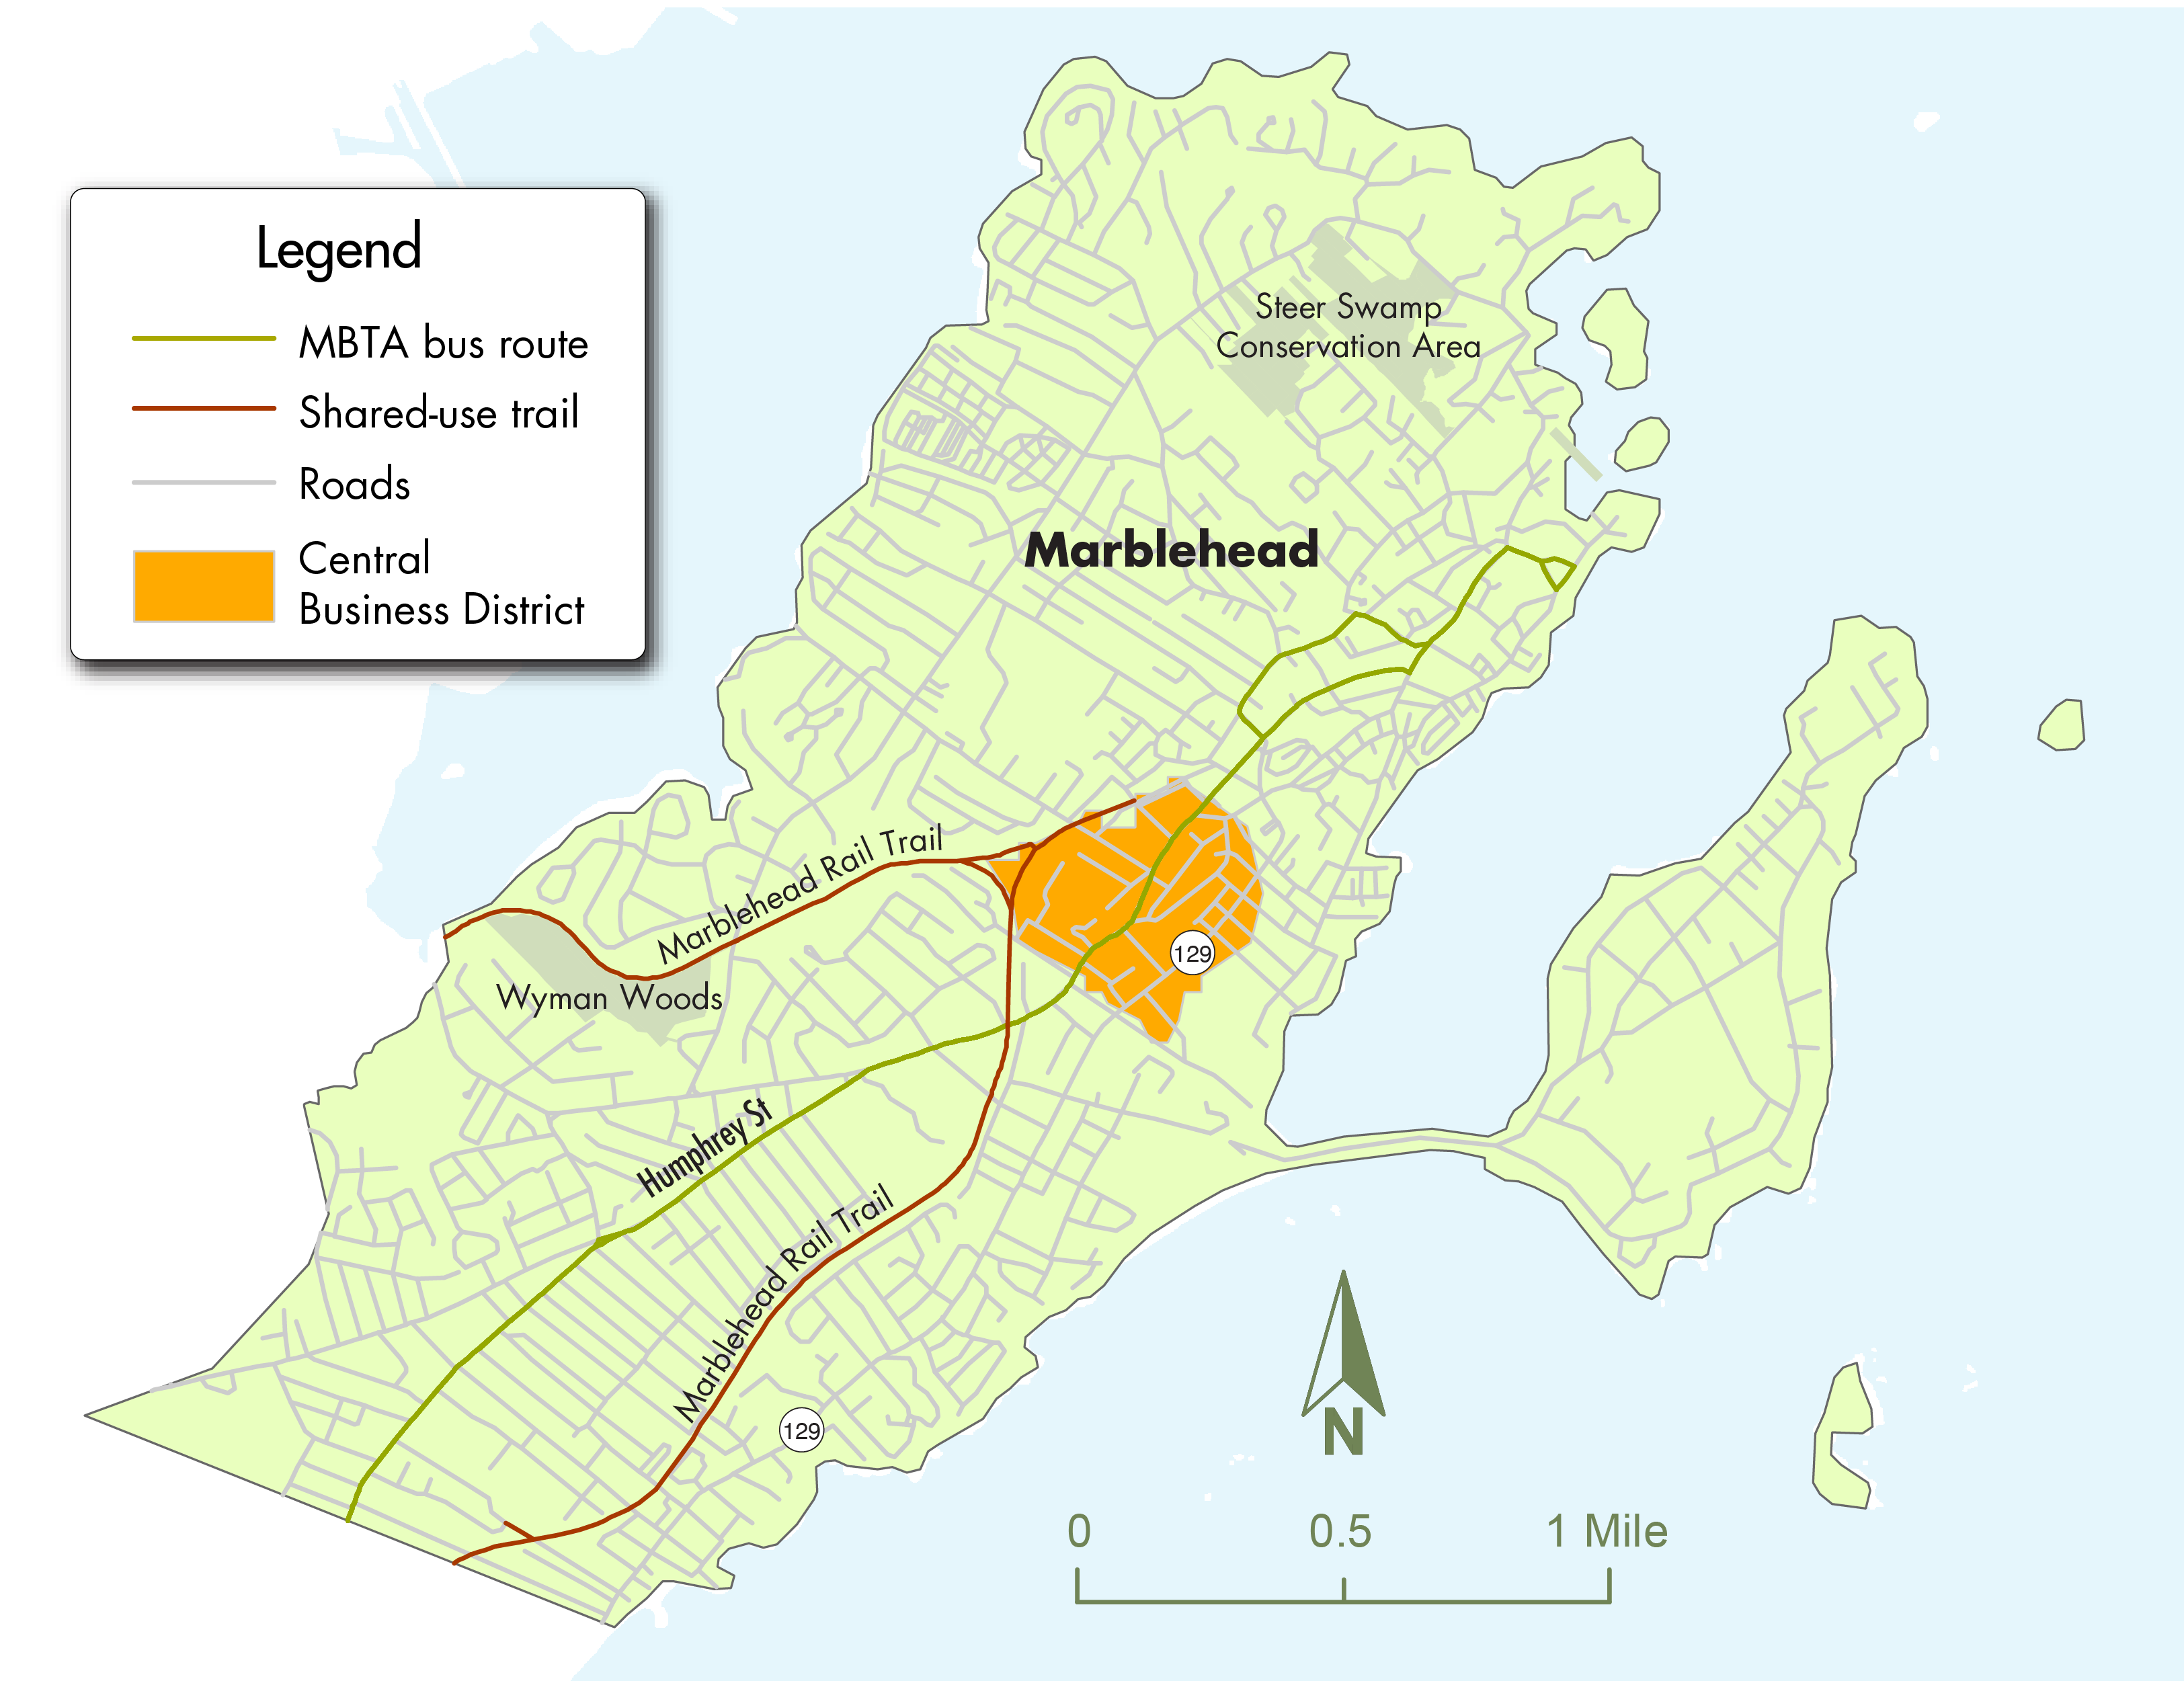
Marblehead
Marblehead is a coastal town with a rich maritime history that draws many visitors. Its main CBD downtown is walkable with narrow streets—Marblehead’s historic business center, which is on the waterfront, is referred to as uptown. Businesses in the CBD include self-employed workers who work out of their own homes, such as artists and lawyers, along with many personal service businesses in first-floor retail spaces, such as medical services and gyms.
Figure A.8
Marblehead Commercial Business District
Key Indicators
| Indicator |
Marblehead CBD |
Marblehead |
|---|---|---|
Population |
3,800 |
20,441 |
Minority population |
10.0% |
8.5% |
Low-income population |
23.3% |
12.8% |
Percent of jobs that could be done at home |
29.9% |
N/A |
Remote work impact ratio |
0.38 |
N/A |
Top three industry sectors: |
Healthcare and social assistance - Accommodation and food services Construction |
Other services (excluding public administration) Health care and social assistance Educational services |
CBD = commercial business district. N/A = not applicable.
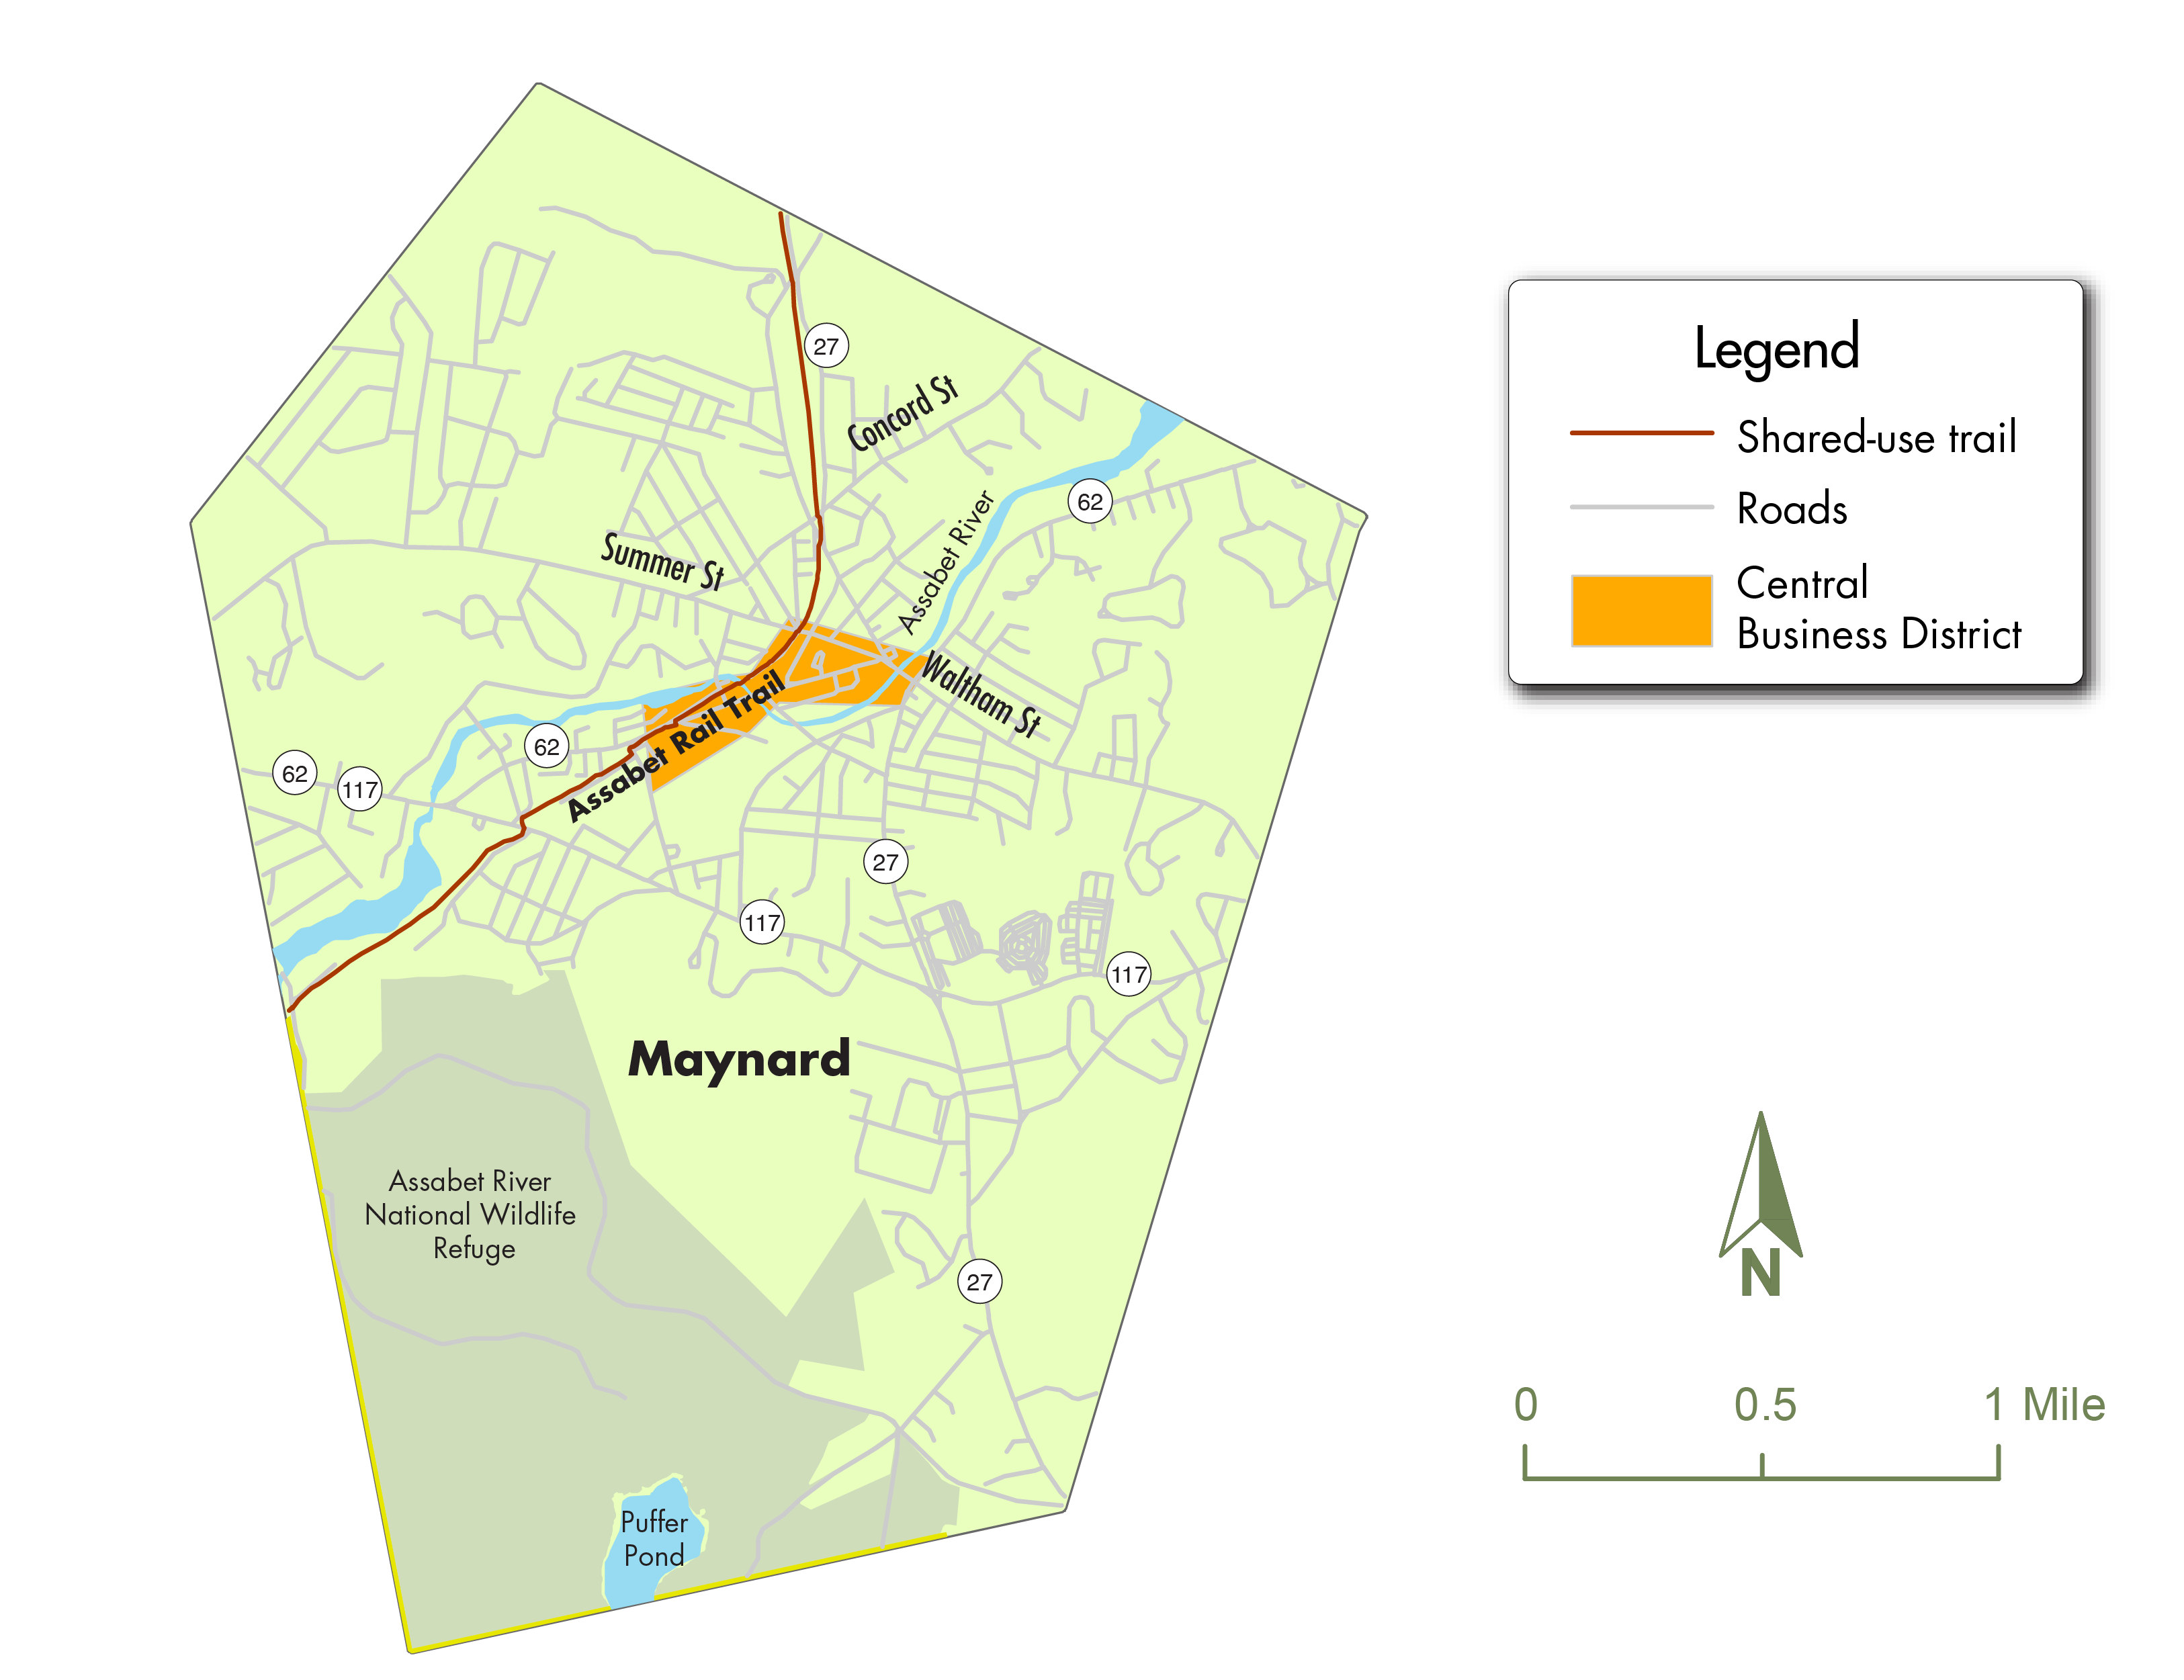
Maynard
Maynard is an old mill town with a traditional main street downtown. Much of the CBD is commercial space in addition to many restaurants, and a cultural district in the “downtown triangle” with a burgeoning art scene. The town has several natural resources and outdoor attractions. About one-third of the town is protected land in the Assabet Wildlife Refuge. The Assabet River runs through the downtown while the Assabet Rail Trail connects to Acton in the north and follows the river to Stow in the southwest. There is no public transit service, with the closest commuter rail stations in Acton and Concord on the Fitchburg Line.
Figure A.9
Maynard Commercial Business District
Key Indicators
| Indicator |
Maynard CBD |
Maynard |
|---|---|---|
Population |
2,232 |
10,746 |
Minority population |
17.8% |
15.7% |
Low-income population |
10.3% |
8.1% |
Percent of Jobs that could be done at home |
38.4% |
N/A |
Remote work impact ratio |
1.05 |
N/A |
Top three industry sectors: |
Administration and support, waste management and remediation Professional, scientific, and technical services Accommodation and food services |
Professional, scientific, and technical services Administrative and support and waste management and remediation services Accommodation and food services |
CBD = commercial business district. N/A = not applicable.
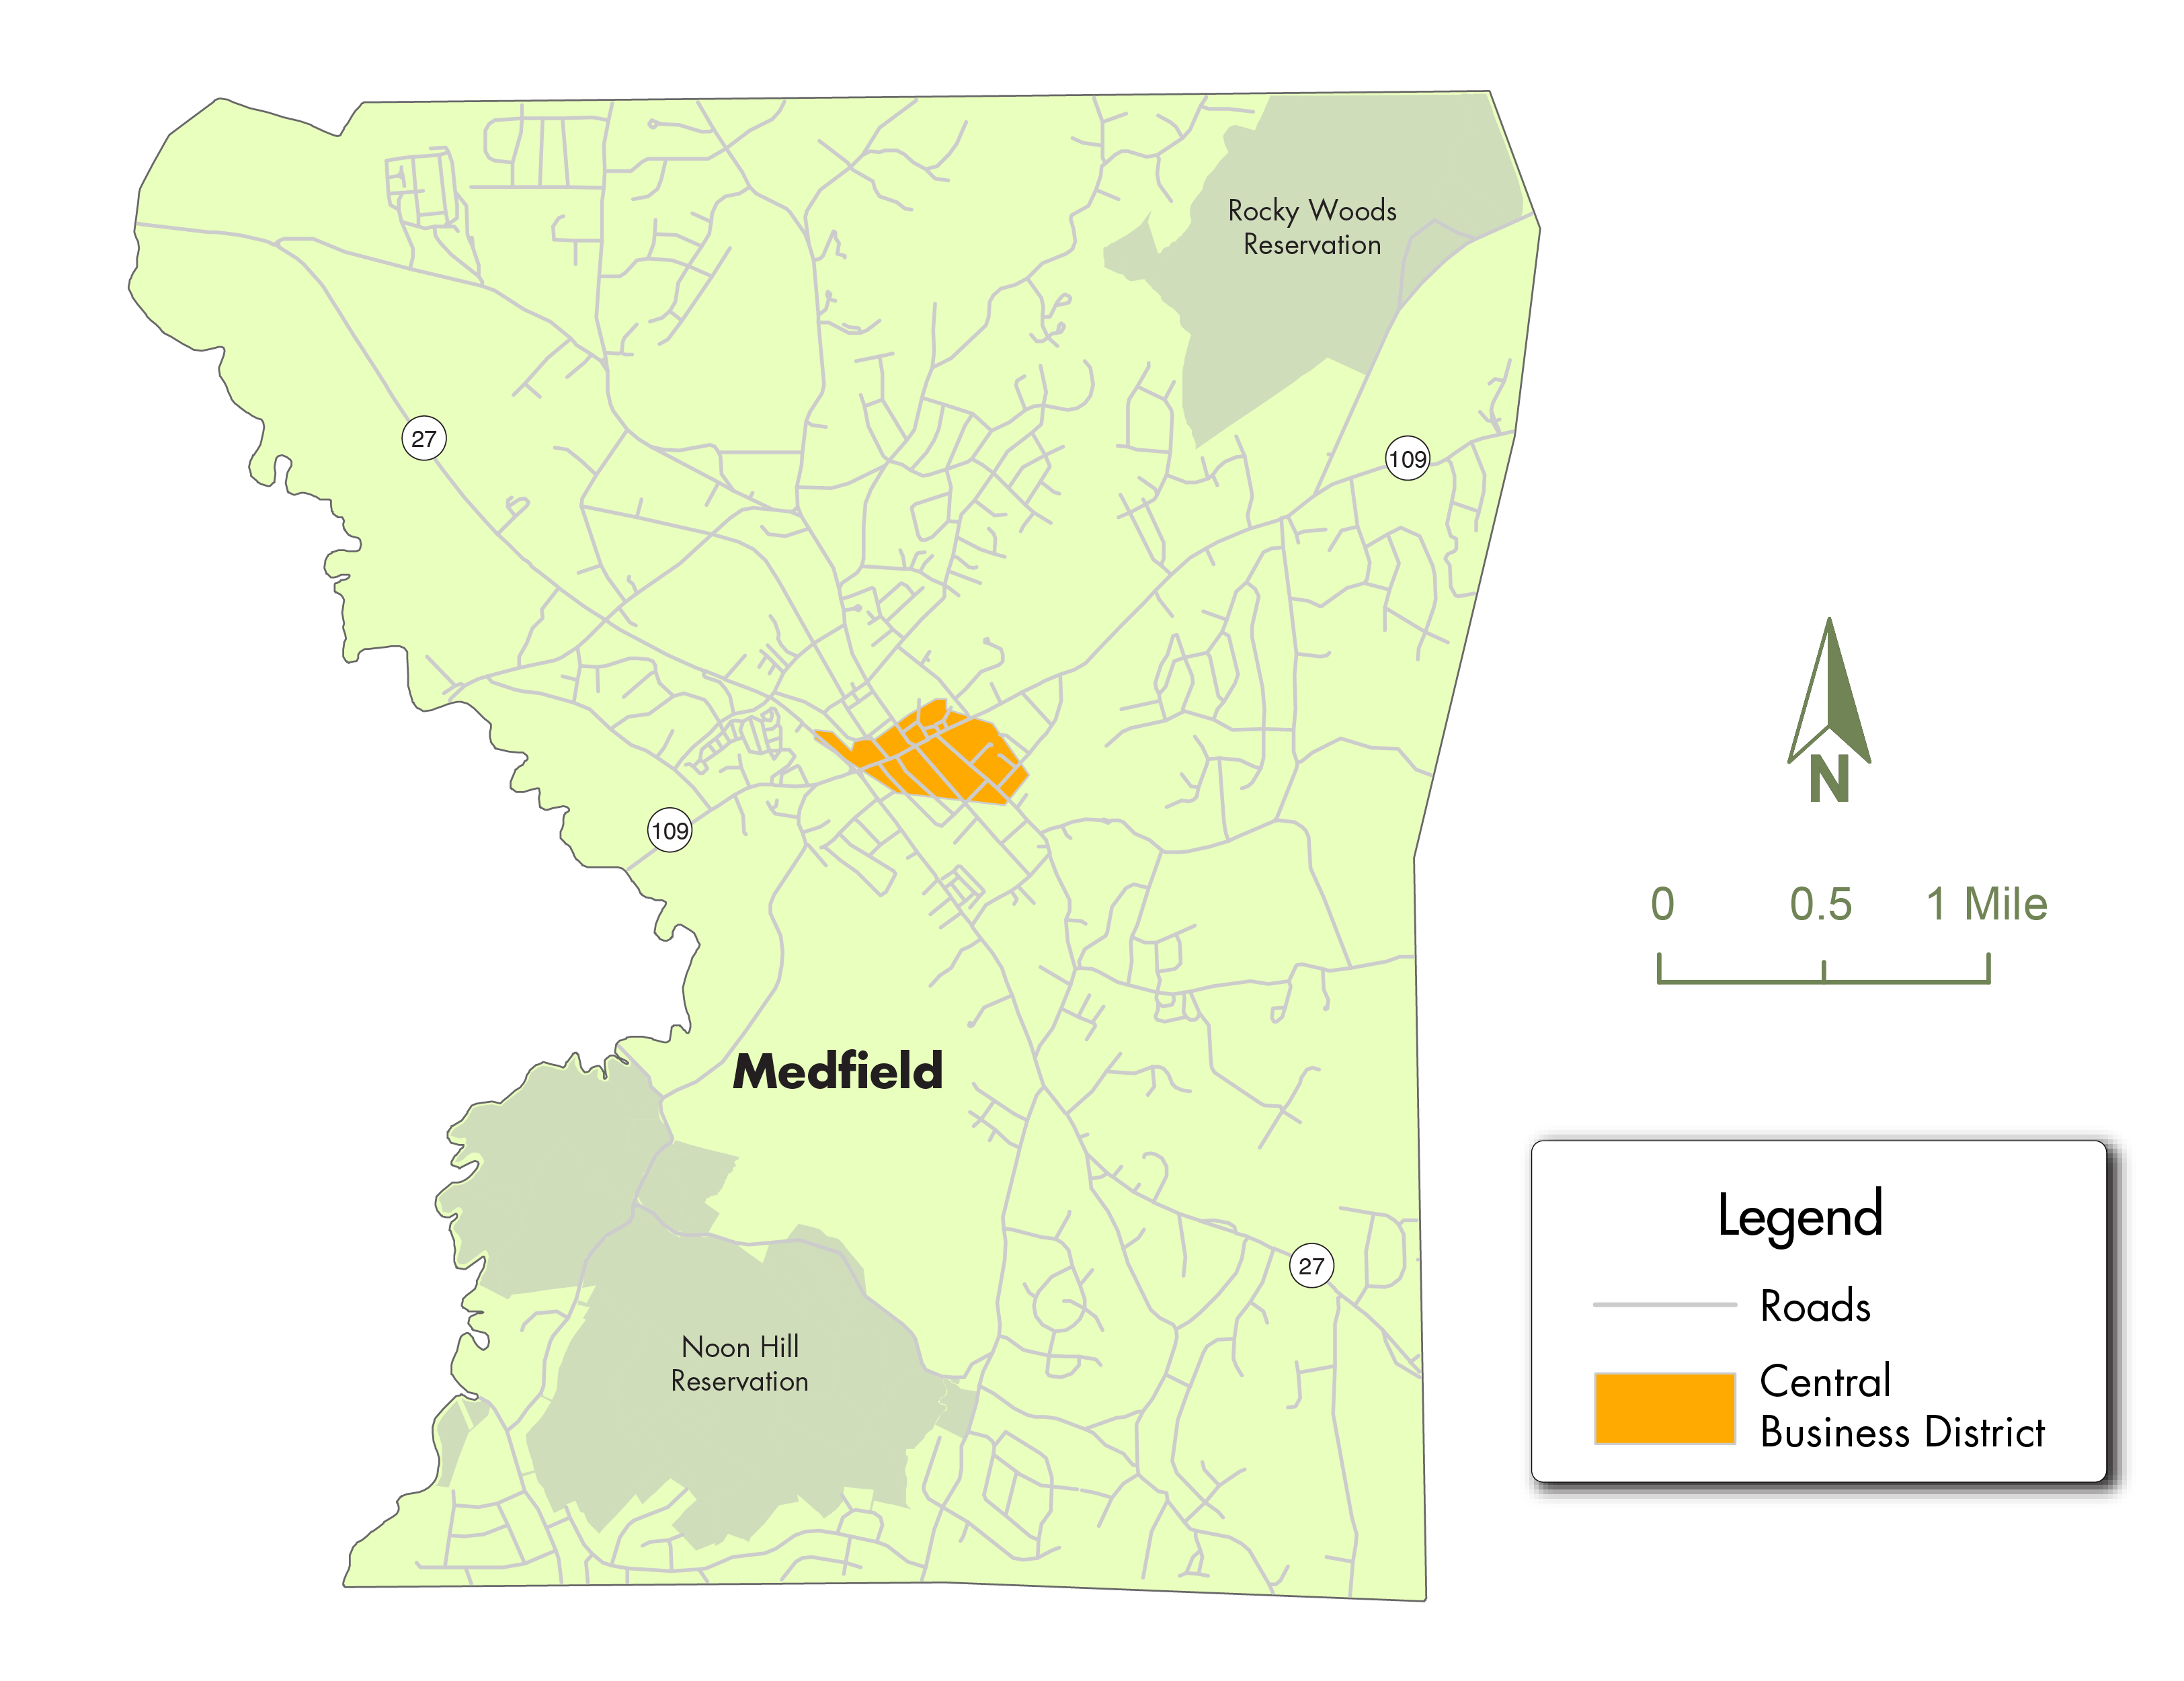
Medfield
Medfield has a small CBD located along Route 109, a highly trafficked east-west route. It boasts a wide variety of commercial and civic uses, such as the town hall, library, restaurants, a supermarket, personal service businesses, and retail. There is no public transit service, with the closest commuter rail stations in Walpole and Norwood on the Franklin Line.
Figure A.10
Medfield Commercial Business District
Key Indicators
| Indicator |
Medfield CBD |
Medfield |
|---|---|---|
Population |
1,241 |
12,799 |
Minority population |
13.2% |
12.0% |
Low-income population |
13.4% |
3.4% |
Percent of jobs that could be done at home |
27.3% |
N/A |
Remote work impact ratio |
0.69 |
N/A |
Top three industry sectors: |
Accommodation and food services Healthcare and social assistance Retail trade |
Educational Healthcare and social assistance Retail trade |
CBD = commercial business district. N/A = not applicable.
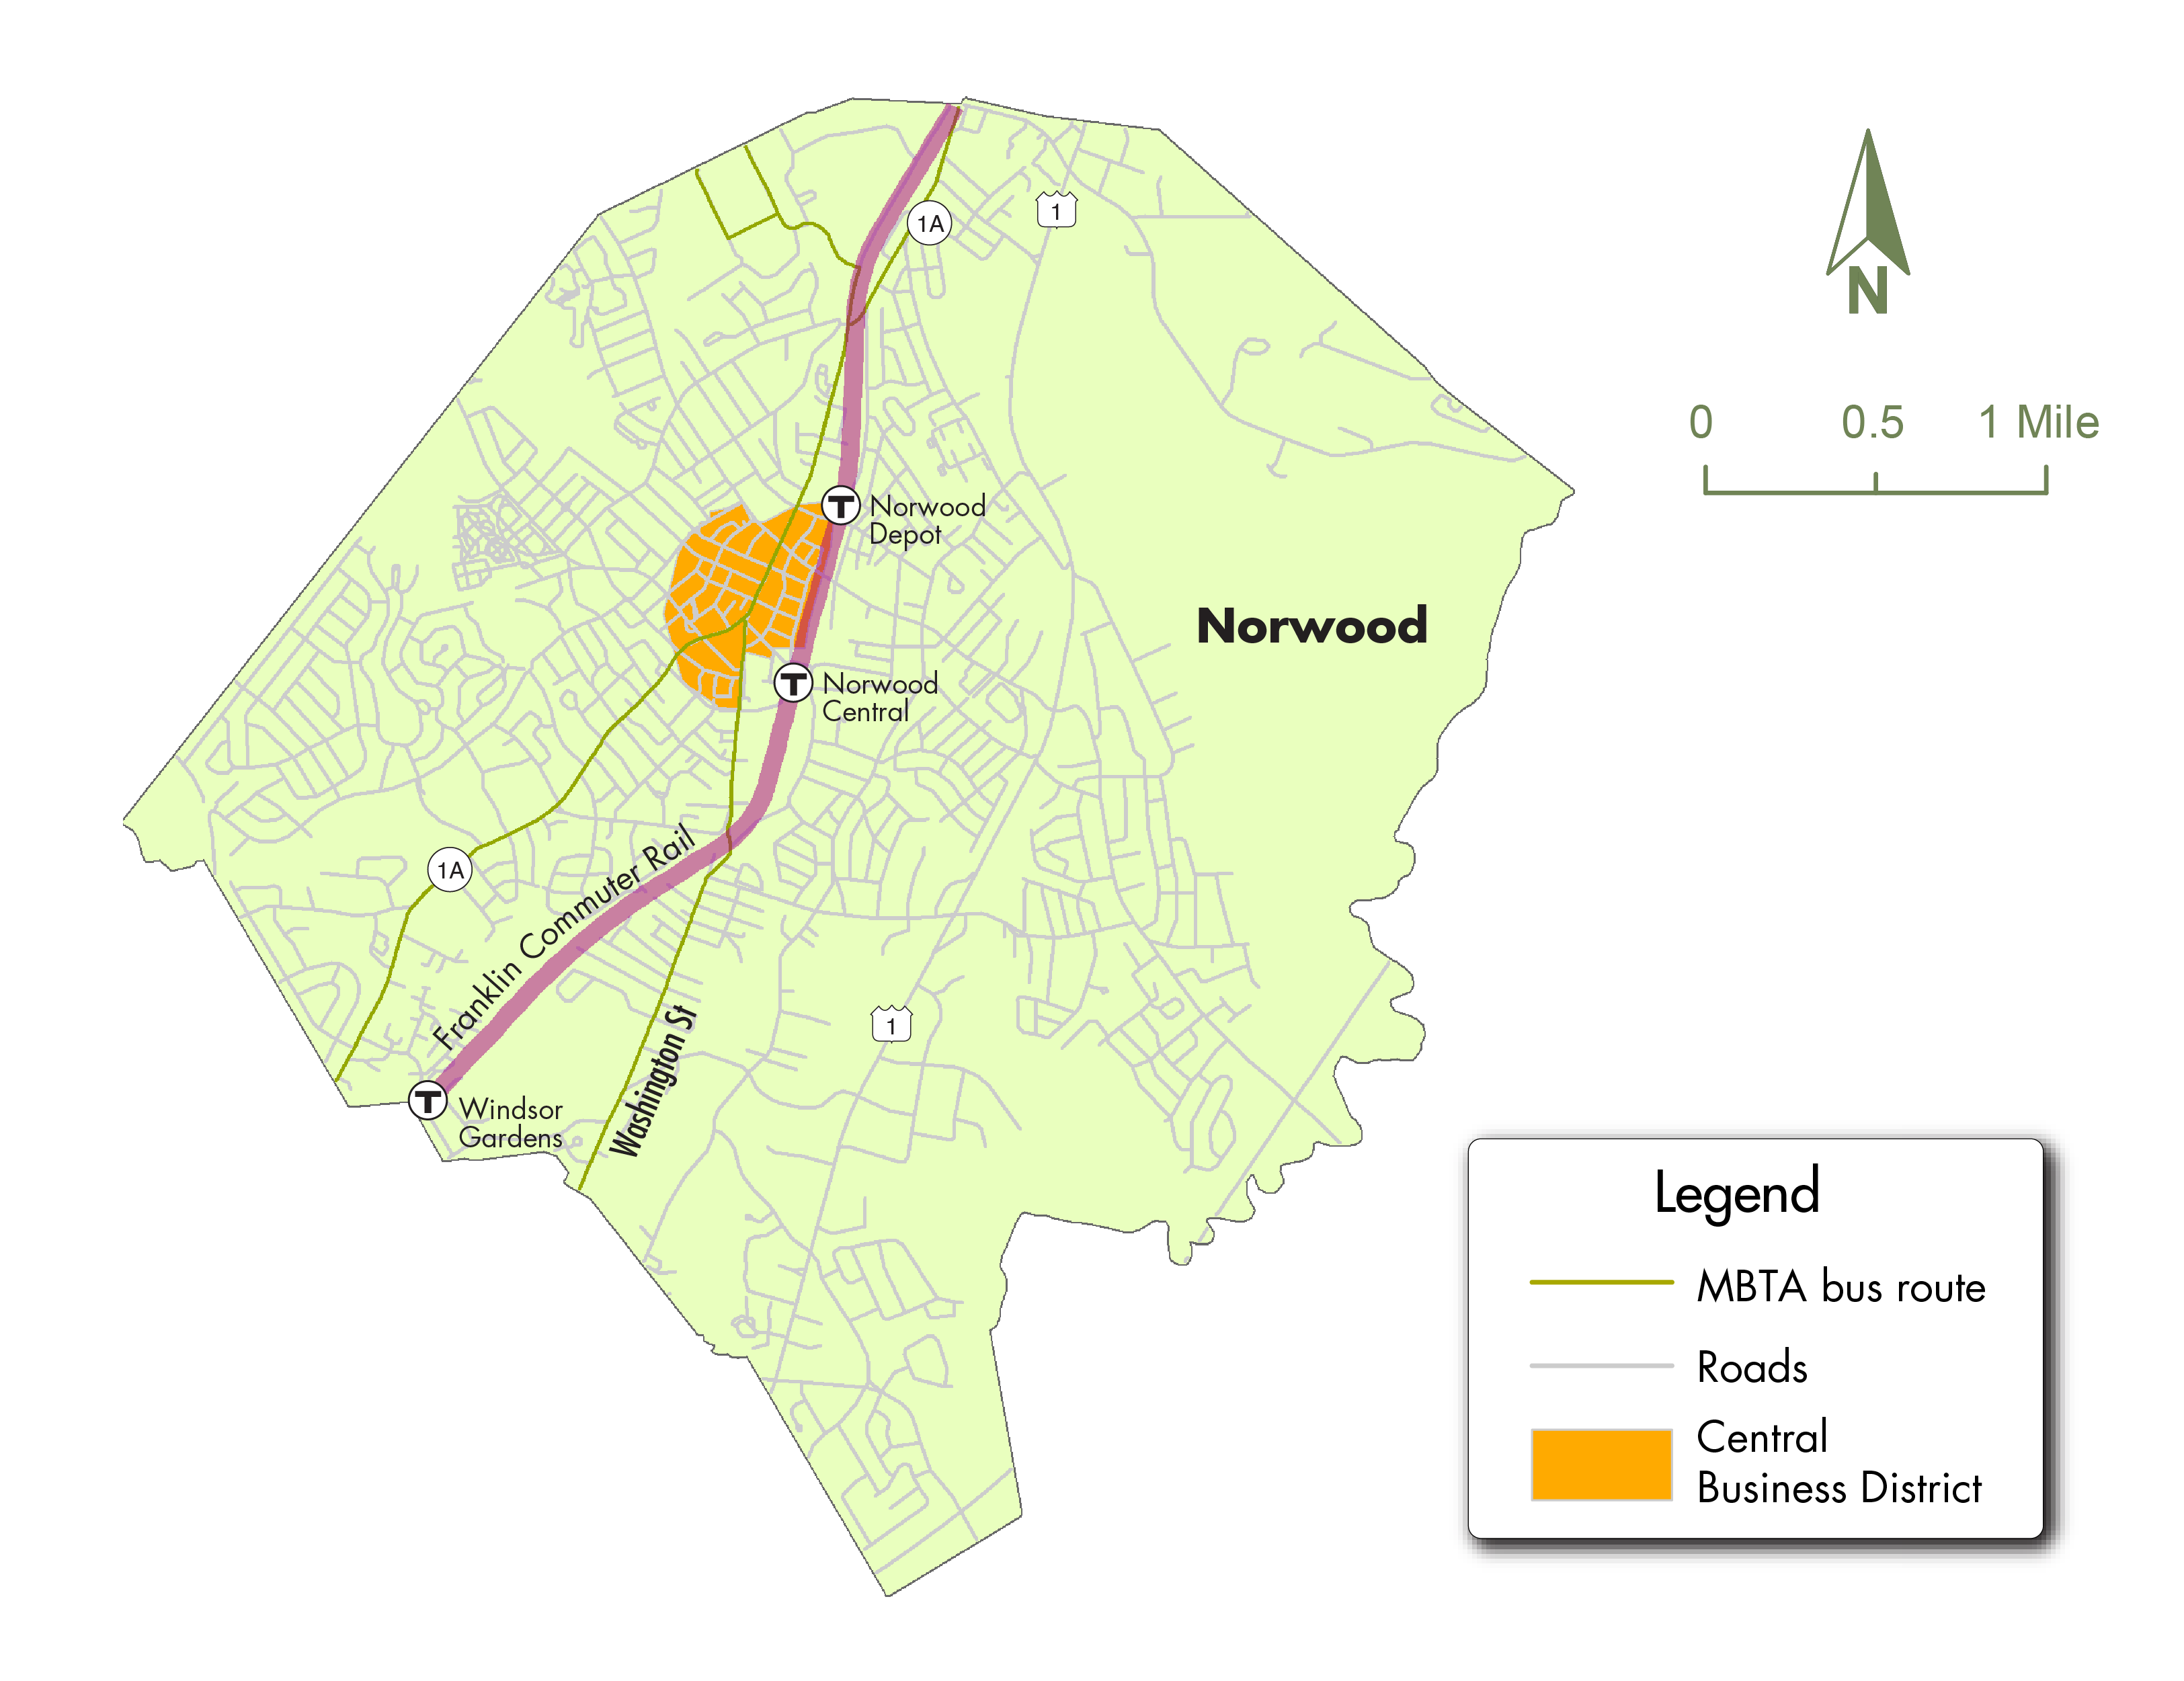
Norwood
An old streetcar suburb, Norwood has a historic downtown with many old buildings. With about 150 businesses, there are a wide variety of restaurants, retail, and service uses. While the CBD itself is largely commercial, there are several walkable residential neighborhoods nearby. The Norwood Central and Norwood Depot commuter rail stations are both adjacent to the CBD; a third station, Windsor Gardens, is in the southern edge of the town.
Figure A.11
Norwood Commercial Business Districts
Key Indicators
| Indicator |
Norwood CBD |
Norwood |
|---|---|---|
Population |
4,568 |
31,611 |
Minority population |
21.2% |
26.3% |
Low-income population |
18.8% |
15.7% |
Percent of jobs that could be done at home |
23.7% |
N/A |
Remote work impact ratio |
0.62 |
N/A |
Top three industry sectors: |
Healthcare and social assistance Educational services Accommodation and food services |
Healthcare and social assistance Retail trade Manufacturing |
CBD = commercial business district. N/A = not applicable.
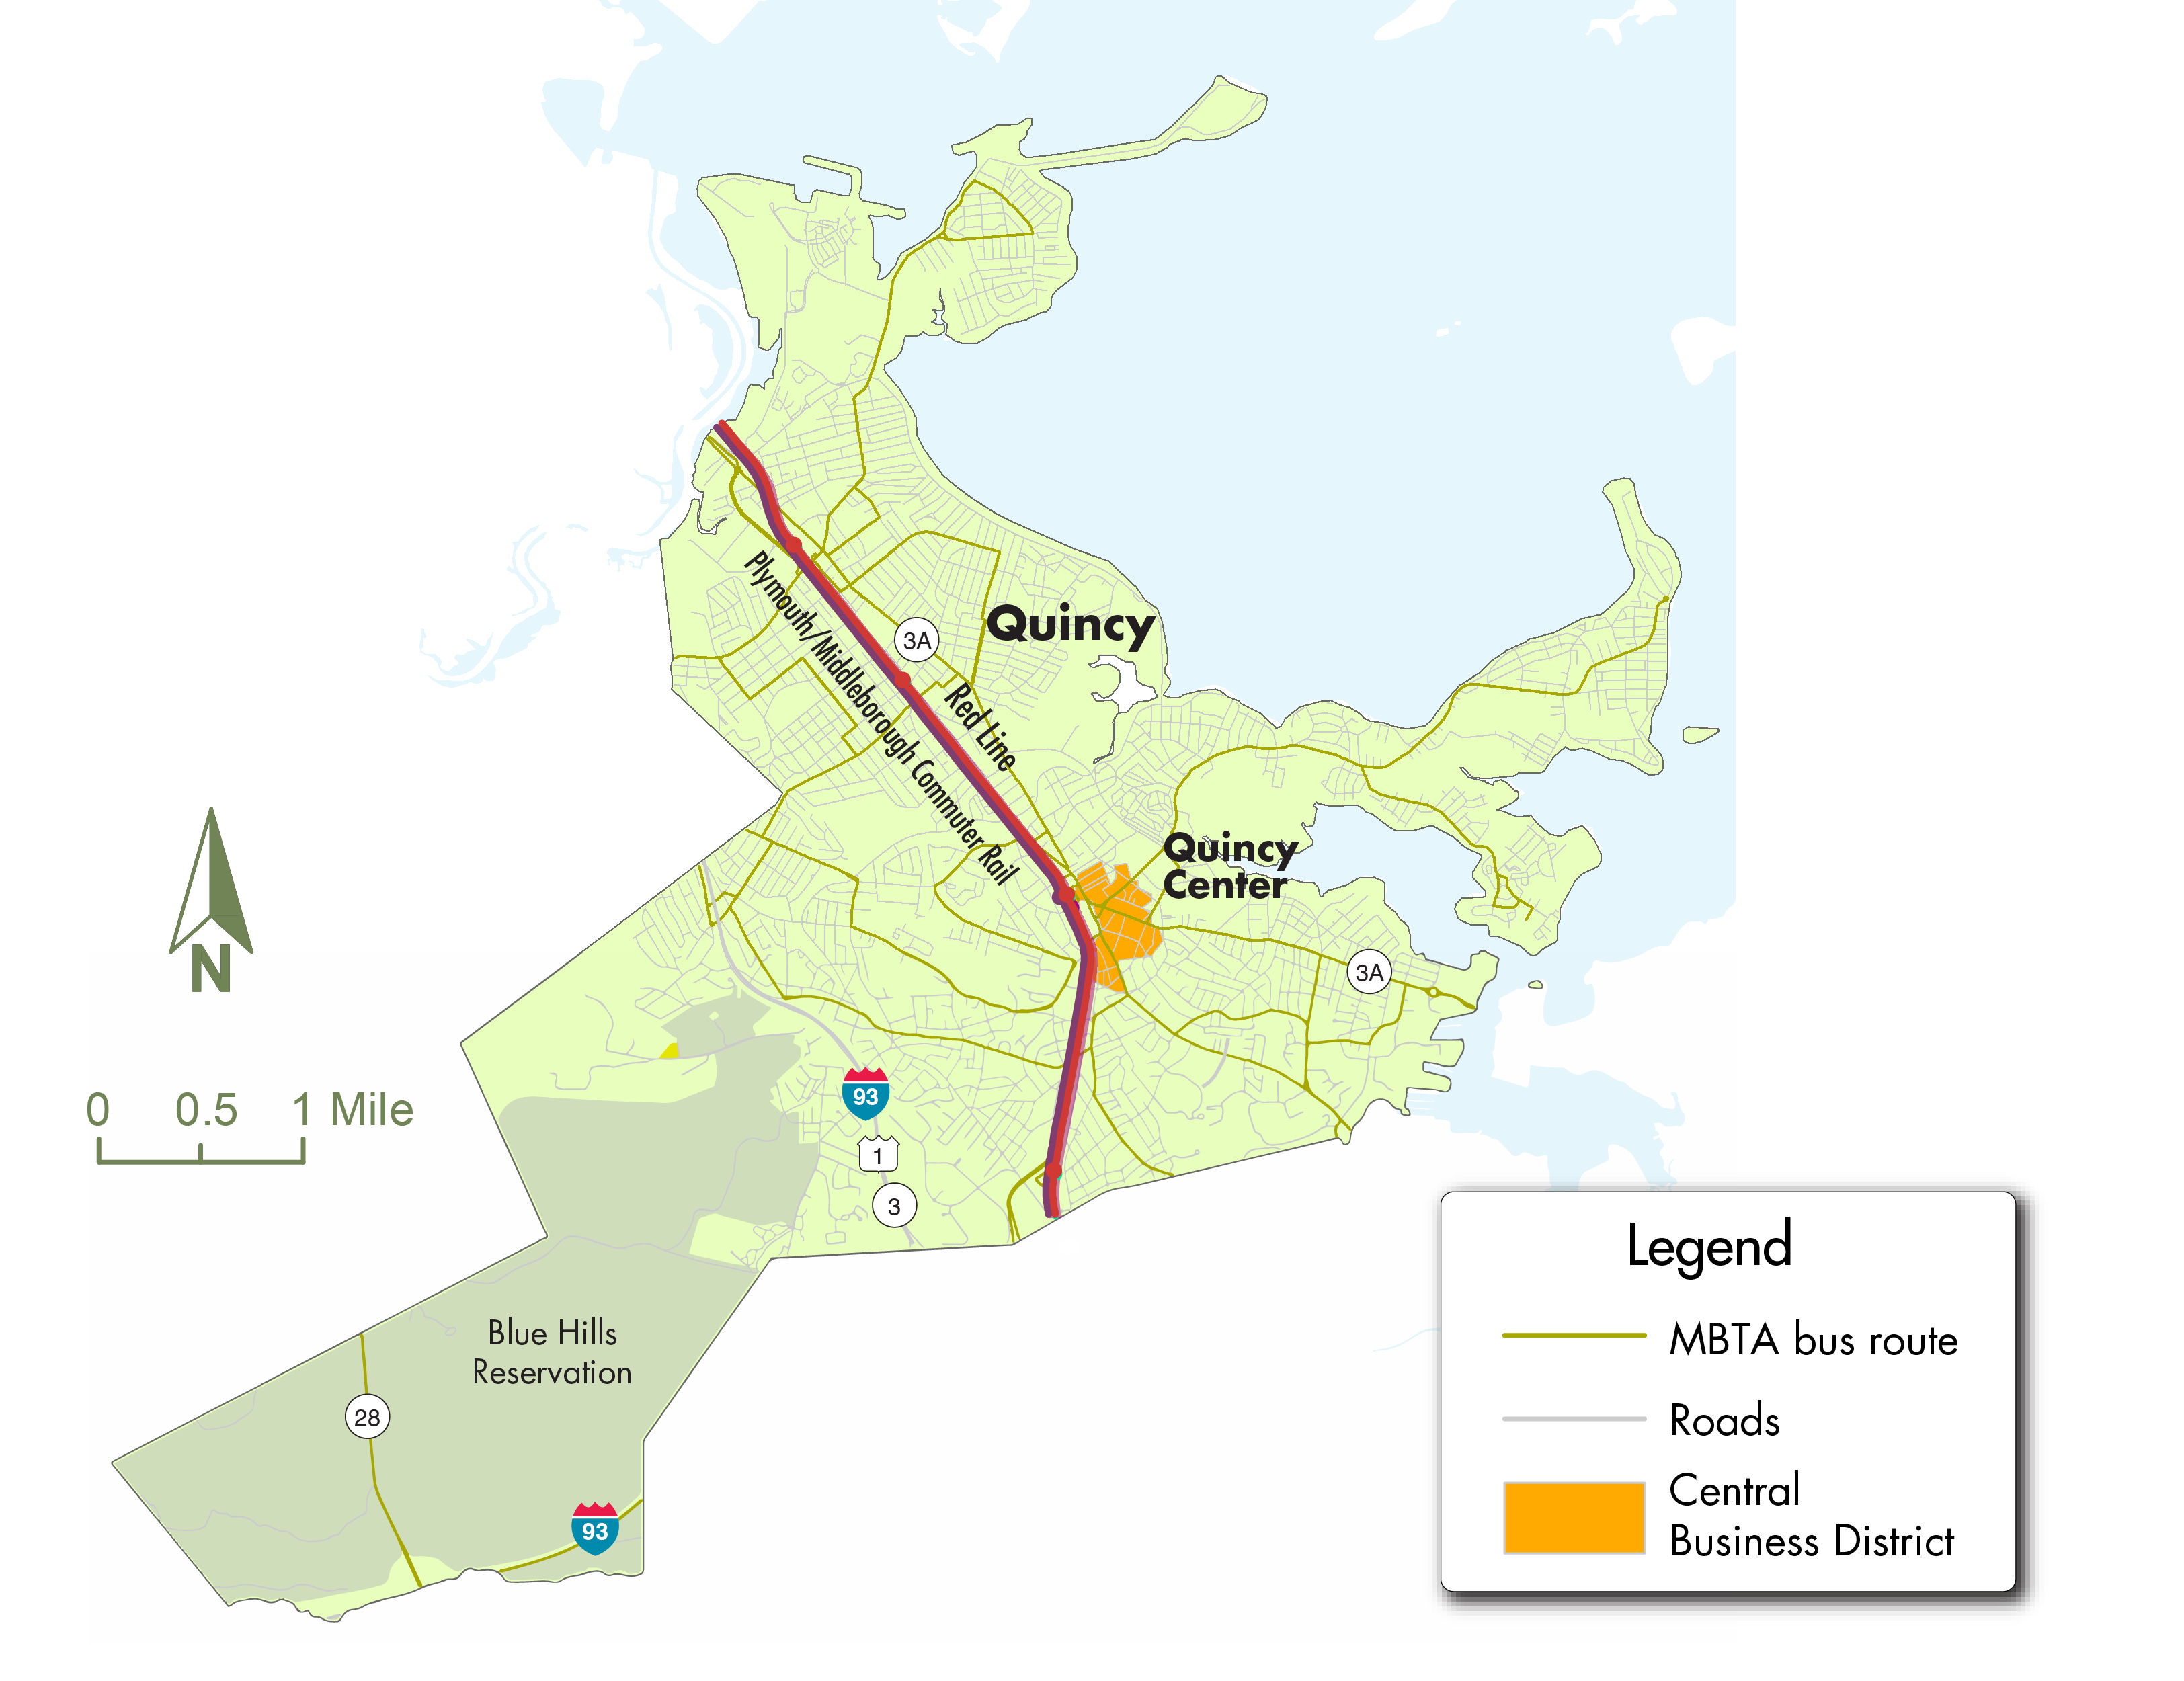
Quincy
Quincy’s CBD is located east of the Quincy Center station, which serves as a stop on the Red Line rapid transit line and the commuter rail. Quincy Center is the city’s flagship business district with a mix of restaurants and other small businesses. There are a couple of corporate anchors, including Stop n’ Shop. The city also has two smaller commercial districts in North Quincy and Wollaston, both of which are also served by the Red Line. Quincy is also home to several office parks, which are less integrated into the rest of the city’s fabric.
Figure A.12
Quincy Commercial Business District
Key Indicators
| Indicator |
Quincy CBD |
Quincy |
|---|---|---|
Population |
8,598 |
101,636 |
Minority population |
47.4% |
44.9% |
Low-income population |
22.9% |
25.5% |
Percent of jobs that could be |
31.6% |
N/A |
Remote work impact ratio |
1.00 |
N/A |
Top three industry sectors: |
Healthcare and social assistance Educational services Retail trade |
Finance and insurance Health care and social assistance Retail trade |
CBD = commercial business district. N/A = not applicable.
Appendix B – Focus Group Discussion and Themes
In addition to the stakeholder interviews, MPO staff organized a focus group with community-based organizations and economic development organizations that worked in municipalities included in the case studies. The goal was to get perspectives from the business and community groups on pandemic impacts and recovery. A total of seven individuals from five organizations participated in the focus group. The conversation lasted 1.5 hours and took place virtually on Zoom.
Discussion Questions
In preparation for the focus group, MPO staff developed questions to solicit discussion about the pandemic, its impacts, and responses from the municipalities the participants worked in. Additionally, staff wanted to hear from participants what uncertainties about the future they are most concerned with. Questions included:
Key Themes from the Focus Group Discussion
This section describes the key takeaways from the focus group discussion that relate to the questions above.
Reactions to Pandemic Interventions
Uncertainties Around the Future of Transportation and Businesses in CBDs
Participants in the focus group highlighted some of the same issues that interviewees discussed, including uncertainty around commuting patterns, long term effects of affordability because of an increase in teleworkers moving out of Boston, and possible loss of foot traffic in CBDs. They also brought up important equity issues, such as gentrification, lack of transportation connectivity, and affordability. These inputs, as well as those from the interviews, were used to help develop the recommendations provided in the guidebook.
Appendix C – Discussion of Driving Forces and Their Possible Impacts
Brick and Mortar* Business Models
Throughout the pandemic, businesses sought creative ways to stay afloat, such as offering contactless deliveries, pursuing digital advertising, and implementing safety protocols. It remains to be seen whether these changes will stick. It will depend in part on the evolution of the pandemic, the willingness of consumers to shop in stores, and preferences for online shopping. Changes to business models will also affect the amount of delivery vehicle traffic and the need for curb space to accommodate these vehicles, and short-term parking through pick-up/drop-off and delivery zones.
Consumer Shopping Preferences
An increase in the number of people working remotely could change the retail landscape in CBDs. Businesses that depend on the commuter population would likely experience a drop in demand. A recent survey of Massachusetts businesses found that 39 percent would either need to close or move if teleworking continues. In some CBDs, however, some businesses may be supported by residents working remotely. This could move several thousand retail jobs out of the immediate Boston area and into smaller towns beyond the city.26
COVID-19 Vaccination Rates
One encouraging trend is that much of the Massachusetts population is vaccinated, the second highest in the country behind Vermont, as of August 2021.27 Now that a vaccine is approved for children under 12, that percentage is likely to increase. Whatever direction the pandemic takes in the months and years to come, a high vaccination rate in the Boston region would be expected. However, vaccination rates vary between communities, as does the extent of community spread. Communities with greater vulnerability to COVID-19 include those with a high population of people of color, with certain medical conditions, with exposure to high levels of air pollution, with uninsured populations, and with people 65 and older.28
Duration of COVID-19
As the Delta variant of COVID-19 spread in the summer and early fall of 2021 despite increasing vaccination rates, it became increasingly possible that COVID-19 will become endemic—the virus will not disappear, but enough people would gain immunity through vaccinations and natural infections to minimize its spread. Infection rates would instead
be relatively constant every year with occasional flare-ups.29 ,30 If it does become endemic, this could have profound consequences for the future of transportation, depending on how long the Commonwealth remains in the pandemic phase and how severe the flare-ups are (after it becomes endemic). Already, the pandemic has affected changes in travel behavior with an increase in use for modes that are perceived as less risky for contracting COVID-19.31 Over time, the evolution of COVID-19 into an endemic disease may also affect the number of people who work remotely and where workers choose to live, which could cause a big long-term shift in travel patterns and behavior.
Employer Demand for Office Space
The impacts of the pandemic-induced remote work experiment extend beyond the workplace. Since telework-compatible jobs are not uniformly distributed across industries, geography, income, and educational attainment, traditional urban cores with a high density of office buildings have been more disproportionately affected by the switch to remote work than others. This is especially true for downtown Boston, where office buildings account for more than 80 percent of building density.32 If remote work becomes commonplace, traditional models of public transit service and transportation services that focus on serving these office locations may no longer be sustainable.
Employer Teleworking Policies
It is widely expected that employer teleworking policies will provide flexibility around working from home, causing the number of people who work remotely at least part time will be greater than before the pandemic. Among the municipalities profiled in Appendix A in only two—Medfield and Concord—did the share of workers working remotely exceed 10 percent as of 2019 (12.8 percent and 13.6 percent, respectively).33 A survey of workers largely employed in office-oriented jobs in Boston metro area (conducted by A Better City in 2020) found that 77 percent worked remotely at least a few days a week at the time of the survey. The same survey shows that 68 percent of workers said they wanted to continue to do so at least a few days a week after the pandemic.34 Nationally, another survey showed that of employees who work in industries where working remotely is possible, 63 percent of workers prefer to work remotely three or more days a week.35
However, workers who can work remotely are not fully representative of the types of jobs Boston region workers are employed in. Among the top three industry sectors with the most jobs in the Boston region, health care and social assistance has the most (approximately 16 percent) and these jobs have limited potential for remote work. Rounding out the top three are professional, scientific, and technical services (14 percent) and educational services (13 percent). The former has among the highest potential for remote work and the latter is highly dependent on the type of job and education service provided. More than a quarter of jobs in the Boston region have very limited potential for remote work, including retail, food and accommodation, agriculture, and construction.36
Some job industries where tasks do not require employees to be physically on-site, such as finance and insurance, will likely see a higher share of employees working remotely. Other industries, whether because employees must be on-site to do their tasks or because productivity and/or work quality is significantly lower offsite, will likely have limited teleworking potential.37 This could have significant repercussions over the long term, where essential workers—and any whose job tasks require them to be onsite—live closer to their jobs than their teleworking counterparts. While pre-pandemic downtown Boston and other large CBDs attracted new residents with a combination of job opportunities and a high quality of life, the opportunity to work remotely could change that dynamic for a large proportion of workers. As discussed in Appendix A, based on RWIR calculations, up to 53 percent of jobs in Boston could be done at home at least part time. While these employment and residential patterns are still in flux, there is little doubt that an enduring pandemic-turned-endemic-disease will require rethinking of how transportation can best serve the needs of the region’s workers.
MBTA Service Priorities
As the MBTA brought back commuter rail service in the spring and summer of 2021, schedules were revised to better match the needs of essential workers and shift workers to provide more predictable timetables as the commuter rail system moves toward providing a regional rail-type service. In the spring of 2021, more trains were added in the middle of the day and schedules were revised to offer regular, on-the-hour departures.38 Starting in the summer, earlier trains were added on weekends to support workers who commute during those times.39
The MBTA is also using its Bus Network Redesign project to update the bus network to reflect changes to the region’s demographics, employment centers, traffic congestion, and travel patterns. The MBTA has been collecting and analyzing travel demand data (for all modes) to evaluate demand and analyze gaps in the bus network. As of August 2021, the draft plan prioritizes riders in transit-critical communities, such as Roxbury, Mattapan, and Lynn. Other priority routes could include bus service where there is currently a high travel demand, routes where service currently does not meet demand, and more midday, evening, and weekend service.40 , 41
Socioeconomic Inequities
The Boston region is a diverse place—more than one-third of the population identifies as a minority, more than 20 non-English languages are spoken, and 22 percent of the population are immigrants.42 , 43 , 44 It is also an aging population: the share of population ages 75 and older is projected to increase from 7.1 percent in 2019 to 11.7 percent in 2040, while the population under age 19 is expected to decrease by several percentage points.45
Boston is also a region of significant income inequality, which refers to the gap between the top and bottom of household income distribution. In a national 2018 analysis of income inequality, the four counties that predominantly make up the Boston region—Suffolk, Middlesex, Essex, and Norfolk—all rank in the top 10 percent nationally for income inequality. This inequality makes affordable housing, which is also the main way families build wealth, unavailable for many.46 Additionally, White households have significantly higher household wealth than other racial and ethnic groups. A study by the Federal Reserve Bank of Boston found that White household median net worth was at least 20 times greater than non-White or Hispanic households.47
The pandemic has exacerbated this economic inequity. Unemployment due to the pandemic has been higher for Hispanic and Black workers. A large share of these workers are also employed in fields where they cannot work remotely, which makes them more susceptible to COVID-19. Among other groups vulnerable to pandemic-related impacts, job recovery for women, especially those with less education or income, is expected to be one to two years behind men.48
Given these statistics, providing safe, convenient, and affordable transportation options is critical to reducing economic disparities. Boston region CBDs cannot thrive without addressing the long overlooked racial and economic disparities in transportation benefits and burdens.
Residential Preferences
An increase in remote work could also change where workers choose to live. This trend will likely take longer to develop as it depends on other driving forces, such as vaccination rates and employer remote work policies, and family obligations. The opportunity to work remotely may prompt workers to move to the western part of the Boston Region MPO area or communities in Central or Western Massachusetts that are more affordable, have more space, and/or have greater access to the outdoors—more important in the pandemic era. In the months immediately following March 2020’s stay-at-home order, about one-in-five Americans moved permanently or temporarily or knew someone who did. More than a quarter of those did so to reduce the risk of contracting COVID-19.49
Since then, data are beginning to show clearer trends regarding the impact of the pandemic on housing decisions. Nationwide, these appear to be less of an urban exodus than a reshuffle. As of April 2021, 85 percent of movers moved within the same metropolitan area and another eight percent moved within the same state. These data show an acceleration of the trend of moving from the downtowns of major cities to suburbs, small towns, and even satellite cities that still allow access to the urban core. The Boston metro area continued to see more people moving out than in, the rate of which increased over 2019; all the other metro areas in Massachusetts saw an increase. Most of the moves from the Boston metro area were within the state, as well as New Hampshire, Maine, and Rhode Island.50
Electronic Commerce (E-commerce)
Another trend that could negatively impact businesses in CBDs is the accelerating demand for online shopping. Data from the Census Bureau’s Quarterly E-Commerce Report show that online sales increased nationally by at least one-third over the previous year (in which there was no pandemic), in the second, third, and fourth quarters of 2020, and the first quarter of 2021. The second quarter of 2021 also shows a continued, albeit smaller increase over 2020, suggesting that e-commerce may continue to thrive as the country moves toward recovery.51 Data also show that while in-person sales dropped at the beginning of the pandemic compared to 2019, sales have increased every month except one. March, April, and May of 2021, the latest months for which there are data, show tremendous growth—26.8 percent, 67.4 percent, and 42.9 percent, respectively, which correspond with increasing vaccination rates and the opening of the state’s economy.52
Travel Preferences
Travel preferences—for walking, bicycling, using public transit, and driving—have altered substantially throughout the course of the pandemic.
Driving
Although weekday traffic volumes have gone up since 2020, volumes have generally not rebounded to 2019 levels on major roads. The Massachusetts Department of Transportation (MassDOT) tracks changes in traffic on major roads in the Commonwealth. In the Boston region, Interstate 90 saw a big reduction in traffic in 2020—hovering between 70 and 30 percent reduction from 2019 levels. Although it has increased through the spring and summer of 2021, in some places traffic is still 10 to 20 percent below 2019 levels. Interstate 93 north of Boston saw a similar trend, although with less reduction in traffic.53
Additionally, weekend statewide vehicle-miles traveled (VMT) is at approximately the same level as weekday VMT. It has not fully returned to pre-COVID-19 levels, remaining between 60 percent and 80 percent of those levels since March 2020. Morning weekday VMT rebounded to about 75 percent of pre-pandemic levels during the same time period.54
Bicycling and Walking
In 2020, most municipalities saw an increase in pedestrian and bicycle activity compared to 2019. The increase was greatest in smaller towns toward the western edge of the Boston region. While BlueBike rentals dropped off in 2020, rentals rebounded in 2021, and on many days outpaced 2019 use.55 While rentals declined during peak commuting periods compared to 2019, use of BlueBikes during off-peak periods has returned to 2019 levels. Finally, the number of “loop trips”—those that begin and end at the same station—was almost double in the summer of 2020 compared to 2019.56
Parking data at MBTA-owned commuter rail lots shows that prior to March 2020, parking demand was highest on weekdays. Since then, lot occupancy rates have dropped to below 10 percent of that level at many lots. For those lots in municipalities included as case studies in this guidebook, all have parking rates within a fraction of 2019 levels: Framingham is down 65 percent, Norwood Center is down 56 percent, and Norwood Depot is down 37 percent.57 Across the commuter rail system, ridership numbers show a similar trend: in January 2020, ridership was 115,000 daily riders; a year later, it was 14,000 daily riders. However, since then, ridership has steadily increased; the latest data show that it reached 33,000 daily riders in August 2021. While still less than one-third of early 2020 levels, it has more than doubled since August 2020.58
Public Transit
In January of 2020, an average of about 675,000 rapid transit weekday trips were made. One year later, the average was 155,000 trips.59 At East Boston’s Maverick Station on the Blue Line, ridership in August of 2021 was still just 65 percent of what it was in January of 2020. Among the four Red Line stations in Quincy, ridership in August of 2021 was between 40 and 50 percent of what it was in January of 2020.60
Weekday bus ridership has been the most durable of the public transit modes. Initially, it dropped from 387,000 in January 2020 to 152,000 a year later.61 As of August 2021, it is up to about 230,000.62
1 MassDOT Mobility Dashboard, Massachusetts Department of Transportation, accessed September 6, 2021, https://mobility-massdot.hub.arcgis.com.
2 Jonathan Dingel and Brent Neiman, “How Many Jobs Can Be Done at Home?” Journal of Public Economics 189 (September 2020): 104235, https://www.sciencedirect.com/science/article/abs/pii/S0047272720300992.
3 U.S. Census Bureau, “Sex of Workers by Means of Transportation to Work,” 2019 American Community Survey 5-Year Estimates, Table B0806, accessed October 4, 2021.
4 A Better City, “Anticipating Post-Pandemic Commute Trends in Metro-Boston,” November 2020, https://www.abettercity.org/docs-new/EF_Survey_Report_Nov_2020.pdf. Note: Data reflect 4,200 survey responses from employees primarily working in the hospital, higher education, and business professional industries.
5 Preparing for the Future of Work in the Commonwealth of Massachusetts,” Commonwealth of Massachusetts, July 2021, https://www.mass.gov/doc/future-of-work-in-massachusetts-report/.
6 U.S. Census Bureau, “Industry by Sex for the Civilian Employed Population 16 Years and Over,” 2019 American Community Survey 5-Year Estimates, Table S2403, accessed September 24, 2021.
7 Urban Land Institute, Emerging Trends in Real Estate: United States and Canada 2021, 2021, https://knowledge.uli.org/-/media/files/emerging-trends/2021/emerging-trends-in-real-estate-united-states-and-canada-2021---final.pdf.
8 Marie Patino, Aaron Kessler, and Sarah Holder, “More Americans Are Leaving Cities, But Don’t Call It an Urban Exodus,” Bloomberg CityLab, April 26, 2021, https://www.bloomberg.com/graphics/2021-citylab-how-americans-moved/.
9 Rick Sobey, “Massachusetts Small Businesses Closed by Coronavirus at 37%: Report,” Boston Herald, November 30, 2020, https://www.bostonherald.com/2020/11/30/massachusetts-small-businesses-closed-by-coronavirus-at-37-report/.
10 Fareeha Ali, “US eCommerce Grows 44.0% in 2020,” Digital Commerce 360, January 29, 2021, https://www.digitalcommerce360.com/article/us-ecommerce-sales/.
11 Mark Melnik and Abby Raisz, “Across Two Waves: COVID-19 Disparities in Massachusetts,” Boston Indicators, December 18, 2020, https://www.bostonindicators.org/reports/report-website-pages/covid_indicators-x2/2020/december/persisting-covid-disparities.
12 Commonwealth of Massachusetts, “COVID-19 Response Reporting,” Last updated September 8, 2021, https://www.mass.gov/info-details/covid-19-response-reporting#covid-19-interactive-data-dashboard-%20Under%20Patient%20Data.
13 UMass Donahue Institute, “Donahue Data Dash: Linking COVID-19 Cases with Rase, Housing, and Socioeconomic Status in Massachusetts Spotlights Inequalities,” May 2020, https://donahue.umass.edu/our-publications/donahue-data-dash-inequalities.
14 Peter Ciurczak, “A Profile of Unemployed Workers in Massachusetts,” Boston Indicators, October 29, 2020, https://www.bostonindicators.org/reports/report-website-pages/covid_indicators-x2/2020/october/unemployment-deep-dive.
15 Anne Calef, “Bus Service Essential to Region during the Pandemic,” Boston Indicators, November 11, 2020, https://www.bostonindicators.org/reports/report-website-pages/covid_indicators-x2/2020/november/pandemic-bus-service.
16 For more information on the benefits of shared-use paths, including economic, see the Massachusetts Department of Transportation’s (MassDOT) report, Impacts of Shared Use Paths.
17 For more strategies for addressing parking concerns, see Managing Curb Space in the Boston Region: A Guidebook.
18 Next Generation Scenario Planning: A Transportation Practitioner’s Guide, Federal Highway Administration, June 2017, https://www.fhwa.dot.gov/planning/scenario_and_visualization/scenario_planning/publications/next_gen/index.cfm.
19 “How to Use Exploratory Scenario Planning (XSP): Navigating an Uncertain Future,” Lincoln Institute of Land Policy, August 2020, https://www.lincolninst.edu/publications/policy-focus-reports/how-use-exploratory-scenario-planning-xsp.
20 “How to Use Exploratory Scenario Planning (XSP): Navigating an Uncertain Future,” Lincoln Institute of Land Policy, August 2020, https://www.lincolninst.edu/publications/policy-focus-reports/how-use-exploratory-scenario-planning-xsp.
21 Note that funding beyond 2021 has not yet been assured.
22 When identifying the jobs that could be done at home, staff excluded education jobs and classified them instead as non-work-from-home jobs since, in general, the quality of full-time online education is lower than in-person education.
23 CES. 2020. “Longitudinal Employer-Household Dynamics (LEHD) - LEHD Origin-Destination Employment Statistics (LODES) - Massachusetts 2018.” LODES 7.5. US Census Bureau - Center for Economic Studies (CES). https://lehd.ces.census.gov/data/.
24 Jonathan I. Dingel and Brent Neiman, “How Many Jobs Can be Done at Home?”, Becker Friedman Institute for Economic at the University of Chicago, June 2020, https://bfi.uchicago.edu/wp-content/uploads/BFI_White-Paper_Dingel_Neiman_3.2020.pdf.
25 Sources for the CBD profiles:
Minority population: U.S. Census Bureau, “2020 Census (P.L. 94-171) Redistricting Data Summary Files,” 2020 United States Census, Legacy Format Summary Files, accessed September 6, 2021, https://www.census.gov/programs-surveys/decennial-census/about/rdo/summary-files.html#P1.
Low-income population: U.S. Census Bureau, “Poverty Status in the Past 12 Months,” 2019 American Community Survey 5-Year Estimates, Table S1701, accessed September 6, 2021.
Percent of jobs that could be done at home and RWIR: U.S. Census Bureau. (YYYY). LEHD Origin-Destination Employment Statistics (2002-2018). Washington, DC: U.S. Census Bureau, Longitudinal-Employer Household Dynamics Program, accessed on MM DD, YYY at https://onthemap.ces.census.gov.
Top three industry sectors: U.S. Census Bureau. (2021). LEHD Origin-Destination Employment Statistics (2002-2018). Washington, DC: U.S. Census Bureau, Longitudinal-Employer Household Dynamics Program, accessed on August 4, 2021, at https://onthemap.ces.census.gov.
26 “Preparing for the Future of Work in the Commonwealth of Massachusetts,” Commonwealth of Massachusetts, July 2021, https://www.mass.gov/doc/future-of-work-in-massachusetts-report/.
27 “How Vaccinations are Going in Your County and State,” The New York Times, accessed August 10, 2021, https://www.nytimes.com/interactive/2020/us/covid-19-vaccine-doses.html.
28 “Details for PVI Maps,” National Institute of Environmental Health Science, last updated June 15, 2021, https://www.niehs.nih.gov/research/programs/coronavirus/covid19pvi/details/.
29 Karen Feldscher, “COVID’s Future: From Pandemic to Endemic?”, The Harvard Gazette, August 12, 2021, https://news.harvard.edu/gazette/story/2021/08/what-will-it-be-like-when-covid-19-becomes-endemic/.
30 Ingrid Torjesen, “Covid-19 will become endemic but with decreased potency over time, scientists believe,” BMJ, February 18, 2021, https://doi.org/10.1136/bmj.n494.
31 “MassDOT Mobility Dashboard,” Massachusetts Department of Transportation, accessed September 6, 2021, https://mobility-massdot.hub.arcgis.com.
32 Emily Badger and Quoctruong Bui, “The Downtown Office District Was Vulnerable. Even before the COVID,” The New York Times, July 7, 2021, https://www.nytimes.com/interactive/2021/07/07/upshot/downtown-office-vulnerable-even-before-covid.html.
33 U.S. Census Bureau, “Selected Economic Characteristics,” 2019 American Community Survey 5-Year Estimates, Table DP03, accessed September 6, 2021.
34 A Better City, “Anticipating Post-Pandemic Commute Trends in Metro-Boston,” November 2020, https://www.abettercity.org/docs-new/EF_Survey_Report_Nov_2020.pdf. Note: Data reflect 4,200 survey complete responses from employees primarily working in the hospital, higher education, and business professional industries.
35 Andrea Alexander, Aaron De Smet, Meredith Langstaff, and Dan Ravid, “What Employees are Saying about the Future of Remote Work,” McKinsey & Company, April 1, 2021, https://www.mckinsey.com/business-functions/organization/our-insights/what-employees-are-saying-about-the-future-of-remote-work.
36 The number of jobs by industry sector in the Boston region are from U.S. Census Bureau, “Industry by Sex for the Civilian Employed Population 16 Years and Over,” 2019 American Community Survey 5-Year Estimates, Table S2403, accessed September 24, 2021. Estimates of the suitability of jobs for teleworking are from Susan Lund, Anu Madgavkar, James Manyika, and Sven Smit, “What’s Next for Remote Work: An Analysis of 2,000 Tasks, 800 Jobs, and Nine Countries,” November 23, 2020, https://www.mckinsey.com/featured-insights/future-of-work/whats-next-for-remote-work-an-analysis-of-2000-tasks-800-jobs-and-nine-countries.
37 Susan Lund, Anu Madgavkar, James Manyika, and Sven Smit, “What’s Next for Remote Work: An Analysis of 2,000 Tasks, 800 Jobs, and Nine Countries,” November 23, 2020, https://www.mckinsey.com/featured-insights/future-of-work/whats-next-for-remote-work-an-analysis-of-2000-tasks-800-jobs-and-nine-countries.
38 “Reminder: Spring Commuter Rail Schedules Take Effect April 5,” Keolis, accessed September 6, 2021, https://www.keoliscs.com/news/reminder-spring-2021-commuter-rail-schedules-take-effect-april-5/.
39 Reminder: Weekend Service Returns to All Commuter Rail Lines July 3,” Massachusetts Bay Transportation Authority, accessed September 6, 2021, https://www.mbta.com/news/2021-07-01/reminder-weekend-service-returns-all-commuter-rail-lines-july-3.
40 “Bus Network Redesign,” Massachusetts Bay Transportation Authority, accessed September 6, 2021, https://www.mbta.com/projects/bus-network-redesign.
41 Christian MiNiel, “Tonight: Help the T Design a New Bus Network,” StreetsBlog Massachusetts, August 26, 2021, https://mass.streetsblog.org/2021/08/26/tonight-help-the-t-design-a-new-bus-network/.
42 U.S. Census Bureau, “2020 Census (P.L. 94-171) Redistricting Data Summary Files,” 2020 United States Census, Legacy Format Summary Files, accessed September 6, 2021, https://www.census.gov/programs-surveys/decennial-census/about/rdo/summary-files.html#P1.
43 U.S. Census Bureau, “Selected Social Characteristics,” 2019 American Community Survey 5-Year Estimates, Table DP02, accessed September 6, 2021.
44 U.S. Census Bureau, “Household Language by Ability to Speak English,” American Community Survey – 5-Year Public Use Microdata Sample (2019).
45 “Socio-Economic Projections for 2020 Regional Transportation Plans,” Mass.gov, accessed September 6, 2021, https://www.mass.gov/lists/socio-economic-projections-for-2020-regional-transportation-plans.
46 “The Greater Boston Housing Report Card: Supply, Demand, and the Challenge of Local Control,” The Boston Foundation, June 2019, https://www.tbf.org/-/media/tbf/reports-and-covers/2019/gbhrc-chapters/gbhrc19-chapter-1--core-metrics.pdf.
47 Ana Patricia Muñoz, Marlene Kim, Mariko Chang, Regine O. Jackson, Darrick Hamilton, and William A. Darity Jr., “The Color of Wealth in Boston,” The Federal Reserve Bank of Boston, March 25, 2015, https://www.bostonfed.org/publications/one-time-pubs/color-of-wealth.aspx.
48 “Preparing for the Future of Work in the Commonwealth of Massachusetts,” Mass.gov, July 2021, https://www.mass.gov/doc/future-of-work-in-massachusetts-report/.
49 D’vera Cohn, “About a fifth of U.S. adults moved due to COVID-19 or know someone who did,” Pew Research Center, July 6, 2020
https://www.pewresearch.org/fact-tank/2020/07/06/about-a-fifth-of-u-s-adults-moved-due-to-covid-19-or-know-someone-who-did/.
50 Marie Patino, Aaron Kessler and Sarah Holder, “More Americans are Leaving Cities, but Don’t Call it an Urban Exodus,” Bloomberg CityLab, April 26, 2021, https://www.bloomberg.com/graphics/2021-citylab-how-americans-moved/.
51 “Quarterly Retail E-Commerce Sales: 2nd Quarter 2021,” U.S. Census Bureau, last updated August 19, 2021, https://www.census.gov/retail/mrts/www/data/pdf/ec_current.pdf.
52 “Monthly State Retail Sales,” U.S. Census Bureau, accessed September 9, 2021, https://www.census.gov/retail/state_retail_sales.html.
53 “MassDOT Mobility Dashboard,” Massachusetts Department of Transportation, accessed September 6, 2021, https://mobility-massdot.hub.arcgis.com.
54 “MassDOT Mobility Dashboard,” Massachusetts Department of Transportation, accessed September 6, 2021, https://mobility-massdot.hub.arcgis.com.
55 MassDOT Mobility Dashboard, Massachusetts Department of Transportation, accessed September 6, 2021, https://mobility-massdot.hub.arcgis.com.
56 Anne Calef, “Interest in Biking Grows Amid the COVID-19 Crisis,” Boston Indicators, February 8, 2021, https://www.bostonindicators.org/reports/report-website-pages/covid_indicators-x2/2021/february/biking-brief.
57 MassDOT Mobility Dashboard, Massachusetts Department of Transportation, accessed September 6, 2021, https://mobility-massdot.hub.arcgis.com.
58 “Commuter Rail Ridership,” MBTA Performance Dashboard, accessed September 6, 2021, https://www.mbtabackontrack.com/performance/index.html#/detail/ridership/2021-04-01/Commuter%20Rail///all.
59 “Subway Ridership,” MBTA Performance Dashboard, accessed September 6, 2021, https://www.mbtabackontrack.com/performance/index.html#/detail/ridership/2021-05-01/Subway///.
60 MassDOT Mobility Dashboard, Massachusetts Department of Transportation, accessed September 6, 2021, https://mobility-massdot.hub.arcgis.com.
61 “Bus Ridership,” MBTA Performance Dashboard, accessed September 6, 2021, https://www.mbtabackontrack.com/performance/index.html#/detail/ridership/2021-04-01/Bus///.
62 MassDOT Mobility Dashboard, Massachusetts Department of Transportation, accessed September 6, 2021, https://mobility-massdot.hub.arcgis.com/.