Technical Memorandum
DATE: November 21, 2019
TO: Boston Region MPO
FROM: Casey-Marie Claude
RE: Pedestrian Report Card Assessment Interactive Database
1 Introduction
The Boston Region Metropolitan Planning Organization (MPO) developed the Pedestrian Report Card Assessment (PRCA) tool as the final product of the Federal Fiscal Year (FFY) 2015 Pedestrian Level-of-Service Metric project. This memorandum documents a follow up to the FFY 2015 project. The PRCA allows users to rate the quality of the pedestrian environment along route segments and at intersections throughout the regional network of roadways, sidewalks, and shared-use paths in terms of pedestrian accommodations and safety. The intent of this project is threefold: (1) to update the PRCA tool using lessons learned while applying the methodology published in January 2017; (2) to implement use of the PRCA tool throughout the Boston region; and (3) to develop an interactive database that will document the suitability for pedestrian travel of intersections and route segments throughout the Boston region’s pedestrian network. This project is a continuation of work that began in 2017 with the publication of the PRCA tool and the start of another project that developed the Boston region MPO’s Bicycle Report Card, published in 2018.
The PRCA was developed to support the MPO’s objectives related to increasing the number of pedestrian trips and improving the safety of pedestrians throughout the Boston region. Pedestrian trips are influenced by pedestrians’ perceived safety and comfort while traveling to a destination. To increase the number of pedestrian trips, it is important to address safety and comfort concerns. The PRCA provides a methodology for assessing conditions for pedestrians along route segments and at intersections throughout the Boston region’s pedestrian network. Locations with high-quality pedestrian environments receive “good grades,” and “poor grades” are given on report cards for elements that contribute to a sense of danger or lack of comfort for pedestrians. The PRCAs are included in Appendix A.
Gathering PRCA scores for the Boston region and providing the data in an easily accessible online format allows the public, especially municipalities, to understand the factors contributing to or preventing pedestrian travel at specific locations. The grades assigned to each pedestrian network route segment and intersection for the four PRCA categories are determined by performance measures that reflect conditions at each location. Providing the data for each performance measure through the PRCA dashboard allows the public to identify which elements of a location are in need of improvement to encourage increased pedestrian travel.
2 PRCA overview
The PRCA is structured as a report card for roadway segments and intersections. Children do not receive one cumulative score to illustrate how they are progressing in school. Instead, a child’s report card shows parents the subjects and tasks at which their student is excelling and provides insight into topics and skills that require attention. The goal of the PRCA is to provide similar insight into the aspects of roadway segments and intersections that are performing well and those that are in need of improvement. Similar to how a child is given a unique grade for every class, locations are awarded scores for specific grading categories. While a child’s class grade is calculated by using scores earned for multiple assignments, a roadway segment or intersection grade is calculated using scores awarded to performance measures.
2.1 Grading Categories
The PRCA grading categories are four of the six goals identified in the 2019 Long-Range Transportation Plan (LRTP), Destination 2040:
- Capacity Management and Mobility
- This goal focuses on using existing facility capacity more efficiently and increasing transportation options. Towards this end, the grading category assesses how the transportation network serves pedestrians and considers its accessibility to all users. This includes meeting the Americans with Disabilities Act (ADA) standards.
- Economic Vitality
- The purpose of this goal is to ensure that our transportation network provides a strong foundation for economic vitality. For this purpose, the grading category measures the vibrancy of pedestrian travel at a location because people on foot and wheels support economic activity.
- Safety
- The MPO’s goal is for all transportation modes to be safe, which is reflected in this grading category that is concerned with the overall safety of pedestrians.
- System Preservation
- This goal seeks to maintain and modernize the transportation system and plan for its resiliency, which this grading category accomplishes by assessing the condition of pedestrian infrastructure.
Transportation Equity, another of the 2019 LRTP goals, strives to ensure that all people receive comparable benefits from, and are not disproportionately burdened by, MPO investments, regardless of race, color, national origin, age, income, ability, or sex. This goal is incorporated into the PRCA through the location prioritization process described in section 2.2 below. The final Destination 2040 goal, Clean Air and Clean Communities, which is concerned with creating an environmentally friendly transportation system, is inherently incorporated into the PRCA because walking and wheeling are low emission modes of transportation.
Performance Measures
Each of the performance measures listed below rates elements of roadway segments and intersections for how they impact pedestrian safety and comfort. Details about how each of these performance measures is rated can be found in Appendix B.
Roadway Segments
Capacity Management and Mobility
- Sidewalk Presence—50 percent
- Sidewalk Presence rates how many sides of a roadway segment include sidewalks that are at least five feet wide. Sidewalks provide a level area that has been separated from other modes and dedicated to pedestrian travel, which improves users’ sense of safety and comfort. Furthermore, a sufficient width of at least five feet allows two wheelchairs to pass each other while traveling along the sidewalk.
- Crosswalk Presence—33 percent
- Crosswalk Presence rates a roadway segment’s number of crosswalks per mile. Crosswalks improve pedestrian network connectivity, with greater numbers of marked crosswalks improving the flexibility of pedestrian travel. In addition, crosswalks indicate to drivers that pedestrians may want to cross at a location, raising their awareness of the possible need to stop.
- Walkway Width—17 percent
- Walkway Width rates how many sides of a roadway segment include sidewalks that are at least five feet wide. An accessible sidewalk should be at least five feet wide to allow two wheelchairs to pass one another while traveling along the corridor.
Economic Vitality
- Pedestrian Volumes—50 percent
- Pedestrian Volumes assigns a score to a location based on the existing amount of pedestrians observed traveling along a roadway segment during a peak travel hour. The greater the number of pedestrians traveling in an area, the more opportunities there are for passersby to contribute to economic activity in a location.
- Adjacent Bicycle Accommodations—50 percent
- Adjacent Bicycle Accommodations rates roadway segments based on how conducive they are to bicycle travel. Roadways with designated bicycle travel lanes serve as a proxy for locations with high levels of bicycle travel while roadways with space for bicycles in the form of sharrows or wide shoulders indicate moderate levels of bicycle travel might be expected at a location. Areas are identified as having low opportunities for passing bicyclists to contribute to economic activity if the roadway does not include space for bicycles. (Note: In the case of locations where peak travel hour bicycle counts are available, Bicycle Volumes should be scored instead of Adjacent Bicycle Accommodations.)
Safety
- Pedestrian Crashes—60 percent
- Pedestrian Crashes rates the safety of a roadway segment based on whether or not it is located in a Highway Safety Improvement Program (HSIP) Pedestrian Crash Cluster and the number of non-HSIP pedestrian crashes documented along the segment. Locations where pedestrian crashes have occurred and where crashes are especially severe are identified as locations in need of safety improvements.
- Pedestrian-Vehicle Buffer—20 percent
- Pedestrian-Vehicle Buffer rates the amount of space between vehicular traffic and pedestrian traffic. The greater the separation between pedestrians and automobiles, the smaller the likelihood of conflict between the two modes and the less stressful the travel experience for pedestrians.
- Vehicle Travel Speed—20 percent
- Vehicle Travel Speeds rates average vehicle travel speed along a roadway segment. The slower the speeds of automobiles, the smaller the level of danger to pedestrians in the case of conflict between the two modes and the less stressful the travel experience for pedestrians.
System Preservation
- Sidewalk Condition—100 percent
- Sidewalk Condition rates how many sides of a roadway segment feature good quality sidewalks. Inconsistent, uneven sidewalk surfaces poorly impact pedestrian experience, especially for those using wheelchairs or other mobility-assistance devices.
Signalized Intersections
Capacity Management and Mobility
- Pedestrian Delay—43 percent
- Pedestrian Delay rates the amount of time a pedestrian must wait at an intersection for a walk signal. Long pedestrian delays encourage pedestrians to cross intersections between walk signal phases if there appears to be a break in vehicular traffic, which can increase danger and confusion for all road users.
- Sidewalk Presence—29 percent
- Sidewalk Presence rates the number of approaches at an intersection that include sidewalks that are at least five feet wide. Sidewalks provide a level area that has been separated from other modes and dedicated to pedestrian travel, which improves users’ sense of safety and comfort. Furthermore, a sufficient width of at least five feet allows two wheelchairs to pass each other while traveling along the sidewalk.
- Curb Ramp Presence—14 percent
- Curb Ramp Presence rates the number of approaches at an intersection that include curb ramps with detectable warnings. Curb ramps improve the quality of pedestrian travel, especially for those using wheelchairs or other mobility-assistance devices. Furthermore, warnings with truncated domes that are detectable by cane or underfoot serve to alert people with vision impairments that they are approaching a street crossing.
- Crosswalk Presence—14 percent
- Crosswalk Presence rates the number of approaches with a crosswalk at an intersection. Crosswalks improve pedestrian network connectivity, with greater numbers of marked crosswalks improving the flexibility of pedestrian travel. In addition, crosswalks indicate to drivers that pedestrians may want to cross at a location, raising their awareness of the possible need to stop.
Economic Vitality
- Pedestrian Volumes—100 percent
- Pedestrian Volumes assigns a score to a location based on the existing amount of pedestrians observed traveling through an intersection during a peak travel hour. The greater the number of pedestrians traveling through an intersection, the more opportunities there are for passersby to contribute to economic activity in the area.
Safety
- Sufficient Crossing Time (Index)—38 percent
- Sufficient Crossing Time (Index) rates the amount of time a pedestrian signal provides for pedestrians to cross an intersection. The Federal Highway Administration recommends basing all pedestrian crossing times on walking speeds no faster than 3.5 feet per second to accommodate pedestrians of all abilities.
- Pedestrian Crashes—38 percent
- Pedestrian Crashes rates the safety of an intersection based on whether or not it is located in a HSIP Pedestrian Crash Cluster and the number of non-HSIP pedestrian crashes documented along the segment. Locations where pedestrian crashes have occurred and where crashes are especially severe are identified as locations in need of safety improvements.
- Pedestrian Signal Phase Type—13 percent
- Pedestrian Signal Presence rates the type of pedestrian signal phase at an intersection. Intersections with concurrent pedestrian signals reduce pedestrian delay but No Right Turn on Red signage and/or Leading Pedestrian Intervals, which provide a walk signal for pedestrians before the light turns green for motorists traveling in the same direction, minimize conflict with turning vehicles. Exclusive pedestrian signals allow pedestrians to cross in all directions at once without conflicting vehicular movements but it takes more time to reach this walk signal phase because all vehicle phases must occur earlier in the light cycle.
- Vehicle Travel Speed—13 percent
- Vehicle Travel Speed rates average vehicle travel speed at an intersection. The slower the speeds of automobiles, the smaller the level of danger to pedestrians in the case of conflict between the two modes and the less stressful the travel experience for pedestrians.
System Preservation
- Sidewalk Condition—100 percent
- Sidewalk Condition rates the number of approaches at an intersection that feature good quality sidewalks. Inconsistent, uneven sidewalk surfaces poorly impact pedestrian experience, especially for those using wheelchairs or other mobility-assistance devices.
Non-Signalized Intersections
Capacity Management and Mobility
- Sidewalk Presence—34 percent
- Sidewalk Presence rates the number of approaches at an intersection that include sidewalks that are at least five feet wide. Sidewalks provide a level area that has been separated from other modes and dedicated to pedestrian travel, which improves users’ sense of safety and comfort. Furthermore, a sufficient width of at least five feet allows two wheelchairs to pass each other while traveling along the sidewalk.
- Curb Ramp Presence—33 percent
- Curb Ramp Presence rates the number of approaches at an intersection that include curb ramps with detectable warnings. Curb ramps improve the quality of pedestrian travel, especially for those using wheelchairs or other mobility-assistance devices. Furthermore, warnings with truncated domes that are detectable by cane or underfoot serve to alert people with vision impairments that they are approaching a street crossing.
- Crosswalk Presence—33 percent
- Crosswalk Presence rates the number of approaches with a crosswalk at an intersection. Crosswalks improve pedestrian network connectivity, with greater numbers of marked crosswalks improving the flexibility of pedestrian travel. In addition, crosswalks indicate to drivers that pedestrians may want to cross at a location, raising their awareness of the possible need to stop.
Economic Vitality
- Pedestrian Volumes—100 percent
- Pedestrian Volumes assigns a score to a location based on the existing amount of pedestrians observed traveling through an intersection during a peak travel hour. The greater the number of pedestrians traveling through an intersection, the more opportunities there are for passersby to contribute to economic activity in the area.
Safety
- Lanes of Travel—38 percent
- Lanes of Travel rates the number of lanes a pedestrian must cross at an intersection, especially those lanes in the same direction of travel. Non-signalized crossings with more than one lane of traffic introduce multiple conflicts, especially when two or more lanes are traveling in the same direction.
- Pedestrian Crashes—38 percent
- Pedestrian Crashes rates the safety of an intersection based on whether or not it is located in a HSIP Pedestrian Crash Cluster and the number of non-HSIP pedestrian crashes documented along the segment. Locations where pedestrian crashes have occurred and where crashes are especially severe are identified as locations in need of safety improvements.
- Pedestrian Refuge—13 percent
- Pedestrian Refuge rates whether a crossing provides a median or island where pedestrians may safely wait to cross more than one travel lane. Providing a location where pedestrians can safely wait for a break in traffic allows street crossings to be broken into stages when traversing a roadway at a non-signalized location.
- Vehicle Travel Speed—13 percent
- Vehicle Travel Speed rates average vehicle travel speed at an intersection. The slower the speeds of automobiles, the smaller the level of danger to pedestrians in the case of conflict between the two modes, and the less stressful the travel experience for pedestrians.
System Preservation
- Sidewalk Condition—100 percent
- Sidewalk Condition rates the number of approaches at an intersection that feature good quality sidewalks. Inconsistent, uneven sidewalk surfaces poorly impact pedestrian experience, especially for those using wheelchairs or other mobility-assistance devices.
2.2 Transportation Equity Factors
The final step in grading a PRCA is to calculate the transportation equity priority of the location. The PRCA analyzes five factors, referred to by MPO staff as transportation equity factors, to determine if a specific area is a place where safe pedestrian facilities should be prioritized:
- Transportation analysis zones (TAZs) where the low-income population is greater than or equal to the Boston metropolitan region median of 32.32 percent of the population
- TAZs where the minority population is greater than or equal to the Boston metropolitan region median of 28.19 percent of the population
- TAZs where the share of the population older than 75 years of age is equal to or more than the Boston metropolitan region average of 6.69 percent
- TAZs where the amount of households that do not own a vehicle is more than the Boston metropolitan region average of 16.15 percent
- Locations within one-quarter mile of a school or college
Locations meeting one of the conditions listed above are considered low priority areas for safe and comfortable pedestrian travel. Locations with two or three of the transportation equity factors present are identified as moderate priority areas. Finally, portions of the MPO region with four or five of the conditions receive high priority designation.
2.3 Central Transportation Planning Staff (CTPS) Applications of the PRCA
The PRCA has been included in several CTPS studies since its publication in 2017. The PRCA helps to illustrate both existing and proposed conditions for pedestrians at locations for which MPO staff recommend improvements. Quantifying pedestrian safety and comfort in this way communicates the need for better pedestrian accommodations at existing locations and gives insight into how proposed modifications could affect pedestrian experience. The following CTPS products have applied the PRCA in their work:
- FFY 2017 Addressing Safety, Mobility, and Access on Subregional Priority Roadways: Selection of Study Locations (March 2017)
- FFY 2018 Addressing Safety, Mobility, and Access on Subregional Priority Roadways: Selection of Study Location (January 2018)
- Route 138 Priority Corridor Study—Canton, MA (February 2018)
- FFY 2019 Priority Corridor Study Location Selection (September 2018)
- Selection of FFY 2019 LRTP Priority Corridor Study Location (October 2018)
- Selection of FFY 2019 Subregional Priority Roadway Study Location (October 2018)
- Safety Operations: Redesign of Hartford Avenue and Maple Street Intersection (December 2018)
- Route 138 Priority Corridor Study—Milton, MA (December 2018)
- Route 16 Priority Corridor Study in Chelsea and Everett (FFY 2019, in progress)
- New and Emerging Metrics for Roadway Usage (FFY 2019, in progress)
3 Developing the PRCA Interactive Database
MPO staff compiled existing PRCA data into two separate spreadsheets, one for roadway segments and the other for intersections. The numeric scores and qualitative ratings for each location’s performance measures, along with information about where the PRCA was applied and any CTPS resources that feature the data, are all tied to a specific identifier for each graded location. This identifier is used to match the information to intersection and roadway segment icons displayed on a map of the Boston MPO region. MPO staff geocoded the locations of the graded intersections and roadway segments, each with the specific identifier assigned to the location in its respective spreadsheet.
This information is displayed for the Boston region in the PRCA Interactive Database. Intersections are represented as points and roadway segments are shown as line work for the length of roadway studied. Figure 1 shows how basic identifying information about every graded location—such as whether it is a roadway segment or an intersection, the municipality where it is located, the name of the roadway or the intersecting streets, and a description of where a roadway segment begins and ends—is displayed in a table below the interactive map that includes every graded PRCA location in the Boston region.
Figure 1
PRCA Interactive Database
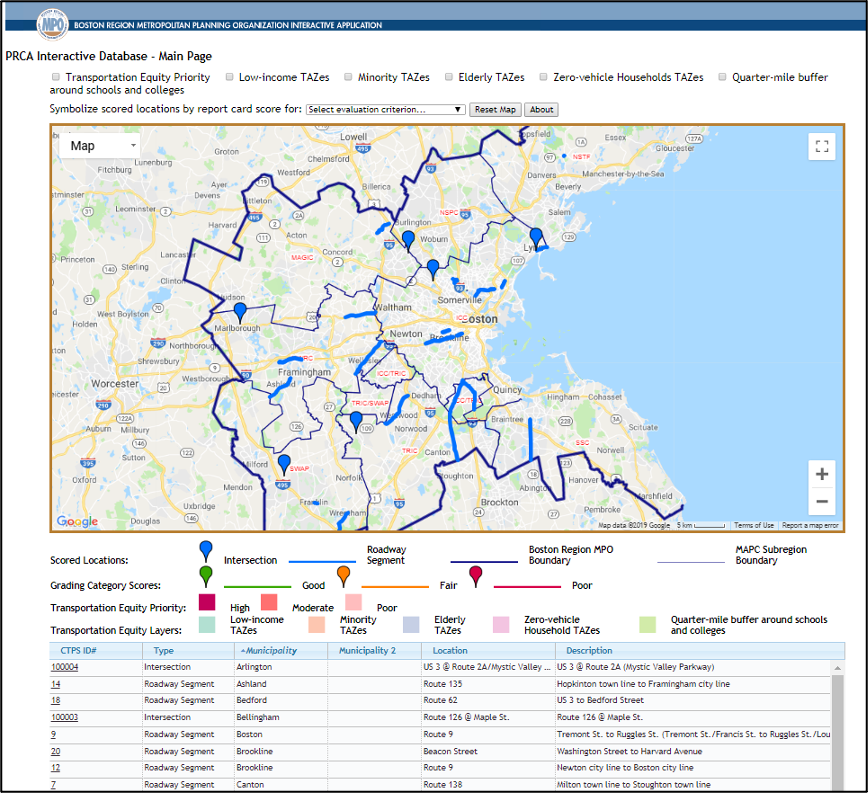
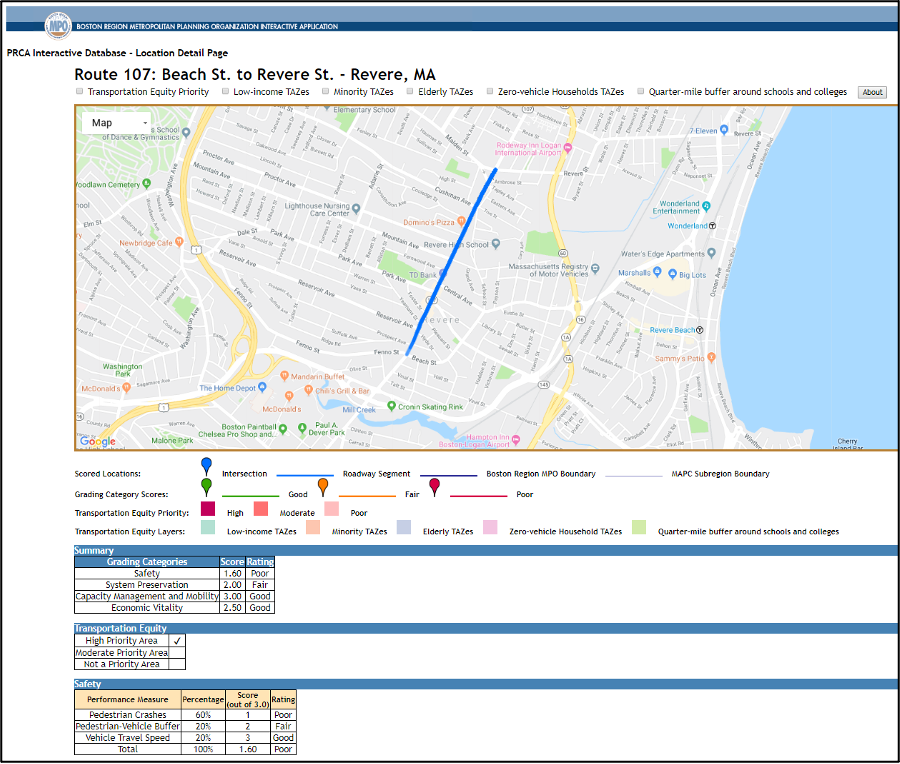
Users can click on the map icons for a specific PRCA or its unique identifier listed in the table to be taken to a page that includes detailed grading information for an intersection or roadway segment. Each page for a specific intersection or roadway segment PRCA features a map of the location above the information presented on the report cards. That information includes overall grades for the four grading categories, the transportation equity priority level (a location’s level of priority within the Boston region for safe and comfortable pedestrian travel), the unique grades assigned to the performance measures for each grading category, and the transportation equity factors present at the location. The top of the page illustrated in Figure 1 for the segment of Route 107 that runs from Beach Street to Revere Street in Revere is illustrated in Figure 2 below.
Figure 2
Route 107 PRCA Interactive Database Roadway Segment Page
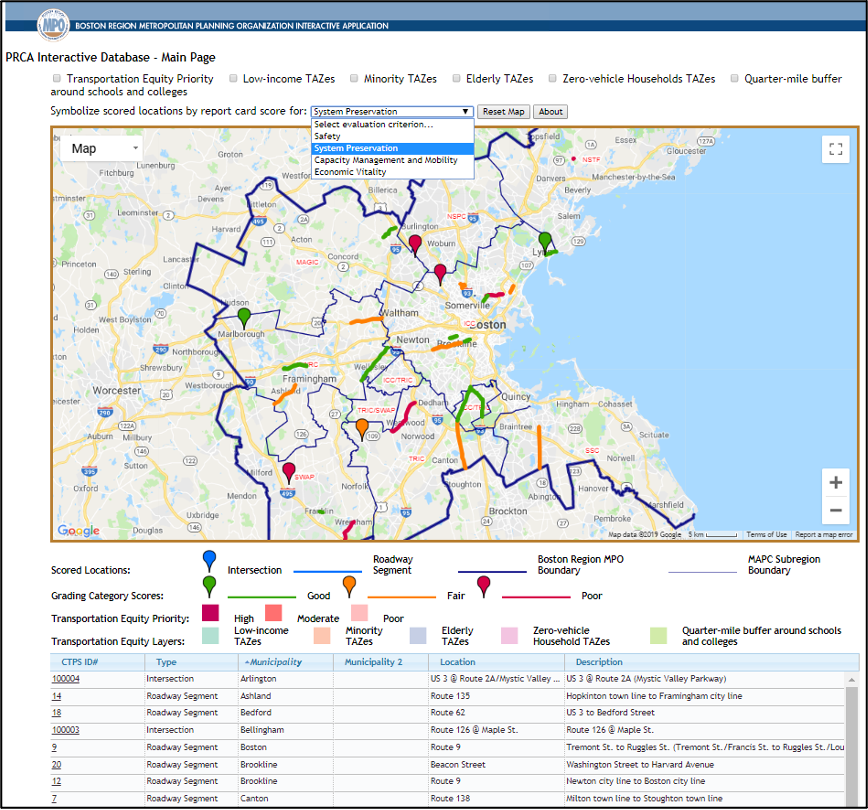
While the default region-wide map simply illustrates PRCA locations, the page includes a drop-down menu from which users can select any of the four grading categories. Selecting a grading category from the drop-down menu changes the colors of the intersection and roadway segment icons to reflect the overall grade assigned to the location for the selected category: green represents a “Good” grade, “Fair” is represented by orange, and deep pink indicates locations that earned “Poor” grades. This quickly allows users to analyze the pedestrian environment for each of the four PRCA grading categories from a region perspective. Figure 3 demonstrates this score symbolization using the System Preservation grading category.
Figure 3
PRCA Interactive Database Grading Category Score Symbolization
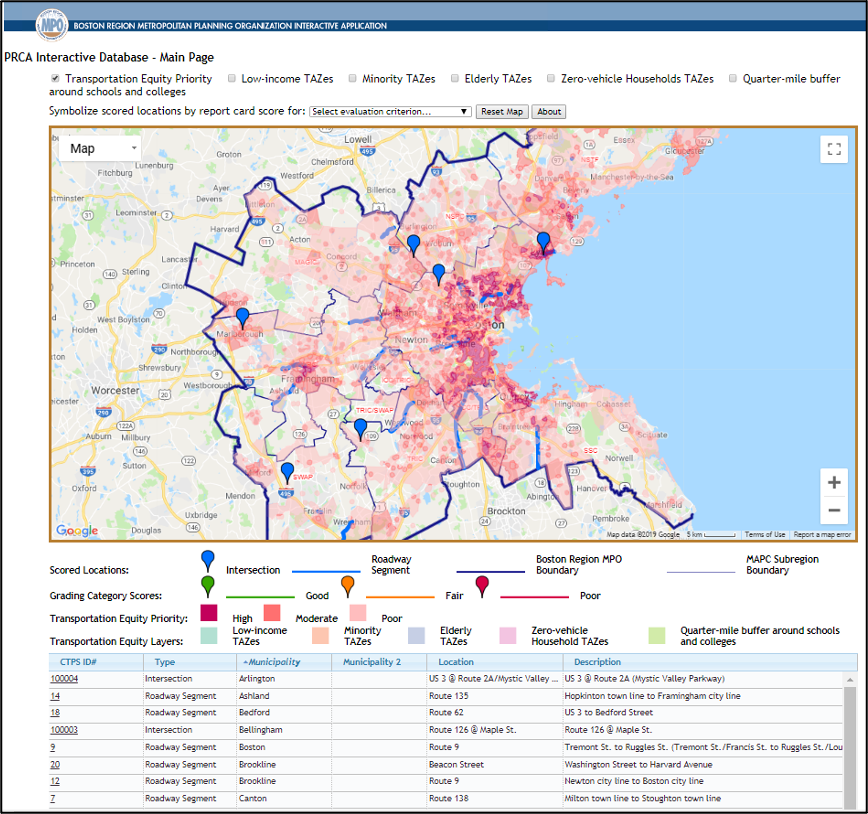
On all of the maps—both region wide and PRCA specific—users can toggle layers on and off illustrating where transportation equity factors are present to see the distribution of conditions throughout the metro region and near graded intersections and roadway segments. In Figure 4 below, the region-wide PRCA map has the Transportation Equity Priority layer toggled on, which reflects the level of priority for safe and comfortable pedestrian travel throughout the region, based on the number of transportation equity factors (described in Section 2.2) present at any given location. The deeper a location’s shade of pink, the higher the priority level associated with the area.
Figure 4
PRCA Interactive Database Transportation Equity Priority View
4 Findings
4.1 PRCA Grading Modifications
The PRCA Interactive Database includes an About button that opens a new window with text that describes the PRCA and the interactive tool. The text mentions the changes documented in this section, along with a caveat that all PRCA scores prior to the interactive database’s release in the fall of 2019 are graded using the methodology outlined in the January 2017 Pedestrian Level-of-Service memorandum. All subsequent PRCAs incorporate the following changes to the grading methodology.
Scoring Scale Modification
The original PRCA presented to the MPO in January 2017 solely included ratings of 3 for good conditions, 2 for fair conditions, and 1 for poor conditions. As the PRCA has continued to be applied throughout the region, it has become apparent that when the elements scored by performance measures are not present at a location, scores should reflect conditions appropriately. Therefore, the option for a score of 0 has been incorporated into the PRCA to document that a performance measure element is missing at a location.
Signalized Intersections versus Non-signalized Intersections
Three performance measures used in the PRCA for intersections are related to pedestrian signals. This means that non-signalized intersections are automatically assigned lower scores than signalized ones, especially after introducing zero as a score at locations where the performance measure element being graded is not present. Pedestrian Delay, Sufficient Crossing Time (Index), and Pedestrian Signal Presence (changed to Pedestrian Signal Phase Type, addressed below) are all irrelevant at non-signalized intersections; therefore, an additional PRCA was created for such locations.
The differences between the signalized and non-signalized PRCAs are as follows:
- Pedestrian Delay does not factor into scoring for Capacity Management and Mobility at non-signalized intersections. MPO staff changed the percent of the Capacity Management and Mobility score that the remaining three performance measures contribute to reflect conditions at non-signalized intersections: Sidewalk Presence accounts for 34 percent of the score while Curb Ramp Presence and Crosswalk Presence both account for 33 percent.
- MPO staff changed scoring for the Safety grading category at non-signalized intersections by replacing Sufficient Crossing Time (Index) with a new Lanes of Traffic performance measure and Pedestrian Signal Phase Type with a new Pedestrian Refuge performance measure.
Pedestrian Crashes
Instead of simply scoring locations based on whether or not they are located within a HSIP-eligible pedestrian crash cluster, MPO staff modified Pedestrian Crash grading to consider if any pedestrian crashes are present at the location. Locations are deemed “Good” if data from the most recent available five-year period do not indicate a pedestrian crash at the location and if the area is not part of an HSIP-eligible pedestrian crash cluster. The presence of one crash over the most recent available five-year data period will downgrade a location to a score of “Fair,” while two crashes earn a location a “Poor” grade. A “Dangerous” designation and score of zero is given if more than three crashes have occurred at a location over the most recent five-year data period or if it is located within a HSIP-eligible pedestrian crash cluster.
Transportation Equity
The original PRCA has been modified to include five transportation equity factors instead of the initial four because one transportation equity measure that the MPO previously used has changed. Instead of Environmental Justice locations, which were identified as locations with high proportions of minority and low-income populations, the MPO now separately considers each of the two factors.
5 Maintaining the PRCA INteractive Database
Improvements to and continued work on the PRCA Interactive Database will be funded through the Bicycle and Pedestrian Support Activities program.
6 PRCA Application in the Boston Region
6.1 How to Score PRCAs Manuals
MPO staff developed guides to help users understand how to grade roadway segments and intersections with the PRCA. These manuals are included in Appendix B and are available through the PRCA Interactive Database on the MPO’s website. Currently, the page accessed through the About button provides information about the database, including links to the three PRCAs (roadway segment, signalized intersection, and non-signalized intersection) and their associated How to Score PRCAs manual.
6.2 Public Involvement
The public is encouraged to contribute to the PRCA Interactive Database by following the instructions provided in the How to Score PRCAs manuals to grade locations. After scoring and sending their findings to the MPO, staff will process the data, verify the validity of the information, and add the findings to the PRCA Interactive Database. MPO staff will coordinate with existing internal efforts to engage the public in regional transportation planning to raise awareness of the PRCA and its associated interactive database.
7 Scoring Transportation IMprovement program (TIP) LOCATIONS
Through this study, MPO staff applied the PRCA to grade roadway segments and intersections included in the TIP for FFY 2020. The following locations were assessed, along with additional TIP project locations as project funding allowed:
- Pedestrian Hybrid Beacon Installation at Route 9 and Maynard Road (TIP Project 608006)
- Reconstruction on Route 1A (Main Street), from the Norwood town line to Route 27 (TIP Project 602261)
- Reconstruction on Route 126 (Pond Street), from the Framingham town line to the Holliston town line (TIP Project 604123)
- Signal and Intersection Improvements on Route 135 (TIP Project 606043)
- Reconstruction of Ferry Street, South Ferry Street, and a Portion of Elm Street (TIP Project 607652)
- Exchange Street Downtown Improvement Project (TIP Project 608275)
- Resurfacing and Related Work on Route 28 (TIP Project 608482)
8 Conclusions
The PRCA Interactive Database serves as a resource for planners, transportation professionals, and members of the public to understand the factors contributing to or preventing pedestrian travel at specific locations in the Boston region. The grades assigned to each pedestrian network route segment and intersection for the four PRCA categories are determined by performance measures that reflect conditions at each location. Providing the data for each performance measure through the PRCA dashboard allows stakeholders to identify which elements of a location are in need of improvement to encourage increased pedestrian travel. In the future, this increased awareness and monitoring of conditions in the Boston metropolitan area may facilitate the identification of locations in need of funding for construction projects that would improve the pedestrian environment, ultimately leading to more holistic enhancement of the regional network.