
Identifying Opportunities to Alleviate Bus Delay
Project Manager
Jonathan Belcher
Project Principal
Annette Demchur
Data Analyst
Nicholas Hart
Graphics
Nicholas Hart
Cover Design
Kim DeLauri
The preparation of this document was supported
by the Federal Transit Administration through
MPO §5303 Contracts #84080 and #91027.
Central Transportation Planning Staff
Directed by the Boston Region Metropolitan
Planning Organization. The MPO is composed of
state and regional agencies and authorities, and
local governments.
To request additional copies of this document or copies in an accessible format, contact:
Central Transportation Planning Staff
State Transportation Building
Ten Park Plaza, Suite 2150
Boston, Massachusetts 02116
(857) 702-3700
(617) 570-9192 (fax)
TTY - (617) 570-9193
ctps@ctps.org
ctps.org
Abstract
Reliable bus transportation offers mobility, access, and livability benefits to residents throughout the region. However, delays in bus service diminish these benefits. This study seeks to identify opportunities to alleviate existing delays in bus service. To this end, MPO staff 1) examined factors that lead to increased dwell time at bus stops. This included estimating the amount of time contributed by passengers’ use of each fare payment type, as well as the time added by boardings of baby carriages, wheeled mobility devices, and portable shopping carts—along with any delay caused by the on-board presence of such items. In addition, staff 2) assessed delay caused by operational and scheduling practices—such as, the scheduling of interlines, scheduling of deadhead movements, on-time performance of garage pull-outs, scheduling of supplemental bus trips, scheduling of bus operator swing-ons, and non-utilization of early pull-up opportunity at trip origins.
Table of Contents
Chapter 2—Investigating Factors that Lead to Increased Dwell Time
2.1........ Data Collection—MBTA Routes 116 and 117
2.2........ Estimating a Dwell Time Regression Model
Chapter 3—Assessing Operational and Scheduling Improvements to Alleviate
Bus Delay
3.2........ Deadhead Movements
3.4........ Supplemental MBTA Bus Trips
3.5........ Bus Operator Swing-Ons
3.6........ Early Pull-Up Opportunity
TABLES
Table 1 Summary of Bus Routes 116 and 117 Boarding Observations
Table 2 Summary of Bus Routes 116 and 117 Load-at-Stop Observations
Table 3 Variables Tested for the Estimation of a Dwell Time Regression Model
Table 4 Coefficients of the Dwell Time Regression Model
Table 5 Estimation of Total Dwell Time and Run Time Contribution
Table 6 Run-Time Variability by Route—Charlestown District, Fall 2015
Table 7 Run-Time Variability by Trip End Point—Charlestown District, Fall 2015
Table 8 Run-Time Variability by Trip End Time—Charlestown District, Fall 2015
Table 11 Deadhead Movements with Median Run Times Greater than Scheduled
Run Times, Spring 2016
Table 12 Summary of Departure Lateness from Garage, Spring 2016
Table 14 Summary of Early Pull-Up Opportunity by Route
Table 15 Summary of Early Pull-Up Opportunity—All Observations
FIGURES
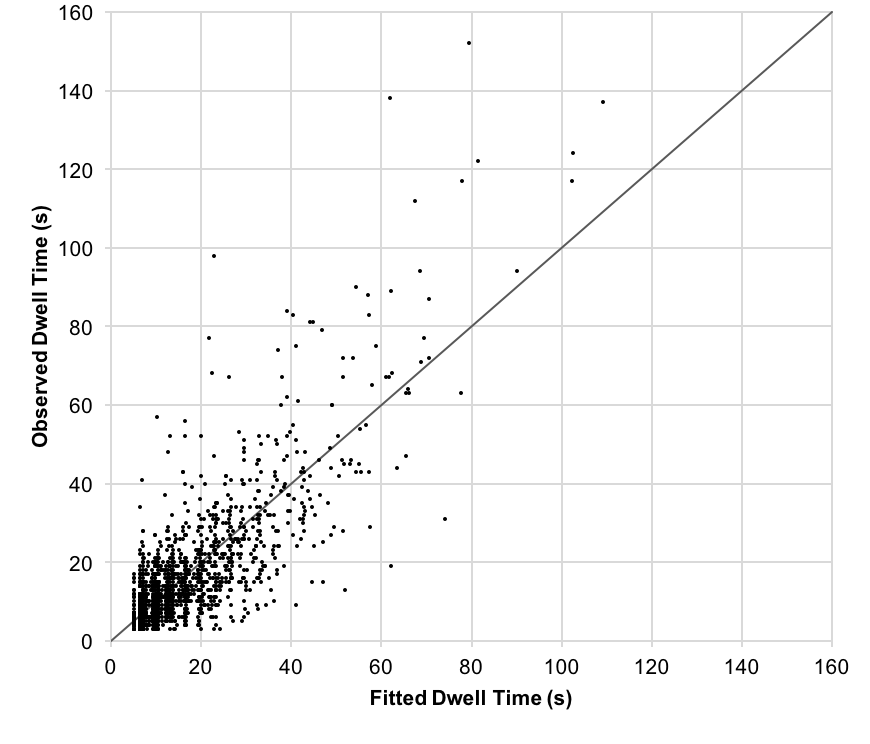
Figure 1 Observed and Fitted Dwell Time
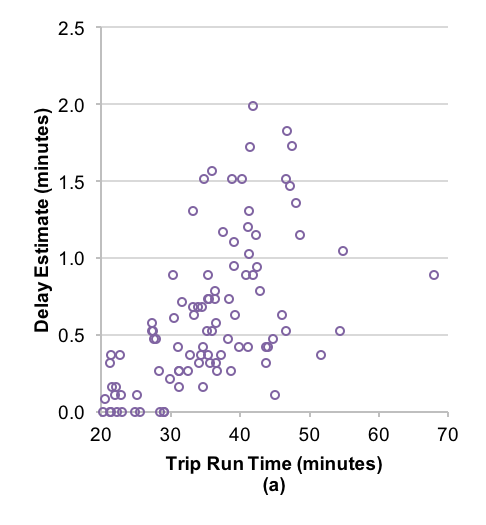
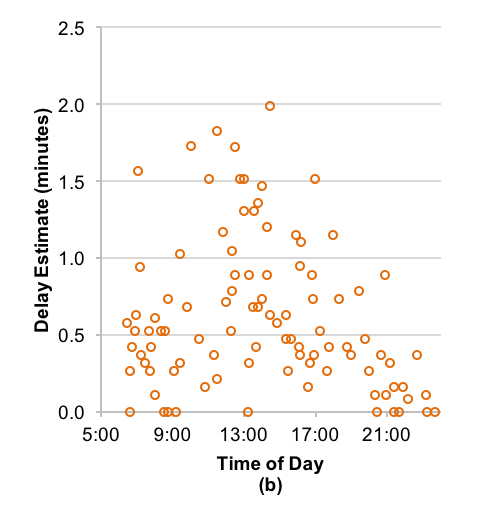
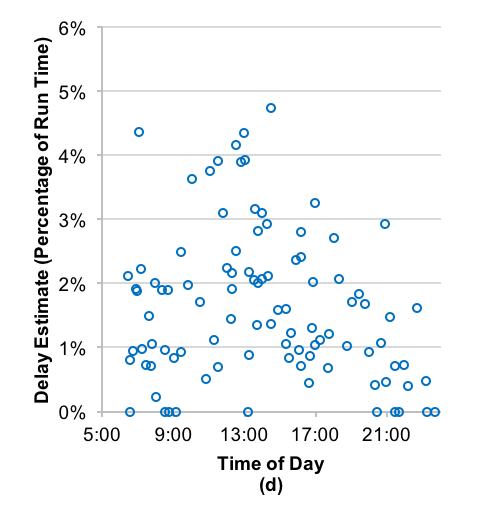
Figure 2 Estimated Delay from Pay Cash and Add Value Transactions by Trip
Figure 3 Estimated Delay from Baby Carriage Boardings and Alightings by Trip
Figure 5 Departure Lateness from Garage—Systemwide Observations,
Spring 2016
Figure 6 Procedure for Assessing Swing-On Delay
Figure 7 Procedure for Assessing Early Pull-Up Opportunity
Reliable bus transportation offers mobility, access, and livability benefits to residents throughout the region. However, delays in bus service diminish these benefits. Upgrades to infrastructure, such as more efficient fare-collection equipment, as well as operational improvements, such as increasing the effectiveness of scheduling practices, could decrease bus delay, which in turn would improve on-time performance, reduce travel times for transit passengers, and make transit a more attractive travel mode. Using a variety of data sources, the Central Transportation Planning Staff (CTPS) to the Boston Region Metropolitan Planning Organization (MPO) analyzed these factors, and developed solutions to address the specific causes of delay.
Chapter 2 of this report investigates factors that lead to increased dwell time at bus stops by estimating the amount of time contributed by using each fare payment type, and by the boardings and on-board presence of baby carriages, wheeled mobility devices, and portable shopping carts, using observations from a sample of Route 116 and 117 trips. The results from the regression analysis estimate that the baseline boarding time (for a passenger paying with a CharlieCard or CharlieTicket) is about 3.3 seconds. An additional 9.4 seconds is added (12.7 seconds of total boarding time) if the passenger pays with cash, and an additional 6.3 seconds is added (9.6 seconds of total boarding time) if the passenger adds value to their CharlieCard. These results suggest that overall dwell time for the observed trips would be reduced by an estimated 11.3 percent if cash transactions were not permitted and by an approximate 2.6 percent if baby carriages had not boarded. Dwell time accounted for 14.4 percent of total run time. Therefore, staff estimate that total run time for the observed trips would be reduced by only 1.6 percent if cash transactions were not permitted and by 0.4 percent if baby carriages had not boarded.
Chapter 3 of this report assesses delay caused by a series of operational and scheduling practices; the scheduling of interlines, scheduling of deadhead movements, on-time performance of garage pull-outs, scheduling of supplemental trips, scheduling of bus operator swing-ons, and non-utilization of early pull-up opportunity at trip origins.
In analyzing interlines and deadhead movements, CTPS found that 193 of the 364 scheduled weekday interlines from the Charlestown bus district might be considered for de-interlining based on their run time variability observed in fall 2015. In addition, 41 of the 437 scheduled weekday deadhead movements systemwide had median run times greater than their scheduled run times in spring 2016.
In analyzing on-time performance of garage pull-outs, CTPS found that in spring 2016, 31 percent of pull-out trips departed more than three minutes late from the garage; and of these trips, 70 percent of them arrived at the start point of their first vehicle-revenue trip after the scheduled departure time, with an average arrival lateness of 3.9 minutes per trip.
For the analysis of supplemental trips, CTPS provided summaries of origin departure lateness, end-point arrival lateness, and run times, and identified how each trip might be scheduled more effectively. It is important that these trips run as scheduled, as many of them start a string of trips that provide service throughout the PM peak period.
In analyzing bus operator swing-ons, CTPS estimated that swing-ons added an extra 59 seconds to each trip where a swing-on occurred. Staff also found that 24 percent of scheduled swing-ons occurred on trips where the bus arrived at the swing-on location already behind schedule.
In analyzing early pull-up opportunity at trip origins, CTPS found that earlier pull-ups at origins would not contribute to a significant reduction in departure lateness on the routes that staff studied. Of the 25,169 minutes of observed departure lateness, staff estimated that only 1,441 minutes (5.7 percent) would have been saved if buses, that had the opportunity to do so, had pulled up earlier.
Chapter 2—Investigating Factors that Lead to Increased Dwell Time
MPO field staff (CTPS) conducted manual observations of baby carriage boardings, wheeled mobility device boardings, and portable shopping cart boardings on sample trips of MBTA bus Routes 116 and 117 from January 12, 2016 to January 21, 2016. These observations were paired with dwell times, boarding and alighting counts from on-board Automatic Passenger Counters (APCs), and counts by fare transaction type from the MBTA Automatic Fare Collection (AFC) database. A total of 97 trips of usable data was collected from 23 Route 116 inbound trips, 24 Route 116 outbound trips, 23 Route 117 inbound trips, and 27 Route 117 outbound trips. Appendix A provides a summary of boarding observations for each trip; Table 1 displays a summary of all boarding observations; and Table 2 displays a summary of all load-at-stop observations.
Boarding Type |
Total Observations |
Percentage of AFC Transactions |
CharlieCard |
2,253 |
72.6% |
CharlieTicket |
673 |
21.7% |
Add-Value |
265 |
8.5% |
Pay Cash |
178 |
5.7% |
Baby Carriage |
42 |
1.4% |
Shopping Cart |
7 |
0.2% |
Wheeled Mobility Device |
3 |
0.1% |
AFC = Automatic fare collection.
Note: Counts do not include activity at first and last stop of a trip. Add-value transactions are also counted as CharlieCard transactions.
Load Type |
Total Observations |
Percentage of Stops |
One Baby Carriage on-board |
344 |
11.5% |
Two Baby Carriages on-board |
89 |
3.0% |
Three Baby Carriages on-board |
10 |
0.3% |
One Shopping Cart on-board |
95 |
3.2% |
One Wheeled Mobility Device on-board |
32 |
1.1% |
Note: Counts do not include activity at first and last stop of a trip.
Using the APC data, AFC data, and data collected from manual observations on sample trips of MBTA Routes 116 and 117, CTPS conducted a regression analysis to estimate the amount of dwell time contributed by a set of variables. Table 3 displays a list of variables that were tested.
| Variable |
Definition |
Range of Observed Values |
|---|---|---|
APC Dwell |
Dwell time in seconds, calculated from APC data as the amount of time between the doors opening and doors closing |
3 to 152 |
AFC Ons |
Number of boardings, calculated as the number of AFC transactions |
0 to 18 |
AFC Ticket |
Number of CharlieTicket transactions |
0 to 5 |
AFC Cash |
Number of cash only transactions |
0 to 5 |
AFC Add-Value |
Number of add value to CharlieCard transactions |
0 to 4 |
AFC Noninteraction |
Number of APC boardings minus the number of AFC transactions, only when more APC boardings than AFC transactions are recorded |
0 to 7 |
Load Over 30 |
Number of additional passengers greater than 30 on-board the bus |
0 to 36 |
APC Offs Front |
Number of front door alightings |
0 to 20 |
Extra Rear |
Extra rear door activity calculated as the number of rear door offs minus the total number of AFC transactions, AFC noninteraction, and front door offs |
0 to 10 |
Carriage Ons |
Number of baby carriage boardings |
0 to 2 |
Carriage Offs |
Number of baby carriage alightings |
0 to 2 |
Cart Ons |
Number of portable shopping cart boardings |
0 to 1 |
Cart Offs |
Number of portable shopping cart alightings |
0 to 1 |
Carriage On-board |
Number of baby carriages on-board the bus when it leaves the stop |
0 to 3 |
Cart On-board |
Number of personal shopping carts on-board the bus when it leaves the stop |
0 to 1 |
WMD On-board |
Number of wheeled mobility devices on-board the bus when it leaves the stop |
0 to 1 |
AFC = Automatic fare collection. APC = Automatic passenger counters. WMD = Wheeled mobility devices.
CTPS estimated an ordinary least squares linear regression model1 . The first and last stop of each trip and stops that included a wheeled mobility device boarding or alighting were removed from the regression analysis, as bus doors are often left open for a longer period of time than is required to board and alight passengers at the first and last stop, and the procedure to board or alight a wheeled mobility device may alter the typical manner in which additional customers at the stop board and alight. The functional form of the model is shown below, and its coefficients are shown in Table 4.
![]()
1 Ordinary least squares is a method for estimating the unknown parameters in a linear regression model.
Variable |
Estimate |
Standard Error |
p-value |
Intercept |
3.70 |
0.35 |
< 2.0E-16 |
AFC Ons |
3.32 |
0.14 |
< 2.0E-16 |
AFC Cash |
9.38 |
0.64 |
< 2.0E-16 |
AFC Add-Value |
6.29 |
0.59 |
< 2.0E-16 |
AFC Noninteraction |
3.23 |
0.31 |
< 2.0E-16 |
Load Over 30 |
0.30 |
0.06 |
1.7E-07 |
APC Offs Front |
2.82 |
0.17 |
< 2.0E-16 |
Extra Rear |
1.34 |
0.25 |
1.2E-07 |
Carriage Ons |
9.63 |
1.45 |
4.1E-11 |
Carriage Offs |
7.18 |
1.32 |
6.1E-08 |
AFC = Automatic fare collection. APC = Automatic passenger counters.
Note: Multiple R-squared = 0.641, degrees of freedom = 1,785.
The results from the regression analysis estimate that the baseline boarding time (for a passenger paying with a CharlieCard or CharlieTicket) is about 3.3 seconds. An additional 9.4 seconds is added (12.7 seconds of total boarding time) if the passenger pays with cash, and an additional 6.3 seconds is added (9.6 seconds of total boarding time) if the passenger adds value to their CharlieCard. When the variable representing the number of CharlieTicket transactions was included in the model, it was well outside of a five percent confidence level, suggesting that CharlieCard and CharlieTicket transactions take a similar amount of time to complete. Furthermore, the model estimates that dwell times increase as passenger loads increase, once loads are greater than 30 passengers2 , at a rate of about 0.3 seconds per additional passenger, and that baby carriages contribute 9.6 seconds when boarding and 7.2 seconds when alighting.
2 CTPS chose a load of 30 passengers to represent the point at which standees might typically start to form on-board a bus, thus impeding boarding and alighting passengers. However, a regression tree analysis, and the testing of multiple load variables at different break points did not find any one break point to be conclusively significant over another. CTPS hypothesize that this may be a result of low sampling at certain ranges of passenger load.
Figure 1 displays the relationship between observed dwell time and fitted dwell time. From Figure 1 it appears that the model tends to underestimate when observed dwell times are long. This is because observations with long dwell times are more likely to include additional delay factors that were not specified in the model.
The coefficients estimated by the dwell time regression model were applied to the dataset to estimate the total contribution to dwell time and run time3 for each variable, shown in Table 54 . The results estimate that overall dwell time for the observed trips would be reduced by 11.4 percent if cash transactions (pay cash and add-value) were not permitted and by 1.5 percent if baby carriages had not boarded. Dwell time accounted for 15.6 percent of total run time. Therefore, it is estimated that total run time for the observed trips would be reduced by 1.8 percent if cash transactions were not permitted and by 0.2 percent if baby carriages had not boarded.
|
Total Dwell Contribution (seconds) |
Percentage of Total Dwell Time |
Percentage of Total Run Time |
Intercept |
6,763 |
21.3% |
3.3% |
AFC Ons |
12,685 |
40.0% |
6.2% |
AFC Cash |
1,762 |
5.6% |
0.9% |
AFC Add-Value |
1,834 |
5.8% |
0.9% |
AFC Noninteraction |
1,798 |
5.7% |
0.9% |
Load Over 30 |
842 |
2.7% |
0.4% |
APC Offs Front |
4,483 |
14.1% |
2.2% |
Extra Rear |
709 |
2.2% |
0.3% |
Carriage Ons |
477 |
1.5% |
0.2% |
Carriage Offs |
352 |
1.1% |
0.2% |
AFC = Automatic fare collection. APC = Automatic passenger counters.
Note: Three boardings and three alightings of wheeled mobility devices were observed. The combined dwell time for these observations was 502 seconds, accounting for 1.6 percent of total observed dwell time (0.2 percent of total run time).
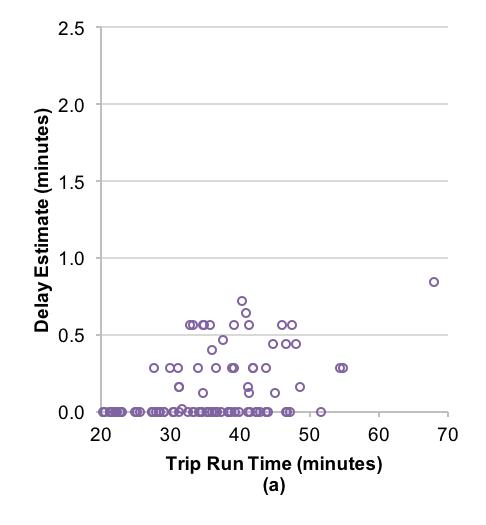
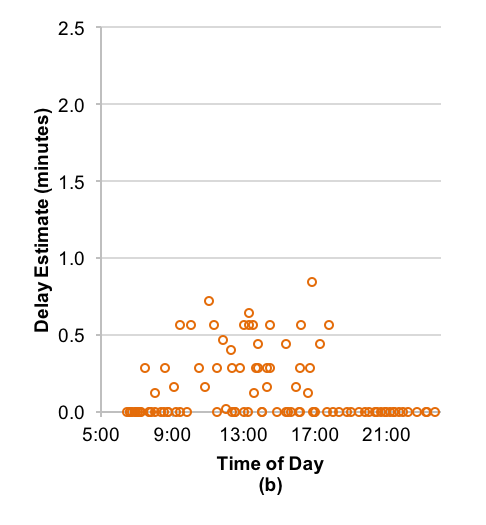
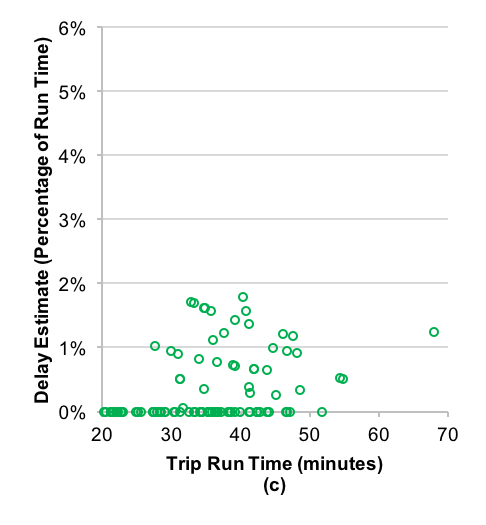
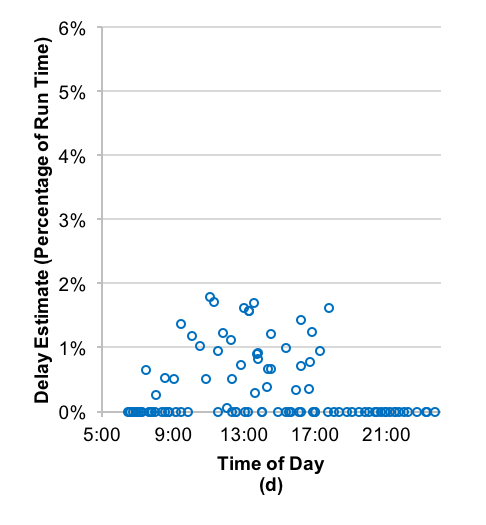
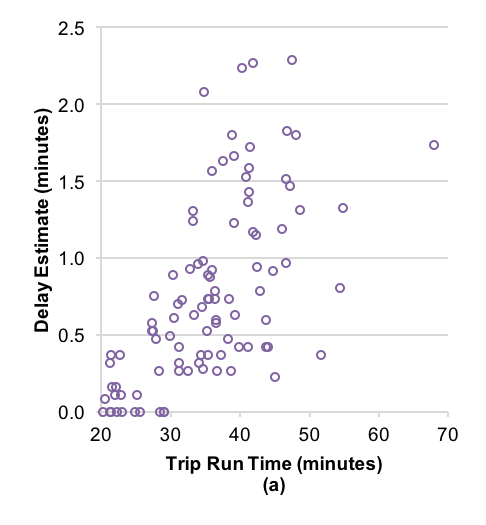
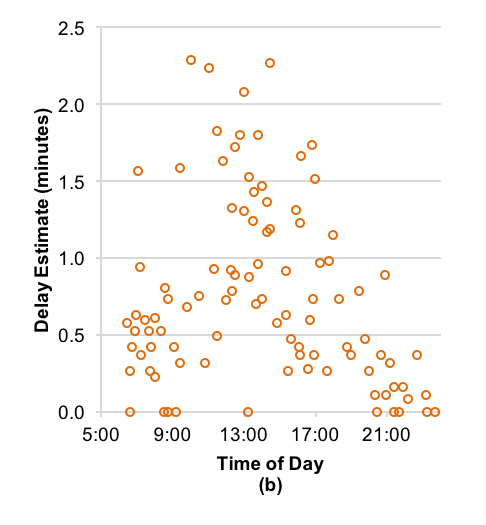
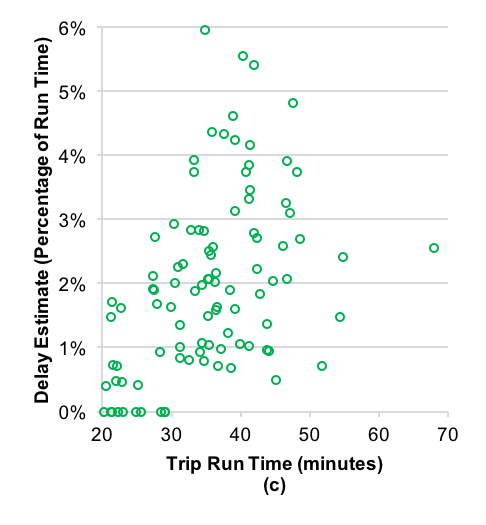
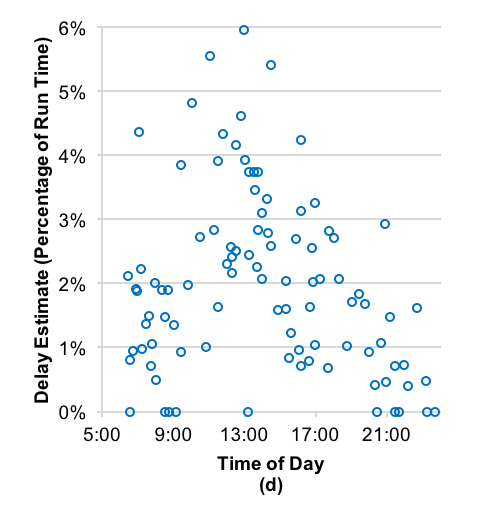
The relatively small impact of cash transactions on total run time suggests that fare system upgrades that eliminate on-board cash transactions may improve reliability for specific trips or during certain time periods that experience relatively high cash usage. However, these upgrades likely would not reduce run times on the observed trips to a degree that allows service to be scheduled more frequently with the same amount of resources (unless significant time savings are achieved through all-door boarding). Figure 2 shows that the estimated amount of time added by pay cash and add value transactions was less than two minutes for all observed trips, with the largest estimated amount of time added for a single trip being 2.0 minutes (4.7 percent of that trip’s total run time). Figure 2 also shows that trips with relatively larger estimated amounts of time added because of pay cash and add value transactions tended to occur during the midday period of service, with less of an effect during the AM peak and PM peak periods of service.
Figure 3 shows that the estimated amount of time added by baby carriage boardings and alightings was less than one minute for all observed trips, with the largest estimated amount of time added for a single trip being 0.8 minutes (1.2 percent of that trip’s total run time). Figure 3 also shows that, as with trips that have relatively larger estimated amounts of time added because of pay cash and add value transactions, trips with relatively larger amounts of time added because of baby carriage boardings and alightings tended to occur during the midday period of service, with less of an effect during the AM peak and PM peak periods of service. Figure 4 shows that the estimated amount of time added by pay cash and add value transactions and baby carriage boardings and alightings combined was less than 2.5 minutes for all observed trips, with the largest estimated amount of time added for a single trip being 2.3 minutes (5.4 percent of that trip’s total run time).
The variables representing shopping cart boardings and alightings, baby carriages on-board, shopping carts on-board, and wheeled mobility devices on-board were not significant at a five percent confidence level when included in the model; however, this does not necessarily mean that these variables are not significant contributors to dwell time in the real world. It is possible that the dataset did not contain enough observations of these variables to estimate their effects5. Because the on-board presence of baby carriages, shopping carts, and wheeled mobility devices were not significant contributors to the model, no conclusions on their effect on dwell time can be drawn, and it remains unclear whether a seating arrangement designed to provide more room for these devices might produce an overall decrease in dwell time.
The results of this analysis are contingent on the observations of only two bus routes, and a short observation period of seven weekdays6. Therefore, these results are not meant to reflect the MBTA system as a whole, as the effect and rate at which the variables in the model occur likely would vary geographically and temporally.
3 Total run time for the trips that were observed may have been increased by buses waiting for the Andrew McArdle Bridge to reopen when allowing commercial maritime vessels to pass.
4 Activity at the first stop of each trip was included if it occurred after the trip’s scheduled departure time, and excluded if the trip left before or at its scheduled departure time.
5 An analysis of variance was performed between the chosen model and a set of nested models containing each of the variables that were excluded. A nested model containing both the Cart Ons and Cart Offs variables was shown to have a significant reduction in the residual sum of squares at a five percent confidence level, and a nested model containing the Carriage On-board variable was shown to have a significant reduction in the residual sum of squares at a ten percent confidence level.
6 Observations from 97 bus trips were used for this analysis. The MBTA runs approximately 4 million bus trips annually.

Chapter 3—Assessing Operational and Scheduling Improvements to Alleviate Bus Delay
CTPS assessed areas where improvements to operational and scheduling practices can be made to alleviate bus delay, including (3.1) interlines, (3.2) deadhead movements, (3.3) garage pull-outs, (3.4) supplemental trips, (3.5) bus operator swing-ons, and (3.6) early pull-up opportunity.
An interline is when a vehicle is scheduled to complete a trip on one route and conduct its next trip on another route, either between two routes that share a common start/end point or through a deadhead movement. The benefit of interlining is that it allows resources to be utilized more efficiently, with less vehicle movements to and from the garage. A negative effect of interlining is the possibility that a route/corridor with normally reliable service can take on the delay from a route/corridor with poor on-time performance. From a customer-experience perspective, it is generally preferred that customers on one route/corridor are not negatively impacted by recurring delay from another route/corridor, and that routes with poor reliability are self-contained.
The MBTA uses the Horaires et Assignments pour Systems de Transport Urban et Semi-Urban (HASTUS) scheduling software to automatically block (form the string of trips that is assigned to an individual bus) and assign runs (the string of trips that is assigned to an individual operator) to build bus schedules for each bus district. The automatic blocking capabilities of HASTUS provide an opportunity to automatically schedule interlines into each garage’s schedule. CTPS was tasked with assessing run-time variability of trips to provide a list of suggested trips that should not be coded for interlining (assuming that proper run times, recovery times, and other factors are programmed into HASTUS for each trip). CTPS assessed the run-time variability of trips from the Charlestown bus district using fall 2015 Automatic Vehicle Location (AVL) data provided by the MBTA.
Staff utilized two thresholds to assess run-time variability; the 80 percentile run time compared to 120 percent of the scheduled run time if a trip is to be interlined at its end point, and the 90 percentile run time compared to 120 percent of the scheduled run time if a trip is to be interlined with a deadhead movement, to account for additional variability in the deadhead run time. Trips that do not pass these thresholds are not meant to form a definitive list of trips that should not be interlined, as there are scheduling techniques that may reduce the impact of run-time variability, such as increasing the scheduled recovery time. At most, the summary of trips based on these thresholds should be used to identify trips, routes, locations, and times of day where extra attention might be warranted.
Table 6 provides a summary of run-time variability by route; Table 7 provides a summary of run-time variability by trip end point; and Table 8 provides a summary of run-time variability by trip end time for trips from the Charlestown bus district.
| Route |
Dir. |
Scheduled Weekday Trips |
Number of Trips with 80 Percentile Run Time Greater than 120 Percent of Scheduled Run Time |
Number of Trips with 90 Percentile Run Time Greater than 120 Percent of Scheduled Run Time |
Percentage of Trips with 80 Percentile Run Time Greater than 120 Percent of Scheduled Run Time |
Percentage of Trips with 90 Percentile Run Time Greater than 120 Percent of Scheduled Run Time |
|---|---|---|---|---|---|---|
89 |
In |
33 |
18 |
25 |
55% |
76% |
89 |
Out |
28 |
14 |
18 |
50% |
64% |
89-2 |
In |
32 |
27 |
29 |
84% |
91% |
89-2 |
Out |
32 |
2 |
3 |
6% |
9% |
89-4 |
Out |
1 |
0 |
0 |
0% |
0% |
90 |
In |
19 |
1 |
3 |
5% |
16% |
90 |
Out |
19 |
2 |
8 |
11% |
42% |
91 |
In |
36 |
24 |
30 |
67% |
83% |
91 |
Out |
35 |
27 |
32 |
77% |
91% |
91-7 |
In |
6 |
3 |
5 |
50% |
83% |
91-7 |
Out |
7 |
4 |
4 |
57% |
57% |
92-1 |
In |
15 |
3 |
8 |
20% |
53% |
92-1 |
Out |
13 |
6 |
9 |
46% |
69% |
92-3 |
In |
22 |
13 |
16 |
59% |
73% |
92-3 |
Out |
24 |
11 |
16 |
46% |
67% |
92-7 |
In |
3 |
0 |
1 |
0% |
33% |
92-7 |
Out |
2 |
0 |
1 |
0% |
50% |
93 |
Out |
2 |
1 |
1 |
50% |
50% |
93-1 |
In |
56 |
28 |
41 |
50% |
73% |
93-1 |
Out |
55 |
24 |
42 |
44% |
76% |
93-2 |
In |
12 |
9 |
12 |
75% |
100% |
93-2 |
Out |
13 |
12 |
13 |
92% |
100% |
93-7 |
In |
8 |
1 |
3 |
13% |
38% |
93-7 |
Out |
8 |
1 |
5 |
13% |
63% |
94-1 |
In |
11 |
2 |
3 |
18% |
27% |
94-1 |
Out |
10 |
8 |
9 |
80% |
90% |
95 |
In |
8 |
0 |
2 |
0% |
25% |
95 |
Out |
9 |
2 |
4 |
22% |
44% |
95-5 |
Out |
1 |
1 |
1 |
100% |
100% |
96 |
In |
14 |
11 |
13 |
79% |
93% |
96 |
Out |
14 |
3 |
5 |
21% |
36% |
99-7 |
In |
6 |
2 |
5 |
33% |
83% |
99-7 |
Out |
7 |
0 |
1 |
0% |
14% |
100-3 |
In |
9 |
1 |
3 |
11% |
33% |
100-3 |
Out |
8 |
1 |
3 |
13% |
38% |
101-1 |
In |
4 |
2 |
2 |
50% |
50% |
101-1 |
Out |
2 |
2 |
2 |
100% |
100% |
101-2 |
Out |
4 |
3 |
3 |
75% |
75% |
101-3 |
In |
39 |
32 |
36 |
82% |
92% |
101-3 |
Out |
32 |
15 |
19 |
47% |
59% |
101-4 |
In |
13 |
7 |
9 |
54% |
69% |
101-4 |
Out |
18 |
9 |
12 |
50% |
67% |
104 |
In |
48 |
25 |
30 |
52% |
63% |
104 |
Out |
45 |
18 |
26 |
40% |
58% |
105-1 |
In |
1 |
0 |
0 |
0% |
0% |
105-1 |
Out |
1 |
0 |
0 |
0% |
0% |
106 |
In |
7 |
0 |
4 |
0% |
57% |
106 |
Out |
24 |
9 |
11 |
38% |
46% |
106-3 |
In |
19 |
11 |
13 |
58% |
68% |
106-4 |
In |
1 |
1 |
1 |
100% |
100% |
106-4 |
Out |
1 |
0 |
0 |
0% |
0% |
106-6 |
Out |
1 |
0 |
0 |
0% |
0% |
106-7 |
In |
11 |
8 |
11 |
73% |
100% |
106-7 |
Out |
10 |
2 |
5 |
20% |
50% |
108-6 |
In |
7 |
3 |
3 |
43% |
43% |
108-6 |
Out |
8 |
2 |
3 |
25% |
38% |
109 |
In |
52 |
19 |
35 |
37% |
67% |
109 |
Out |
48 |
34 |
38 |
71% |
79% |
109-1 |
In |
2 |
1 |
1 |
50% |
50% |
109-1 |
Out |
8 |
0 |
1 |
0% |
13% |
110 |
In |
36 |
19 |
23 |
53% |
64% |
110 |
Out |
35 |
7 |
11 |
20% |
31% |
110-2 |
Out |
2 |
1 |
1 |
50% |
50% |
110-4 |
In |
13 |
9 |
11 |
69% |
85% |
110-4 |
Out |
11 |
9 |
10 |
82% |
91% |
111-2 |
In |
66 |
36 |
46 |
55% |
70% |
111-2 |
Out |
72 |
45 |
52 |
63% |
72% |
111-5 |
In |
88 |
61 |
69 |
69% |
78% |
111-5 |
Out |
78 |
27 |
41 |
35% |
53% |
111-6 |
In |
27 |
22 |
26 |
81% |
96% |
111-8 |
In |
19 |
1 |
5 |
5% |
26% |
111-8 |
Out |
24 |
11 |
14 |
46% |
58% |
112 |
In |
20 |
7 |
10 |
35% |
50% |
112 |
Out |
21 |
5 |
11 |
24% |
52% |
112-3 |
Out |
1 |
0 |
0 |
0% |
0% |
132 |
In |
1 |
0 |
0 |
0% |
0% |
132 |
Out |
1 |
1 |
1 |
100% |
100% |
134-5 |
In |
3 |
1 |
2 |
33% |
67% |
134-5 |
Out |
3 |
0 |
1 |
0% |
33% |
134-6 |
In |
1 |
1 |
1 |
100% |
100% |
134-7 |
In |
5 |
3 |
4 |
60% |
80% |
134-7 |
Out |
7 |
1 |
1 |
14% |
14% |
136-4 |
In |
2 |
1 |
2 |
50% |
100% |
136-4 |
Out |
2 |
0 |
0 |
0% |
0% |
136-5 |
In |
1 |
0 |
0 |
0% |
0% |
136-5 |
Out |
1 |
0 |
0 |
0% |
0% |
137-3 |
In |
2 |
0 |
0 |
0% |
0% |
137-3 |
Out |
2 |
0 |
1 |
0% |
50% |
194 |
In |
1 |
0 |
0 |
0% |
0% |
325 |
In |
7 |
2 |
3 |
29% |
43% |
325 |
Out |
7 |
7 |
7 |
100% |
100% |
325-1 |
In |
9 |
7 |
7 |
78% |
78% |
325-1 |
Out |
6 |
0 |
1 |
0% |
17% |
325-2 |
Out |
3 |
3 |
3 |
100% |
100% |
326 |
In |
6 |
0 |
0 |
0% |
0% |
326 |
Out |
11 |
11 |
11 |
100% |
100% |
326-1 |
In |
12 |
12 |
12 |
100% |
100% |
326-1 |
Out |
5 |
2 |
4 |
40% |
80% |
326-2 |
Out |
1 |
0 |
1 |
0% |
100% |
352 |
In |
9 |
5 |
5 |
56% |
56% |
352 |
Out |
8 |
7 |
8 |
88% |
100% |
354-4 |
Out |
1 |
0 |
0 |
0% |
0% |
411-1 |
In |
1 |
1 |
1 |
100% |
100% |
411-1 |
Out |
1 |
1 |
1 |
100% |
100% |
411-8 |
In |
1 |
0 |
0 |
0% |
0% |
411-8 |
Out |
1 |
0 |
0 |
0% |
0% |
430-1 |
In |
1 |
1 |
1 |
100% |
100% |
430-1 |
Out |
1 |
1 |
1 |
100% |
100% |
430-2 |
In |
2 |
2 |
2 |
100% |
100% |
430-2 |
Out |
2 |
1 |
2 |
50% |
100% |
608 |
In |
60 |
1 |
1 |
2% |
2% |
Total |
1,684 |
797 |
1,053 |
47% |
63% |
| Trip End Point |
Scheduled Weekday Trips |
Number of Trips with 80 Percentile Run Time Greater than 120 Percent |
Number of Trips with 90 Percentile Run Time Greater than 120 Percent |
Percentage of Trips with 80 Percentile Run Time Greater than 120 Percent |
Percentage of Trips with 90 Percentile Run Time Greater than 120 Percent |
|---|---|---|---|---|---|
sull |
378 |
211 |
283 |
56% |
75% |
hayms |
246 |
142 |
172 |
58% |
70% |
welst |
158 |
64 |
94 |
41% |
59% |
malst |
108 |
48 |
64 |
44% |
59% |
milk |
105 |
53 |
77 |
50% |
73% |
woodc |
80 |
28 |
42 |
35% |
53% |
wacry |
72 |
45 |
52 |
63% |
72% |
davis |
62 |
6 |
14 |
10% |
23% |
haymg |
60 |
1 |
1 |
2% |
2% |
lindn |
56 |
36 |
41 |
64% |
73% |
cntsq |
42 |
27 |
35 |
64% |
83% |
wondw |
35 |
7 |
11 |
20% |
31% |
bwypk |
35 |
20 |
24 |
57% |
69% |
medfd |
34 |
14 |
18 |
41% |
53% |
clarh |
29 |
14 |
18 |
48% |
62% |
plast |
25 |
15 |
19 |
60% |
76% |
leban |
25 |
9 |
11 |
36% |
44% |
elm |
21 |
8 |
11 |
38% |
52% |
woodi |
20 |
7 |
10 |
35% |
50% |
bally |
14 |
11 |
13 |
79% |
93% |
amall |
13 |
6 |
9 |
46% |
69% |
fklin |
10 |
2 |
5 |
20% |
50% |
statx |
9 |
5 |
5 |
56% |
56% |
chnut |
9 |
7 |
8 |
78% |
89% |
glndl |
8 |
0 |
1 |
0% |
13% |
uphgh |
7 |
0 |
1 |
0% |
14% |
wnbrk |
5 |
4 |
4 |
80% |
80% |
nwobn |
3 |
0 |
1 |
0% |
33% |
saug |
3 |
2 |
3 |
67% |
100% |
readc |
3 |
0 |
1 |
0% |
33% |
rosec |
3 |
3 |
3 |
100% |
100% |
wakef |
2 |
0 |
0 |
0% |
0% |
rdstn |
1 |
1 |
1 |
100% |
100% |
grana |
1 |
1 |
1 |
100% |
100% |
lwdly |
1 |
0 |
0 |
0% |
0% |
revhs |
1 |
0 |
0 |
0% |
0% |
Total |
1,684 |
797 |
1,053 |
47% |
63% |
| Trip End Time |
Scheduled Weekday Trips |
Number of Trips with 80 Percentile Run Time Greater than 120 Percent of Scheduled |
Number of Trips with 90 Percentile Run Time Greater than 120 Percent of Scheduled |
Percentage of Trips with 80 Percentile Run Time Greater |
Percentage of Trips with 90 Percentile Run Time Greater |
|---|---|---|---|---|---|
4:00-4:59 |
2 |
0 |
0 |
0% |
0% |
5:00-5:59 |
71 |
21 |
35 |
30% |
49% |
6:00-6:59 |
96 |
45 |
56 |
47% |
58% |
7:00-7:59 |
121 |
81 |
95 |
67% |
79% |
8:00-8:59 |
128 |
81 |
96 |
63% |
75% |
9:00-9:59 |
101 |
40 |
61 |
40% |
60% |
10:00-10:59 |
55 |
16 |
28 |
29% |
51% |
11:00-11:59 |
58 |
16 |
30 |
28% |
52% |
12:00-12:59 |
55 |
14 |
25 |
25% |
45% |
13:00-13:59 |
54 |
8 |
15 |
15% |
28% |
14:00-14:59 |
66 |
28 |
41 |
42% |
62% |
15:00-15:59 |
91 |
53 |
73 |
58% |
80% |
16:00-16:59 |
123 |
89 |
100 |
72% |
81% |
17:00-17:59 |
140 |
109 |
118 |
78% |
84% |
18:00-18:59 |
127 |
81 |
96 |
64% |
76% |
19:00-19:59 |
92 |
31 |
53 |
34% |
58% |
20:00-20:59 |
71 |
20 |
34 |
28% |
48% |
21:00-21:59 |
61 |
18 |
33 |
30% |
54% |
22:00-22:59 |
58 |
19 |
27 |
33% |
47% |
23:00-23:59 |
50 |
14 |
21 |
28% |
42% |
24:00-24:59 |
46 |
10 |
11 |
22% |
24% |
25:00-25:59 |
18 |
3 |
5 |
17% |
28% |
Total |
1,684 |
797 |
1,053 |
47% |
63% |
Table 9 provides a list of fall 2015 trips that were scheduled as a lead in to a non-deadhead interline that did not pass the 80 percentile run-time comparison to the 120 percent of the scheduled run-time threshold (147 out of 290 such trips).
| Route |
Dir. |
Start Time |
Number of Obs. |
80 Percentile Run Time (min.) |
120 Percent of Scheduled Run Time (min.) |
80 Percentile Run Time Minus 120 Percent of Scheduled Run Time (min.) |
|---|---|---|---|---|---|---|
101-3 |
In |
7:23 |
31 |
46.9 |
31.2 |
15.7 |
101-3 |
In |
7:10 |
57 |
46.8 |
31.2 |
15.6 |
104 |
In |
24:41 |
57 |
38.3 |
22.8 |
15.5 |
93-2 |
In |
15:58 |
44 |
33.9 |
20.4 |
13.5 |
101-3 |
Out |
14:07 |
5 |
61.1 |
48 |
13.1 |
106-3 |
In |
7:33 |
54 |
52.6 |
40.8 |
11.8 |
89 |
In |
7:45 |
59 |
35.8 |
25.2 |
10.6 |
101-3 |
In |
6:50 |
41 |
41.5 |
31.2 |
10.3 |
101-3 |
In |
7:42 |
55 |
44.7 |
34.8 |
9.9 |
89-2 |
In |
7:39 |
55 |
29.5 |
20.4 |
9.1 |
101-3 |
In |
8:18 |
56 |
48.1 |
39.6 |
8.5 |
101-3 |
In |
16:32 |
43 |
39.6 |
31.2 |
8.4 |
110 |
In |
7:18 |
55 |
45.5 |
37.2 |
8.3 |
106-3 |
In |
7:10 |
59 |
51.4 |
43.2 |
8.2 |
101-3 |
In |
8:30 |
52 |
44.0 |
36 |
8.0 |
89-2 |
In |
8:15 |
51 |
28.2 |
20.4 |
7.8 |
101-3 |
In |
7:54 |
53 |
47.1 |
39.6 |
7.5 |
89 |
In |
7:27 |
57 |
31.1 |
24 |
7.1 |
93-1 |
In |
7:19 |
39 |
28.4 |
21.6 |
6.8 |
101-3 |
In |
15:35 |
50 |
37.6 |
31.2 |
6.4 |
104 |
In |
16:44 |
51 |
37.6 |
31.2 |
6.4 |
91 |
Out |
16:05 |
47 |
29.1 |
22.8 |
6.3 |
89 |
In |
16:55 |
46 |
29.0 |
22.8 |
6.2 |
325 |
In |
16:15 |
49 |
33.8 |
27.6 |
6.2 |
106-3 |
In |
7:57 |
55 |
43.3 |
37.2 |
6.1 |
101-3 |
In |
15:05 |
54 |
36.6 |
31.2 |
5.4 |
93-1 |
In |
15:30 |
54 |
25.7 |
20.4 |
5.3 |
89 |
In |
14:43 |
56 |
26.7 |
21.6 |
5.1 |
89-2 |
In |
18:04 |
55 |
23.1 |
18 |
5.1 |
89 |
In |
7:09 |
55 |
27.9 |
22.8 |
5.1 |
101-4 |
Out |
8:40 |
5 |
48.3 |
43.2 |
5.1 |
101-3 |
In |
6:30 |
57 |
32.5 |
27.6 |
4.9 |
91 |
Out |
14:45 |
43 |
27.6 |
22.8 |
4.8 |
93-1 |
Out |
7:53 |
43 |
26.4 |
21.6 |
4.8 |
112 |
Out |
7:20 |
55 |
58.6 |
54 |
4.6 |
89-2 |
In |
17:28 |
54 |
25.9 |
21.6 |
4.3 |
91 |
Out |
17:35 |
55 |
28.2 |
24 |
4.2 |
104 |
In |
17:44 |
37 |
31.8 |
27.6 |
4.2 |
134-5 |
In |
6:10 |
47 |
49.6 |
45.6 |
4.0 |
110 |
In |
16:44 |
56 |
38.8 |
34.8 |
4.0 |
104 |
In |
16:05 |
17 |
35.1 |
31.2 |
3.9 |
109 |
In |
16:45 |
34 |
30.0 |
26.4 |
3.6 |
106-3 |
In |
5:30 |
57 |
30.0 |
26.4 |
3.6 |
92-3 |
Out |
16:24 |
43 |
27.6 |
24 |
3.6 |
92-3 |
Out |
16:09 |
42 |
24.0 |
20.4 |
3.6 |
101-3 |
In |
6:40 |
9 |
31.1 |
27.6 |
3.5 |
89-2 |
In |
15:13 |
56 |
25.0 |
21.6 |
3.4 |
104 |
In |
14:00 |
57 |
40.6 |
37.2 |
3.4 |
110 |
In |
18:25 |
56 |
33.3 |
30 |
3.3 |
430-2 |
In |
22:25 |
54 |
30.9 |
27.6 |
3.3 |
92-1 |
In |
15:26 |
54 |
34.5 |
31.2 |
3.3 |
104 |
In |
20:40 |
53 |
25.9 |
22.8 |
3.1 |
93-2 |
Out |
8:38 |
51 |
24.6 |
21.6 |
3.0 |
109 |
In |
14:55 |
54 |
31.8 |
28.8 |
3.0 |
91 |
Out |
13:45 |
53 |
23.4 |
20.4 |
3.0 |
93-1 |
Out |
16:45 |
54 |
28.2 |
25.2 |
3.0 |
91 |
Out |
18:05 |
39 |
26.8 |
24 |
2.8 |
91-7 |
Out |
19:45 |
53 |
19.5 |
16.8 |
2.7 |
92-3 |
Out |
8:32 |
27 |
21.9 |
19.2 |
2.7 |
93-1 |
Out |
7:10 |
50 |
21.9 |
19.2 |
2.7 |
111-2 |
In |
16:31 |
51 |
21.8 |
19.2 |
2.6 |
92-3 |
Out |
17:39 |
55 |
27.8 |
25.2 |
2.6 |
104 |
In |
18:15 |
44 |
27.8 |
25.2 |
2.6 |
93-1 |
Out |
19:05 |
55 |
25.4 |
22.8 |
2.6 |
92-3 |
Out |
15:54 |
54 |
23.0 |
20.4 |
2.6 |
109 |
In |
5:21 |
53 |
25.3 |
22.8 |
2.5 |
93-2 |
Out |
18:05 |
56 |
28.9 |
26.4 |
2.5 |
91 |
Out |
18:30 |
51 |
25.3 |
22.8 |
2.5 |
92-3 |
In |
7:35 |
43 |
26.4 |
24 |
2.4 |
93-1 |
In |
15:45 |
43 |
22.8 |
20.4 |
2.4 |
89-2 |
In |
21:25 |
56 |
19.2 |
16.8 |
2.4 |
109 |
In |
13:40 |
38 |
31.2 |
28.8 |
2.4 |
92-3 |
Out |
16:39 |
55 |
27.5 |
25.2 |
2.3 |
93-1 |
Out |
17:10 |
46 |
31.0 |
28.8 |
2.2 |
101-4 |
In |
13:06 |
54 |
33.4 |
31.2 |
2.2 |
89-2 |
In |
13:30 |
54 |
20.1 |
18 |
2.1 |
89-2 |
In |
16:30 |
52 |
23.7 |
21.6 |
2.1 |
91-7 |
Out |
22:15 |
56 |
16.5 |
14.4 |
2.1 |
93-2 |
Out |
14:25 |
56 |
27.2 |
25.2 |
2.0 |
89 |
In |
16:36 |
45 |
27.2 |
25.2 |
2.0 |
91 |
Out |
7:15 |
49 |
19.9 |
18 |
1.9 |
101-3 |
In |
17:08 |
4 |
33.1 |
31.2 |
1.9 |
104 |
Out |
17:52 |
46 |
35.5 |
33.6 |
1.9 |
91 |
Out |
7:45 |
59 |
19.9 |
18 |
1.9 |
104 |
In |
5:11 |
50 |
23.5 |
21.6 |
1.9 |
93-1 |
Out |
6:56 |
49 |
21.0 |
19.2 |
1.8 |
93-1 |
Out |
17:17 |
53 |
29.4 |
27.6 |
1.8 |
89 |
In |
11:52 |
55 |
23.4 |
21.6 |
1.8 |
91 |
Out |
8:15 |
54 |
19.8 |
18 |
1.8 |
93-2 |
Out |
13:25 |
55 |
25.8 |
24 |
1.8 |
89-2 |
In |
16:07 |
56 |
23.3 |
21.6 |
1.7 |
93-1 |
Out |
8:08 |
53 |
23.3 |
21.6 |
1.7 |
89 |
In |
18:56 |
50 |
24.5 |
22.8 |
1.7 |
110-4 |
In |
5:36 |
48 |
22.0 |
20.4 |
1.6 |
93 |
Out |
5:03 |
51 |
11.2 |
9.6 |
1.6 |
110-4 |
In |
17:48 |
56 |
23.2 |
21.6 |
1.6 |
430-2 |
In |
21:00 |
57 |
37.5 |
36 |
1.5 |
93-1 |
Out |
8:15 |
49 |
23.1 |
21.6 |
1.5 |
411-1 |
In |
18:25 |
56 |
18.3 |
16.8 |
1.5 |
104 |
In |
19:45 |
57 |
24.3 |
22.8 |
1.5 |
91 |
Out |
8:40 |
53 |
19.5 |
18 |
1.5 |
109 |
In |
7:16 |
42 |
42.3 |
40.8 |
1.4 |
89 |
In |
8:40 |
55 |
26.6 |
25.2 |
1.4 |
91 |
Out |
12:35 |
55 |
21.8 |
20.4 |
1.4 |
106-3 |
In |
6:30 |
56 |
35.0 |
33.6 |
1.4 |
110-2 |
Out |
14:17 |
18 |
27.8 |
26.4 |
1.4 |
89-2 |
In |
19:55 |
56 |
18.1 |
16.8 |
1.3 |
93-1 |
Out |
17:01 |
52 |
30.1 |
28.8 |
1.3 |
92-3 |
Out |
8:47 |
46 |
20.5 |
19.2 |
1.3 |
93-2 |
Out |
7:28 |
54 |
22.8 |
21.6 |
1.2 |
104 |
In |
15:05 |
33 |
32.4 |
31.2 |
1.2 |
112 |
Out |
18:00 |
55 |
51.6 |
50.4 |
1.2 |
93-1 |
Out |
17:49 |
47 |
27.5 |
26.4 |
1.1 |
134-7 |
In |
21:15 |
56 |
13.0 |
12 |
1.0 |
94-1 |
In |
21:15 |
54 |
17.8 |
16.8 |
1.0 |
134-7 |
In |
20:15 |
56 |
12.9 |
12 |
0.9 |
110 |
In |
7:48 |
55 |
38.1 |
37.2 |
0.9 |
92-3 |
Out |
16:54 |
37 |
29.7 |
28.8 |
0.9 |
109 |
In |
21:10 |
56 |
22.5 |
21.6 |
0.9 |
109 |
In |
18:15 |
48 |
22.4 |
21.6 |
0.8 |
93-1 |
In |
7:33 |
45 |
26.0 |
25.2 |
0.8 |
91 |
Out |
9:00 |
15 |
20.0 |
19.2 |
0.8 |
134-7 |
In |
23:15 |
59 |
11.5 |
10.8 |
0.7 |
104 |
In |
6:55 |
13 |
39.1 |
38.4 |
0.7 |
89-2 |
In |
6:03 |
51 |
16.3 |
15.6 |
0.6 |
110-4 |
In |
6:12 |
57 |
25.8 |
25.2 |
0.6 |
93-7 |
Out |
23:25 |
51 |
13.8 |
13.2 |
0.6 |
104 |
Out |
14:50 |
50 |
37.8 |
37.2 |
0.6 |
104 |
In |
19:20 |
49 |
24.6 |
24 |
0.6 |
93-1 |
Out |
16:37 |
59 |
24.5 |
24 |
0.5 |
92-1 |
In |
15:38 |
43 |
31.7 |
31.2 |
0.5 |
92-1 |
In |
16:10 |
50 |
31.7 |
31.2 |
0.5 |
91 |
Out |
6:50 |
56 |
13.7 |
13.2 |
0.5 |
93-1 |
Out |
17:33 |
55 |
26.9 |
26.4 |
0.5 |
101-4 |
In |
9:44 |
52 |
36.4 |
36 |
0.4 |
94-1 |
Out |
5:39 |
30 |
13.6 |
13.2 |
0.4 |
101-1 |
Out |
18:53 |
13 |
20.8 |
20.4 |
0.4 |
100-3 |
In |
6:00 |
52 |
14.7 |
14.4 |
0.3 |
94-1 |
Out |
24:10 |
47 |
17.1 |
16.8 |
0.3 |
93-1 |
Out |
15:40 |
55 |
24.3 |
24 |
0.3 |
93-1 |
Out |
16:04 |
52 |
24.3 |
24 |
0.3 |
111-5 |
In |
18:25 |
40 |
25.5 |
25.2 |
0.3 |
325 |
In |
16:35 |
54 |
27.9 |
27.6 |
0.3 |
92-3 |
Out |
17:09 |
43 |
30.2 |
30 |
0.2 |
89-2 |
In |
10:17 |
57 |
19.4 |
19.2 |
0.2 |
93-1 |
Out |
18:35 |
49 |
23.0 |
22.8 |
0.2 |
104 |
Out |
15:10 |
45 |
34.9 |
34.8 |
0.1 |
Table 10 provides a list of fall 2015 trips that were scheduled as a lead-in to an interline that required a deadhead movement that did not pass the 90 percentile run-time comparison to the120 percent of the scheduled run-time threshold (46 out of 74 such trips).
| Route |
Dir. |
Start |
Number of Obs. |
90 Percentile |
120 Percent of Scheduled |
90 Percentile Run Time Minus 120 Percent of Scheduled Run Time (min.) |
|---|---|---|---|---|---|---|
326 |
Out |
18:35 |
50 |
39.8 |
19.2 |
20.6 |
352 |
Out |
15:20 |
50 |
53.6 |
38.4 |
15.2 |
134-6 |
In |
7:25 |
44 |
40.5 |
27.6 |
12.9 |
110 |
In |
7:08 |
56 |
49.5 |
37.2 |
12.3 |
352 |
In |
8:30 |
46 |
58.7 |
46.8 |
11.9 |
101-4 |
Out |
21:30 |
9 |
43.1 |
32.4 |
10.7 |
111-5 |
In |
6:37 |
53 |
41.8 |
31.2 |
10.6 |
326 |
Out |
17:53 |
48 |
30.6 |
20.4 |
10.2 |
91 |
Out |
15:05 |
47 |
32.7 |
22.8 |
9.9 |
110 |
In |
7:28 |
56 |
46.1 |
37.2 |
8.9 |
325-2 |
Out |
18:10 |
43 |
30.5 |
22.8 |
7.7 |
109 |
In |
14:15 |
54 |
36.0 |
28.8 |
7.2 |
101-3 |
In |
14:35 |
56 |
41.8 |
34.8 |
7.0 |
352 |
Out |
17:35 |
51 |
51.4 |
44.4 |
7.0 |
111-2 |
In |
15:50 |
50 |
25.5 |
19.2 |
6.3 |
101-2 |
Out |
7:10 |
52 |
24.2 |
18 |
6.2 |
101-2 |
Out |
7:20 |
53 |
24.1 |
18 |
6.1 |
101-3 |
In |
8:06 |
4 |
44.3 |
38.4 |
5.9 |
101-3 |
In |
14:50 |
17 |
38.0 |
32.4 |
5.6 |
91 |
Out |
11:50 |
53 |
25.4 |
20.4 |
5.0 |
101-3 |
In |
15:50 |
44 |
36.2 |
31.2 |
5.0 |
326-1 |
In |
7:20 |
54 |
32.5 |
27.6 |
4.9 |
136-4 |
In |
6:00 |
33 |
33.5 |
28.8 |
4.7 |
93-2 |
Out |
8:48 |
40 |
25.8 |
21.6 |
4.2 |
136-4 |
In |
5:30 |
52 |
32.9 |
28.8 |
4.0 |
106-7 |
In |
10:15 |
42 |
49.4 |
45.6 |
3.8 |
106-3 |
In |
17:16 |
55 |
39.7 |
36 |
3.7 |
104 |
Out |
16:22 |
56 |
42.1 |
38.4 |
3.7 |
111-6 |
In |
6:23 |
57 |
24.0 |
20.4 |
3.6 |
91 |
Out |
13:20 |
54 |
23.9 |
20.4 |
3.5 |
111-5 |
Out |
18:55 |
9 |
30.8 |
27.6 |
3.2 |
95-5 |
Out |
7:00 |
43 |
17.6 |
14.4 |
3.2 |
110-4 |
In |
6:30 |
57 |
28.3 |
25.2 |
3.1 |
104 |
Out |
22:15 |
56 |
25.6 |
22.8 |
2.8 |
101-3 |
In |
14:09 |
56 |
38.7 |
36 |
2.7 |
111-6 |
In |
6:06 |
56 |
22.9 |
20.4 |
2.4 |
111-6 |
In |
6:13 |
48 |
22.8 |
20.4 |
2.4 |
112 |
Out |
8:40 |
48 |
56.2 |
54 |
2.2 |
101-4 |
In |
12:33 |
48 |
36.8 |
34.8 |
2.0 |
104 |
Out |
19:20 |
44 |
30.5 |
28.8 |
1.7 |
89 |
In |
15:25 |
56 |
26.7 |
25.2 |
1.5 |
104 |
In |
17:14 |
48 |
32.3 |
31.2 |
1.1 |
93-1 |
Out |
6:36 |
55 |
20.2 |
19.2 |
1.0 |
104 |
In |
14:45 |
57 |
34.6 |
33.6 |
1.0 |
326-1 |
In |
6:25 |
59 |
25.0 |
24 |
1.0 |
106-4 |
In |
18:33 |
45 |
11.2 |
10.8 |
0.4 |
Unlike vehicle-revenue trips, HASTUS does not allow schedule makers to attach recovery time to deadhead movements. Therefore, it is especially important that programmed run times for deadhead movements are not undervalued. CTPS assessed deadhead run times using AVL observations from spring 2016. Table 11 provides a list of 41 (out of 437) scheduled weekday deadhead movements that had median run times greater than scheduled run times.
| District |
Start Point |
End Point |
Start Time |
Number of Obs. |
Scheduled Run Time (min.) |
Median Run Time (min.) |
Median Run Time - Scheduled Run Time (min.) |
|---|---|---|---|---|---|---|---|
Cabot |
jasst |
Dudly |
14:52 |
47 |
41 |
54.8 |
13.8 |
Cabot |
cntsq |
brway |
17:22 |
32 |
28 |
38.8 |
10.8 |
Quincy |
qnctr |
nwbhl |
14:07 |
63 |
28 |
35.3 |
7.3 |
Cabot |
fhill |
jqnsb |
14:40 |
50 |
20 |
27.1 |
7.1 |
Quincy |
newbl |
qnctr |
15:08 |
61 |
17 |
23.2 |
6.2 |
Cabot |
rugg |
jqnsb |
10:18 |
10 |
12 |
17.2 |
5.2 |
Charlestown |
hayms |
warbp |
6:08 |
48 |
20 |
24.6 |
4.6 |
Charlestown |
malst |
uphgh |
7:50 |
60 |
10 |
14.6 |
4.6 |
Bennett |
clarh |
arlht |
15:09 |
47 |
26 |
30.5 |
4.5 |
Charlestown |
hayms |
wacry |
9:05 |
9 |
12 |
16.4 |
4.4 |
Charlestown |
malst |
medfd |
8:43 |
63 |
17 |
21.4 |
4.4 |
Arborway |
fhill |
louis |
13:53 |
23 |
22 |
25.5 |
3.5 |
Charlestown |
mdlsc |
sull |
15:08 |
49 |
27 |
30.4 |
3.4 |
Bennett |
rindg |
alewf |
15:12 |
64 |
18 |
21.1 |
3.1 |
Quincy |
nqncy |
fldcr |
15:03 |
22 |
17 |
19.8 |
2.8 |
Charlestown |
fells |
sull |
14:54 |
45 |
16 |
18.5 |
2.5 |
Charlestown |
sull |
davis |
18:33 |
22 |
17 |
19.4 |
2.4 |
Bennett |
alewf |
rindg |
19:02 |
19 |
13 |
15.1 |
2.1 |
Cabot |
bumed |
andrw |
8:14 |
28 |
11 |
13.1 |
2.1 |
Arborway |
matpn |
fhill |
18:37 |
18 |
23 |
25.0 |
2.0 |
Cabot |
matpn |
kenbs |
14:25 |
33 |
41 |
43.0 |
2.0 |
Cabot |
conat |
ctypt |
8:27 |
61 |
8 |
9.5 |
1.5 |
Bennett |
alewf |
bdfwd |
17:12 |
57 |
68 |
69.4 |
1.4 |
Arborway |
ashmt |
matpn |
14:54 |
12 |
16 |
17.3 |
1.3 |
Arborway |
louis |
fhill |
7:17 |
13 |
22 |
23.1 |
1.1 |
Bennett |
cntsq |
alewf |
17:31 |
50 |
34 |
35.1 |
1.1 |
Cabot |
bumed |
andrw |
8:34 |
9 |
11 |
12.1 |
1.1 |
Arborway |
Dudly |
jpctr |
6:59 |
58 |
14 |
15.1 |
1.1 |
Charlestown |
woodc |
welst |
14:39 |
61 |
16 |
16.9 |
0.9 |
Arborway |
louis |
fhill |
7:06 |
57 |
22 |
22.9 |
0.9 |
Cabot |
ashmt |
Dudly |
16:14 |
48 |
29 |
29.8 |
0.8 |
Arborway |
fhill |
cloop |
15:59 |
57 |
27 |
27.8 |
0.8 |
Cabot |
conat |
ctypt |
8:34 |
58 |
8 |
8.7 |
0.7 |
Bennett |
bally |
sull |
18:47 |
50 |
21 |
21.7 |
0.7 |
Cabot |
conat |
ctypt |
7:57 |
48 |
8 |
8.6 |
0.6 |
Charlestown |
hayms |
warbp |
5:37 |
59 |
21 |
21.4 |
0.4 |
Lynn |
wlynn |
mavck |
15:01 |
49 |
19 |
19.4 |
0.4 |
Cabot |
conat |
ctypt |
8:06 |
61 |
9 |
9.2 |
0.2 |
Cabot |
andrw |
bumed |
15:16 |
58 |
10 |
10.2 |
0.2 |
Charlestown |
sull |
davis |
19:19 |
54 |
16 |
16.1 |
0.1 |
Cabot |
andrw |
bumed |
15:36 |
54 |
10 |
10.1 |
0.1 |
Unlike vehicle-revenue trips and deadhead movements between two vehicle-revenue trips, assessing delay caused by pull-out movements from the garage as a function of observed run time would be misleading, as operators are permitted to leave the garage as much as 20 minutes early to pick up items such as coffee and water on the way to their first in-service trip. Without knowing which AVL observations contain such a stop along the way, assessing delay is limited to investigating how often operators leave the garage on time, and how late operators arrive at the start point of their first vehicle-revenue trip when they do not leave the garage on time.
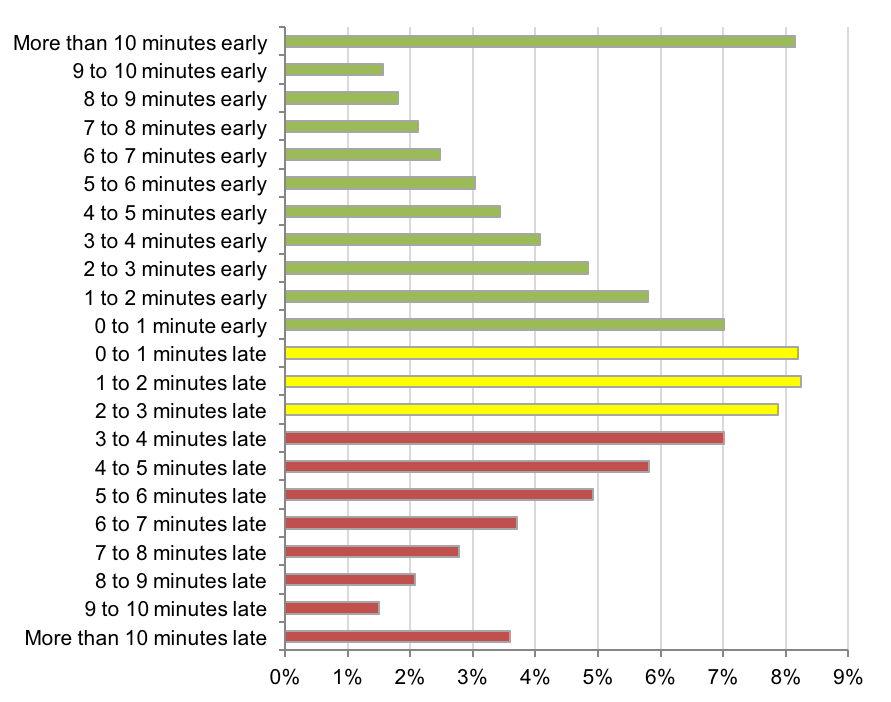
Table 12 provides a summary of the number of pull-out trips that departed the garage more than three minutes late, delineated by garage.
Table 13 provides a summary of how late trips arrived at the start point of their first vehicle-revenue trip when they departed more than three minutes late from the garage, delineated by garage.
| Garage |
Spring 2016 Observations |
Number of Observations that |
Percentage of Observations that |
Percentage of all Observations that Departed Garage More than Three Minutes Late and Arrived for First Trip After Scheduled Departure |
|---|---|---|---|---|
Albany |
7,775 |
2,814 |
36.2% |
18.9% |
Arborway |
14,787 |
6,099 |
41.2% |
33.0% |
Cabot |
12,439 |
4,035 |
32.4% |
25.7% |
Charlestown |
11,254 |
3,111 |
27.6% |
20.1% |
Fellsway |
5,271 |
1,489 |
28.2% |
17.3% |
Lynn |
6,841 |
1,401 |
20.5% |
12.6% |
North Cambridge |
782 |
338 |
43.2% |
29.5% |
Quincy |
7,308 |
1,961 |
26.8% |
21.8% |
Southampton |
3,207 |
934 |
29.1% |
15.4% |
Somerville |
9,558 |
2,694 |
28.2% |
17.0% |
Total |
79,222 |
24,876 |
31.4% |
22.1% |
| Garage |
Number of Observations that Arrived for First Trip After Scheduled Departure |
Percentage of Observations that Arrived for First Trip After Scheduled Departure |
Arrival Lateness per Trip of Observations that Arrived for First Trip After Scheduled Departure (min.) |
|---|---|---|---|
Albany |
1,472 |
52.3% |
3.6 |
Arborway |
4,876 |
79.9% |
3.8 |
Cabot |
3,202 |
79.4% |
4.5 |
Charlestown |
2,260 |
72.6% |
3.9 |
Fellsway |
914 |
61.4% |
3.0 |
Lynn |
859 |
61.3% |
3.9 |
North Cambridge |
231 |
68.3% |
2.7 |
Quincy |
1,591 |
81.1% |
3.0 |
Southampton |
493 |
52.8% |
4.0 |
Somerville |
1,621 |
60.2% |
4.4 |
Total |
17,519 |
70.4% |
3.9 |
Of the 79,222 observations in the spring 2016 dataset, 24,876 (31.4 percent) of pull-out trips departed more than three minutes late from the garage. Of these, 17,519 (22.1 percent of all pull-outs, and 70.4 percent of pull-outs that departed more than three minutes late) arrived at the start point of their first vehicle-revenue trip after the scheduled departure time, with an average arrival lateness of 3.9 minutes per trip.
On weekdays throughout the midafternoon and early PM peak periods, the MBTA operates a series of supplemental bus trips; these are different from typical scheduled bus service as they traverse along a unique route variation and hold at their origin point until bus operations field staff release them for departure. The time of day that bus operations field staff release each supplemental trip often can change without notice, presenting a challenge when building them into a schedule each quarter. Because supplemental trips are typically scheduled following a pull-out from the garage, arriving on time for departure is generally not an issue from a scheduling perspective. However, when bus operations field staff adjust when a supplemental trip is released it affects when the bus arrives to start its next trip, which may cause that trip to depart late. Such delay has the potential to resonate throughout the remainder of the block heading into the PM peak period.
With the use of automatic blocking software, it has become increasingly important that scheduled departure times and run times for supplemental trips reflect the reality of what is being operated. To assess supplemental bus trips, CTPS used fall 2015 AVL data provided by the MBTA. Summaries of origin departure lateness, end-point arrival lateness, and run times for supplemental trips based on the fall 2015 AVL observations are provided in Appendix B along with a summary of suggested scheduling adjustments. The summaries provided in Appendix B are not intended to reflect the current state of these supplemental trips, as the MBTA makes constant schedule adjustments, but rather to highlight the importance of closely monitoring them.
A bus operator swing-on occurs when there is a scheduled change in operators while a bus is in service, usually at the start or end point of a trip. In general, the operator stepping off the bus ends their assignment while the other operator starts theirs. A swing-on provides the benefit of reducing the total number of non-revenue vehicle-hours when compared to the alternative option of pulling a vehicle in and out of service to change operators at the garage. The potential burdens of scheduling swing-ons include the extra time it takes for an operator switch to occur and delays caused by operators showing up late to the swing-on location. In addition, swing-ons increase the number of trips in a row a vehicle is scheduled to complete, which can perpetuate delay that occurs early on in the block. For blocks containing trips with poor on-time performance, a scheduled trip back to the garage for an operator change may be utilized as a layover to recover from delay that occurred on previous trips.
CTPS used fall 2015 AVL data provided by the MBTA to assess swing-on delay under two scenarios, as outlined in Figure 6.

As shown in the figure above, scenario A reflects a situation where the bus arrives for its swing-on before its scheduled departure time. Swing-on delay for a trip under this condition is assessed as the amount of time that passes from three minutes past the scheduled departure time to when the trip departs. Three minutes past a trip’s scheduled departure time was selected as a threshold because it is similar to the MBTA’s definition of a late departing trip.
Scenario B reflects a situation where the bus arrives for its swing-on after its scheduled departure time. Swing-on delay that occurs under this condition is assessed as the amount of time between arrival and departure that is in excess of three minutes, under the assumption that three minutes is a reasonable amount of time for an operator switch to be completed and all passengers to be loaded. The frequency at which scenario B occurs is important, as a trip where scenario B occurs frequently might benefit from a schedule adjustment that assigns the operator change back at the garage with a hook to a different trip or deadhead movement in order to minimize delay in the system.
Appendix C provides swing-on delay summaries by route, start-point location, and time of day. In the fall 2015 schedule, there were 720 scheduled swing-ons each weekday.
In scenario A, 28,077 AVL observations were recorded, with total assessed swing-on delay of 414 hours (53 seconds of delay per swing-on). In scenario B, 9,077 AVL observations were recorded, with total assessed swing-on delay of 195 hours (77 seconds of delay per swing-on) in addition to any amount of delay from a late arrival. Scenarios A and B combined yield an average of 59 seconds of delay per swing-on. Scenario B accounted for 24.4 percent of all observations (that is, at least 24.4 percent of swing-ons begin after their scheduled departure time). Staff recommend that the MBTA review specific trips, locations, and times of day where scenario B is a common occurrence.
CTPS was tasked with assessing the amount of time that departure lateness at origins could be reduced if operators who have time to lay over are held to a higher standard of on-time departure performance by pulling up early to load passengers so that all passengers are boarded no later than the scheduled departure time.
CTPS used fall 2015 AVL data and fall 2015 APC data provided by the MBTA to assess early pull-up opportunity for four high-frequency routes at four locations; Route 28 at Ruggles, Route 32 at Forest Hills, Route 57 at Kenmore, and Route 111 at Haymarket. Early pull-up opportunity is categorized by the four scenarios (A, B, C, and D) outlined in Figure 7. An arrival time at the terminal was assigned using the AVL data, and door open and door close time was assigned using the APC data. Layover time was assessed as the time between buses’ arrival at the terminal (using AVL data) and doors opening (using APC data). Dwell time was assessed as the time between the doors opening and doors closing (using APC data).
Scenario A occurs when the bus arrives at the origin after its scheduled departure time. Because the bus arrives late, there is no opportunity to achieve any time savings by cutting the layover short, and the missed opportunity for time savings is zero. Departure lateness is equal to the time when the doors close minus the scheduled departure time.
Scenario B occurs when the bus arrives at the origin before its scheduled departure time, but the doors do not open until after the scheduled departure time. The missed opportunity for time savings is equal to the time when the doors close minus the scheduled departure time, or the time when the doors open minus the time when the bus arrives, whichever is least. Departure lateness is equal to the time when the doors close minus the scheduled departure time.
Scenario C occurs when the bus arrives at the origin and opens its doors before its scheduled departure time, but the doors do not close until after the scheduled departure time. As with scenario B, the missed opportunity for time savings is equal to the time when the doors close minus the scheduled departure time, or the time when the doors open minus the time when the bus arrives, whichever is least. Departure lateness is equal to the time when the doors close minus the scheduled departure time.
Scenario D is the preferred scenario, where the operator has pulled up early enough to load all passengers before the scheduled departure time. All opportunity for time savings has been utilized, and there is zero departure lateness.
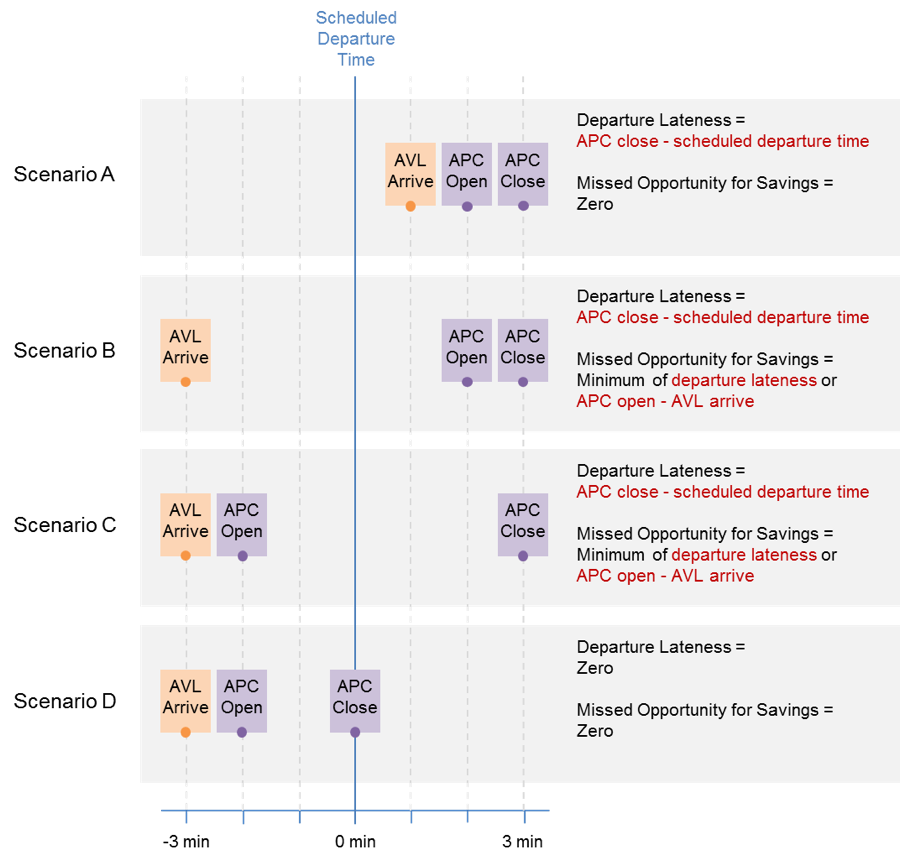
Table 14 provides a summary of early pull-up opportunity for each route; Table 15 provides a summary of all observations combined; and Appendix D provides a summary by trip. The number of observations for each route is limited by the number of APC observations, as the percentage of buses equipped with APC devices varies by garage.
| Route - Location |
Scenario |
Number of Obs. |
Total Departure Lateness (min.) |
Total Missed Opportunity for Savings (min.) |
Departure Lateness per Trip (min.) |
Missed Opportunity for Savings per Trip (min.) |
|---|---|---|---|---|---|---|
28 - Ruggles |
A |
1,015 |
8,644 |
N/A |
8.5 |
N/A |
28 |
B |
110 |
259 |
134 |
2.4 |
1.2 |
28 |
C |
744 |
1,369 |
336 |
1.8 |
0.5 |
28 |
D |
1,137 |
N/A |
N/A |
N/A |
N/A |
28 |
Total |
3,006 |
10,271 |
469 |
3.4 |
0.2 |
32 - Forest Hills |
A |
116 |
1,190 |
N/A |
10.3 |
N/A |
32 |
B |
25 |
70 |
23 |
2.8 |
0.9 |
32 |
C |
122 |
246 |
68 |
2.0 |
0.6 |
32 |
D |
90 |
N/A |
N/A |
N/A |
N/A |
32 |
Total |
353 |
1,506 |
91 |
4.3 |
0.3 |
57 - Kenmore |
A |
86 |
698 |
N/A |
8.1 |
N/A |
57 |
B |
8 |
38 |
28 |
4.7 |
3.5 |
57 |
C |
190 |
277 |
51 |
1.5 |
0.3 |
57 |
D |
246 |
N/A |
N/A |
N/A |
N/A |
57 |
Total |
530 |
1,013 |
79 |
1.9 |
0.1 |
111 - Haymarket |
A |
943 |
10,132 |
N/A |
10.7 |
N/A |
111 |
B |
96 |
404 |
176 |
4.2 |
1.8 |
111 |
C |
955 |
1,842 |
626 |
1.9 |
0.7 |
111 |
D |
723 |
N/A |
N/A |
N/A |
N/A |
111 |
Total |
2,717 |
12,378 |
802 |
4.6 |
0.3 |
Scenario |
Number of Obs. |
Total Departure Lateness (min.) |
Total Missed Opportunity for Savings (min.) |
Departure Lateness per Trip (min.) |
Missed Opportunity for Savings per Trip (min.) |
A |
2,160 |
20,664 |
N/A |
9.6 |
N/A |
B |
239 |
770 |
360 |
3.2 |
1.5 |
C |
2,011 |
3,734 |
1,081 |
1.9 |
0.5 |
D |
2,196 |
N/A |
N/A |
N/A |
N/A |
Total |
6,606 |
25,168 |
1,441 |
3.8 |
0.2 |
Staff formed 6,606 observations from AVL and APC data for the four routes combined. Of these observations, 33.7 percent were categorized under scenario A, where the bus arrived at its origin after its scheduled departure time, leaving no opportunity to achieve any time savings by reducing the layover. Staff categorized 33.2 percent of all observations under scenario D, where the bus closed its doors before the scheduled departure time, utilizing all opportunity for time savings.
The remaining 33.1 percent of observations were categorized under scenarios B and C, where a potential for time savings exists. For these 2,250 observations, there were 4,504 minutes of departure lateness (2.0 minutes per trip) and 1,441 minutes of missed opportunity for savings (0.6 minutes per trip). However, the amount of missed opportunity for time savings is likely less than reported, as this methodology did not account for any required travel time between the location of the AVL time point and the passenger pickup location.
A comparison of the total amount of departure lateness (25,169 minutes) to the total missed opportunity for savings (1,441 minutes) suggests that earlier pull-ups at origins would not contribute to a significant reduction in departure lateness along these routes.