Technical Memorandum
DATE: October 3, 2019
TO: Boston Region Metropolitan Planning Organization
FROM: Bill Kuttner
RE: Review of Critical Urban Freight Corridors: Crossing Mystic River
The National Highway Freight Network (NHFN) was established by federal highway funding authorization legislation to help prioritize a portion of federal highway funds to parts of the roadway system that are especially important for freight movement. The NHFN initially included the entire interstate highway system and a few locally designated roadways connecting with important intermodal terminals.
The current multi-year authorization, the Fixing America’s Surface Transportation (FAST) Act, contained a provision to expand the NHFN. States were asked to designate additional sections of roadway as Critical Urban Freight Corridors (CUFCs) or Critical Rural Freight Corridors (CRFCs). Massachusetts was authorized to designate 75 CUFC roadway miles and 150 CRFC miles. Massachusetts Department of Transportation (MassDOT) based its critical freight corridors on recommendations by the individual Metropolitan Planning Organizations (MPO). The Boston Region MPO, which is almost entirely urban, was asked to recommend 28 miles of roadway for CUFC designation, and its recommended CUFCs were accepted by both MassDOT and the Federal Highway Administration.
The study and designation of CUFCs have been important parts of the MPO’s Freight Program. Studies conducted prior to the FAST Act informed the designation of important CUFC sections. Other roadways designated as CUFCs were known to be important for freight but have not yet been the subject of a thorough study. This study continues the process of studying specific CUFC sections.
The MPO Freight Program has conducted a number of studies, but two studies looked specifically at areas with importance for industry and logistics.1,2 The first study looked at truck travel in the Everett-Chelsea industrial area, and was followed by a study of trucks serving the South Boston Waterfront. These studies were conducted in close cooperation with key stakeholders, and the findings represented the needs and concerns of both MPO and stakeholders. Results of these studies included the following:
These studies and the associated data have been used in several ways. The data have been used in funding applications and to inform local traffic and urban planning efforts. The studies also serve as templates for looking at similar corridors and industrial areas. They are also used as shelf references for freight and logistics in these areas.
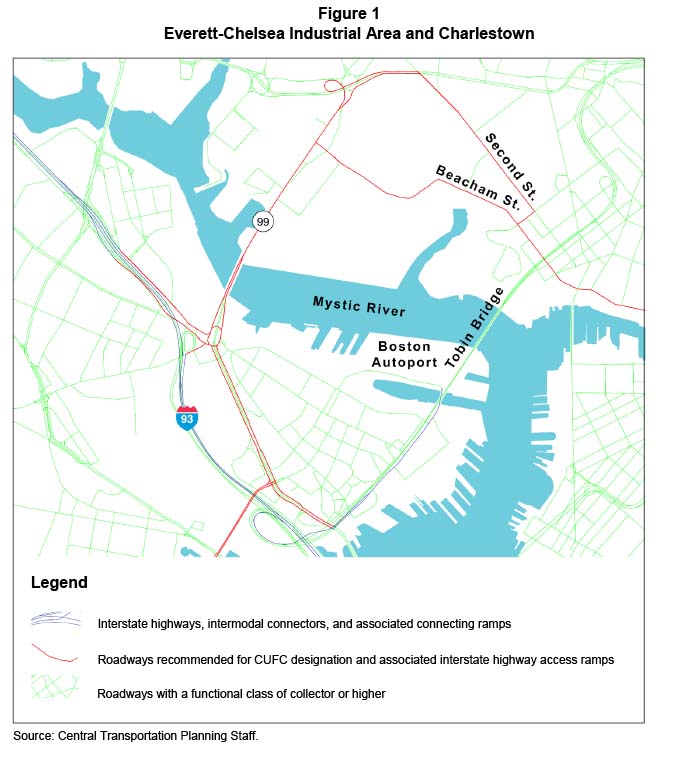
This study applied analysis similar to the earlier studies to CUFC segments between the Mystic River and the Cambridge City limits. Figure 1 shows the CUFC sections being studied here and the Route 99 connection over the Mystic River with the sections studied on the Everett-Chelsea study.
Figure 1
Everett-Chelsea Industrial Area and Charlestown
Legend
Interstate highways, intermodal connectors, and associated connecting ramps
Roadways recommended for CUFC designation and associated interstate highway access ramps
Roadways with a functional class of collector or higher
Source: Central Transportation Planning Staff.
Route 99 is a critical link because hazardous cargoes are allowed, unlike the Tobin Bridge, and Sumner, Callahan, and Ted Williams tunnels. This study has found, however, that only a very small fraction of truck traffic over this CUFC section has the red diamond hazardous cargo plaque affixed. The true logistic importance of this corridor is simply that a very large number of trucks need to use it to travel to origins and destinations north of the Charles River or to connect with key radial express highways including Interstate 93 (I-93) and US Route 1.
This corridor has been extensively studied. Study and evaluation efforts and their proponents include the following:
(Department of Environmental Protection)
All of these studies acknowledge the importance of trucks and the leading planning efforts make appropriate accommodations for trucks and other heavy vehicles. The necessity of these design accommodations will be clear from the truck volume data and vehicle descriptions developed in this study, and the need to adhere to these accommodations is a key finding of this work.
Results of this study include:
Discussion of freight planning issues of concern in the study area, notably the physical size of heavy vehicles and the volumes and travel patterns of hazardous cargoes
Figure 2 shows an aerial photo with the study corridor and associated roadways highlighted. The section of the CUFC extends from the midpoint of the Mystic River, close to the Everett-Boston city line, to City Square. At City Square, the corridor connects with the NHFN intermodal connector that extends from City Square to Massport’s Boston Autoport, used for import and some export of automobiles. Approximately 2,000 feet before City Square, the study corridor meets the Gilmore Bridge approach, part of the CUFC system connecting with I-90 at the Allston interchange.
Truck traffic, and at some locations general traffic, was counted at the three locations where the corridor connects with other NHFN sections: Mystic River, Gilmore Bridge, and City Square. Trucks were counted at nine additional locations where a significant amount of truck traffic enters or leaves the corridor from the express highway system, regional arterials, or nearby businesses.
Entering and leaving the study corridor is the most complex at Sullivan Square, a signalized rotary system above the Route 99 underpass. Sullivan Square is being redesigned and is programmed for reconstruction.3
The one-way pair of Maffa Way and Mystic Avenue (the Somerville name two blocks to the north) connects Sullivan Square with I-93 to and from the north and expanding commercial and residential areas of Somerville. Cambridge Street serves northbound exiting traffic from I-93 and connects Sullivan Square with the Inner Belt industrial area (not shown) and much of Somerville and Cambridge. Main Street is used for local access to Charlestown and some working waterfront activity, notably the Lafarge cement terminal.
The study corridor between Sullivan and City Squares is Rutherford Avenue, a divided major arterial with an underpass at the Gilmore Bridge approach. Two industrial sites have access to this corridor on the west, southbound, side of Rutherford Avenue. Trucks and automobiles going into and out of the Bunker Hill Industrial Park were counted, as were trucks serving Boston Sand and Gravel (BS&G). Trucks were also counted on Austin Street opposite the Gilmore Bridge approach, but this access point had the fewest trucks.
Between the Gilmore Bridge approach and City Square is a signalized intersection for local traffic traveling to or from the Tobin Bridge on US Route 1. At City Square the study corridor connects with the Charlestown, or North Washington Street bridge. There is also an entrance ramp to I-93 southbound.
Until the 1960s Charlestown was a one-square-mile residential enclave completely surrounded by industry, railroad yards, working waterfront, and the state prison. Rutherford Avenue was expanded in the 1960s to its current configuration, and I-93 was completed in the 1970s. Industrial activity in the area came to depend more on trucks, both as the trucking industry became more competitive and as the mix of local industry evolved towards light industry. BS&G is the area’s last remaining rail freight customer and generates significant truck traffic, all of which must enter or leave via the study corridor.
Today, much of the working waterfront and industrial areas have been re-purposed for residential and nonindustrial purposes. The largest single step in this direction was the transfer of the Charlestown Navy Yard from the US Navy to the National Park Service and Boston Redevelopment Authority in 1974. Evolution of the Navy Yard has been gradual and includes housing, service industries, and recreational opportunities. Similar transformation has taken place throughout Charlestown’s industrial periphery, but on a smaller scale.
Recent land use trends are apparent when comparing the adjacent Bunker Hill Industrial Park and former Hood Dairy plant. The Hood Dairy site fronts Rutherford Avenue and has been gradually converting existing buildings for mixed uses, and has recently begun construction of new nonindustrial buildings. The Bunker Hill Industrial Park is directly behind the Hood site and has a number of very active industrial tenants, all of which depend upon truck access through the study corridor.
Use of the Mystic River waterfront has also changed. Much of the waterfront is part of the Mystic River Designated Port Area, which generally restricts harborfront land uses to port-related activities, and many waterfront parcels are underused. Modern port facilities tend to be specialized, such as the Lafarge cement terminal and the auto import facilities at Massport’s Boston Autoport. Massport also hosts the Wind Technology Testing Center that tests wind turbine blades, some of which arrive by barge. Trucks carrying automobiles and wind turbine blades are especially large and use the NHFN Chelsea Street access corridor from City Square.
Figure 2
Study Corridor
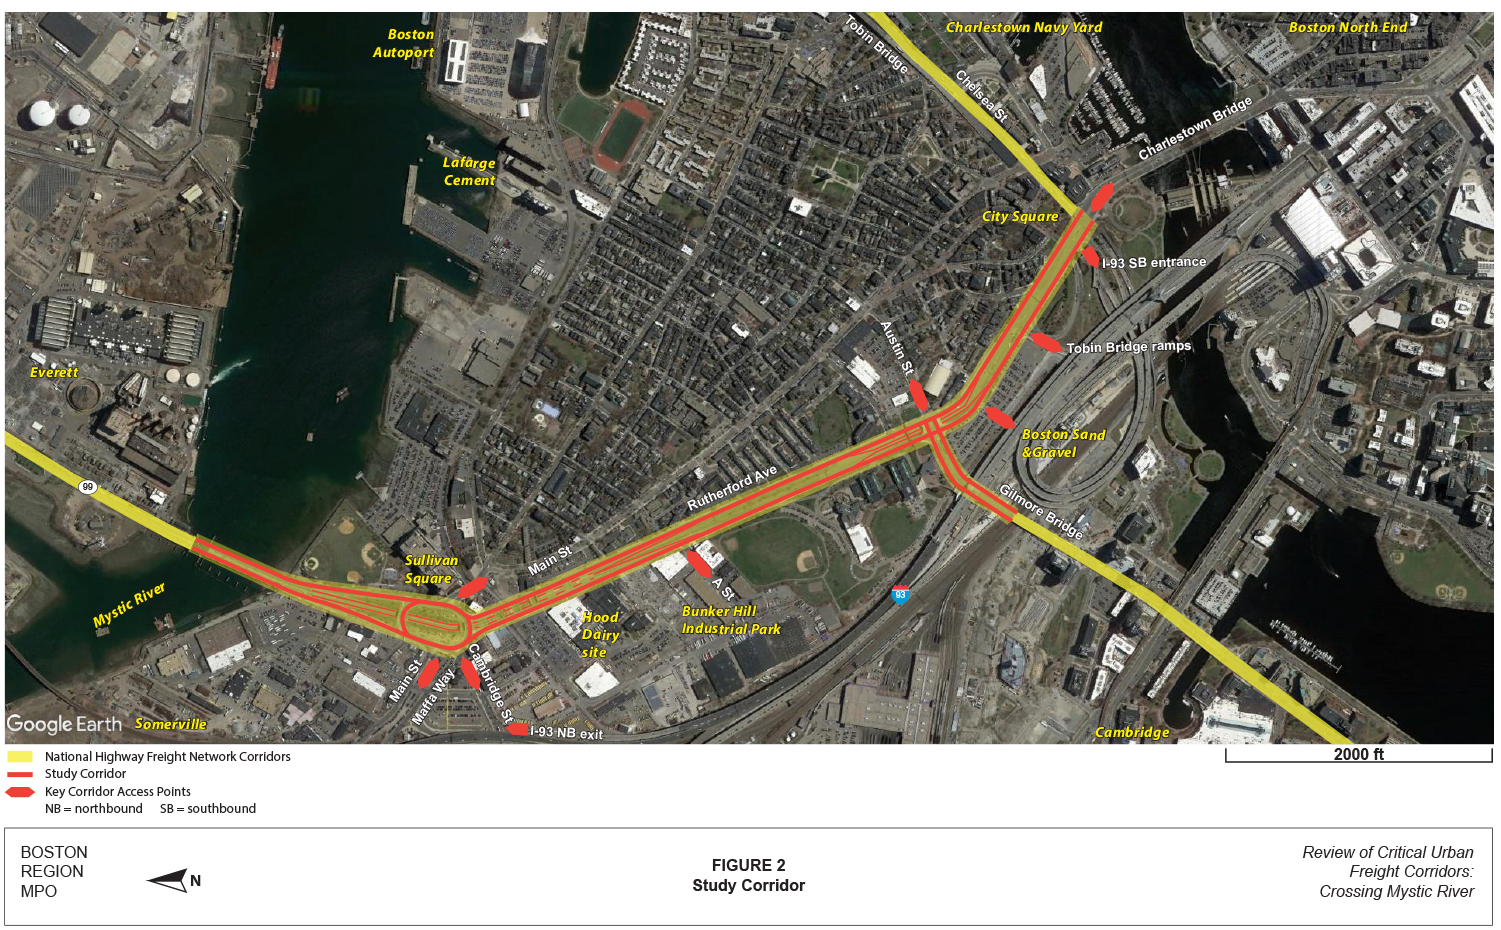
Figure 3
Light Commercial Vehicles
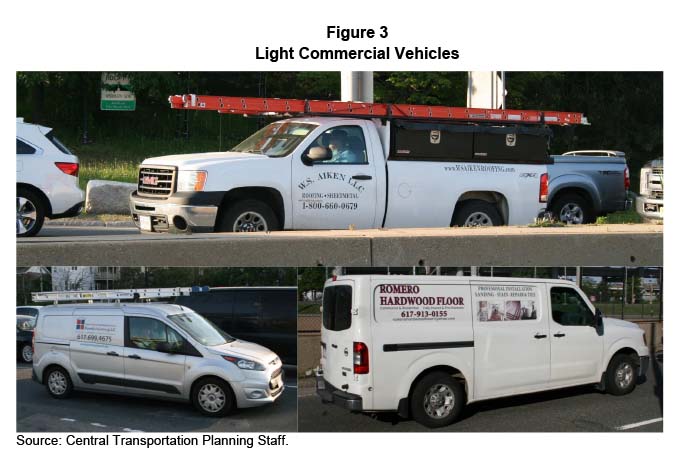
Figure 4
Box-Type Trucks: Single-Unit and Ocean Shipping Semi-Trailer
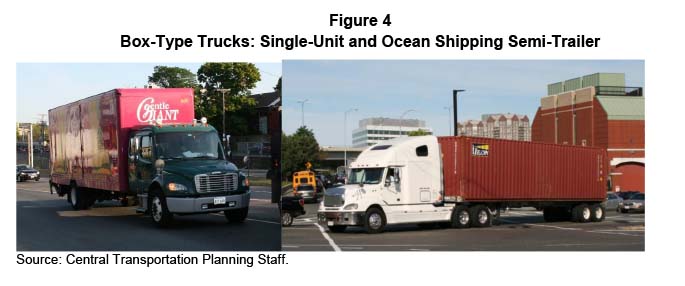
Figure 5
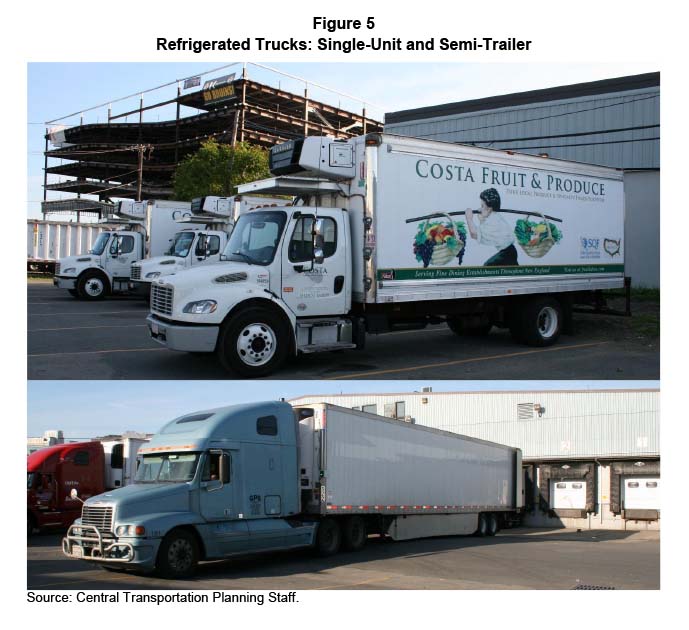
Refrigerated Trucks: Single-Unit and Semi-Trailer
Industrial activities along the study corridor are economically viable but are unlikely to expand because of business trends towards economies of scale and the limited amount of available land in the study corridor. Consequently, the great majority of trucks observed in the study corridor are making regional trips rather than serving study corridor destinations.
Vehicles whose primary purpose is to carry cargo or serve industrial purposes instead of carrying passengers make up approximately 13 percent of traffic in the study corridor. This percentage understates the significance of these vehicles because they are on average larger than passenger cars. Despite their effect on traffic flows and importance for economic viability, obtaining useful data for trucks and working vehicles is especially difficult because of the diversity of vehicle types and trip purposes.
The population as a whole is organized into households whose size and location of primary residence are tracked regularly by the Census. Many residents also have a primary workplace, and information about these locations can be obtained through specialized surveys. Trucks and working vehicles are also garaged at specific locations, but there is no systematic survey of these vehicle populations. When a vehicle leaves a motor pool it might go anywhere, do anything, and go someplace different the following day. There is nothing analogous to a primary workplace or even a common job description for trucks and working vehicles.
This study places the study corridor under a microscope, tracking the flows of several general types of heavy vehicles through the corridor. Some specific types of heavy vehicles are examined more closely to better understand local industrial activity and associated roadway design requirements.
Light Commercial Vehicles are not the explicit focus of this study. However, they represent a substantial portion of traffic, approximately 8 percent of traffic crossing the Mystic River, and are integral to a wide range of economic activity, notably in construction and repair. These vehicles were counted at the Mystic River and several additional locations, and these data will be used in travel demand model calibration.
Figure 3 shows three examples of light commercial vehicles. These vehicles all have four wheels and are allowed to use Department of Conservation and Recreation parkways such as Storrow and Memorial Drives. At the top is a pickup truck with built-in tool boxes and a stenciled business name. It is not unusual for this type of vehicle to be purchased as a family car. The minivan with ladders at the lower left is also a popular family car model. This distinction is important because household trips and commercial vehicle trips have completely different treatments in the travel demand model despite the similarity of vehicle types. Full-sized vans with windows and row seating are classified in this study as buses.
Box-type trucks are the simplest type of heavy vehicle, two examples of which are shown in Figure 4. The single-unit truck at the left has two axles and six wheels, with the rear wheels being doubled. This truck carries household goods that are not particularly dense. If the cargo were beverages, the truck would probably have two rear axles making a total of three axles and 10 wheels. Single-unit trucks are used primarily for local freight movements, either a short trip or what is often referred to as the last mile of long-distance trip that involves other modes or a transfer at a terminal between larger and smaller trucks.
The truck at the right is a semi-trailer being pulled by a tractor. The trailer is an ocean shipping container designed to be stacked on modern container ships. When not being transported by ship or railroad car, these containers must be mounted on a wheeled chassis and hauled by a tractor. For the purposes of this study, ocean containers are considered box-type trucks providing generic enclosed freight hauling capacity.
Refrigerated trucks are a variant of box-type trucks (Figure 5.) These trucks have insulated walls and an attached refrigeration unit. The upper photo in Figure 5 shows a small fleet of single-unit six-wheeled refrigerated trucks used for local delivery. The refrigeration units are prominently visible above the vehicle cab. The lower photo shows a refrigerated semi-trailer making a delivery at a refrigerated warehouse. The refrigerator unit is mostly hidden by the tractor’s aerodynamic sleeper cab design.
Trucks that are not configured as a simple box and are not carrying hazardous cargoes are placed in a diverse group of trucks referred to as other configurations. Four of the many examples of these types of single-unit trucks are shown in Figure 6. These four images were chosen to illustrate some of the classification conventions used in this study. Other specific truck configurations in this group were counted at key locations and are discussed later in the memorandum.
Figure 6
Other Single-Unit Trucks
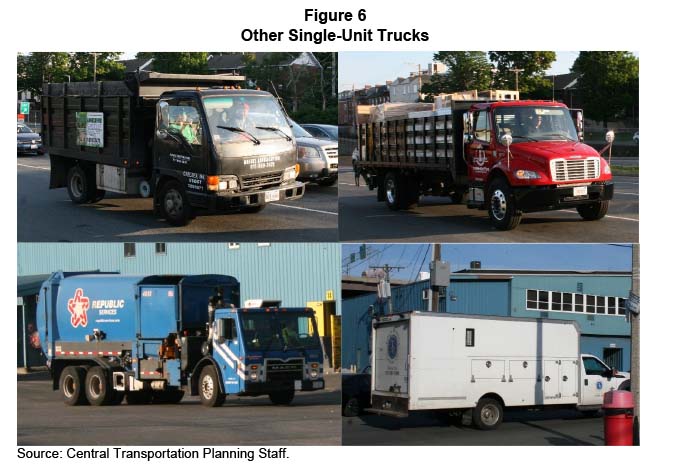
Source: Central Transportation Planning Staff.
The vehicle in the upper left of Figure 6 is a six-wheeled dump truck commonly owned by landscape contractors and public parks departments. At the upper right is a six-wheeled flatbed truck that is referred to as a stake truck when removable fencing encloses the truck bed.
The vehicle at the lower left in Figure 6 is a 10-wheeled truck configured to collect refuse from standard small dumpsters. A recycling center in the Bunker Hill Industrial Park is served by large numbers of these vehicles, many of which were counted during the night period. Refuse suitable for reprocessing is loaded into shipping containers such as shown in Figure 4 and exported from Massport’s Conley Container Terminal in South Boston.
The vehicle at lower right is a single-unit box-type truck that is equipped with built-in compartments designed to provide convenient access to tools and small parts at a worksite. The primary purpose of this vehicle is not the transportation of goods as is the case with conventional box-type trucks.
There is a wide variety of semi-trailers that are not configured as boxes. Figure 7 shows two examples of this truck group: a scrapped vehicle carrier in the top two pictures and a flatbed trailer transporting an excavator in the lower picture. Other types of these large vehicles were specifically counted and are shown and discussed in a following section.
The most notable feature of the vehicles in Figure 7 is their size. The scrap carrier is a specialized trailer and is shown both empty and carrying crushed cars to an export ocean terminal in Everett. Semi-trailers serving this terminal are a significant fraction of the other configuration semi-trailers that cross the Mystic River each weekday.
Trailer loads such as the excavator are not observed as frequently as scrap metal carriers or trucks associated with BS&G. However, these type of configurations are the largest that can operate without escort vehicles, and the design of CUFC roadways should fully accommodate vehicles of this size.
Any vehicle displaying the red-diamond hazardous cargo placard was included in this group. Some light commercial vehicles have signs that can be flipped open, but none were observed with red placards.
Figure 8 shows two examples of single-unit trucks with red placards. The truck on the left is used to deliver home heating oil or on-site fueling of construction vehicles. The vehicle at the right is delivering welding supplies on a flatbed, or stake truck. The hazardous cargoes of both these trucks are flammable. Some box-type trucks were observed with red placards indicating biohazard and were carrying hospital-related waste.
Semi-trailers with red placards are carrying gasoline for delivery to local or regional gas stations, or returning to motor pools or fuel depots. These are one class of vehicles whose numbers and movements were specifically analyzed.
Figure 7
Other Semi-Trailer Trucks
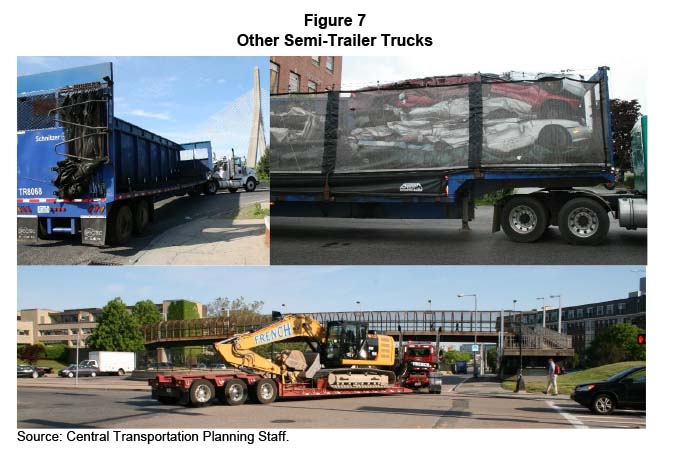
Source: Central Transportation Planning Staff.
Figure 8
Single-Unit Trucks with Hazardous Cargoes
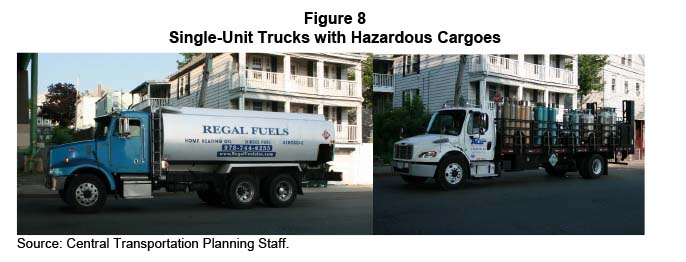
Source: Central Transportation Planning Staff.
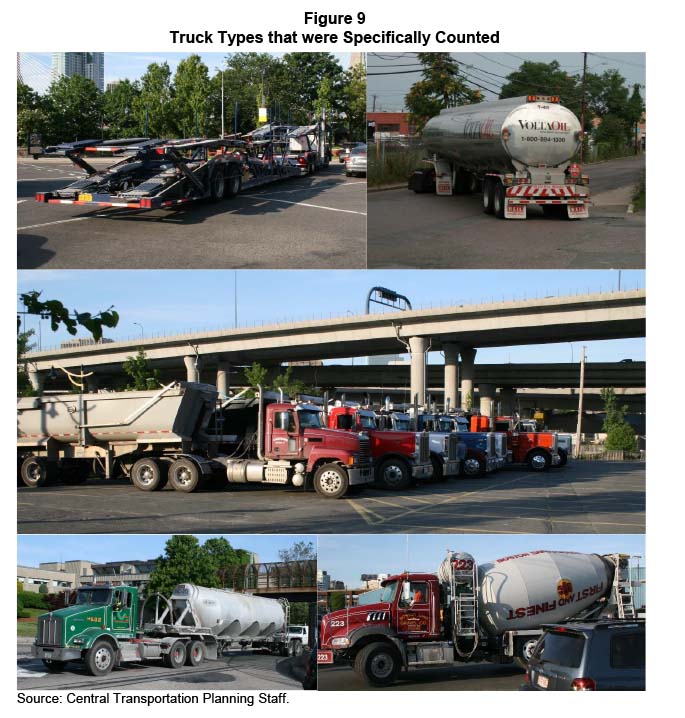
Five individual truck types were specifically counted at selected locations in the study corridor, and these truck types are shown in Figure 9. This section includes a brief description of these five types and explains why these five types were selected for more detailed analysis. Analysis of travel by these vehicle types will be part of the analyses of key study corridor intersections in the following section.
The vehicle at the upper left in Figure 9 is a specialized tractor-trailer combination that can carry up to nine light vehicles. Auto imports and exports are an important maritime activity at Massport’s Boston Autoport facility. These are large vehicles that require ample roadway surface to operate safely. A branch of the NHFN connects this facility with the study corridor, and the volumes and turning movements used to access this branch illustrate the importance and demands placed on this part of the NHFN. These vehicles are included in summary statistics as semi-trailers with other configurations.
The vehicle at the upper right in Figure 9 is a semi-trailer with the red hazard placard carrying auto fuel. These vehicles are prohibited from using the Tobin, Sumner, Callahan, or Ted Williams harbor crossings, and approximately 191 of these trucks use the study corridor at the Mystic River on a typical weekday. However, they are prohibited from crossing the Charles River at City Square into downtown Boston between the hours of 6:00 AM and 8:00 PM unless they have a destination within the Boston city limits. The three major gasoline truck flows—into or out of Boston in the daytime, into or out of Boston in the nighttime, and to or from someplace else—have never been counted despite ongoing operational and regulatory interest.
The three photos at the bottom of Figure 9 are heavy vehicle types associated with BS&G, one of the industrial operations with vehicular access connecting exclusively with the study corridor. BS&G is a major truck trip generator and the last remaining rail freight user near the study corridor. In addition, with only three major truck types, most of which use only one driveway to the BS&G facility, there is a unique opportunity to gather detailed data and more fully understand this vital industry. These vehicles are included in summary statistics as other configurations, either single-unit or semi-trailer.
Figure 9
Truck Types that were Specifically Counted
Source: Central Transportation Planning Staff.
The analysis of traffic flow in the study corridor begins at the corridor’s northern end, the Mystic River. Route 99 crosses the Mystic River on a recently refurbished bascule-type drawbridge that is opened for recreational and commercial harbor traffic. One hundred yards from the river’s edge both the northbound and southbound parts of Route 99 divide with part of the traffic using an underpass under Sullivan Square and the remaining traffic using roadways at the surface, allowing connections to several key travel corridors. Traffic using the underpass emerges on Rutherford Avenue near the Bunker Hill Community College.
This is one of the locations in this study where all traffic was counted and classified, and the results are shown in Table 1. These data were developed using manual counts over a number of sample counting periods. The sample structures and relationship of the counts to the requirements of travel demand model calibration are discussed in the Appendix.
Table 1 shows estimated numbers of vehicles by 11 vehicle types in four distinct traffic flows for a weekday in June 2019. The traffic flows presented are southbound traffic staying on the surface or entering the underpass, and northbound traffic approaching the Mystic River from the underpass or from the surface. The 11 vehicle types include automobiles, buses and vans, light four-wheeled commercial vehicles, and eight types of heavy vehicles that have six or more wheels.
The southbound traffic volume at the Mystic River, 23,204 vehicles, is 28 percent greater than the northbound volume. In 2015 the southbound volume was 42 percent greater than the northbound volume, a difference partly attributable at that time to the fact that tolls were only collected on the Tobin Bridge in the inbound direction and the use of Route 99 was the path of choice to avoid the one-way toll. Even without the one-way toll, travel in the southbound direction is more convenient for drivers than the northbound direction.
Of the 41,366 total vehicles crossing the Mystic River, there were 35,034 conventional automobiles, 84.7 percent of the total, including four-wheeled light vehicles such as taxis, car-service limos, and Uber or Lyft vehicles. If a car-type vehicle has stenciling on it indicating some type of non-passenger business, it is counted as a light commercial vehicle.
Table 1
WeekdayTraffic on Route 99 at the Mystic River by Type of Vehicle
| Travel Path | Vehicle Type | Two-way | Southbound | Northbound |
| All traffic | Total vehicles | 41,366 | 23,204 | 18,162 |
| All traffic | Automobiles | 35,034 | 19,606 | 15,428 |
| All traffic | Buses and vans | 725 | 496 | 229 |
| All traffic | Light commercial vehicles | 3,159 | 1,736 | 1,423 |
| All traffic | Box-type trucks–single | 412 | 205 | 207 |
| All traffic | Box-type trucks–semi | 97 | 69 | 28 |
| All traffic | Refrigerated trucks–single | 283 | 139 | 144 |
| All traffic | Refrigerated trucks–semi | 177 | 110 | 67 |
| All traffic | Other configurations–single | 754 | 412 | 342 |
| All traffic | Other configurations–semi | 483 | 275 | 208 |
| All traffic | Hazardous cargoes–single | 51 | 36 | 15 |
| All traffic | Hazardous cargoes–semi | 191 | 120 | 71 |
| Staying at surface | Total vehicles | 18,651 | 8,148 | 10,503 |
| Staying at surface | Automobiles | 14,972 | 6,417 | 8,555 |
| Staying at surface | Buses and vans | 585 | 407 | 178 |
| Staying at surface | Light commercial vehicles | 1,537 | 585 | 952 |
| Staying at surface | Box-type trucks–single | 260 | 105 | 155 |
| Staying at surface | Box-type trucks–semi | 54 | 31 | 23 |
| Staying at surface | Refrigerated trucks–single | 156 | 43 | 113 |
| Staying at surface | Refrigerated trucks–semi | 121 | 59 | 62 |
| Staying at surface | Other configurations–single | 405 | 196 | 209 |
| Staying at surface | Other configurations–semi | 319 | 149 | 170 |
| Staying at surface | Hazardous cargoes–single | 51 | 36 | 15 |
| Staying at surface | Hazardous cargoes–semi | 191 | 120 | 71 |
| Via underpass | Total vehicles | 22,715 | 15,056 | 7,659 |
| Via underpass | Automobiles | 20,062 | 13,189 | 6,873 |
| Via underpass | Buses and vans | 140 | 89 | 51 |
| Via underpass | Light commercial vehicles | 1,622 | 1,151 | 471 |
| Via underpass | Box-type trucks–single | 152 | 100 | 52 |
| Via underpass | Box-type trucks–semi | 43 | 38 | 5 |
| Via underpass | Refrigerated trucks–single | 127 | 96 | 31 |
| Via underpass | Refrigerated trucks–semi | 56 | 51 | 5 |
| Via underpass | Other configurations–single | 349 | 216 | 133 |
| Via underpass | Other configurations–semi | 164 | 126 | 38 |
| Via underpass | Hazardous cargoes–single | 0 | 0 | 0 |
| Via underpass | Hazardous cargoes–semi | 0 | 0 | 0 |
| Source: Central Transportation Planning Staff. | ||||
There were 725 buses and vans, 1.8 percent of the total. These include long-distance coach-type buses, transit-type buses, school buses, six-wheeled mini-buses, and four-wheeled vans configured with windows and row seating.
Light commercial vehicles are the second largest vehicle group after conventional automobiles, with 3,159 vehicles representing 7.6 percent of traffic. These vehicles have been modified in a way that indicates they are traveling for a business purpose.
Light commercial vehicles are an important class of vehicles in travel demand model development, and travel data on their movements is not readily available. These vehicles were not an explicit topic of this study, but data on them was collected where practicable and the use of these data to model development is discussed in the Appendix.
Table 1 lists eight different types of trucks, which together totaled 2,448 vehicles, 5.9 percent of total traffic. These groups were described in the previous section, and some subcategories of these eight groups that relate to specific industrial sites in the study corridor will be discussed in subsequent sections. The one common feature of these vehicles is that they all have six or more wheels, the smallest having the rear wheels doubled. (Buses usually have six or eight wheels, but are not included with trucks.)
At the Mystic River, trucks carrying hazardous cargoes represent 9.9 percent of total trucks and only 0.6 percent of total vehicles. As part of the Everett-Chelsea study cited above, similar vehicle classification counts were undertaken at the western ends of Second and Beacham Streets, the closest points in that study area to the Mystic River (see Figure 1).
Counts at those points found that trucks were 10.9 percent of total traffic and hazardous cargoes represented 19.1 percent of total trucks and 2.1 percent of total traffic. These percentages are significantly higher than the comparable percentages at the Mystic River in this study corridor. That study area was focused on the extensive terminal complexes serving industry in the Everett-Chelsea area. Most traffic in this study corridor is passing through and mixing with regional traffic. As a consequence, the percentages of vehicles serving identifiable local industries are comparatively small.
Analysis of total traffic crossing the Mystic River (Table 1) showed that a total of 2,448 trucks with six or more wheels entered or left the study corridor each day. These heavy vehicles were subdivided into eight different groups and the flows of these truck groups were measured individually at key locations in the study corridor. One of these key locations is Sullivan Square, immediately south of the Mystic River crossing.
Of the 2,448 trucks crossing the Mystic River, 891 use the tunnel under Sullivan Square, either going to or coming from the Rutherford Avenue section of the study corridor south of Sullivan Square. The other 1,557 trucks, 64 percent of the total, use the surface street system, either after crossing the Mystic River or northbound as they approach the river. Almost all the trucks that cross the Mystic River to or from the surface street system have entered or left the study corridor at Sullivan Square. The exception is hazardous cargoes, which are prohibited from using the underpass and must stay at the surface even if they are continuing along the study corridor.
Of the 1,557 trucks using the surface street system at the Mystic River, 739 are going south to Sullivan Square, and slightly more (818) are going north from Sullivan Square. The trucks approaching Sullivan Square leave Sullivan Square in three general directions:
The different types of trucks approaching Sullivan Square from the Mystic River tend to use different paths. The right turn that leads to I-93 north illustrates this. Of the trucks with hazardous cargo placards, 83 percent turn north towards the I‑93 entrance as they approach Sullivan Square, compared with only 71 percent of all trucks. This higher preference for this path for hazardous cargoes is the result of restrictions on these trucks at other study corridor connections, and these restrictions are discussed in a following section.
Refrigerated trucks also use the turn towards I-93, more than the 71 percent truck average. Much of the fruit and produce consumed in the region is distributed from the Everett-Chelsea area, and 76 percent of refrigerated trucks, most carrying fruit and produce, make this turn when they reach Sullivan Square.
Only slightly more than 60 percent of box-type trucks and the broad class of other trucks make the turn towards I-93. Some possible destinations of the other 40 percent of trucks include the Inner Belt industrial area in Somerville, and the Bunker Hill Industrial Park, Hood Dairy site, and other locations in Charlestown.
In the northbound direction at the Mystic River there are 818 trucks leaving the study corridor from the Sullivan Square surface roadway system. These trucks approached the Mystic River by four paths:
The northbound and southbound truck flows at the Mystic River are similar in magnitude, but the paths through the surface roadway system are not at all symmetrical. Trucks going towards the I-93 northbound entrance are 71 percent of southbound truck traffic, but trucks coming from the southbound I-93 exit to the Mystic River are only 30 percent of the northbound truck traffic at that point. The path from the Mystic River to I-93 is governed by a yield sign and one traffic signal in Somerville that does not experience queues. The reciprocal move from I-93 to the Mystic River requires waiting for multiple signal phases to pass through Sullivan Square during extended peak periods, and many truck operators appear to use alternate paths.
These estimated truck volumes also show a major imbalance of trucks traveling between Mystic River and the Cambridge Street corridor into Somerville and the Inner Belt industrial area. This analysis shows that 50 percent of northbound trucks at the Mystic River came from Cambridge Street but only 9 percent of southbound trucks at the Mystic River were going to Cambridge Street. The larger amount of trucks coming from Cambridge Street is due to the northbound I-93 exit ramp that meets Cambridge Street just west of Sullivan Square.
Only one truck type had more trucks approach the Mystic River from Maffa Way and southbound I-93 than from Cambridge Street. This was semi-trailers with other configurations, and included scrap metal carriers such as those shown in Figure 7. Metal scrap is collected for export throughout the region and much of it arrives at the Everett waterfront via southbound I-93 and Sullivan Square.
Traffic using the Sullivan Square underpass emerges onto Rutherford Avenue near the Bunker Hill Community College. This is the second location in this study where all traffic was counted and classified, and the results are shown in Table 2. The A Street entrance to the Bunker Hill Industrial Park from the surface section of Rutherford Avenue is just north of the merge with the southbound underpass, and turning movement counts between A Street and Rutherford Avenue also included light vehicles.
Table 2 shows estimated numbers of vehicles by 11 vehicle types in four distinct traffic flows for a weekday in June 2019. The traffic flows presented are southbound traffic on the surface or emerging from the Sullivan Square underpass, and northbound traffic approaching Sullivan Square at the surface and traffic entering the Sullivan Square underpass.
Table 2 shows 31 percent more total traffic at the Rutherford Avenue count locations than at the Mystic River: 53,985 vehicles as compared with 41,366 in Table 1. Traffic using the Sullivan Square underpass, 22,715 vehicles, is the same in both tables, so the entire volume difference is reflected in traffic at the surface, 31,270 vehicles as compared with 18,651 vehicles in Table 1.
This difference in total study corridor traffic between the north side of Sullivan Square and the south side is illustrated by the patterns of traffic connecting with I-93 at Sullivan Square via Maffa Way and Main Street/Mystic Street. A large amount of I-93 traffic connects with the study corridor at Sullivan Square, but more of this traffic uses the Rutherford Avenue section than the section crossing the Mystic River. The four major types of vehicles, conventional automobiles, buses, light commercial vehicles, and trucks with six or more wheels, all have higher counts south of Sullivan Square than at the Mystic River. However, I-93 feeds comparatively more conventional automobiles into the study corridor, and these make up 85.5 percent of total traffic at this point compared with 84.7 percent of traffic at the Mystic River.
As discussed above, Table 1 shows that there is 28 percent more traffic at the Mystic River traveling in the southbound direction than northbound. This imbalance is even greater in the Rutherford Avenue section with Table 2 showing 43 percent more southbound traffic. Most of this imbalance is concentrated in the underpass, where southbound traffic exceeds northbound traffic by 97 percent. The underpass traffic imbalance is even more pronounced for trucks and light commercial vehicles, with 1,778 using it daily in the southbound direction, compared with the 735 that use it in the northbound direction.
Much of the traffic direction imbalance in the underpass can be explained by the different locations of the I-93 ramps to and from the south. Northbound I-93 traffic can exit to Cambridge Street near Sullivan Square. The reverse move to I-93 southbound requires driving south all the way to City Square to reach the southbound I-93 on-ramp.
Table 2
WeekdayTraffic on Rutherford Avenue at A Street by Type of Vehicle
| Travel Path | Vehicle Type | Two-way | Southbound | Northbound |
| All traffic | Total vehicles | 53,985 | 31,773 | 22,212 |
| All traffic | Automobiles | 46,166 | 26,561 | 19,605 |
| All traffic | Buses and vans | 924 | 659 | 265 |
| All traffic | Light commercial vehicles | 3,949 | 2,616 | 1,333 |
| All traffic | Box-type trucks–single | 617 | 402 | 215 |
| All traffic | Box-type trucks–semi | 168 | 132 | 36 |
| All traffic | Refrigerated trucks–single | 244 | 158 | 86 |
| All traffic | Refrigerated trucks–semi | 101 | 76 | 25 |
| All traffic | Other configurations–single | 1,317 | 864 | 453 |
| All traffic | Other configurations–semi | 359 | 244 | 115 |
| All traffic | Hazardous cargoes–single | 59 | 20 | 39 |
| All traffic | Hazardous cargoes–semi | 81 | 41 | 40 |
| Staying at surface | Total vehicles | 31,270 | 16,717 | 14,553 |
| Staying at surface | Automobiles | 26,104 | 13,372 | 12,732 |
| Staying at surface | Buses and vans | 784 | 570 | 214 |
| Staying at surface | Light commercial vehicles | 2,327 | 1,465 | 862 |
| Staying at surface | Box-type trucks–single | 465 | 302 | 163 |
| Staying at surface | Box-type trucks–semi | 125 | 94 | 31 |
| Staying at surface | Refrigerated trucks–single | 117 | 62 | 55 |
| Staying at surface | Refrigerated trucks–semi | 45 | 25 | 20 |
| Staying at surface | Other configurations–single | 968 | 648 | 320 |
| Staying at surface | Other configurations–semi | 195 | 118 | 77 |
| Staying at surface | Hazardous cargoes–single | 59 | 20 | 39 |
| Staying at surface | Hazardous cargoes–semi | 81 | 41 | 40 |
| Via Sullivan Square underpass | Total vehicles | 22,715 | 15,056 | 7,659 |
| Via Sullivan Square underpass | Automobiles | 20,062 | 13,189 | 6,873 |
| Via Sullivan Square underpass | Buses and vans | 140 | 89 | 51 |
| Via Sullivan Square underpass | Light commercial vehicles | 1,622 | 1,151 | 471 |
| Via Sullivan Square underpass | Box-type trucks–single | 152 | 100 | 52 |
| Via Sullivan Square underpass | Box-type trucks–semi | 43 | 38 | 5 |
| Via Sullivan Square underpass | Refrigerated trucks–single | 127 | 96 | 31 |
| Via Sullivan Square underpass | Refrigerated trucks–semi | 56 | 51 | 5 |
| Via Sullivan Square underpass | Other configurations–single | 349 | 216 | 133 |
| Via Sullivan Square underpass | Other configurations–semi | 164 | 126 | 38 |
| Via Sullivan Square underpass | Hazardous cargoes–single | 0 | 0 | 0 |
| Via Sullivan Square underpass | Hazardous cargoes–semi | 0 | 0 | 0 |
| Source: Central Transportation Planning Staff. | ||||
Most traffic, both heavy and light vehicles, entering or leaving the Bunker Hill Industrial Park uses A Street. A Street meets the surface section of Rutherford Avenue just north of the merge with the Sullivan Square underpass where the counts shown in Table 2 were made. There are other, more circuitous access routes to this industrial park, but field observation suggested that A Street was the most used. There are also several commercial curb cuts along this section of Rutherford Avenue, mostly serving the emerging nonindustrial land uses, but traffic at these locations was outside the scope of this study.
Of the 16,717 vehicles traveling south on the surface section of Rutherford Avenue at this location, approximately 8 percent entered from A Street. All vehicles were counted at this location and automobiles entering at A Street made up 4.7 percent of the Rutherford Avenue traffic. The automobiles using A Street could be employees at the industrial sites or employees and customers at newer businesses such as the CubeSmart self-storage center.
Light commercial vehicles entering from the A Street were slightly overrepresented in the Rutherford Avenue traffic, making up slightly more than 10 percent of traffic. However, heavy vehicles with six or more tires entering Rutherford Avenue from A Street represented 26 percent of Rutherford Avenue truck traffic, with the remaining 74 percent coming from Sullivan Square or one of the Rutherford Avenue curb cuts.
The mix of truck types using A Street was similar to the mix using Rutherford Avenue in most respects. Approximately 3 percent of trucks on Rutherford Avenue exhibited hazardous cargo placards, as compared with less than 1 percent using A Street. Refrigerated trucks were overrepresented on A Street, and box-type trucks were underrepresented. These differences reflect the industries located at the Bunker Hill Industrial Park.
The Bunker Hill Industrial Park is less than 30 acres, has a small number of industrial tenants, but is served by a wide variety of truck types. One of the tenants is a fresh produce distributor served by the refrigerated vehicles shown in Figure 5. Fresh produce arrives at the distributor in large semi-trailers as shown in the lower image, and orders are distributed to customers in single-unit vehicles as in the upper image.
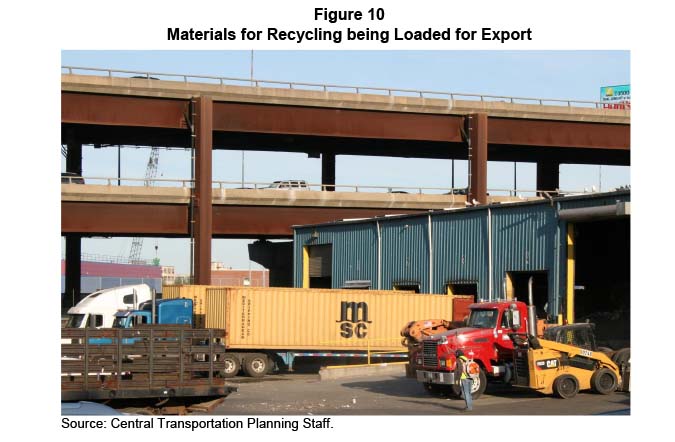
Other industrial tenants include a major refuse processing and recycling center and a contractor support depot. Specialized single-unit trucks serving these two industrial businesses are shown in the lower part of Figure 6. Refuse processing is an export industry, and Figure 10 shows an ocean shipping container being filled with bales of sorted recyclable materials at the Bunker Hill Industrial Park facility. This container will be taken to the Conley Container Terminal in the South Boston Waterfront and loaded onto a container ship for export.
Figure 10
Materials for Recycling being Loaded for Export
Source: Central Transportation Planning Staff.
Single-unit trucks involved in refuse processing and contractor support were all part of the other-configuration class, which altogether represented 62 percent of heavy vehicles using A Street. The specific breakdown between the refuse and contractor subgroups was not made at this location, but it was clear from casual inspection that refuse-related vehicles were by far the largest vehicle group. In addition, the box-type semi-trailers included a large number of ocean containers with refuse such as the one shown in Figure 10.
The fresh produce distributor generated fewer trips than its refuse industry neighbor did even though 11 percent of trucks leaving A Street were refrigerated compared with only 7 percent on Rutherford Avenue. Fresh refrigerated foods are high-value goods and refuse is the classic low-value good. The physical quantity of goods that must be moved and processed for a business to be viable is far greater for the refuse industry than for the food distribution industry.
The next major connection point south of Sullivan Square is the grade-separated intersection with Austin Street in Charlestown and the Gilmore Bridge approach that connects the study corridor with an NHFN section through Cambridge that ends at the I-90 ramps in Allston.
Approximately 3,100 heavy vehicles enter this intersection complex between 6:00 AM and 6:00 PM, the time period that was counted and that also experiences the most truck traffic. Approximately 43 percent of trucks use the underpass that allows Sullivan Square and the Bunker Hill Industrial Park traffic to avoid the signals controlling the Gilmore Bridge approach if they are going to or from the Tobin Bridge or a location requiring travel through City Square, the southern anchor of the study corridor.
Over this time period, more than 600 trucks, 20 percent of the total, are moving between the Gilmore Bridge and the northern part of the study corridor, and approximately 550 trucks, 18 percent, are moving between the Gilmore Bridge and the southern end of the study corridor. Truck movements over the Gilmore Bridge connecting to the two parts of the study corridor are roughly balanced by travel direction. In contrast, more than 900 trucks use the underpass in the southbound direction compared with only 400 in the northbound volume, reflecting the need of large numbers of trucks to reach the southbound entrance to I-93 at City Square.
Of the remaining 19 percent of trucks, 6 percent were entering or leaving Charlestown on Austin Street and 2 percent entered the intersection merely to use one of two U-turn loops. Connecting with the ramp between the Gilmore Bridge and southbound Rutherford Avenue is a roadway serving the Bunker Hill Community College student parking lot and also functioning as the main access road for BS&G, and 11 percent of trucks entering the intersection used the BS&G access road.
The familiar box-type truck made up 24 percent of heavy vehicles using this intersection, refrigerated trucks made up 6 percent, and trucks with hazardous cargo placards were 2 percent. The remaining 68 percent were all in the broad category of other trucks, which are closely associated with construction, maintenance, and building trades.
Counting heavy vehicles entering and leaving BS&G presented a unique opportunity. A count of the access road was necessary because the access road connects with a key access ramp of the grade-separated intersection at the Gilmore Bridge approach. But because BS&G uses a limited assortment of heavy vehicles, it was decided to count the vehicle types individually rather than as part of the heavy vehicle groups that have been used for other locations in the study area. The most important types of truck are shown in the lower three images in Figure 9.
The vehicle counts made at the BS&G access road during a set of weekday sample periods suggested that between 6:00 AM and 6:00 PM there were a total of 128 semi-trailer dump trucks, 33 single-unit dump trucks,149 cement mixer trucks, and 11 covered hoppers carrying Portland cement. A significant amount of truck movement takes place outside of the 12-hour daytime window. For example, the photo in Figure 9 of large dump trucks waiting to be loaded was taken prior to 6:00 AM.
BS&G is the last freight rail customer in Charlestown, and it takes delivery of the various commercial grades of sand and gravel by rail. These materials, often referred to as aggregates, are then sold to regional customers for various construction-related uses.
Some of the aggregates are used by BS&G to make ready-mix concrete, which is delivered to customers at pre-arranged times using the familiar rotating cement-mixer truck, the lower-right image in Figure 9. Ready-mix concrete uses sand, gravel, water, and Portland cement in specific proportions depending on the application. The Portland cement is delivered in covered hopper semi-trailers similar to the lower-left image in Figure 9. The fact that 11 covered hoppers and 149 cement mixer trucks served the BS&G location during the 12-hour period gives a cursory sense of how this ubiquitous building material comes into being.
It is often suggested that increasing the use of rail for freight might somehow reduce the number of trucks using state and regional roadways. BS&G illustrates that in many cases the opposite is true: with the expansion of rail-dependent industries, an increase in associated truck traffic should be anticipated.
At the southern end of the study corridor are several regional and local connections critical to the region’s heavy-vehicle traffic. These connections are at two at-grade signalized intersections. One thousand feet south of the Gilmore Bridge approach is a signalized T-type intersection connecting Rutherford Avenue with a pair of ramps leading to and from US Route 1, which crosses the Mystic River on the Tobin Bridge.
Between 6:00 AM and 6:00 PM more than 2,300 heavy vehicles approach this intersection from three directions, 59 percent from the north, 23 percent from the south, and 18 percent from the Tobin Bridge. The strong imbalance between the southbound and northbound flows is because of the large numbers of vehicles that will enter I-93 at City Square, the next intersection 800 feet to the south.
Truck traffic on the Tobin Bridge ramps is evenly divided between heavy vehicles going to Tobin Bridge and vehicles arriving from Tobin Bridge. At the intersection, Tobin Bridge truck traffic divides, approximately three-fourths of it going to and from the north, and one-fourth going to and from the south.
Of the heavy vehicles using this intersection, 64 percent are part of the broad category of other trucks, a smaller share than the 68 percent at the Gilmore Bridge approach. In contrast, refrigerated trucks are 10 percent of trucks on the Tobin Bridge, compared with only 6 percent at the Gilmore Bridge approach. This is because of the large concentration of food distributors on the north side of the Mystic River clustered near the Tobin Bridge ramps in Chelsea.
Hazardous cargoes are not permitted to be carried over the Tobin Bridge because the approaches to and from the bridge both pass through tunnels under City Square. During the 12-hour period discussed here, trucks with hazardous cargo placards are 3 percent of heavy vehicles on Rutherford Avenue at this intersection.
The study corridor ends at City Square in Charlestown. The study corridor makes three key connections at this point. First, traffic continuing south from Rutherford Avenue at City Square goes across Charlestown Bridge and enters downtown Boston via North Washington Street. To the west at City Square is an on-ramp leading to southbound I-93 through the Central Artery. This is the ramp that causes much of the directional imbalance on Rutherford Avenue. East of City Square is Chelsea Street, designated as part of the NHFN as an intermodal connector because it connects Massport’s Boston Autoport with I-93.
Heavy vehicles were counted at City Square during several nighttime one-hour intervals, and these counts were expanded to provide an estimate of truck traffic between 6:00 PM and 6:00 AM. Nighttime truck volumes were developed to better understand the movements of vehicles carrying hazardous cargoes because regulations of hazardous cargoes vary by time of day. Analysis of hazardous cargoes are included in the following section.
Over a 24-hour period, more than 2,400 heavy vehicles entered this intersection from three directions: 57 percent from the northern part of the study corridor, 28 percent from the Charlestown Bridge, and 15 percent from Chelsea Street. Between 6:00 AM and 6:00 PM, approximately 1,970 trucks entered the intersection, a number substantially less than the 2,300 trucks estimated to use the nearby intersection at the Tobin ramps over this daytime period. The higher number at the Tobin Bridge location is a consequence of the large number of trucks using Tobin Bridge that are turning to or from the north at that intersection.
The most important single move is the southbound right turn from the study corridor to the I-93 southbound on-ramp, with almost 28 percent of all heavy vehicles entering City Square making this one right turn, almost half of the heavy vehicles that approach City Square from the north. Excluding this one move, the flows of trucks into and out of City Square roughly balance: approximately 700 trucks enter and 700 exit from the northern part of the study corridor, approximately 700 enter and exit from the Charlestown Bridge, and approximately 350 enter and exit from Chelsea Street over a 24-hour period.
Approximately one-half of the trucks entering City Square from Chelsea Street are crossing the intersection and directly entering the southbound I-93 ramp. Truck traffic entering and leaving Chelsea Street divides roughly evenly between the study corridor and the Charlestown Bridge. Left turns from the Charlestown Bridge to the I-93 entrance ramp are not permitted.
A majority of trucks were in the broad category of other heavy vehicles, 56 percent, followed by 25 percent box-type trucks, and 14 percent refrigerated trucks. Trucks with hazardous cargo placards were 5 percent of trucks. Included here in other heavy vehicles are the large car-carrying semi-trailer configurations that serve the Boston Autoport via City Square and are shown in the upper-left corner of Figure 9. Large semi-trailer car carriers and all vehicles with hazardous cargo placards are analyzed in the next section.
The first concern specific to this corridor is why the study corridor was designated as a CUFC. Unlike the extensive Everett-Chelsea industrial area, whose industrial base is being improved and modernized, the industrial character of the study corridor is in transition.
Some industrial operations such as Boston Autoport, Lafarge Cement, and BS&G are unique because of access to deep water shipping and the national railroad system. Refuse processing and fresh produce distribution remain viable because of a central location. However, the large local food processors, Hood Dairy and the Schrafft Candy Company, have ceased operations, and the new uses of their massive facilities are mostly service-based, light industry, or research and development.
The major importance of the study corridor is not serving the remaining industries. Rather, it is providing key connections between groups of regional origins and destinations not well served by other parts of the roadway network. This study identifies four connectivity issues with respect to the study corridor:
Trucks with hazardous cargo placards are permitted to travel throughout the study corridor. While hazardous cargoes are not permitted in the Sullivan Square underpass, all study corridor destinations and connections can be reached using the surface roadways adjacent the underpass. However, there are hazardous cargo restrictions on some of the roadways that connect with the study corridor. These restrictions include the following:
On an average weekday, 116 trucks with hazardous cargo placards cross the Charlestown Bridge, with approximately the same number traveling in each direction. Of these 116 trucks, approximately 57 percent are semi-trailers used to carry fuel to service stations. Approximately one-quarter of these cross the Charlestown Bridge during the hours when hazardous cargoes are not generally permitted. Presumably, these trucks have a destination in Boston and the use of the Charlestown Bridge is permitted. Most of these large fuel trucks use the Charlestown Bridge at night during the unrestricted time window. These may either be passing through the downtown area and rejoining I-93 in the South Bay area, or they might be making a delivery at a Boston location and a nighttime window is convenient for both the shipper and receiver.
Approximately 43 percent of placarded trucks are single-unit vehicles of several configurations and uses. Two configurations, the single-unit tank truck and the flatbed, or stake truck, are shown in Figure 8. Sometimes a conventional box-type truck displays a placard if it has hazardous cargoes. Single-unit tank trucks are a familiar sight in residential neighborhoods where they deliver home heating oil. They are seen year-round at construction sites refueling heavy construction equipment that stays on-site for extended periods.
A variety of industrial gases, hazardous and otherwise, are transported in pressurized containers or insulated cryogenic containers. These can be secured on the bed of a stake truck or might be carried in a placarded box-type truck. These are delivered to a variety of customers often located at construction sites, laboratories, or hospitals. Some box-type trucks have red placards indicating bio-hazard, and these specialized truck services serve hospitals and clinics.
More than 80 percent of the placarded single-unit trucks cross the Charlestown Bridge during the day when hazardous cargoes are prohibited, presumably to make deliveries in Boston during business hours. The few single-unit trucks that crossed during unrestricted hours were mostly between 5:00 AM and 6:00 AM, a very active time window for local deliveries.
During daytime hours, most vehicles on the Charlestown Bridge are automobiles. Trucks make up only 4.7 percent of total traffic during the day, and hazardous cargoes are only 5.8 percent of trucks and only 0.27 percent of all traffic. At night there are fewer automobiles, and many fewer trucks. Trucks dip to 2.4 percent of traffic and hazardous cargoes rise to 16.3 percent of trucks as they take advantage of their authorized time window. But hazardous cargoes still make up only 0.39 percent of nighttime total traffic.
At the Mystic River, at the northern end of the study corridor, there are more trucks, more hazardous cargoes, and less time-of-day variation. Total heavy vehicles are approximately 5.9 percent of daily traffic compared with 3.7 percent on the Charlestown Bridge. Placarded trucks are approximately 10 percent of trucks compared with 8.7 percent on the Charlestown Bridge. Placarded trucks are approximately 0.6 percent of traffic during both day and night at the Mystic River, compared with 0.27 percent in the day and 0.39 percent at night at the Charlestown Bridge. Much of the heavy truck and hazardous cargo traffic at the Mystic River is connecting with I-93 to or from the north.
The study corridor provides a critical access route for some of the longest vehicles permitted on public roadways. The car carrier vehicle combination shown in the upper left of Figure 9 is 75 feet long. This photo with the vehicle empty illustrates how a vehicle of this size can fill an entire intersection. With its standard load of nine light vehicles, the car carrier is allowed to have three feet of overhang in the front (a transported car’s front bumper) and four feet of overhang in the rear, giving the fully loaded vehicle a total length of 82 feet.
During the counting period in late spring 2019, an estimated 113 large car carriers went through City Square. All of these vehicles were using Chelsea Street, divided roughly evenly between vehicles going to the Boston Autoport and coming from the terminal. Both empty and full car carriers were observed going to and coming from the Boston Autoport. Activity at the Boston Autoport tends to be higher at other parts of the year than in the late spring.
Only 35 percent of the car carriers travel through City Square in a straight line, such as the vehicle in Figure 9 that is going from Chelsea Street directly onto the I-93 southbound ramp. All other car carriers are turning, with traffic about evenly divided between using the Charlestown Bridge or Rutherford Avenue. Of the car carriers using Rutherford Avenue, approximately one-half are using the Tobin Bridge ramps.
There are other large vehicles for which the study corridor is either an appropriate or a necessary travel route. The excavator (shown on the bottom of Figure 7) being transported is not a heavy vehicle combination that appears frequently. However, it would be inappropriate for this to be transported on most other roads, even if it were technically legal.
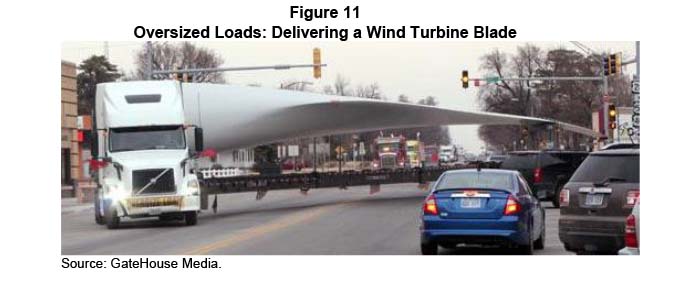
Finally, a second key industrial operation located at Boston Autoport that also depends on the study corridor is the Wind Technology Testing Center. New or modified wind turbine blade designs must undergo structural tests before the design can be placed in production. The testing center in the Boston Autoport complex receives a prototype turbine blade every few months for testing. After testing is complete, the blade leaves the testing center as scrap.
Turbine blades can be delivered to the testing center by water but most arrive by road. These are oversized loads and deliveries are made at night, approaching Boston on I-93 southbound, exiting at Sullivan Square, and traveling on the study corridor to City Square and then to the testing center via Chelsea Street. The turbines travel with a police escort that blocks traffic at intersections, and the turbine moves nonstop. The difficulty of moving cargo of this size can be seen in Figure 11, which shows a production turbine blade being delivered for installation at a location in Kansas.
Figure 11
Oversized Loads: Delivering a Wind Turbine Blade
Source: GateHouse Media.
The National Highway Freight Network (NHFN) was defined in consultation with states and MPOs. The Boston Region MPO designated CUFCs to tie together and supplement the interstate highways and intermodal connectors to create a coherent truck-oriented subset of regional road network. Trucks must operate throughout almost the entire roadway system, but the condition and operational efficiency of the NHFN is the starting point for understanding and strengthening the region’s freight corridors.
Different parts of the NHFN can have different freight-related functions: interstate highways, as their name implies, move freight long distances, and intermodal connectors serve other modes that have specific location requirements. The CUFCs also have different emphases. The CUFC elements in the Everett-Chelsea corridor carry truck traffic across an extensive complex of contiguous industrial areas.
Crossing the Mystic River, the CUFC leaves the extensive industrial district, and its roles on the south side are fundamentally different. In addition to serving Charlestown’s limited industry, the study corridor provides connectivity for accessing the Interstate Highway System, for trips between origins and destinations north of downtown Boston, and for hazardous cargo movements not permitted to use the harbor crossings. Even if industry in Charlestown were to contract further, regional truck traffic would continue to be significant and newer land uses in Charlestown could also generate significant truck traffic. Other arterial roadways that might accommodate this regional truck traffic may have drawbacks such as a more residential character or road geometry limitations.
However, it is not sufficient for the NHFN to appear as a coherent system on a map. It must also function efficiently as a roadway system suitable for large vehicles. Truck drivers do not choose to travel on NHFN roadways because they have this designation. These routes are chosen if they offer an appropriate level of service for heavy vehicles.
Parts of the study corridor, notably Sullivan Square and the Charlestown Bridge, are undergoing redesign and eventual reconstruction. The large numbers of light vehicles were analyzed selectively in this study, and they should realize substantial benefits from these ongoing efforts. It is important, however, that the geometry and traffic flow characteristics of these reconstructed roadway systems ensure that the study corridor remains the route of choice for trucks and large vehicles. It is also important that large vehicles can use the corridor without riding up onto curbs at redesigned intersections.
Trucks and working vehicles are necessary to support and facilitate a region’s population and economic activity. Trucks, working vehicles, and light commercial vehicles make up a substantial portion of traffic and the numbers of these vehicles are expected to grow along with population and economic growth. State and MPO planning envisions that key elements of the roadway network will be able to accommodate projected growth of this class of traffic, and national policy supports this planning through the designation of the NHFN. The study corridor described in this memorandum is an important part of this network, and current project planning anticipates that this role will continue.
1 Boston Region Metropolitan Planning Organization. Improving Truck Travel in the Everett-Chelsea Industrial Area, January 2016.