Medford Square Priority Roadways Improvement Study
Project Manager
Chen-Yuan Wang
Project Principal
Mark Abbott
Data Analysts
Chen-Yuan Wang
Benjamin Erban
Julian Chen
Graphics
Kenneth Dumas
Kim DeLauri
Cover Design
Kate Parker-O'Toole
The preparation of this document was supported
by the Federal Highway Administration through
MPO Planning Contract #101725 and MPO §5303 Contract #98873 and #102694.
Central Transportation Planning Staff
Directed by the Boston Region Metropolitan
Planning Organization. The MPO is composed of
state and regional agencies and authorities, and
local governments.
To request additional copies of this document or copies in an accessible format, contact:
Central Transportation Planning Staff
State Transportation Building
Ten Park Plaza, Suite 2150
Boston, Massachusetts 02116
(857) 702-3700
(617) 570-9192 (fax)
(617) 570-9193 (TTY)
Abstract
The Medford Square Priority Roadways Improvement Study is part of the MPO’s series of ongoing studies that address safety, mobility, and access on the Boston region’s priority roadways. This report identifies specific issues and concerns in the Medford Square study area; presents an in-depth analysis of multiple transportation-related factors; and recommends potential short- and long-term solutions to the problems, including improvement alternatives.
1.4 Study Area and Data Collection
1.5 Study Advisory Committee Meetings
Chapter 2—Existing Conditions and Issues
2.1 Major Roadways in the Study Area
2.3 Pedestrian and Bicycle Facilities
2.4.4 Pedestrian and Bicycle Accommodations
Chapter 3—Roadway Operations Analysis
3.2 Intersection Traffic, Pedestrian, And Bicycle Volumes
3.3 Intersection Capacity Analyses
3.4 Traffic Signal needs Analysis
4.1 Crash Locations And Crash Clusters
4.3 Pedestrian And Bicycle Crashes
4.4 Collision Diagrams And Crash Statistics
Chapter 5—Proposed Improvements
5.1 Salem Street and the Adjacent City Hall Subarea
5.1.2 Proposed Short-Term Improvements
5.1.3 Traffic Circulation Alternatives
5.1.4 Proposed Long-Term Improvements
5.2.2 Proposed Short-Term Improvements
5.2.3 Proposed Long-Term Improvements
5.3.2 Proposed Short-Term Improvements
5.3.3 Proposed Long-Term Improvements
5.4.2 Proposed Short-Term Improvements
5.4.3 Proposed Long-Term Improvements
5.5.2 Proposed Short-Term Improvements
5.5.3 Proposed Long-Term Improvements
5.6 Overview of Proposed Long-Term Improvements Under Projected 2040 Traffic Conditions
Chapter 6—Summary and Recommendations
TABLES, FIGURES, APPENDIXES
Tables:
Table 1. Intersection Capacity Analysis: AM Peak Hour, City Hall Subarea
Table 2. Intersection Capacity Analysis: PM Peak Hour, City Hall Subarea
Table 3. Intersection Capacity Analysis: AM Peak Hour, City Hall Subarea
Table 4. Intersection Capacity Analysis: PM Peak Hour. City Hall Subarea
Table 5. Intersection Capacity Analysis: AM Peak Hour Main Street at Route 16 Ramps
Table 6. Intersection Capacity Analysis: PM Peak Hour, Main Street at Route 16 Ramps
Table 7. Intersection Capacity Analysis: AM/PM Peak Hour, Main Street at Mystic Avenue
Table 9. Intersection Capacity Analysis: AM/PM Peak Hour, Winthrop Square
Table 10. Intersection Capacity Analysis: AM/PM Peak Hour, High Street at Governors Avenue
Figures:
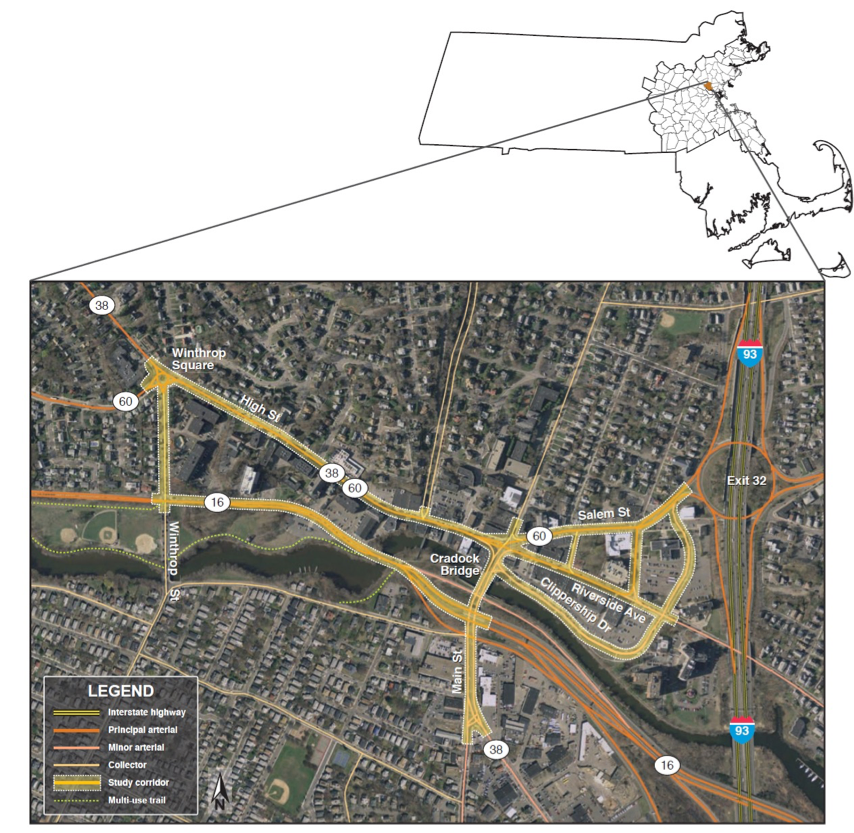
Figure 1. Study Area Map—Medford Square Priority Roadways Improvement Study
Figure 3. 2017 Daily Traffic Volumes—Medford Square Priority Roadways Improvement Study
A critical function of producing the Boston Region MPO’s Unified Planning Work Program each federal fiscal year is to seek feedback from local agencies, municipalities, the public, and other stakeholders. The purpose of this outreach is to gather information about specific transportation problems in the Boston region so that projects may be developed to address them, while advancing the transportation system as a whole.
Typically, the research supported by the Boston Region MPO reveals problems that involve bicyclists, pedestrians, traffic congestion, and roadway safety, among others. Concerns exist in virtually all areas of the Boston region, and at all types of locations, including intersections, underpasses, curbsides, street corners, bridges, roundabouts, highways, and parks. Although individual in nature, these issues expose recurring themes in the region, such as high-crash locations, the need for signal retiming for pedestrians, and safe lanes for bicyclists.
The MPO’s series of Subregional Priority Roadways studies grew out of the information-gathering process cited above. These studies aim to identify safety, mobility, access, and other transportation-related concerns on a specific area’s priority roadways; and to recommend and evaluate potential multimodal solutions to the problems. Each year, the Boston Region MPO chooses a different arterial or collector roadway network for MPO staff to study and analyze, which results in recommendations for short- and long-term improvements for that area.
This report focuses on Medford Square. Selecting a study area in the Boston region is a thorough and exacting process, which is based upon many factors (described in the report). In any large metropolitan region, there are many roadways that need improvement, so it can be a challenge to single out just one. However, because the MPO’s Subregional Priority Roadways program is ongoing, the MPO staff can address each problem area methodically, and according to priority and regional needs.
In this report, the reader will encounter myriad descriptive details about the Medford Square study area, including existing conditions, analytic data, and proposed improvements. As with each Priority Roadways study area, this report provides a detailed view of the transportation issues in Medford Square. As distinctive as these issues are to this particular neighborhood, these kinds of issues are also seen in other communities across the region. By addressing these problems systematically, the resulting improvements will help to enhance quality of life, support economic development, and improve air quality.
During development of the Unified Planning Work Program (UPWP) and the Long-Range Transportation Plan (LRTP), the Boston Region Metropolitan Planning Organization (MPO) gathers feedback from the public, municipalities, the Metropolitan Area Planning Council (MAPC) subregional groups, and the Massachusetts Department of Transportation (MassDOT) to identify transportation problems in the region. In general, these problems involve bicycle and pedestrian accommodation, freight movement, traffic bottlenecks, safety of roadway users, and safe or convenient access for abutters along roadway corridors—problems that can adversely affect the region’s quality of life, economic development, and air quality.
Each year, the MPO conducts a study—Addressing Safety, Mobility, and Access on Subregional Priority Roadways—to identify roadway segments in the Boston region that are of concern to stakeholders, but which have not been cited in the LRTP regional needs assessment.1 The Subregional Priority Roadways studies focus on arterial or collector roadways and result in recommendations for short- and long-term improvements. Funding for the Medford Square Priority Roadways Improvement Study was documented in the federal fiscal year (FFY) 2018 UPWP; and a work program was approved by the MPO on October 19, 2017. 2
The Medford Square Priority Roadways Improvement Study focused on safety, mobility, and access, as well as specific concerns related to bicycle and pedestrian transportation, multi-use trail feasibility, and other subjects raised by stakeholders. Objectives are to
The MPO selected Medford Square by assessing 25 roadway corridors in the Boston region that were identified as having strong potential for study by various sources including 1) suggestions heard during outreach for the FFY 2018 UPWP; 2) concerns documented in meeting records from the UPWP outreach process for the past five years; and 3) the MPO’s Congestion Management Process (CMP). MPO staff assembled detailed data about these roadways and evaluated them according to the following selection criteria:
Medford Square contains several high-crash locations that must be improved for the safety and mobility of motor-vehicle and truck drivers, transit riders, bicyclists, and pedestrians. Major roadways in the square carry regional and local traffic, pedestrians, cyclists, and several Massachusetts Bay Transportation Authority (MBTA) bus lines. The City of Medford and MAPC recently completed a comprehensive plan for the area: Medford Square Master Plan. This study would support the plan’s goals by analyzing existing transportation conditions and identifying potential improvements and was strongly endorsed by all stakeholders, including the City of Medford, MAPC, and MassDOT.
The study covers the area similar to the Medford Square Master Plan prepared by MAPC in August 2017 (with the addition of adjacent Winthrop Street), and focuses on major roadways, such as Salem Street (Route 60), High Street (Route 60/38), Main Street (Route 38), and Mystic Valley Parkway (Route 16). Figure 1 shows the study area and the covered roadway segments, which in aggregate are more than two miles long.
At the request of MPO staff, MassDOT collected traffic volume data and intersection turning-movement counts (including pedestrian and bicycle movements and the percentage of heavy vehicles) for this study. The data were collected in winter 2017, between December 4 and December 9, on both weekend and weekdays. MPO staff also collected information from Medford, MAPC, and MassDOT, including recent transportation, city planning, land-use, and economic studies, and the most recent three-year police crash reports.
During the course of the study, MPO staff worked closely with an advisory group whose members included representatives of the City of Medford, MAPC, MassDOT, and the Massachusetts Department of Conservation and Recreation (DCR). (See Appendix A for a complete list of advisory committee members.) Two advisory committee meetings were held to guide and support the study.
In the first meeting (February 12, 2018), MPO staff introduced the study, received input about the corridor’s issues and concerns, and coordinated data collection. In the second meeting (June 19, 2018), MPO staff reviewed the findings and the proposed improvements with advisory committee members. After the meetings, staff received comments and revised the proposed improvements accordingly.
1 A work program for Priority Corridors for LRTP Needs Assessment—FFY 2018 was submitted simultaneously to the Boston Region MPO.
2 Unified Planning Work Program, Federal Fiscal Year 2018, endorsed by the Boston Region Metropolitan Planning Organization on June 15, 2017.
3 Details of the criteria and rating system may be found in the Central Transportation Planning Staff’s technical memorandum “FFY 2018 Addressing Safety, Mobility, and Access on Subregional Priority Roadways: Selection of Study Location,” January 18, 2018.
Chapter 2—Existing Conditions and Issues
As shown in Figure 1, the study area contains five major roadway segments comprising approximately 2.4 total miles:
The roadway functional classes within the study area include principal arterials (Route 60 and Route 16), minor arterials (Main Street and Clippership Drive), and collectors (Winthrop Street and River Street). All segments are under the jurisdiction of the City of Medford, except Mystic Valley Parkway, which is owned and operated by MassDOT and DCR.
All segments are two-lane roadways except Route 60 (Salem Street and Riverside Avenue), Main Street, and Clippership Drive. At Medford Square, the eastern section of Route 60 divides into Salem Street (westbound, three-lane) and Riverside Avenue (eastbound, two-lane). It rejoins Salem Street through City Hall Mall and continues as a four-lane undivided arterial eastbound. Main Street in the study area also is a four-lane arterial. Clippership Drive is a service road for local businesses and residents and a bypass to Interstate-93 (I-93). It mainly operates as one lane eastbound only.
The average daily traffic volumes range from about 5,000 vehicles per day on Clippership Drive to nearly 30,000 vehicles per day on Salem Street near I-93. Speed limits are 20 miles per hour (mph) on Route 60 and Clippership Drive, 25 mph on Main Street and Winthrop Street, and 30 mph on Mystic Valley Parkway.
Land use within the study area is diverse and includes residential (private residences on High Street and Winthrop Street, condominiums north of Mystic Valley Parkway), commercial (Salem Street and Main Street), municipal (Medford City Hall and Medford Public Library), religious (Grace Episcopal Church and St. Joseph’s Church), and parkland (near Mystic River). Zoning is mostly business or residential, with riverside areas zoned recreational.
Figure 2 shows the transit services that intersect the study region. Medford Square is served by eight MBTA bus routes: 94, 95, 96, 101, 134, 325/326, 354, and 710; and all eight have a stop near the central intersection area. There is no rail access in the study area but several of the routes provide service to MBTA rail (rapid transit) stations. The Route 325/326 bus also provides express service to Haymarket via I-93. Route 101 has the most ridership among routes and connects the Malden Center Orange Line Station with the Sullivan Square Orange Line Station via Medford Square.
Aside from the Route 325/326 express bus, Medford Square is not the terminal destination for any of the bus routes that travel through the square. The pass-through nature of the routes would make it difficult to consolidate Medford Square bus stops in a central location or to create a transit hub for bus transfers. It may be easier to construct these types of improvements at terminal stations because of the flexibility of local routing and potential schedule adjustments that a location at the end of a route can provide.
Figure 2 also shows the location of bicycle and pedestrian amenities inside the Medford Square area. Sidewalks exist on both sides of all the study roadways except on the south side of Mystic Valley Parkway and Salem Street between City Hall Mall and the I-93 Rotary.
There are no dedicated bike lanes and most striped shoulders are less than two feet wide. There is, however, a multi-use trail (the Mystic River Reservation Path) that runs along the river. This trail currently ends at Main Street, but there are two plans to continue it eastward to connect to the Mystic Greenways system. The Clippership Connector Multi-Use Path, currently under design, would soon link Medford Square to Wellington Square and east. The South Medford Connector, currently under study, would connect Medford Square to Somerville and Boston.
In the sections that follow, we categorize and summarize the numerous issues and concerns in the study area, as based on discussions with the study advisory committee members.
Congestion issues routinely emerge at several locations within the study area, each with distinct causes.
While many of these problems are simply consequences of regional demand exceeding capacity, poor design of existing facilities is often a contributing factor; so, this study will review any modifications that could improve conditions.
Trucks are prohibited from using Route 16 (Mystic Valley Parkway), as it is designated as a parkway. Hence, truck traffic is diverted onto Route 60 (Salem Street/High Street), South Street, and other local streets. Salem Street and High Street are narrow and ill equipped to handle truck traffic; Medford frequently receives complaints of truck traffic and noise from the area of South Street.
All of the major intersections—including Route 60/Main Street/Forest Street, Route 16/Main Street, Route 60/Route 38, Main Street/Mystic Avenue—are in the top-five percent of crash locations in the Boston Region MPO area. Vehicles on the flashing-red approaches—such as Main Street northbound at Mystic Avenue and Route 16 eastbound/South Street at Main Street—endure extensive delays and frequently dart into the intersection without waiting for sufficient gaps.
The wide Salem Street Rotary at I-93 Exit 32 encourages fast-moving traffic. Here, vehicles merge and weave at high speeds, causing collisions and endangering pedestrians and cyclists. However, this rotary was not included in the study area because of limited resources.
Figure 2 shows sidewalk coverage in the study area. There are two gaps in the sidewalk network: Mystic Valley Parkway on its south edge between Winthrop Street and the Mystic River Bridge, and Salem Street on its south edge between City Hall Mall and the rotary.
Figure 2 also displays marked crosswalks in the study area, many of which are hard to cross and unsafe, including Salem Street at River Street/Ashland Street (Medford recently installed a flashing warning beacon on Salem Street for approaching vehicles); Salem Street at Main Street; Main Street at the Route 16 ramps; High Street at Governors Avenue; City Library; and Saint Joseph Church. Crossings at the Route 60/Route 38 traffic circle are also long and difficult.
Bicycle facilities are extremely sparse within the study region. No separate bicycle accommodations are present on any of the major roadways in the study area except for Clippership Drive, which was recently reduced to one lane and given a five-foot bicycle shoulder. North of Route 16, cyclists usually need to ride with traffic on High Street and local streets. There are no shared road signage or sharrow markings (sharrows) on these roadways. South of Route 16, cyclists can use the Mystic River Reservation multi-use trial. Although there are plans for the trail to continue east beyond I-93, it currently ends at Main Street, so cyclists need to ride with traffic beyond this point.
Medford is interested in potentially freeing space on the south bank of the Mystic River for recreational use by cyclists and pedestrians. The Route 16 eastbound off-ramp to Main Street is currently closed because of reconstruction on the Cradock Bridge. The City is proposing to close the ramp permanently in order to reduce traffic on Main Street and make room for continuing the Mystic River multi-use trial and a linear river park.
The study area hosts eight bus lines and 22 bus stops, some of which have been cited for causing traffic delays or overlapping a nearby stop. So, the circulation routes and stop locations may be examined for potential consolidation.
It is desirable to have a centrally located transit hub for all of the bus routes to use as a layover. Currently, the MBTA uses a city-owned parking lot for this purpose for a few bus routes. But Medford does not favor this location because it is a bit far from residential and business districts, and usurps the city’s parking spaces. The city suggested performing further studies of a suitable location that can include more bus routes serving the area.
Chapter 3—Roadway Operations Analysis
Daily traffic volumes are the fundamental metric for analyzing traffic intensity and patterns in a roadway corridor. MassDOT conducted Automatic Traffic Recorder (ATR) traffic counts at a number of locations in the subarea and on adjacent streets during the weekday period of December 4 (Monday) to December 7 (Thursday), 2017. Figure 3 shows daily traffic volumes at these locations. The numbers in the graphic represent average daily directional volumes collected in December 2017. The three tables in the graphic further summarize the data by count locations, directional split, combined volume of both directions, and adjusted annual average daily traffic (AADT).
The December counts show that the subarea witnessed a high volume of daily traffic. The primary direction of travel through the subarea was east-west, with the two major routes (Route 60 and Route 16) each recording large traffic volumes. Route 16 carried 29,000 vehicles per day west of Winthrop Street and 41,000 vehicles per day east of Winthrop Street; Route 60 carried 13,000 vehicles per day west of Main Street (on High Street) and 22,000 vehicles east of Main Street (on Salem Street and Riverside Avenue). North-south traffic also saw relatively large traffic volumes, particularly along Main Street, which carried almost 36,000 vehicles per day before splitting with Mystic Avenue.
In addition to daily traffic counts, MassDOT collected turning-movement counts at major intersections in the study corridor, including vehicle movements (by vehicle types), bicycle movements, and pedestrian crossings. These data were collected for weekday traffic during the morning peak period (7:00 AM–10:00 AM) and the evening peak period (3:00 PM–6:00 PM) on Thursday, December 7, 2017. Figure 4 shows the weekday peak-hour traffic and pedestrian volumes at major intersections in the subarea. MPO staff selected 7:00 AM–8:00 AM and 5:00 PM–6:00 PM as the morning and evening peak hours because these were the periods when total volume observed across the subarea was highest.
Weekend turning-movement counts were also conducted during the midday peak period (11:00 AM–2:00 PM) on Saturday, December 9, 2017. Figure 5 shows the weekend peak-hour traffic and pedestrian volumes at major intersections in the subarea. The Saturday peak hour was between 11:15 AM and 12:15 PM, during which the overall volume was about 15 percent and 25 percent less than the weekday morning and evening peak periods, respectively.
Staff used turning-movement counts to estimate pedestrian activity in the study area. The central intersection (Salem/High Street at Main Street/Forest Street) recorded the most pedestrian crossings, with 130 in the morning peak hour and more than 200 in both the evening and weekend peak hours (although this figure counts pedestrians multiple times as they cross different approaches). Staff observed more than 100 crossings during the Saturday peak at Governors Avenue, Ashland Street, and Clippership Drive at Riverside Avenue. However, snowfall in the study area during the Saturday counts may have depressed pedestrian volumes somewhat. In addition, pedestrian volumes likely could be much higher in the summer season than were reported in these counts.
Turning-movement counts also provided a snapshot of bicycle activities in the study area. Figure 6 summarizes the observed on-road bicycle volumes during each three-hour recording interval. On these days, the primary route of cyclist travel was southbound along Main Street, with 25 individuals observed during the morning peak period. Bicycle volumes are heavily affected by seasonal factors; and although it is difficult to predict the exact number that would be present during warmer months, overall usage patterns likely would be similar. We assume, however, that bicycle volumes in the summer are generally higher.
Addressing issues caused by truck traffic was one of the objectives of this study. Because 24-hour classification data from the ATR counts were not available for this study area, staff used turning-movement count data to estimate the percentage of heavy vehicles (trucks and buses, mostly trucks) during the three-hour recording intervals.
Figure 7 shows the percentage of heavy vehicle observed based on turning-movement counts. The counts show high truck volumes traveling east-west using High Street, Salem Street, Riverside Avenue, and ranging from about 6-to-10 percent of total traffic in the morning peak period. In the evening peak period, these roadways carried about 2-to-5 percent of the total traffic’s heavy vehicles.
Because trucks often schedule their travel outside of peak hours, the off-peak percentages probably are about the same or higher than in the morning period. This observation aligns with complaints from residents, and in many ways is an expected consequence of banning trucks from the major east-west corridor: Mystic Valley Parkway (Route 16).
Based on the turning-movement counts, MPO staff constructed peak-hour traffic models for the entire subarea and conducted capacity analyses for major intersections by using the Synchro traffic analysis and simulation program. 4 The model set consisted of weekday AM, weekday PM, and Saturday midday peak-hour models, with scenarios that assumed existing conditions and various proposed improvement alternatives.
Capacity analysis for intersections was determined based on criteria from the Highway Capacity Manual (HCM).5 The HCM defines level of service (LOS) using a qualitative scale from A to F for signalized and unsignalized intersections as a function of the average vehicle control delay.6 For the intersections in a metropolitan urban area, LOS A, B, and C are considered desirable; LOS D and E are considered acceptable; and LOS F is considered undesirable.
Figure 8 shows results of weekday AM and PM peak-hour capacity analyses for existing conditions at major intersections in the study area. The signalized intersections in the City Hall subarea generally operate between LOS C and LOS D during weekday peak hours. More severe problems are observed on Winthrop Street, where the two intersections (at High Street and at Mystic Valley Parkway) operate at LOS F or E (almost F) during the AM and PM peak hours with extensive delays.
The unsignalized intersections on Main Street are evaluated as LOS F with extensive delays on the stop-controlled approaches (on South Street and on Main Street northbound). The two intersections are equipped with signal heads under flashing red and flashing yellow operation. The outdated signal equipment should be considered for upgrading.
Figure 9 shows results of the Saturday peak-hour capacity analyses at major intersections in the study area. Some of the same problems (such as extensive delays along Winthrop Street and LOS F at unsignalized approaches) may be seen from the PM peak hour analyses, although to a lesser degree because of the smaller Saturday traffic volumes.
Detailed Synchro reports of the existing AM and PM peak hour capacity analyses for major intersections in the study area are included in Appendix B.
MPO staff conducted preliminary analyses of the need for traffic signals at the four unsignalized intersections in the study area that experience operational issues: Main Street at the Route 16 eastbound ramps, Main Street at Mystic Avenue, Winthrop Street at High Street, and High Street at Governors Avenue.
The analysis found that that all four intersections satisfied at least one signal warrant. Main Street at the Route 16 eastbound ramps, Main Street at Mystic Avenue, and Winthrop Street at High Street each satisfied Warrant 1 (eight-hour vehicular volume), Warrant 2 (four hour vehicular volume), Warrant 3 (peak hour vehicular volume), and Warrant 7 (crash history); and High Street at Governors Avenue satisfied Warrants 2 and 3.
Appendix C contains the preliminary analysis of hourly traffic volume breakdowns for each of the applicable signal warrants at these intersections.
4 Synchro Version 9.2 was used for the analyses. This software is developed and distributed by Trafficware Ltd. It can perform capacity analysis and traffic simulation (when combined with SimTraffic) for an individual intersection or a series of intersections in a roadway network.
5 Highway Capacity Manual 2010, Transportation Research Board of the National Academies, Washington D.C.
6 Control delay quantifies the increase in travel time that a vehicle experiences due to a traffic signal or other type of control. It also provides a surrogate measure for driver discomfort and fuel consumption.
Crash data are an essential resource for identifying safety and operational problems. Analyzing data on the number of crashes and types of collisions that occur at particular locations, and the circumstances under which crashes occur, such as time of day and roadway surface conditions, also helps in developing improvement strategies. For this study, MPO staff collected two datasets:
Staff used the MassDOT data to examine and identify high-crash locations. Staff used police crash reports to construct collision diagrams and estimate crash rates in order to identify safety and operational problems at the major intersections and in different segments of the corridor.
Figure 10 shows the crash locations and crash clusters in the corridor, based on 2013–2015 MassDOT data.7 The figure shows that crash clusters are present throughout the entire study area. Six of the clusters are ranked in the top-five percent crash locations in the Boston Region MPO area according to the Equivalent Property Damage Only (EPDO) 8 scale. These clusters (cited below) are eligible to receive funding through MassDOT’s Highway Safety Improvement Program (HSIP):
Crash rate is another essential safety metric. Based on the recent traffic and turning-movement counts, MPO staff estimated both corridor (segment) and intersection crash rates for the major crash locations in the study area. For the corridor crash rate analysis, MPO staff focused on the three high-crash segments cited below:
All three segments had crash rates well above the Massachusetts average for roadways with the same functional class. Based on 2016 MassDOT crash data (queried on June 22, 2018), the statewide average is 3.49 crashes per MVMT for urban principal arterials (applicable to the Route 60 segments); and 3.80 crashes per MVMT for urban minor arterials (applicable to the Main Street segment). Appendix D contains the MassDOT crash rate worksheets, which show full calculations for these three roadway segments. MPO staff also performed crash rate analysis for seven high-crash intersections, two signalized and five unsignalized, in the study area.
The average crash rate for signalized intersections in MassDOT District 4 is 0.73 crashes per MEV (updated June 2018, based on 2016 crash data). Both the signalized intersections had a crash rate higher than the district average.
The average crash rate for unsignalized intersections in MassDOT District 4 is 0.57 crashes per MEV. The crash rates on Main Street at Route 16 Westbound Ramps, Main Street at Mystic Avenue, and High Street at Winthrop Street are all much higher than the District 4 average. The crash rate on Main Street at Route 16 Eastbound Ramps is the only location whose crash rate was lower than the District 4 average. This might be an underestimation however, as the Route 16 off-ramp at the intersection had been closed since July 2015 (because of the Cradock Bridge reconstruction). Appendix E provides the crash rate worksheets showing full calculations for the seven intersections.
The study area may be regarded as a high-crash area for pedestrians and bicycles. Twelve crashes, nine involving pedestrians, and three involving cyclists, were recorded in the Medford police 2015–2017 crash data. The majority of the crashes were caused by a vehicle failing to yield to a pedestrian in a marked crosswalk or failing to yield to bicycle while making turns. Appendix F summarizes the location, date, time, severity, and brief description for each of the twelve crashes.
To investigate safety and operational problems further, MPO staff constructed collision diagrams for the entire study area based on the 2015–2017 Medford Police Department crash reports. These reports contain descriptions of how and where the crashes occurred, so useful in constructing collision diagrams.
Appendix G presents the collision diagrams for various locations in the study area. It also contains a series of tables summarizing the crash data used for each location. The summary statistics include crash severity (property damage only, non-fatal injury, fatality, or unknown), collision type (single-vehicle, rear-end, angle, sideswipe, head-on, rear-to-rear, or unknown), pedestrian or bicycle involvement, time of day, pavement conditions, and light conditions.
Collision diagrams are useful in identifying safety and operational problems at major intersections or roadway segments. In the next chapter, we discuss these problems in the context of their proposed improvements.
7 A crash cluster is identified by mapping a circle with a 25-meter (82-foot) radius from each crash location, and observing where the spheres of two or more crashes overlap.
8 MassDOT uses EDPO index to rank crash clusters. In the estimation, fatal crashes are weighted by 10, injury crashes by 5, and property damage only and unknown crashes not weighted. The top-five percent clusters in each regional planning agency are HSIP eligible. Based on 2013–2015 MassDOT data, the top-five percent EPDO threshold is 41 for the Boston Region MPO crash clusters.
Chapter 5—Proposed Improvements
Based on the analyses in the previous chapters, MPO staff developed a series of short- and long-term improvements to address safety and operational problems on the roadways in this study. Staff presented the proposed improvements to the study advisory members on June 19 and revised them to address their comments (contained in Appendix H).
The proposed short-term improvements generally can be implemented within two years at a relatively low cost. The long-term improvements are more complicated and cover larger areas, thus require intensive planning and design, and significant funding. The proposed improvements are described below.
The City Hall subarea is similar to the Medford Square Master Plan. It includes Salem Street, Main Street (until Cradock Bridge), Riverside Avenue, and Clippership Drive, with Salem Street as the mainstay of the area.
One major issue raised in the Master Plan is the circuitous traffic pattern and uneven traffic distribution in the subarea based on the one-way traffic operation on Salem Street, Riverside Avenue, and Clippership Drive. The plan suggested exploring the two-way operation potential of these streets while recognizing that they could create complicated traffic crossing patterns and negatively affect the central intersection (Salem Street/High Street at Main Street/Forest Street and Riverside Avenue). This study developed and evaluated four traffic circulation alternatives that aim to reduce circuitous traffic and maintain acceptable traffic operations at the central intersection, as discussed in Section 5.1.3.
Based on the suggestion of the Medford Square Master Plan, this study developed and evaluated four traffic circulation alternatives that aim to reduce circuitous traffic in the City Hall subarea, and to maintain acceptable traffic operations at the central intersection. Figures 11 and 12 show the conceptual diagrams of the four alternatives.
Alternative 1 maintains the existing traffic flow pattern and focuses on the improvements at the central intersection. Key proposed changes include
The intersection modification can be accomplished using the existing intersection layout.
The objective of Alternative 2 is to test whether the intersection would still operate acceptably if the connected one-way streets were converted to two-way operation and all entry movements were allowed. Key elements include
The intersection modification would require removing the traffic island on Forest Street and expanding the intersection (beyond the existing layout) to accommodate additional turning lanes. However, the AM and PM peak hour capacity analysis indicates that the intersection would deteriorate significantly under such a five-approach setting with high traffic volumes on almost all the approaches.
Alternative 3 is a variation of Alternative 2, intended to reduce crossing traffic by prohibiting some movements. Key elements include
Though not as extensive as Alternative 2, Alternative 3 would still require expanding the intersection. Further, the capacity analysis for Alternative 3 indicates that the intersection would not operate at acceptable LOS in the AM and PM peak hours.
Alternative 4 calls for operating the central intersection similar to a regular four-way intersection by maintaining Riverside Avenue as one-way eastbound only and diverting traffic through Clippership Drive. Key elements include
Although the capacity analyses indicate that, under Alternative 4, the central intersection would operate better than Alternative 2 in the AM and PM peak hours, it still would operate at unacceptable LOS. In general, Alternatives 2, 3, and 4 would reduce circuitous traffic in the subarea, but increase crossing movements at the central intersection. (Please see Appendix J to view the 2040 AM and PM peak hour projected traffic volumes using the four alternatives.)
Staff estimated the 2040 traffic volumes under the different alternatives via three steps. First, the study assumed the No-Build scenario based on completion of the Cradock Bridge project and reopening of the Route 16 westbound off-ramp to Main Street.10 Second, staff developed a model to estimate traffic flows in the subarea for the four alternatives.11 Third, staff projected the 2040 traffic volumes for the alternatives by using growth factors estimated from the MPO’s transportation model.12
The above analyses indicate that only Alternative 1 in the City Hall Subarea would operate acceptably under the projected 2040 traffic conditions. However, these are preliminary planning analyses and further modifications and examination of Alternatives 3 and 4 should be conducted in order to propose substantial redevelopments for the City Hall subarea. Based on the framework of Alternative 1, this study proposes a number of long-term improvements at the following two locations:
Figure 13 shows the proposed long-term improvements at the central intersection, which include
Staff also briefly examined the potential for a modern roundabout at this location, and determined that it is not feasible. The high traffic volume at this location would require a two-lane roundabout, and the existing intersection layout does not provide adequate space for this, which requires an inscribed 180-foot-diameter circle in order to accommodate prevailing truck traffic.14
The signal system at this intersection should be upgraded to a fully actuated traffic signal with emergency vehicle preemption capabilities. Furthermore, the signal should be designed to coordinate with the central intersection and adapt to traffic conditions at the Salem Street Rotary and I-93 southbound off-ramp.
Roadways in this subarea generally have limited right-of-way for adding bicycle lanes. However, there is the potential to replace existing on-street parking lanes on the north side of Salem Street and the south side of Riverside Avenue with separated bicycle lanes, which would improve the safety of cyclists and support the MassDOT Healthy Transportation Policy. Further studies should be conducted to examine the feasibility of this, including any potential impact that reduced parking could have on the adjacent businesses.
This section covers the Main Street corridor from Cradock Bridge to Mystic Avenue, whose two most concerning intersections are Main Street at Route 16 Ramps and Main Street at Mystic Avenue.
In the long term, both the intersections of Main Street at Route 16 Ramps and Main Street at Mystic Avenue should be signalized and reconstructed.
Staff developed the following four long-term improvement alternatives based on the suggestions from study advisory members:
Tables 5 and 6 summarize AM and PM peak hour capacity analysis results for the No-Build17 and the above alternatives under the projected 2040 traffic conditions. Appendix L presents 2040 AM and PM peak hour traffic projections; and Appendix M provides detailed Synchro capacity analysis reports for the various alternatives.
In general, Alternatives 1A, 1B, 2, and 3 would operate acceptably in the AM and PM peak hours under the projected 2040 traffic conditions. Alternatives 1A and 1B would significantly reduce delays on the Route 16 ramps and consequently improve the overall intersection operation and safety.
Alternative 2, closing the Route 16 westbound off-ramp to Main Street, would further improve the intersection’s operations and safety, as traffic using the ramp would be diverted to alternative routes mostly outside the Medford Square area.18 The closed ramp area can be redeveloped into a linear river park and used as a part of the planned South Medford Connector in the Mystic Greenways system. However, the closure could reduce local access to the developments on Main Street and Mystic Avenue.
Alternative 3, closing the Route 16 westbound on-ramp from Main Street, would also improve operations and safety better than the No-Build alternative. However, it would impact the adjacent intersections of Riverside Avenue at Clippership Drive and Main Street at Mystic Avenue significantly; as the traffic originally using the Route 16 westbound on-ramp to I-93 would need to go through either of the intersections to reach I-93 northbound or I-93 southbound.
The Synchro analysis indicates that Alternative 4 is not feasible based on the projected 2040 traffic conditions, even though the test intersection layout includes four approaching lanes (one left-turn only and three for through- and right-turn movements) on Route 16, and three approaching lanes on Main Street (one left-turn-only and two for through- and right-turn movements).
The alternative, raised at the 2016 Medford economic forum, 19 certainly would open up the area adjacent to the Mystic River and integrate the City Hall and Main Street subareas by removing the elevated Route 16/I-93 connector. In this preliminary planning study, the traffic projection basically assumes that all the trips using the connector would still go through the future at-grade intersection. Further engineering studies, including a regional transportation model refined exclusively for this alternative, should be conducted to determine its benefits and impacts more precisely.
In summary, this study proposes Alternative 1A or 1B for the interchange’s long-term improvements. The City of Medford supports further study of Alternative 2 to determine how it might impact regional traffic and local access.
Figure 14 shows the proposed layout of the interchange area under Alternative 1A or 1B, which includes
At the design stage, further analyses should be conducted to 1) choose between three- and four-phase traffic operations, 2) reduce right-turn traffic conflicts by allowing pedestrians two-to-three seconds advancement when a pedestrian phase is called, and 3) coordinate the traffic signals at this location with the signal at the adjacent intersection of Main Street at Salem/High Street to expedite traffic flow on Main Street.20
Staff developed three long-term improvement alternatives for this intersection:
All of the alternatives include an on-call exclusive pedestrian phase in the signal cycles. The new traffic signal also would be equipped with a preemption function for the emergency vehicles at the adjacent Medford Fire Station. It would provide safe and convenient access for the emergency vehicles and significantly improve safety for all users at the intersection during emergency responses.
Table 7 summarizes AM and PM peak hour capacity analysis results for the No-Build and three alternatives under the projected 2040 traffic conditions. Appendix N provides detailed Synchro capacity analysis reports for the different alternatives.
The Synchro capacity analyses indicate that all of the alternatives, especially Alternatives 2 and 3, would significantly improve traffic operations from the No-Build option and would operate acceptably under the projected 2040 traffic conditions. Alternative 3 potentially would reduce cut-through traffic in the south Medford neighborhoods. However, it is considered not suitable, as the northbound left-turn movement is essential for the adjacent commercial and industrial developments. Further examination of the alternative may be conducted at the design stage.
Staff also briefly examined the potential of a modern roundabout at this location; but determined that it is not feasible because the high volume of traffic would require a two-lane roundabout, for which the existing intersection layout does not contain adequate space. Moreover, the roundabout would not able to provide the signal preemption function that the fire department needs.
This study proposes Alternative 2 for the intersection’s long-term development. Figure 15 shows the proposed intersection layout, which includes
As proposed in the short-term improvements, the existing Main Street width is sufficient for striping five-foot shoulders for bicycles on both sides. It is preferable for separated bicycle lanes to be installed in this section. But the separated bicycle lanes would take up more space and may necessitate removing the traffic median, which is helpful for pedestrians. Further studies should be conducted to examine the feasibility and impacts of alternative bicycle accommodations such as striping a “super sharrow”21 on the curb lanes in this section.
This section covers Mystic Valley Parkway (Route 16) from Winthrop Street to the crosswalk at Mystic River Path (east of Mystic River), which is owned and operated by DCR. Of greatest concern are the intersection of Mystic Valley Parkway at Winthrop Street and the crosswalk at Mystic River Path.
In the long term, this study proposes to modify the configuration and upgrade the traffic signal at the intersection of Mystic Valley Parkway and Winthrop Street, install new signal system at the crosswalk on Route 16 at Mystic River Path, and consider allowing trucks on Route 16 east of Winthrop Street to I-93.
Staff developed two long-term improvement alternatives for the intersection:
Both alternatives include an on-call exclusive pedestrian phase in the signal cycles. Table 8 summarizes AM and PM peak hour capacity analysis results for the No-Build and the two alternatives under the projected 2040 traffic conditions. Appendix O provides detailed Synchro capacity analysis reports for the different alternatives. The Synchro capacity analyses indicate that both alternatives, especially Alternative 2, would significantly improve traffic operations from the No-Build option and would operate acceptably under the projected 2040 traffic conditions.
Staff also briefly examined the potential of a modern roundabout at this location; and determined that it is not feasible because the high traffic volume would require a two-lane roundabout, for which the existing intersection layout does not provide adequate space.
This study proposes Alternative 1 for the intersection’s long-term redevelopment. Figure 16 shows the proposed intersection layout, which includes the following proposed improvements:
Staff proposed Alternative 1 mainly because of the right-of-way consideration. The intersection is under DCR’s jurisdiction. Medford suggested that Alternative 2 be implemented instead. Alternative 2 would significantly improve traffic flows on Route 16 (mainly eastbound), but it also may require some land takings along the south side of Mystic Valley Parkway (in the adjacent DCR-owned parks). Both Alternatives 1 and 2 should be further examined at the design stage.
In the long term, this study proposes to install a new signal system at this location. The system should include a sufficient number and size of traffic signal-displays and count-down and accessible pedestrian signals. Medford suggested that the traffic signals function under standard green/yellow/red operation, and the pedestrian signals should be actuated and more responsive (to activate in enough time that the prevailing traffic can safely stop). These options should be considered and further examined at the design stage.
Currently trucks are prohibited on all the Mystic Valley Parkway sections in Medford. Allowing trucks in this section likely would reduce a large portion of truck traffic on Main Street, High Street and South Street. One key consideration of this proposal is the sustainability of the bridge over the Mystic River. A recent MassDOT bridge inspection report shows that the bridge is functionally obsolete but has no structural deficiencies and requires no weight limits.22 This study proposes examining this alternative further because it would provide substantial benefits to the Medford Square neighborhoods by alleviating truck traffic.
Currently, no sidewalks exist on the south side of the Mystic River Parkway. West of Winthrop Street, pedestrians can use the multi-use path along the parkway in Veterans Memorial Park. East of the Winthrop Street, it is essential to provide sidewalks, preferably 10-feet wide that can occasionally accommodate bicycles, and connect to the DCR parking lot in the Mystic River Reservation.
In addition to the multi-use path just south of the parkway, there is another path in Veterans Memorial Park. It is a gravel path that runs along the park’s south edge on the north bank of Mystic River, with a crosswalk on Winthrop Street, which is meant to connect the existing path in the Mystic River Reservation (also running on the north bank on the river). However, the path in the reservation does not directly connect to the crosswalk. There is room in the reservation and the space should be realigned to connect more conveniently with the crosswalk.
This section of Mystic Valley Parkway is also referred to as the Route 16/I-93 Connector. It is not safe for bicycles, as the roadway’s prevailing traffic speed is high and the road’s shoulders are not wide enough to accommodate bicycles. There are a few multi-use paths, part of the Mystic River Path system, in the parkway vicinity. Cyclists can use the different paths to reach their destinations. However, there is no clear signage showing the locations of the various paths. The City of Medford can work with DCR to review the paths in the Mystic River Path system to identify suitable locations for installing way-finding signage.
This section covers Winthrop Street from Mystic Valley Parkway (Route 16) to High Street (Route 60). Because the intersection of Winthrop Street at Mystic Valley Parkway was reviewed previously, the major concern here is the intersection of Winthrop Street at High Street, also known as Winthrop Square.
The City of Medford recently reconstructed the Winthrop Square traffic circle (primarily the corner between Rural Avenue and Winthrop Street) to provide an additional staging area for pedestrians and shorten the crossing distance on High Street and Rural Avenue. The traffic circle was also restriped similar to a single-lane modern roundabout to slow down circulating traffic. However, Winthrop Square still encounters severe traffic congestion in the AM and PM peak periods because of high traffic volumes from the major commuting routes: Route 16, Route 60, and Route 38. The major issues and concerns in this section include
In the long term, this study suggests reconstructing and signalizing the Winthrop Square traffic circle. The proposed signal includes an exclusive pedestrian-crossing phase to stop traffic on all approaches.
Table 8 summarizes the AM and PM peak hour capacity analysis results for the No-Build and the two alternatives under the projected 2040 traffic conditions. Appendix P provides detailed Synchro capacity analysis reports for the different alternatives. The Synchro capacity analyses indicate that Alternative 1 would improve traffic operations significantly from the No-Build option, and would operate acceptably under the projected 2040 traffic conditions.
Alternative 2 would require an extensive right-of-way for the construction of a modern roundabout with an inscribed circle of at least 150 feet in diameter; and its southbound and westbound approaches likely would still endure extensive delays. This alternative is not feasible within the existing right-of-way and the built surroundings.
This study proposes Alternative 1 for the intersection’s long-term redevelopment. Figure 17 shows the proposed intersection layout. Key proposed improvements include
This section covers High Street from the east of Winthrop Square to the west of Main Street. As a part of Route 60, it carries a high volume of regional and local traffic. As Medford Square’s historical “main street,” this area contains many shops, retail stores, and restaurants; several medium and large condominiums; churches; and the City of Medford’s public library. These attractions generate substantial pedestrian activities throughout the day. The corridor is basically a two-lane roadway. With on-street parking on both sides, it has a narrow travel lane about 10-feet wide in each direction. During peak periods, traffic is usually bumper-to-bumper, especially in the peak commuting direction.
In the long term, the intersection of High Street at Governors Avenue should be considered for signalization in order to reduce traffic delays and improve pedestrian safety. Table 10 summarizes AM and PM peak hour capacity analysis results for the No-Build and the signalization alternatives under the projected 2040 traffic conditions. Appendix Q provides detailed Synchro capacity analysis reports for the two alternatives.
The Synchro capacity analyses indicate that the signalization alternative would significantly improve traffic operations and would operate acceptably under the projected traffic conditions. The proposed signal timing includes an exclusive pedestrian phase and is intended to minimize the westbound traffic queue so as not to interfere with the central intersection at Medford Square.
Staff also briefly reviewed the feasibility of a modern roundabout, and determined that it is not feasible because the intersection layout and its surroundings are too limited for a single-lane roundabout, which would require an inscribed circle between 100-to 130-feet in diameter.
This study proposes examining pedestrian and bicycle accommodation and safety improvements in this corridor. Key long-term improvements include
MPO staff constructed future-year traffic models, projecting to 2040, for the entire study area, based on the roadway layouts with the proposed long-term improvements. Figure 18 shows the weekday AM and PM peak hour intersection capacity of major intersections in the study area under the projected 2040 traffic conditions. With the proposed long-term improvements, all intersections would operate at acceptable LOS during the weekday peak hours.
We have presented Synchro capacity analyses for each of these intersections individually in previous sections of this Chapter. Staff analyzed traffic signal coordination at two adjacent locations: the Medford Square central intersection (as the master control location) and the intersections of Main Street at Route 16 Ramps. The Synchro traffic simulation showed that the coordination facilitated Main Street traffic flow and did not seriously increase queuing on the Route 16 ramps. We summarize the results of this analysis in Figure 18; and Appendix R contains detailed Synchro capacity analysis reports for the two locations.
9 Currently the Main Street approach is right-turn only and controlled by right-turn green and red arrows. Based on Massachusetts “Rules of the Road” (from the Massachusetts Driver manual), the steady red arrow means the same as a steady red circular signal, that is, drivers can make turns to the arrow direction after making a complete stop. Installing a “No Turn On Red” sign would prohibit the turns during red arrow displays and reduce the conflicts between the turning vehicles and crossing pedestrians.
10 The no-build scenario basically combines the traffic volumes under the existing conditions (2017) and the approach volumes from the Route 16 off-ramp to Main Street (obtained from the turning movement counts in the Cradock Bridge functional design report).
11 The subarea model retains the subarea’s entry points, that is, Salem Street (west of I-93), Riverside Avenue (east of Clippership Drive), Main Street (south of Clippership Drive), High Street (west of the central intersection), and Forest Street (north of the central intersection), as the trip origins and destinations. Based on the travel time of each possible origin-destination pair, the entry trips were assigned to the subarea network of each alternative repeatedly until the differences of the signed volumes at all intersections are small from iteration to iteration. The model was constructed by utilizing the Excel macro (add-in), SOLVER.
12 The traffic growth projection is based on the transportation-planning model recently developed for the MPO’s Long-Range Transportation Plan. With no major infrastructure changes (such as significant capacity increase on I-93) and no major traffic demand reductions (such as the significant shift from auto to non-auto modes) in the Medford Square vicinity, the model predicts that traffic in the Medford Square area would increase by 0.2 percent in the AM peak period and 0.25 percent in the PM peak period annually from 2017 to 2040.
13 The stop line on Forest Street is set back about 65 feet from the intersection in order to allow right-turning trucks from Salem Street. The existing signal display is too far from the drivers stopped on Forest Street and it should be supplemented by a signal near the stop line.
14 Roundabouts: An Information Guide, Federal Highway Administration, June 2000.
15 The parking is for police business only. It appears that the existing spaces are not fully utilized. If necessary, one or two spaces may be preserved at the south end near Emerson Street.
16 The three-phase setting operates traffic in the sequence of 1) both Route 16 ramps, 2) Main Street left turns, and 3) Main Street through and right-turn movements. The four-phase setting operates traffic in the sequence of 1) Route 16 westbound ramp, 2) Main Street southbound, 3) Route 16 eastbound ramp, and 4) Main Street northbound. Both settings operate concurrent pedestrian phases with applicable traffic phases in a way that allows no left-turn traffic conflicts with pedestrians.
17 The 2040 no-build alternative assumes that (1) the Route 16 westbound off-ramp to Main Street is reopened to traffic and (2) the ramp and the Route 16 westbound off-ramp/South Street remain under the stop controls.
18 Currently the off-ramp to Main Street is closed because of the Cradock Bridge reconstruction project. It is scheduled to reopen in fall 2018.
19 Shaping Medford: Community Conversations to Guide Our Economic Future, prepared by Mayor Stephanie Burke’s Business and Economic Development Committee, July 2016.
20 The distance between this location and the adjacent intersection is about 300 feet. Synchro capacity analyses indicated that in the PM peak hour the southbound traffic at this location could potentially spill back into the adjacent intersection during peak traffic surges. The master controller should be located at the adjacent intersection of Main Street at Salem/High Street.
21 Initially tested in Oakland, California in 2013, and adopted recently by a number of U.S. cities, a “super sharrow” is a series of sharrows painted on a five-foot-wide green area, or accompanied by white dash lines on both sides down the middle of a travel lane to emphasize its shared usage through the prominent appearance of sharrows.
22 Staff found no specific descriptions of the obsolete functions. They could be horizontal or vertical alignments not suitable for trucks.
Chapter 6—Summary and Recommendations
This study performed a series of safety and operations analyses, identified safety and operational problems, and proposed a number of short- and long-term improvements to address the problems in the study area.
The recommended short-term improvements could enhance safety for all users, including pedestrians and cyclists, and improve traffic operations in the study area. With a high benefit-to-cost ratio, these short-term improvements should be considered and implemented as soon as resources are available from highway maintenance or local Chapter 90 funding.
Significantly improving the safety, mobility, and access for all users would require a series of long-term improvements. Based on the existing land uses and transportation conditions, the study area can be divided into the following prospective projects (in order of suggested priority):
This study provides a vision for Medford Square’s long-term redevelopment and presents a series of improvements for the corridor that would allow it to operate safely and efficiently for motorists, bicyclists, and pedestrians. The existing conditions and potential solutions for these locations are complex and interrelated. Depending on available and potential resources, and development opportunities, the City of Medford could coordinate all stakeholders to rearrange and reprioritize these projects.
Implementing this vision via the recommended improvements would require significant effort and collaboration on the part of all stakeholders, including the City of Medford, residents, business owners, MassDOT, and DCR. All parties must concur about how the recommendations should be realized in a resourceful and fiscally responsible manner. The City may work with MassDOT District 4 to initiate the project, obtain favorable assessment from MassDOT’s Project Review Committee, and identify potential funding sources by coordinating with MassDOT and the Boston Region MPO.
Appendix S contains details about the various steps of MassDOT’s project development process, including a schematic timetable. Information about the project development process also may be found on MassDOT’s website, at http://www.massdot.state.ma.us/planning/Main/PlanningProcess/ProjectDevelopmentProcess.aspx and at http://www.massdot.state.ma.us/Portals/8/docs/designGuide/CH_2_a.pdf.
MassDOT recently developed an online tool for both states and municipalities to use when initiating roadway projects. The Massachusetts Project Intake Tool (MaPIT) is a web-based application designed to help proponents map, create, and initiate projects with available in-house Geographic Information System (GIS) resources. The tool can be accessed from the geoPass webpage of Massachusetts GIS for Transportation (geoDOT), https://massdothpi.esriemcs.com/mapit.
For an introduction of the tool, please visit http://scoe.transportation.org/wp-content/uploads/sites/11/2017/08/CC1C-MaPIT%E2%80%94MassDOT%E2%80%99s-GIS-driven-Project-Initiation-and-Environmental-Screening-Tool.pdf.


 at Winthrop Street
This table shows the AM and PM peak hour Synchro capacity results for each proposed design alternative at the intersection of Route 16 and Winthrop Street.")
")


 volumes at the 23 Automatic Traffic Recorder (ATR) collection sites inside the study area.")
 data, including vehicular volumes by turning movements and pedestrian volumes by crossing location.")


This figure shows on-road bicycle volumes for AM, PM, and weekend peak periods, which are based on TMC data.")

This figure shows the portion of vehicular traffic made")
 for individual movements and the intersections as a whole.")


This figure shows the location of each crash and crash cluster within the study area between 2013 and 2015, including those clusters eligible for the Highway Safety Improvement Program (HISP).")


• Modify Central Intersection to allow all movements
• Install traffic signal at Clippership Dr. under the Central Intersection controller
• Install traffic signal at Riverside Ave. and City Hall Mall
• Extend City Hall Mall southward to Clippership Dr.")
 at the central intersection.")
 at Route 16 ramps at Main Street.")
 at the intersection of Main Street and Mystic Avenue.")
 at Winthrop Street
This figure shows a conceptual drawing of the proposed long-term improvements (design alternative 1) at the intersection of Mystic Valley Parkway (Route 16) and Winthrop Street.")
 at the intersection of High Street and Winthrop Street.")

 delay formulas and Synchro SimTraffic simulations.
Table 2. Intersection Capacity Analysis: PM Peak Hour – Summary of City Hall Subarea
This table summarizes the PM peak hour Synchro capacity results across the city hall subarea for each proposed design alternative. The summaries are performed on the basis of average delay per vehicle, calculated both using HCM delay formulas and Synchro SimTraffic simulations.")