Chapter 2: Selection of Study Locations
Chapter 3: Data Collection and Analysis Methods
Chapter 4: Operations and Safety Analysis
Chapter 5: Proposed Low-Cost Improvements
Chapter 6: Conclusion and Next Steps
Project Manager
Chen-Yuan Wang
Project Principal
Mark Abbott
Data Analysts
Julie Dombroski
Kathy Jacob
Graphics
Kim DeLauri
Cover Design
Kim DeLauri
The preparation of this document was supported
by the Federal Highway Administration through
MPO Planning Contract #112310.
Central Transportation Planning Staff is
directed by the Boston Region Metropolitan
Planning Organization (MPO). The MPO is composed of
state and regional agencies and authorities, and
local governments.
May 2022
For general inquiries, contact
Central Transportation Planning Staff
State Transportation Building
Ten Park Plaza, Suite 2150
Boston, Massachusetts 02116
857.702.3700
The Boston Region Metropolitan Planning Organization (MPO) operates its programs, services, and activities in compliance with federal nondiscrimination laws including Title VI of the Civil Rights Act of 1964 (Title VI), the Civil Rights Restoration Act of 1987, and related statutes and regulations. Title VI prohibits discrimination in federally assisted programs and requires that no person in the United States of America shall, on the grounds of race, color, or national origin (including limited English proficiency), be excluded from participation in, denied the benefits of, or be otherwise subjected to discrimination under any program or activity that receives federal assistance. Related federal nondiscrimination laws administered by the Federal Highway Administration, Federal Transit Administration, or both, prohibit discrimination on the basis of age, sex, and disability. The Boston Region MPO considers these protected populations in its Title VI Programs, consistent with federal interpretation and administration. In addition, the Boston Region MPO provides meaningful access to its programs, services, and activities to individuals with limited English proficiency, in compliance with U.S. Department of Transportation policy and guidance on federal Executive Order 13166.
The Boston Region MPO also complies with the Massachusetts Public Accommodation Law, M.G.L. c 272 sections 92a, 98, 98a, which prohibits making any distinction, discrimination, or restriction in admission to, or treatment in a place of public accommodation based on race, color, religious creed, national origin, sex, sexual orientation, disability, or ancestry. Likewise, the Boston Region MPO complies with the Governor's Executive Order 526, section 4, which requires that all programs, activities, and services provided, performed, licensed, chartered, funded, regulated, or contracted for by the state shall be conducted without unlawful discrimination based on race, color, age, gender, ethnicity, sexual orientation, gender identity or expression, religion, creed, ancestry, national origin, disability, veteran's status (including Vietnam-era veterans), or background.
A complaint form and additional information can be obtained by contacting the MPO or at http://www.bostonmpo.org/mpo_non_discrimination.
To request this information in a different language or in an accessible format, please contact
Title VI Specialist
Boston Region MPO
10 Park Plaza, Suite 2150
Boston, MA 02116
civilrights@ctps.org
By Telephone:
857.702.3702 (voice)
For people with hearing or speaking difficulties, connect through the state MassRelay service:
For more information, including numbers for Spanish speakers, visit https://www.mass.gov/massrelay
The section of Interstate 95 (I-95) between Exits 57 and 61 that runs through Reading, Wakefield, and Lynnfield, is one of the most frequently traveled corridors in the state. Motorists on this section of I-95 regularly experience delays resulting from highway bottlenecks, particularly during peak travel periods in the morning and afternoon. The federal fiscal year 2021 Low-Cost Improvements to Express-Highway Bottleneck Locations study examined these conditions to identify the cause of the traffic delays and develop low-cost solutions to improve traffic operations and safety in this area. Recommendations are given for reconfiguring acceleration and deceleration lanes and adding an auxiliary lane to alleviate congestion. The results of this study provide the MassDOT Highway Division with information for beginning to design and engineer improvements to these bottleneck locations.
The purpose of the Low-Cost Improvements to Express-Highway Bottleneck Locations study was to identify low-cost improvements that will help reduce congestion at freeway bottleneck locations in the Boston Metropolitan Planning Organization (MPO) region. The study was accomplished through cooperation with the Massachusetts Department of Transportation (MassDOT) Highway Division.
Bottlenecks on the freeway network can occur where geometric elements, such as ramps or lane drops, restrict traffic flow and become a major contributor to recurring congestion. Candidate locations in this study were identified based on input from the MassDOT Highway Division and review of the MPO’s Congestion Management Process data. The screening process yielded two locations on Interstate 95 (I-95) that had the potential for low-cost improvements: 1) I-95 southbound between Exit 58 (Route 129) and Exit 57 (North Avenue) in Wakefield and Reading, and 2) I-95 northbound at Exit 61 (Walnut Street) in Lynnfield.
After further review of the areas adjacent to the two locations and discussions with MassDOT Highway Division District 4 staff, MPO staff selected the northbound and southbound sections of I-95 between Exit 57 and Exit 61 for a comprehensive and systematic analysis to identify bottleneck locations for low-cost improvements. Travelers on this section of I-95 regularly experience poor levels of service and endure additional delays while entering or exiting the freeway during the weekday AM and PM peak travel periods.
MPO staff performed a series of operational and safety analyses, including traffic-volume estimations and projections, and analyses of highway capacity, travel speeds, and crash data. Staff then developed low-cost improvement proposals for the identified bottleneck locations.
The locations and proposed improvements are as follows:
The study aligns with the MPO’s goals of managing capacity, improving mobility, and improving safety on the region’s highway system. The proposed low-cost improvements would improve the freeway facilities, make traffic operations more efficient, and reduce congestion at the identified bottleneck locations. The improvements also would reduce crashes and improve safety for the freeway users.
According to the Federal Highway Administration (FHWA), “Much of recurring congestion is due to physical bottlenecks—potentially correctible points on the highway system where traffic flow is restricted. While many of the nation’s bottlenecks can only be addressed through costly major construction projects, there is a significant opportunity for the application of operational and low-cost infrastructure solutions to bring about relief at these chokepoints.” 1
The cause and duration of highway bottlenecks are various. In general, recurring bottlenecks, the subject of this study, are influenced by the design or operation present at the point where the bottleneck begins. These points may be where the highway design is less than optimal; where traffic merges, diverges, or weaves; where there are abrupt changes in highway alignment, lane drops, or narrowing of lanes; at low-clearance structures; or where traffic is disrupted intentionally for management purposes.
Since 2011, MPO staff analyzed several express-highway bottleneck locations in five previous studies; these studies were well received by the Massachusetts Department of Transportation (MassDOT) and the FHWA.2 Previous study locations included sections of Interstate 95 (I-95) in Burlington, Lexington, and Weston; sections of Interstate 93 (I-93) in Woburn; sections of Route 3 in Braintree; sections of Route 24 in Canton and Randolph; sections of I-93 northbound in Wilmington; and sections of I-93 southbound in Quincy and Braintree.
The MassDOT Highway Division has implemented many of the recommendations from those studies, and the FHWA has interviewed MPO staff about these successful implementations, including
Cost estimates for low-cost bottleneck improvements that have been implemented by the MassDOT Highway Division, or currently are in design status, range between $10,000 and $1 million.
The purpose of this study was twofold. First, the study aimed to identify bottleneck locations where low-cost mitigation improvements are potentially applicable. Second, the study aimed to recommend low-cost mitigation improvements based on analysis of geometric design, traffic volumes and other data, and projected service performance associated with the improvements at each location.
MPO staff conducted a series of highway operations and crash data analyses to identify low-cost methods to reduce congestion, increase safety, and improve traffic operations. Technical expertise was provided by MassDOT Highway Division staff, who are familiar with the region’s express-highway system operations, to develop and evaluate a comprehensive list of potential improvements at the bottleneck locations.
The following chapters of this report describe the selection of study locations, an assessment of the safety and operational problems, and potential improvement strategies. The final section presents the proposed low-cost improvements for several locations and recommendations. This report also includes a series of technical appendices, which cite the study methods, highway capacity analysis reports, and intersection capacity analysis reports for the signalized interchanges in the study area.
MPO staff developed an initial list of candidate locations in the Boston region based on the following:
The inventory process also included a review of the locations collected in the previous studies that have potential for low-cost improvements. The process yielded over 20 bottleneck locations in the Boston region for further screening.
MPO staff used the following three criteria to screen the bottleneck locations:
A repetitive, long traffic queue upstream trailing free-flowing traffic downstream usually characterizes the location as a bottleneck. In other words, the location experiences routine and predictable congestion because traffic volume exceeds the available capacity at that location.
Examples of these constraints or conflicts include the following:
These improvements exclude costly long-term solutions such as expansion or widening of the roadway. Examples of low-cost operational and geometric improvements include the following:
Based on the suggestions from MassDOT Highway Division officials and the screening criteria, MPO staff identified nine express-highway bottleneck locations that have the potential to be corrected with low-cost mitigation strategies (see Table 1). Among them, Locations 1 and 2 are considered as having high potential because there is sufficient highway layout and few constraints in the adjacent areas. The other locations were not selected in this round because of funding resources. Those locations can be considered in future bottleneck studies.
Table 1
Express-Highway Locations with Potential for Low-Cost Improvements
Location Number |
City/Town |
MassDOT District |
Express-Highway Section |
Problem |
1 |
Wakefield |
4 |
I-95 southbound between Exit 58 (Route 129) and Exit 57 (North Avenue) |
Merge and diverge |
2 |
Lynnfield |
4 |
I-95 northbound at Exit 61 (Walnut Street) |
Merge and diverge during the PM commute |
3 |
Woburn |
4 |
I-95 northbound between Exit 53 (Route 38) and Exit 54 (Washington Street) |
Merge and diverge |
4 |
Medford |
4 |
I-93 southbound between Route 16 on-ramp and Exit 22 (Route 16 off-ramp) |
Merge and diverge |
5 |
Saugus |
4 |
Route 1 southbound between Essex Street and Broadway (Route 99) |
Merge and diverge |
6 |
Foxborough |
5 |
I-95 southbound at I-495 northbound and southbound |
Merge and diverge during the PM commute |
7 |
Boston |
6 |
I-93 northbound at the end of the HOV zipper lane in Savin Hill |
Merge and weave during the AM commute |
8 |
Canton and |
6 |
I-93 northbound between Exit 1 (I-95) and Exit 4 (Route 24) |
Merge, diverge, and weave |
9 |
Canton and |
6 |
I-93 southbound between Exit 1 (I-95) and Exit 4 (Route 24) |
Merge, diverge, and weave |
Notes: 1) Shading indicates locations identified as having high potential for low-cost improvements in this study.
2) All the exit numbers are based on the recently (2020–21) updated mile-based numbers.
HOV = High occupancy vehicle. MassDOT = Massachusetts Department of Transportation.
Source: Central Transportation Planning Staff.
After the screening process, staff further reviewed the two locations with high potential for low-cost improvements and the adjacent highway segments and found that both the northbound and southbound sections of I-95 between Exit 57 and Exit 61 were suitable for study.
Figure 1 shows the selected sections of I-95 in the study area. These sections contain five interchanges:
The distances for traffic to merge and diverge on I-95 northbound and southbound at these interchanges are generally short, some less than 500 feet. However, most of these segments appear to have sufficient highway layout with no significant terrestrial constraints. Therefore, there is space to extend the distances where traffic may merge and diverge.
Both directions of I-95 between Exit 57 and Exit 61 are usually congested in the peak periods. In general, the traffic in the peak direction (southbound in the AM peak period and northbound in the PM peak period) is much more congested than the off-peak direction. In addition to the mainline congestion, localized bottlenecks develop at the areas where traffic merges and diverges when high entry and exit volumes are present in the peak hours.
Review of the crash data also indicated that there were significant numbers of crashes on I-95 at the locations of merging and diverging traffic. This study provided a systematic review of this frequently congested section of I-95 to identify short-term improvement strategies and support long-term improvement planning.
The MassDOT Transportation Data Management System provides traffic volume data on major express highways, arterials, and major collectors throughout the state.3 The database contains four permanent count stations in the study area:
In addition, it contains ramp counts collected in October 2020 at all the interchanges in the study area. MPO staff used these counts and available historical data to estimate traffic volumes on the I-95 northbound and southbound mainline and ramps. Staff also adjusted some of the counts collected during the COVID-19 pandemic period.4
MPO staff used crash data from January 2015 to December 2017 from the MassDOT Registry of Motor Vehicles database to analyze crash severity, collision type, and roadway conditions and to evaluate safety for motorists.
The CMP maintains average speed data on express-highway systems in the Boston region, incorporating the INRIX historical traffic speed data.5 MPO staff used the current speed data from the CMP (spring 2019 and fall 2019) to determine the average weekday travel speeds through the bottlenecks.
Level of service (LOS) is a quality measure of effectiveness describing operational conditions within a traffic stream, generally in terms of such service measures as speed and travel time, freedom to maneuver, traffic interruptions, and comfort and convenience. Factors influencing LOS are volumes, lane width, lateral obstructions, traffic composition, grade, and speed. The Highway Capacity Manual (HCM) methodology demonstrates driving conditions on freeways in terms of LOS ratings from A through F.6
The LOS criteria have been developed for each freeway component—basic freeway, ramp merge/diverge, and weaving segments. The locations and traffic flow characteristics at each of the components are described below.
Table 2 shows the LOS criteria for basic freeway, merge/diverge, and weaving segments. LOS A represents the best operating conditions (unrestricted operations) while LOS F represents the worst operating conditions. LOS A through LOS D represent acceptable operating conditions. LOS E represents operating conditions at capacity. LOS F represents failing conditions (demand exceeds capacity). The LOS criteria characterize freeway performance measures in terms of density (passenger cars per lane mile).
Table 2
LOS Criteria for Basic Freeway, Merging/Diverging, and Weaving Segments
blank |
Basic Freeway Segment |
Ramp Merge/Diverge and Weaving Segments |
LOS |
Density (pc/lane mile) |
Density (pc/lane mile) |
A |
0–11 |
0–10 |
B |
11–18 |
10–20 |
C |
18–26 |
20–28 |
D |
26–35 |
28–35 |
E |
35–45 |
>35 |
F |
>45 |
Demand exceeds capacity (V/C>1) |
LOS = level of service. pc/lane mile = passenger cars per lane mile. V/C = volume-to-capacity ratio.
Source: Highway Capacity Manual 2010.
The traffic operations analyses conducted by MPO staff were consistent with HCM methodologies. Using the data collected, MPO staff then built traffic analysis networks for the AM and PM peak hours and applied the Highway Capacity Software (HCS) to assess the capacity and quality of traffic flow at the potential bottleneck locations.7
As explained in Section 3.4, in general, three types of segments are found on express highways (freeways):
The study locations in the I-95 northbound and southbound sections between Exit 57 and Exit 61 are associated with the freeway merge segment, freeway diverge segment, and basic freeway segment operations. Figure 2 shows the three freeway segment types at the locations analyzed in this study. The operational components of the three types of freeway segments are further discussed in the next section.
In addition, freeway operations could be affected by operations at interchanges where the freeway entrance and exit ramps meet the arterial and major roadways, especially when the interchange traffic is busy and causes traffic queues extending into the freeway. Three of the five interchanges (Exits 57, 60, and 61) are under traffic signal controls and their operations in the peak hours could potentially interfere with I-95 traffic operations. To examine their potential impacts to I-95 operations, this study reviewed traffic operations at the three interchanges based on peak-hour turning movement counts collected in the summer of 2021.8
Another major factor that affects I-95 operations in the study area is the traffic conditions at the interchange of I-93 and I-95 (Exit 28 on I-93 and Exit 55 on I-95). The interchange carries significant traffic volumes from both interstate highways and is one of the most congested locations in the state. During peak periods, the congestion has a significant impact on I-95 and causes significant delays for users of both highways. In the study area, the interchange congestion mainly affects the traffic operations on I-95 between Exit 57 and Exit 58, especially in the southbound direction during the AM peak period and in the northbound direction during the PM peak period.
The interchange of I-93 and I-95 is a major bottleneck in the region and its congestion is a much larger issue that can only be addressed through long-term transportation planning. However, the low-cost improvements proposed in this study would meaningfully improve the freeway merge and diverge operations and enhance the safety for users in the freeway sections north of the major interchange.
A number of factors potentially contributed to traffic congestion at various locations in the I-95 northbound and southbound study sections:
These factors are further analyzed in the following sections.
The section of I-95 between Exits 57 and 61 is one of the most frequently traveled corridors in the state. This section of highway carried approximately 140,000 to 150,000 vehicles per average weekday in recent years, from 2015 to 2019, before the COVID-19 pandemic.9 Daily traffic on I-95 in the study area reduced significantly during this pandemic period, varying from approximately 10 to 25 percent in general to more than 50 percent in the peak pandemic period (spring 2020).10
MPO staff therefore chose 2019 as the base year for the analysis of the existing traffic conditions and used the available traffic data from 2015 to 2019 to estimate the traffic volumes on an average weekday during active traveling months in the spring and fall. Figure 3 shows the estimated daily traffic volumes on the freeway and entrance and exit ramps in both the northbound and southbound directions.
From the collected data, staff found that weekday peak periods in this stretch of I-95 had been expanding to at least four hours: 6:00–10:00 AM and 2:30–6:30 PM. To perform a highway capacity analysis for assessing the existing traffic conditions, staff further identified AM and PM peak hours and estimated peak-hour traffic volumes. Figures 4 and 5 show the traffic flows in the AM peak hour (6:00–7:00 AM in the southbound direction and 7:00–8:00 AM in the northbound direction) and PM peak hour (5:00–6:00 PM in both directions) separately.
During the peak hours, the I-95 mainline and the entrance and exit ramps generally carry high traffic volumes, especially at Exits 57 and 58. In general, all the study locations carry high traffic volumes on the I-95 mainline in the peak direction (northbound in the AM and southbound in the PM peak hour). Field observations indicated that the merging and diverging activities are frequently impeded by the high mainline traffic volumes during the peak hours.
There are a number of variables that influence the freeway diverging and merging operations at the ramp-freeway junctions. Attributes influencing the merging and diverging operations include the length and type (taper or parallel) of acceleration or deceleration lanes, sight distances, speed, the distribution of vehicles across lanes, and free flow speeds of upstream freeway traffic.
Tables 3 and 4 show key attributes observed in the diverge areas on I-95 northbound and southbound by the study interchange locations and the freeway-interchange ramp types. Appendix A contains the classification of the interchange ramp types based on A Policy on Geometric Design of Highways and Streets (as known as the Green Book) by the American Association of State Highway and Transportation Officials (AASHTO).
The length of the deceleration lane is one of the key attributes of particular importance to the diverging operations. Based on the design guidance for minimum deceleration lengths in MassDOT’s Project Development and Design Guide, deceleration lanes at the study locations generally require a minimal length of 440 or 470 feet.11 Appendix B exhibits the design standards and the applicable minimal deceleration lengths for this study.
Table 3
Diverging Operation Attributes: I-95 Northbound Locations
Location |
Exit 57 |
Exit 58 |
Exit 59 |
Exit 60 |
Exit 61 |
Interchange Ramp Typea |
Diagonal |
Diagonal |
One Quadrant |
Diagonal |
Diagonal |
Exit Ramp Form |
Slip |
Slip |
Loop |
Compound Curve |
Slip |
Ramp Advisory Speed |
30 mph |
30 mph |
25 mph |
25 mph |
30 mph |
Estimated Deceleration Lengthc |
600 feet |
350 feet |
750 feet |
200 feet |
450 feet |
a See Appendix A.
b The length of the deceleration lane is measured from the starting point of the taper to the tip of the painted gore, as defined by the Highway Capacity Manual for capacity analysis purposes. This length may differ from the length defined by AASHTO, which is for geometric design purposes. In this study, these deceleration lengths were estimated approximately from the digital orthophotos of US Geological Survey Massachusetts 2019 and Google Earth 2021.
AASHTO = American Association of State Highway and Transportation Officials. mph = miles per hour.
Source: Central Transportation Planning Staff.
Table 4
Diverging Operation Attributes: I-95 Southbound Locations
Location |
Exit 57 |
Exit 58 |
Exit 59 |
Exit 60 |
Exit 61 |
Interchange Ramp Typea |
Diagonal |
Diagonal |
One Quadrant |
Diagonal |
One Quadrant |
Exit Ramp Form |
Slip |
Slip |
Slip |
Slip |
Slip |
Ramp Advisory Speed |
30 mph |
30 mph |
30 mph |
30 mph |
30 mph |
Estimated Deceleration Lengthc |
550 feet |
500 feet |
275 feet |
575 feet |
450 feet |
a See Appendix A.
b The length of the deceleration lane is measured from the starting point of the taper to the tip of the painted gore, as defined by the Highway Capacity Manual for capacity analysis purposes. This length may differ from the length defined by AASHTO, which is for geometric design purposes. In this study, these deceleration lengths were estimated approximately from the digital orthophotos of US Geological Survey Massachusetts 2019 and Google Earth 2021.
AASHTO = American Association of State Highway and Transportation Officials. mph = miles per hour.
Source: Central Transportation Planning Staff.
Among the I-95 northbound study locations, the deceleration lane at Exit 60 has a deceleration length of approximately 200 feet, which is much shorter than the minimal design standards of 470 feet. This location (under an advisory speed of 25 miles per hour) is of particular concern as the exit ramp is short in length with a sharp compound curvature and ends at a traffic signal. During peak hours, vehicles on the ramp were observed to queue back onto the freeway section from time to time, especially in the PM peak period.
Among the I-95 southbound study locations, the deceleration lane at Exit 59 has a deceleration length of approximately 275 feet, which is shorter than the minimal design standards. A quick review of the area’s digital orthophotos indicates that there is potential to extend the deceleration lane in the diverge area.
In order to allow vehicles on ramps to accelerate for merging, acceleration lanes generally require a longer distance than deceleration lanes. Based on the design guidance in MassDOT’s Project Development and Design Guide for minimum acceleration lengths, the assumptions for initial on-ramp speed before merging is 30 miles per hour (mph) for slip ramps and 25 mph for loop ramps. The acceleration lanes in at the study locations generally require a minimal acceleration length of 1,000 and 1,120 feet to meet design standards. Appendix C exhibits the design standards and the applicable minimal deceleration lengths for this study.
Tables 5 and 6 show key operation attributes in the merge areas on I-95 northbound and southbound at the study interchange locations. The study locations generally do not meet the minimum acceleration length design standards. Among them, the merge operations at Exits 59 and 61 on I-95 southbound are of particular concern. The acceleration lengths at both locations are much shorter than the minimal design standards. Meanwhile, drivers at both on-ramps have a limited sight distance when merging due to the loop ramp geometrics.
It is challenging to meet the minimal acceleration length standards for express highways in urban areas where the adjacent areas are densely developed. Highway capacity analyses for the merge segments in the study area indicated that opportunities exist at some of the merging locations that could improve the merging capacity and operations, although design standards still would not be met.
Table 5
Merging Operation Attributes: I-95 Northbound Locations
Location |
Exit 57 |
Exit 58 |
Exit 59 |
Exit 60 |
Exit 61 |
Interchange Ramp Typea |
Diagonal |
Diagonal |
One Quadrant |
Diagonal |
Diagonal |
Entrance Ramp Form |
Slip |
Slip |
Slip |
Compound Curve |
Slip |
Assumed Initial Speedb |
30 mph |
30 mph |
25 mph |
25 mph |
30 mph |
Estimated Acceleration Lengthc |
600 feet |
350 feet |
750 feet |
200 feet |
450 feet |
a See Appendix A.
b The initial merging speed is assumed to be comparable to the advisory speed of the exit ramp at the interchange.
c The length of the acceleration lane is measured from the tip of the painted gore to the end point of the taper, as defined by the Highway Capacity Manual for capacity analysis purposes. This length may differ from the length defined by AASHTO, which is for geometric design purposes. In this study, these acceleration lengths were estimated approximately from the digital orthophotos of US Geological Survey Massachusetts 2019 and Google Earth 2021.
AASHTO = American Association of State Highway and Transportation Officials. mph = miles per hour.
Source: Central Transportation Planning Staff.
Table 6
Merging Operation Attributes: I-95 Southbound Locations
Location |
Exit 57 |
Exit 58 |
Exit 59 |
Exit 60 |
Exit 61 |
Interchange Ramp Typea |
Diagonal |
Diagonal |
One Quadrant |
Diagonal |
One Quadrant |
Entrance Ramp Form |
Slip |
Slip |
Loop |
Slip |
Loop |
Assumed Initial Speedb |
30 mph |
30 mph |
25 mph |
30 mph |
25 mph |
Estimated Acceleration Lengthc |
550 feet |
500 feet |
400 feet |
500 feet |
350 feet |
a See Appendix A.
b The initial merging speed is assumed to be comparable to the advisory speed of the exit ramp at the interchange.
c The length of the acceleration lane is measured from the tip of the painted gore to the end point of the taper, as defined by the Highway Capacity Manual for capacity analysis purposes. This length may differ from the length defined by AASHTO, which is for geometric design purposes. In this study, these acceleration lengths were estimated approximately from the digital orthophotos of US Geological Survey Massachusetts 2019 and Google Earth 2021.
AASHTO = American Association of State Highway and Transportation Officials. mph = miles per hour.
Source: Central Transportation Planning Staff.
As shown in Figure 2, in the operational analysis the sections between the exit ramps and the entrance ramps at the interchanges were assumed to be operating as basic freeway segments. The only other locations identified for such analysis were the northbound and southbound sections of I-95 between Exit 59 and Exit 60. According to the Highway Capacity Manual, the merge segments have an influence area 1,500 feet downstream of the merge point and the diverge segments have the same influence upstream of the diverge point. In this study, therefore, the basic-freeway-segment analysis was applied only to the sections where the merge and diverge segments’ influence areas do not overlap.
Attributes influencing basic-freeway-segment operation include the number of lanes, lane widths, lateral clearances, terrain and grades, degree of curvature, and total ramp density.12 The basic freeway segments on I-95 northbound and southbound in the study area generally contain three 12-foot travel lanes, a 10-foot or more right shoulder, and a six-foot left shoulder. The terrain where the segments are located is level, with a grade generally less than two percent.
Based on the freeway attributes and the estimated base-year (2019) peak-hour traffic volumes, staff conducted highway capacity analyses for the merge, diverge, and freeway basic segments in the study area. Figures 6 and 7 summarize the AM and PM analyses by the segment locations on I-95 northbound and southbound. Appendices D and E contain full HCS reports of the AM and PM peak-hour capacity analyses for the various study locations.
The analyses indicated that most of the diverge segments operated at acceptable LOS D, except the diverge segment on I-95 southbound at Exit 57. The segment is estimated to operate at LOS E and near its capacity.
For the merge segments, several locations were assessed to operate at LOS E and near their capacities. These include the segment at Exit 57 on I-95 northbound during both the AM and PM peak hours, Exit 58 on I-95 southbound during both the AM and PM peak hours, Exit 59 on I-95 southbound during the AM peak hour, and Exit 61 on I-95 southbound during the AM peak hour.
All the basic freeway segments were assessed to operate at acceptable LOS D, with the segments at Exits 57, 58, and 59 generally having a high volume to capacity ratio near 0.90.
Note that HCS is not a traffic simulation software and the above capacity analyses do not include the congestion effects from the major bottleneck at the interchange of I-93 and I-95. The analyses, however, provide a baseline of the exiting traffic conditions for analyzing and assessing the future year no-build and proposed scenarios.
Figures 8 and 9 depict congestion scans that cover I-95 in the study area in the northbound and southbound direction separately. They show the average travel speeds on I-95 northbound from Exit 57 to Exit 61 and the average speeds on I-95 southbound from Exit 61 to Exit 57. The 2019 spring and fall midweek (Tuesday to Thursday) travel-time data (provided by INRIX) were used for this analysis.
As shown in Figure 8, travel speeds at the study locations on I-95 northbound generally slow to less than 55 mph from 2:30 PM to 6:30 PM, with the impact to travel speeds and the length of the congested period gradually decreasing from Exit 57 to Exit 61. The congestion scan clearly indicates the significance of the congestion effect from the major bottleneck upstream at the interchange of I-93 and I-95. The severe congestion at the interchange often causes stop-and-go traffic conditions on I-95 northbound during the PM peak hours when travel demand is high. Meanwhile, the exit and entrance ramps on I-95 northbound also carry high traffic volumes during the PM peak hours and the diverging and merging operations further impede the recovery of normal freeway travel speeds.
As shown in Figure 9, travel speeds at the study locations on I-95 southbound generally slow to less than 55 mph from 6:00 AM to 10:00 AM, with the impact to travel speeds and the length of congested period gradually increasing from Exit 61 to Exit 57. The congestion scan indicated the severe congestion at the major bottleneck downstream significantly reduces the travel speeds on I-95 southbound, especially between Exist 57 and Exit 59. Meanwhile, the exit and entrance ramps on I-95 southbound also carry high traffic volumes during the AM peak hours and the diverging and merging operations further reduce travel speeds in the mainline sections.
The study area contains five interchanges of different types, including diamond interchanges, a traffic rotary, a combined diamond, and one quadrant. Table 7 summarizes the configurations of these interchanges, the functional classification of the surrounding minor roadways, and the types of traffic controls present.
Table 7
Interchange Configurations and Traffic Operations
Location |
Exit 57 |
Exit 58 |
Exit 59 |
Exit 60 |
Exit 61 |
Interchange Type |
Diamond |
Traffic Rotary |
Two Quadrants Adjacent |
Diamond |
Diamond (NB)/ |
Minor Roadway Functional Class |
Minor Arterial |
Principal Arterial/ Minor Arterial |
Minor Arterial |
Minor Arterial |
Minor Arterial |
Traffic Control |
Traffic Signal |
Yield to enter |
Stop/Yield |
Traffic Signal |
Traffic Signal |
NB = northbound. SB = southbound.
Source: Central Transportation Planning Staff.
Based on field observations, staff considered that the three signalized interchanges (Exits 57, 60, and 61) were more likely to cause traffic queues backing up onto the freeway. To examine the potential impacts of the traffic operations, staff requested MassDOT’s assistance in collecting AM and PM peak-period turning movement counts at the three interchanges (collected on August 4, 2021) and conducted intersection capacity analyses for the three interchanges by using the Synchro traffic analysis and simulation program.13
Appendix F contains the capacity analyses at the signalized locations in both the AM and PM peak hours for the three interchanges. In general, all the signalized locations were assessed to operate at an acceptable LOS, except the Exit 60 ramp of I-95 northbound at Salem Street in Wakefield. The signalized location was assessed to operate at LOS F, with an average delay of nearly two minutes per vehicle and a queue length of approximately 300 feet during peak traffic periods.
Note that the analyses were based on the counts collected during the period that traffic increased significantly from the spring in 2020 when the COVID-19 pandemic was prevalent. However, the traffic had not reached the pre-pandemic level, according to MassDOT’s COVID-19 traffic monitoring reports. The traffic operations at these interchanges should be reassessed when the traffic returns to the normal conditions.
MPO staff collected the recent three-year (2015–17) crash reports from the MassDOT Crash Data Portal for the selected I-95 northbound and southbound sections and conducted crash data analysis.14 In total, 463 crashes were reported in the three-year period at different locations in the study area, consisting of 206 crashes on I-95 northbound and 257 crashes on I-95 southbound. Tables 8 and 9 summarize key attributes of the total crashes in the I-95 northbound and southbound study sections separately.
Nearly 30 percent of the total crashes on the northbound side and approximately 25 percent on the southbound side caused personal injuries, including a fatal crash on the northbound side in 2015. Nearly 60 percent of the total crashes on the northbound side and nearly 70 percent on the southbound side were reported as rear-end collisions. Single vehicle (out-of-control) and sideswipe collisions (same direction) were also prevailing on the express highway in both directions.
The data indicate that 45 percent or more of the total crashes occurred during the peak traffic periods when I-95 is congested. Meanwhile, the data show that there were more crashes on the southbound side than the northbound, which may be attributed to the congestion on I-95 as the southbound is generally more congested than the northbound during the peak times of the day (see Figures 8 and 9).
Table 8
Summary of Crash Data 2015–17:
I-95 Northbound from Exit 57 to Exit 61
Statistics Period |
blank |
2015 |
2016 |
2017 |
3-Year Total |
Annual Average |
Percentage |
Total number of crashes |
83 |
47 |
76 |
206 |
68.7 |
100% |
|
Severity |
Property damage only |
52 |
37 |
57 |
146 |
48.7 |
71% |
Severity |
Non-fatal injury |
30 |
10 |
19 |
59 |
19.7 |
29% |
Severity |
Fatality |
1 |
0 |
0 |
1 |
0.3 |
0% |
Severity |
Not reported/unknown |
0 |
0 |
0 |
0 |
0.0 |
0% |
Collision type |
Single vehicle |
18 |
15 |
13 |
46 |
15.3 |
22% |
Collision type |
Rear-end |
47 |
22 |
50 |
119 |
39.7 |
58% |
Collision type |
Angle |
6 |
2 |
3 |
11 |
3.7 |
5% |
Collision type |
Sideswipe, same direction |
10 |
7 |
5 |
22 |
7.3 |
11% |
Collision type |
Sideswipe, opposite direction |
0 |
0 |
2 |
2 |
0.7 |
1% |
Collision type |
Head-on |
0 |
0 |
0 |
0 |
0.0 |
0% |
Collision type |
Rear-to-rear |
1 |
0 |
0 |
1 |
0.3 |
0% |
Collision type |
Not reported/unknown |
1 |
1 |
3 |
5 |
1.7 |
2% |
Occurred during weekday peak periods* |
38 |
19 |
35 |
92 |
30.7 |
45% |
|
Wet or icy pavement conditions |
13 |
9 |
9 |
31 |
10.3 |
15% |
|
Dark conditions (lit or unlit) |
30 |
19 |
19 |
68 |
22.7 |
33% |
|
* Peak periods are defined as 6:00–10:00 AM and 2:30–6:30 PM.
Source: Massachusetts Department of Transportation Crash Data Portal.
Table 9
Summary of Crash Data 2015–17:
I-95 Southbound from Exit 61 to Exit 57
Statistics Period |
blank |
2015 |
2016 |
2017 |
3-Year Total |
Annual Average |
Percentage |
Total number of crashes |
85 |
78 |
94 |
257 |
85.7 |
100% |
|
Severity |
Property damage only |
68 |
54 |
75 |
197 |
65.7 |
77% |
Severity |
Non-fatal injury |
17 |
24 |
19 |
60 |
20.0 |
23% |
Severity |
Fatality |
0 |
0 |
0 |
0 |
0.0 |
0% |
Severity |
Not reported/unknown |
0 |
0 |
0 |
0 |
0.0 |
0% |
Collision type |
Single vehicle |
11 |
15 |
14 |
40 |
13.3 |
16% |
Collision type |
Rear-end |
62 |
52 |
60 |
174 |
58.0 |
68% |
Collision type |
Angle |
8 |
2 |
4 |
14 |
4.7 |
5% |
Collision type |
Sideswipe, same direction |
3 |
9 |
14 |
26 |
8.7 |
10% |
Collision type |
Sideswipe, opposite direction |
0 |
0 |
0 |
0 |
0.0 |
0% |
Collision type |
Head-on |
1 |
0 |
0 |
1 |
0.3 |
0% |
Collision type |
Rear-to-rear |
0 |
0 |
1 |
1 |
0.3 |
0% |
Collision type |
Not reported/unknown |
0 |
0 |
1 |
1 |
0.3 |
0% |
Occurred during weekday peak periods* |
39 |
39 |
41 |
119 |
39.7 |
46% |
|
Wet or icy pavement conditions |
13 |
6 |
19 |
38 |
12.7 |
15% |
|
Dark conditions (lit or unlit) |
27 |
17 |
19 |
63 |
21.0 |
25% |
|
* Peak periods are defined as 6:00–10:00 AM and 2:30–6:30 PM.
Source: Massachusetts Department of Transportation Crash Data Portal.
Staff further examined the crashes by their locations in the freeway corridor. Figures 10 and 11 show the approximate crash cluster sizes and locations of the crashes in the merge, diverge, and the in-between areas at Exits 57 to 61 on I-95 northbound and southbound separately.15 Appendices G and H summarize key attributes of the crashes at each of the interchanges on I-95 northbound and southbound separately.
On the northbound side (Figure 10), Exits 57 and 58 had a number of crashes and an injury crash rate higher than the other locations. Meanwhile, Exit 60 had a relatively high number of crashes and a high injury crash rate. In general, most of the crashes occurred in the merge and diverge areas and only a few or none occurred in the in-between areas.
On the southbound side (Figure 11), all the interchanges generally had a high number of crashes but with injury crash rates somewhat lower than those on the northbound side. This may be attributed to the slower travel speeds and more congested conditions on the southbound side. Meanwhile, none or only a few crashes occurred in the in-between areas at all the interchanges and the basic freeway segment between Exit 60 and Exit 59.
Note that the data indicated that more crashes occurred in the diverge areas than the merge areas at most of the interchanges in the study area; this finding could be the result of geocoding defaults due to insufficient information of the exact crash locations.16 However, even with a smaller sample size, the data indicate that crashes in the merge areas generally had a higher injury crash rate than those in the diverge areas at almost all the interchanges.
Staff chose 2030 as the future year and projected traffic volumes for the various freeway analysis segments by using growth factors estimated from the Boston Region MPO’s regional transportation planning model. The models projected that traffic in the study area would increase by seven percent (about 0.6 percent annually) on the northbound side and six percent (about 0.55 percent annually) on the southbound side in the AM peak hour, and by six percent on the northbound and seven percent on the southbound in the PM peak hour from 2019 to 2030. Figures 12 and 13 show the projected AM and PM peak hour traffic volumes at the different locations in the study area on an average weekday in 2030.
Staff then conducted highway capacity analyses based on the projected volumes and the identified freeway segment types at each study location. Figures 14 and 15 summarize the AM and PM peak hour highway capacity analyses by segment locations in the I-95 northbound and southbound directions. Appendices I and J contain full HCS reports of the 2030 AM and PM peak-hour capacity analyses for the various study locations.
The AM peak hour analyses (Figure 14) indicate that several locations on I-95 southbound would deteriorate from LOS D to LOS E with their adjacent freeway sections near capacity under the projected 2030 traffic conditions. Noticeably, the diverge segment at Exit 57 (Segment 3), the diverge segment at Exit 58 (Segment 6), and the merge segment at Exit 59 (Segment 7) would operate at LOS E with the adjacent freeway sections at capacity. Moreover, the merge segments at Exit 57 (Segment 1) and at Exit 58 (Segment 4) would fail at LOS F with the volume-to-capacity ratio of the adjacent freeway sections equal to 1.01.
The PM peak hour analyses (Figure 15) indicate that many merge and diverge segments on both I-95 northbound and southbound would deteriorate from LOS D to LOS E. Noticeably, in the peak direction (northbound) the merge segment at Exit 57 (Segment 3) and the diverge and merge segments at Exit 58 (Segments 4 and 6) would operate at LOS E with the adjacent freeway sections reaching capacity limits.
The analyses described in the previous chapter identified locations in the study area with operational and safety concerns. Most of them are in the merge and diverge segments where the lengths of the acceleration and deceleration areas are insufficient. Localized bottlenecks can develop at these locations when the freeway mainline sections are congested during the peak hours.
For these locations, extending the acceleration or deceleration length is one effective low-cost strategy if the adjacent terrain is suitable and the right-of-way of the freeway is sufficient. Meanwhile, for locations where the entrance and exit ramps at interchanges are closely spaced, operational efficiency may be improved by creating a continuous auxiliary lane between the entrance and exit ramps.17
The sections of I-95 studied are generally located in level terrain with sufficient right-of-way, especially on the southbound side. Based on the projected 2030 traffic volumes, MPO staff conducted a series of highway capacity analyses to assess the potential application of these improvement strategies at the various study locations. Staff identified five locations on I-95 southbound and three on I-95 northbound that have potential for such low-cost improvements.
The locations and proposed low-cost improvements at the five locations on I-95 southbound are as follows:
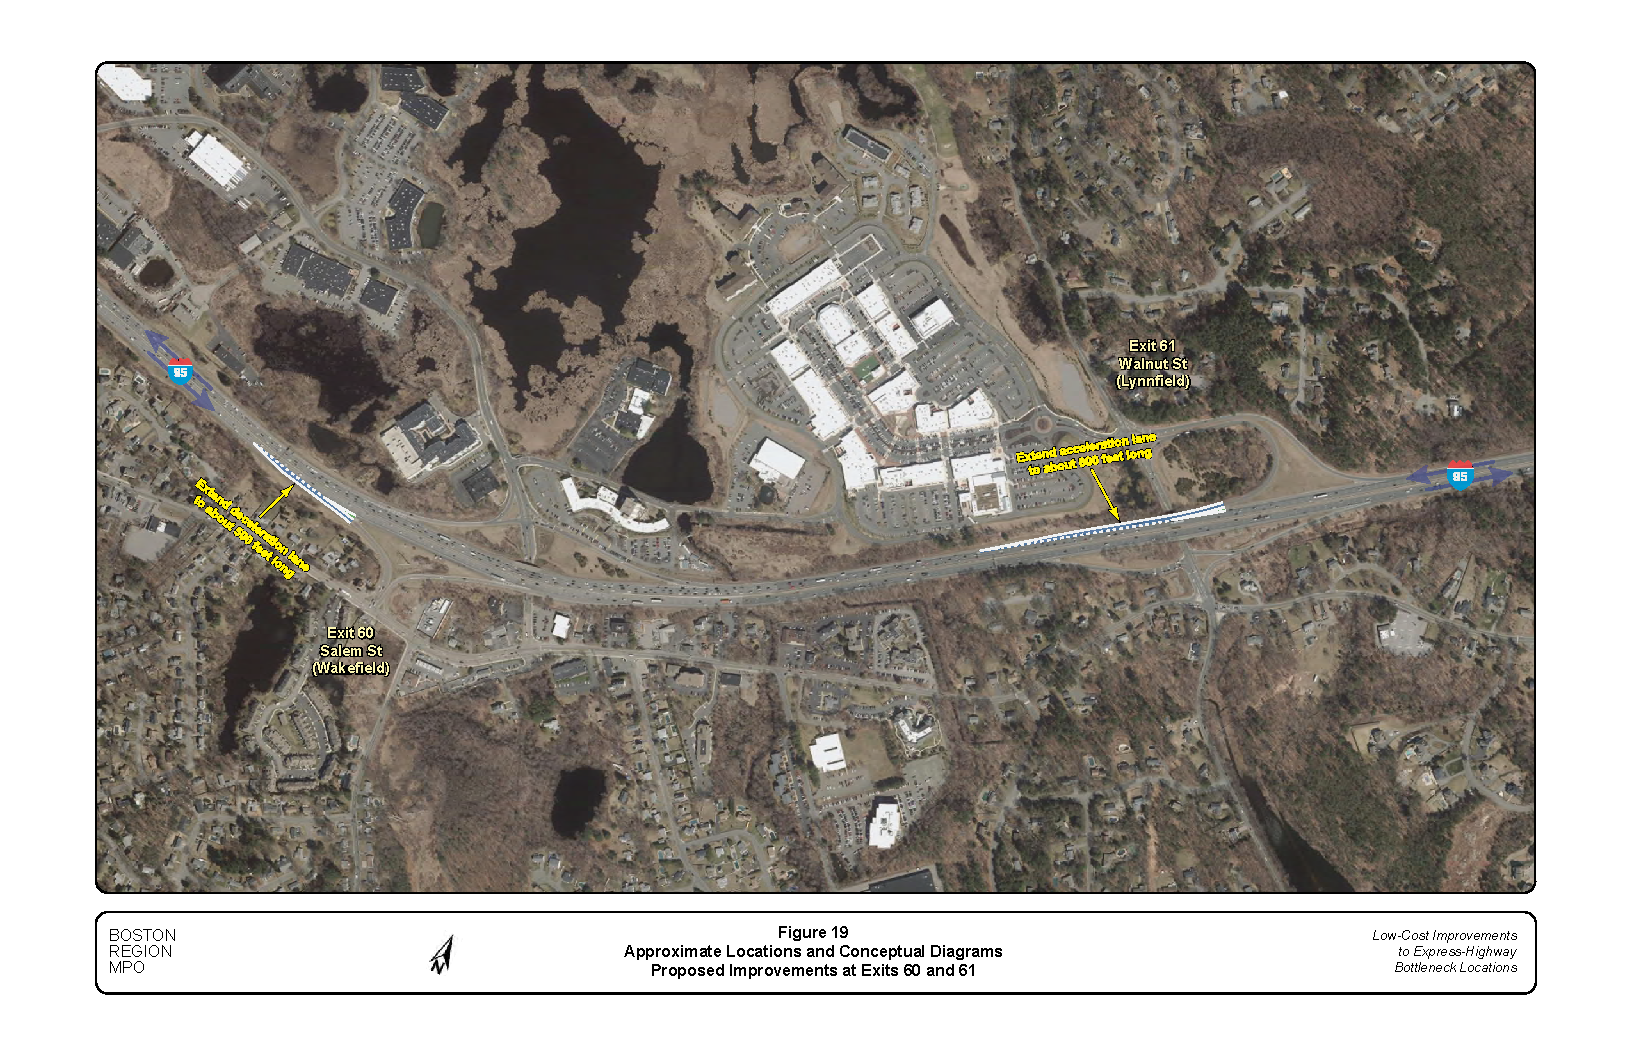
Figures 16 and 17 summarize the AM and PM peak hour highway capacity analyses at the locations proposed for improvements on I-95 southbound and northbound. For reference, they also include the capacity analyses under the 2030 no-build scenario at locations with no proposed improvements. Appendices K and L contain full HCS reports of 2030 AM and PM peak hour capacity analyses for the locations proposed for improvements. Figures 18 and 19 show the approximate locations and conceptual diagrams of the proposed low-cost improvements in the study area.
At Location 1, the section between the Exit 58 entrance ramp and Exit 57 exit ramp (Figure 18), the two ramps are located in close proximity (approximately 1,600 feet apart).18 Further extending the acceleration or deceleration length and reducing the space in between would potentially increase the risk of crashes.19 HCS tests of different deceleration and acceleration lengths also indicated that extensive lengths would require improvements to the diverging operation at Exit 58 and the merging operation at Exit 57, which are not possible in this relatively short section.
Thus, the proposed recommendation from this study is to expand the existing paved shoulder and create a 12-foot auxiliary lane with a 10-foot shoulder between the two ramps. A review of the digital orthophotos and highway layouts of the area indicated that there should be sufficient space for expansion. At the design stage of an improvement project, when there is more precise geometry information, a 12-foot shoulder should be considered if the available space can accommodate it.20
With the proposed auxiliary lane, the section between the two ramps would become a highway weaving segment that could facilitate the merging operation for drivers entering from Exit 58 and the positioning and diverging operation for drivers moving toward Exit 57. The capacity analyses for the proposed weaving segment (Location 1 on I-95 southbound in Figures 16 and 17) indicated that traffic operations during both the AM and PM peak hours at this location would significantly improve to the desirable LOS D from the undesirable LOS F or at-capacity LOS E under the merging and diverging operations in the no-build scenario (Segments 3 and 4 on I-95 northbound in Figures 14 and 15).
In addition, the proposed improvement would reduce the number of crashes and improve safety for freeway users at this location. A crash modification factor (CMF) is an estimate of the change in the number crashes expected after the implementation of a countermeasure. Applying CMFs from the Highway Safety Manual (HSM) and the CMF Clearinghouse show that adding continuous auxiliary lanes for weaving between the entrance ramp and the exit ramp would generally reduce crashes by 20 to 25 percent.21
For other locations on I-95 southbound (Locations 2, 3, 4, and 5), the recommendations from this study are to extend the deceleration or acceleration lengths for the respective diverging and merge segments. The recommended lengths would depend on the adjacent terrain and development conditions.
The highway capacity analyses with the proposed improvements (Figures 16 and 17) indicated that traffic operations at these locations would improve to the desirable LOS D from the near- or at-capacity LOS E under the 2030 no-build scenario.
More importantly, the proposed improvements would reduce the number of crashes and improve safety for freeway users at these locations, especially at Location 3 (Exit 59) and Location 5 (Exit 61) where drivers enter the freeway via a loop on-ramp with a limited sight distance and a relatively short acceleration lane. Applying CMFs for lengthening an acceleration lane showed that the proposed acceleration lane extensions would reduce crashes at the merge areas by 10 to 20 percent.
Implementing the proposed improvement at Location 1 (Exit 58–Exit 57) would require widening, resurfacing, and restriping the shoulder and its adjacent areas between the entrance ramp at Exit 58 and the exit ramp at Exit 57. No right-of-way acquisition or major alignment modifications would be required other than realignment of the adjacent travel lane, adding pavement markings, and relocating existing guide signs or installing new guide signs. The proposed improvement is estimated to cost between $500,000 and $750,000 to construct.22
Implementing the proposed improvements at Locations 2, 3, 4, and 5 would require mainly restriping the areas near the exit and/or entrance ramps at Exits 58, 59 and 61, with minor widening of the adjacent shoulders if necessary. No right-of-way acquisition or alignment modifications would be required other than adding pavement markings and relocating existing guide signs or installing new guide signs. The proposed improvements are estimated to cost between $50,000 and $100,000 per location to construct, depending on the length of the acceleration or deceleration lane extensions and the conditions of the adjacent areas.
Unlike the southbound side, the areas adjacent to I-95 northbound generally have more constraints. These constraints include slopes and wooded areas, adjacent residential and commercial developments, and a series of sound barriers running along the shoulder area between Exit 59 and Exit 60. As such, only three locations were identified as suitable for low-cost improvements. The locations and proposed low-cost improvements are as follows:
The conditions at Location 1 are similar to its counterpart on the southbound side. The Exit 57 entrance ramp and Exit 58 exit ramp are located in close proximity (approximately 1,750 feet apart). Further extending the acceleration and deceleration lengths at the entrance and exit ramps is not adequate and would potentially increase the risk of crashes.
Thus, the proposed recommendation of this study is to expand the existing paved shoulder and create a 12-foot auxiliary lane with a six-foot shoulder between the two ramps (see Figure 18). The capacity analyses for the proposed weaving segment (Location 1 on I-95 northbound in Figures 16 and 17) indicated that traffic operations at this location would significantly improve during both the AM and PM peak hours to the desirable LOS D from the undesirable, near- or at-capacity LOS E under the merging and diverging operations in the no-build scenario (Segments 3 and 4 on I-95 northbound in Figures 14 and 15).
In addition, the proposed improvement would reduce the number of crashes and improve safety for freeway users at this location. Applying CMFs from the HSM and the CMF Clearinghouse show that adding continuous auxiliary lanes for weaving between the entrance ramp and the exit ramp would generally reduce crashes by 20 to 25 percent.
A review the digital orthophotos indicated that the areas next to the shoulder are slightly sloping toward the south. To widen the shoulder area for adding the auxiliary lane, minor widening of the adjacent areas may be required. At minimum, a six-foot wide shoulder is currently recommended. When more information is available at the project design stage, a 10-to-12-foot shoulder should be considered.
For Location 2 (Exit 58) and Location 3 (Exit 60) on I-95 northbound, the recommendation from this study is to extend the acceleration length for the merge terminal at Exit 58 and the deceleration length in for the diverge terminal at Exit 60.
The highway capacity analyses with the proposed improvements (Figures 16 and 17) indicated that traffic operations at the two locations would improve to the desirable LOS D from the near- or at-capacity LOS E under the 2030 no-build scenario. In addition, the proposed improvement would reduce the number of crashes and improve safety for freeway users at these locations. Applying CMFs for lengthening an acceleration lane showed that the proposed acceleration lane extensions would reduce crashes at each of the two locations by 10 to 20 percent.
Implementing the proposed improvement at Location 1 would require widening, resurfacing, and restriping the shoulder and its adjacent areas between the entrance ramp at Exit 57 and the exit ramp at Exit 58. No right-of-way acquisition or major alignment modifications would be required other than realignment of the adjacent travel lane, addition of pavement markings, relocation of existing guide signs or installation of new guide signs, and potential minor modifications of the slope areas next to the shoulder. The proposed improvement is estimated to cost between $750,000 and $1,000,000 to construct.
Implementing the proposed improvements at Locations 2 and 3 would require mainly restriping the areas near the entrance ramp at Exit 58 and the exit ramp at Exit 60, with minor widening of the adjacent shoulders if necessary. No right-of-way acquisition or major alignment modifications would be required other than adding pavement markings and relocating existing guide signs or installing new guide signs. The proposed improvement at Location 2 is estimated to cost between $75,000 and $125,000 to construct. The proposed improvement at Location 3 is estimated to cost between $50,000 and $100,000 to construct due to minor modifications of the adjacent slope area may be necessary.
In this study, the MPO staff performed a series of operational and safety analyses for the bottleneck locations on the northbound and southbound sections of I-95 between Exit 57 and Exit 61. Low-cost improvements were then recommended for several locations on I-95 northbound and southbound:
This study provides the MassDOT Highway Division with an opportunity to assess the most critical needs in the study area and to start planning design and engineering efforts. The sections between Exits 57 and 58, particularly on I-95 southbound, were considered priority locations. The implementation of improvements to priority locations would depend on available resources and further evaluations at the project design stage.
The MPO staff conducted this study in conjunction with MassDOT staff as part of the ongoing work to identify, develop, and evaluate improvements to bottleneck locations in the Boston region. The study aligns with the MPO’s goals of managing capacity and improving mobility and safety on the region’s highway system. If implemented, these low-cost improvements would improve the freeway facilities, make traffic operations more efficient, reduce congestion at the identified bottleneck locations, reduce crashes, and improve safety for the freeway users.
Figure 1
Study Area Map
Figure 2
Freeway Segments under Analysis
Figure 3
Estimated Daily Traffic Volumes: 2019 Average Weekday
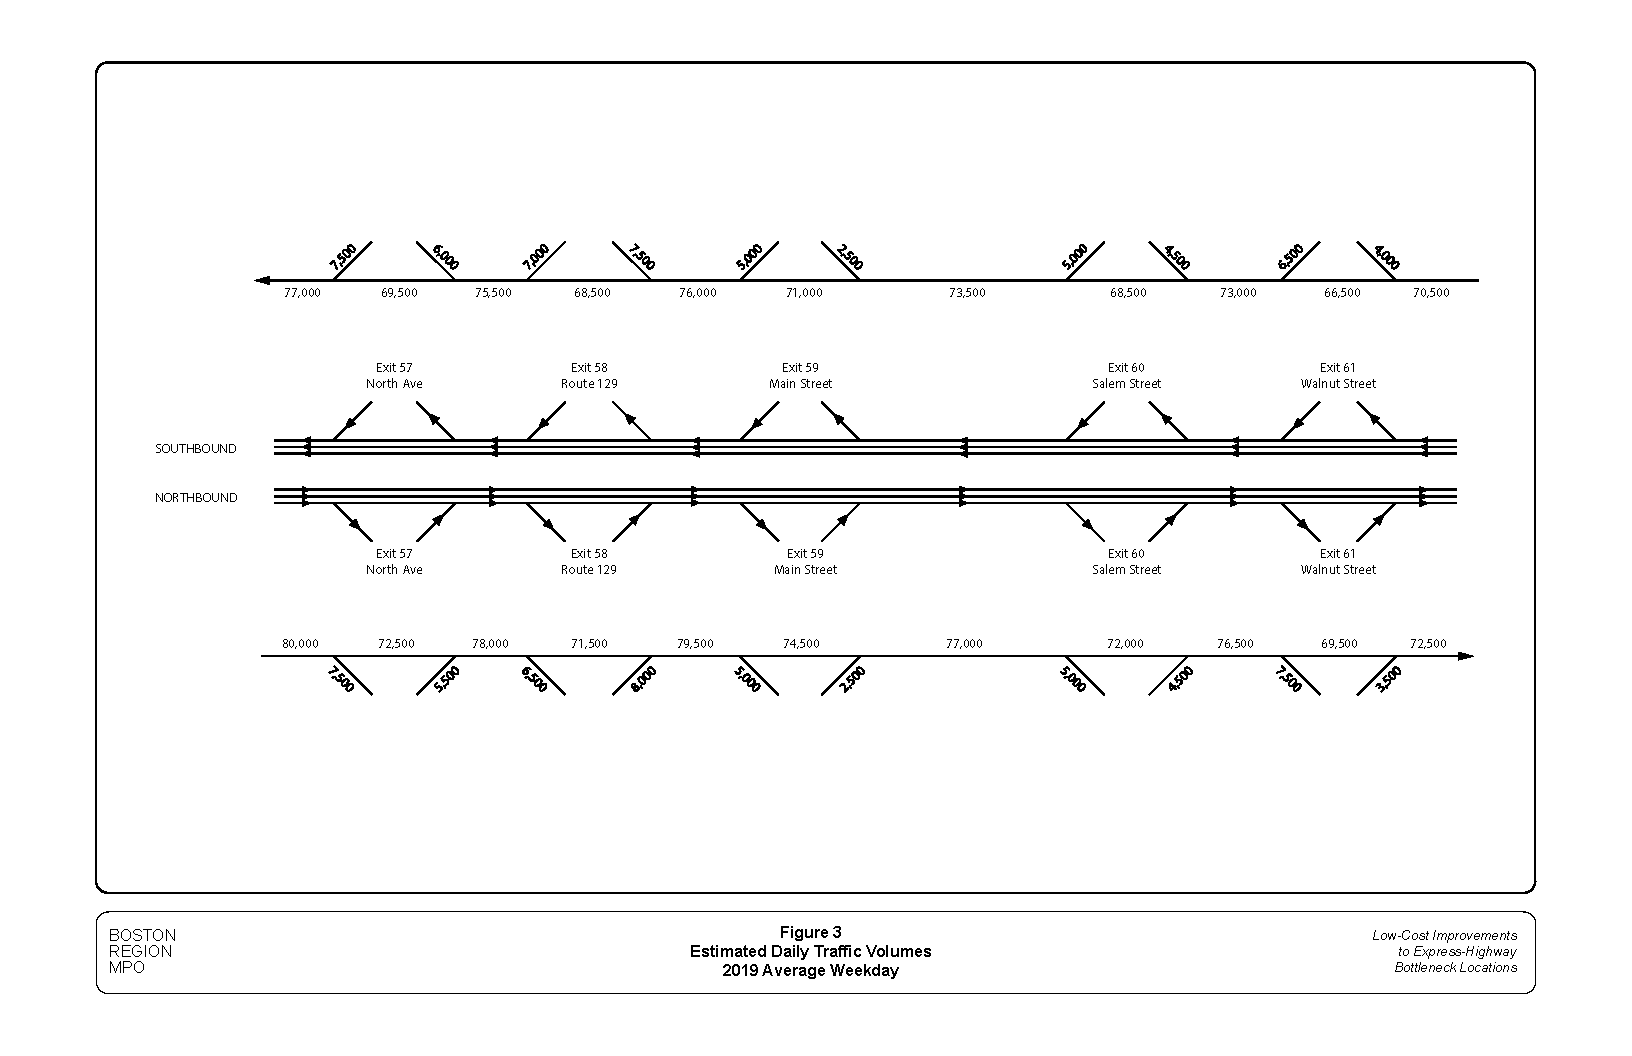
Figure 4
Estimated AM Peak-Hour Traffic Volumes: 2019 Average Weekday
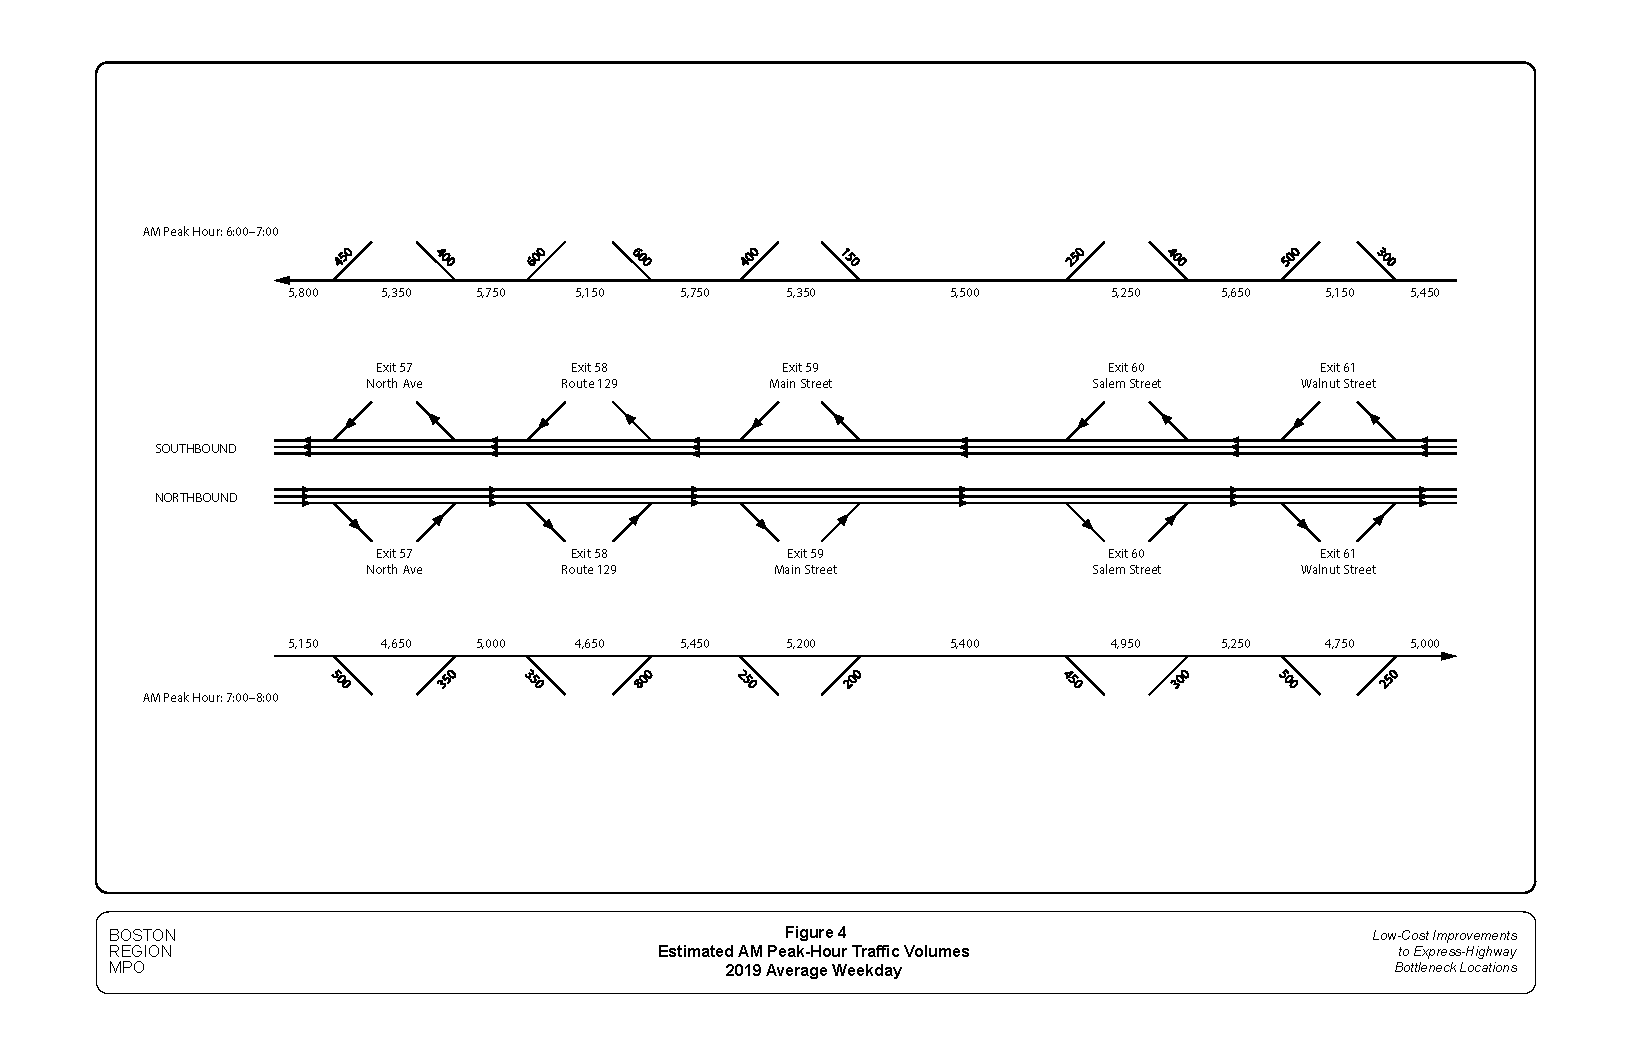
Figure 5
Estimated PM Peak-Hour Traffic Volumes: 2019 Average Weekday
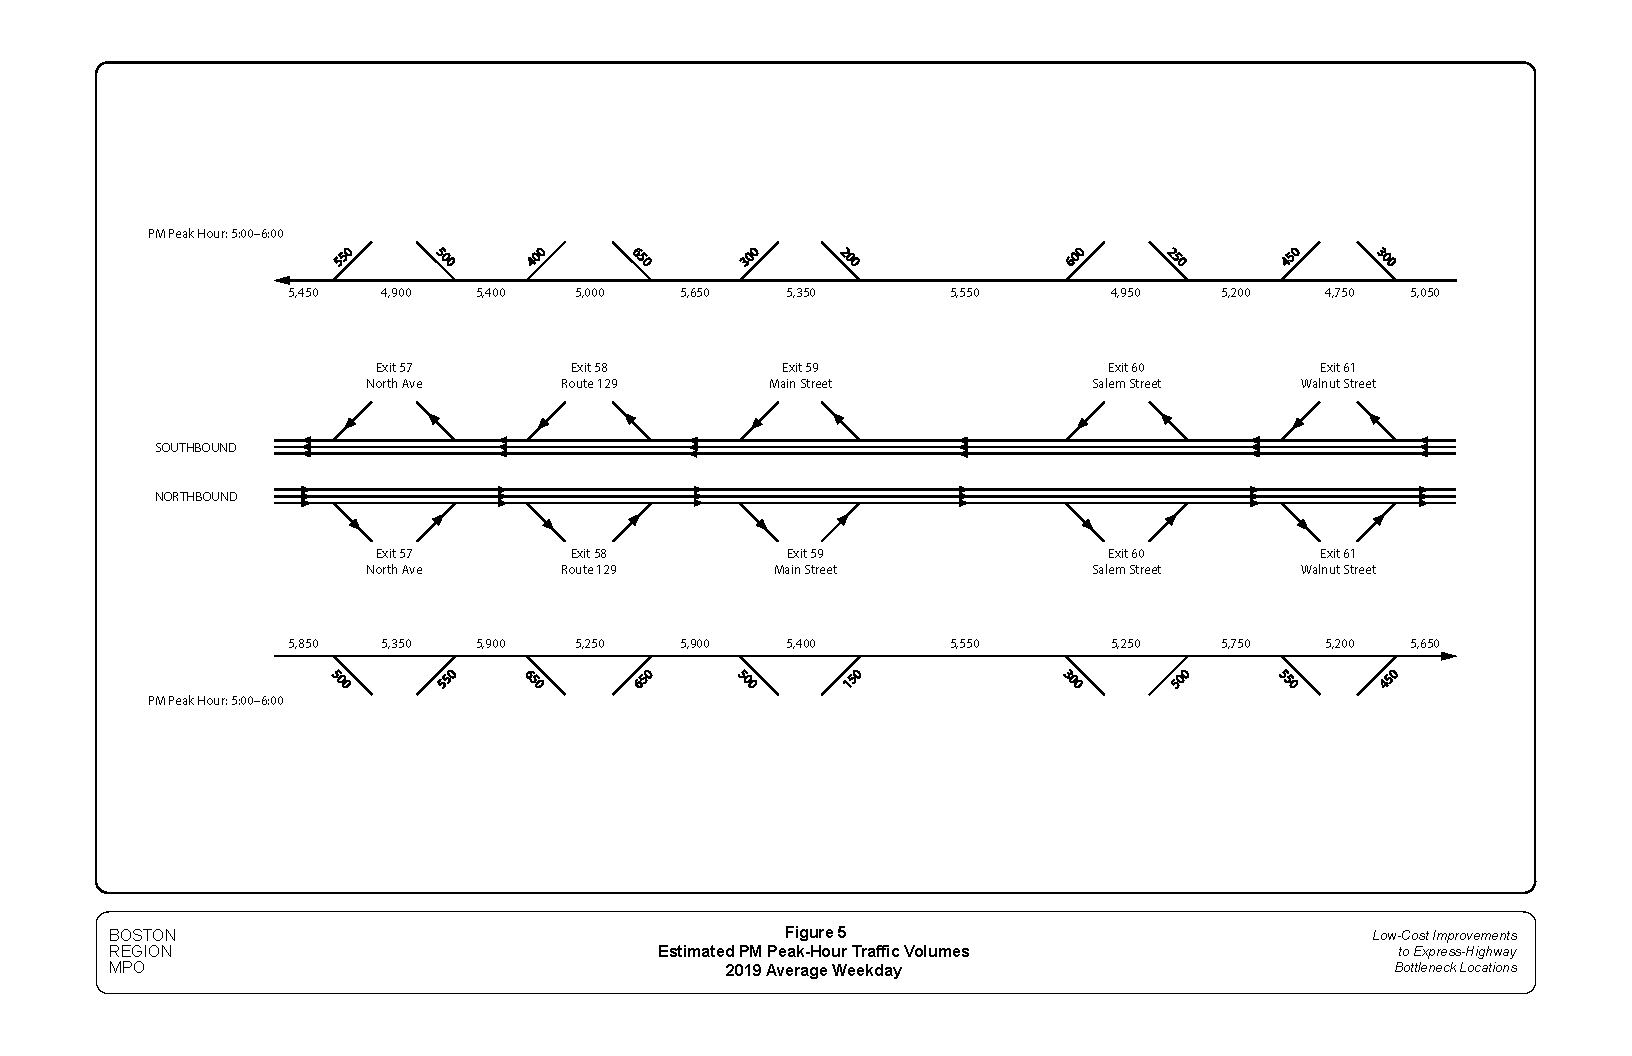
Figure 6
AM Peak-Hour Highway Capacity Analyses: 2019 Average Weekday
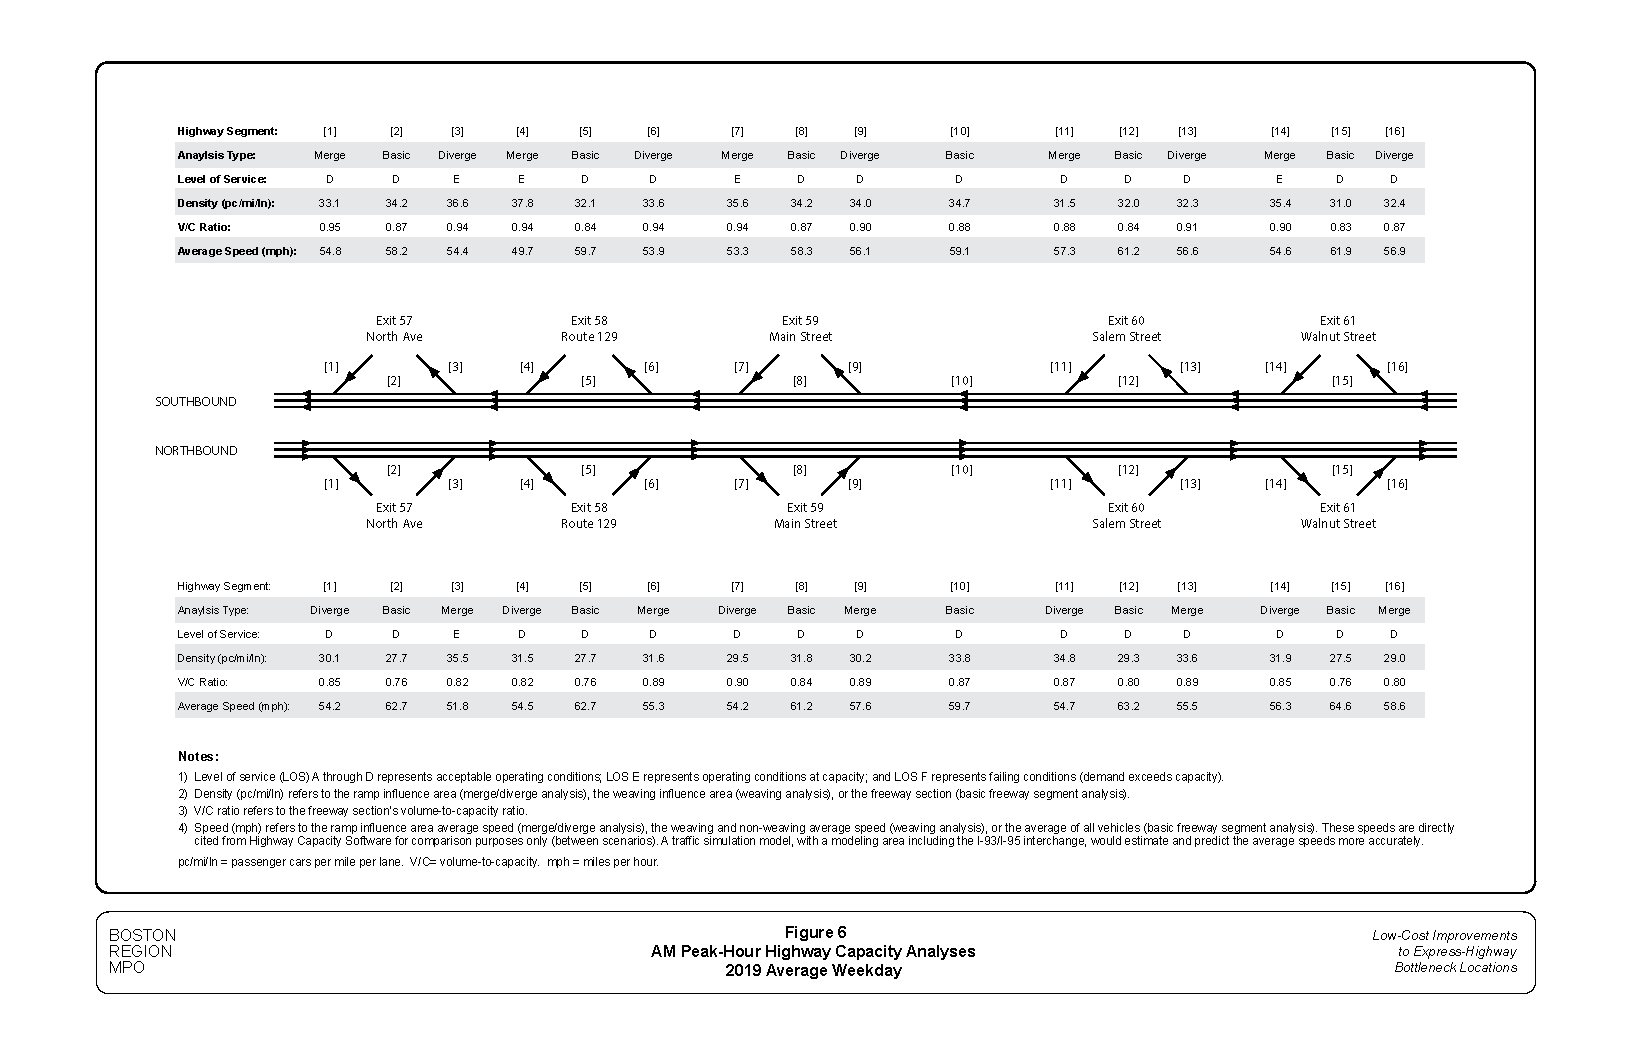
Figure 7
PM Peak-Hour Highway Capacity Analyses: 2019 Average Weekday
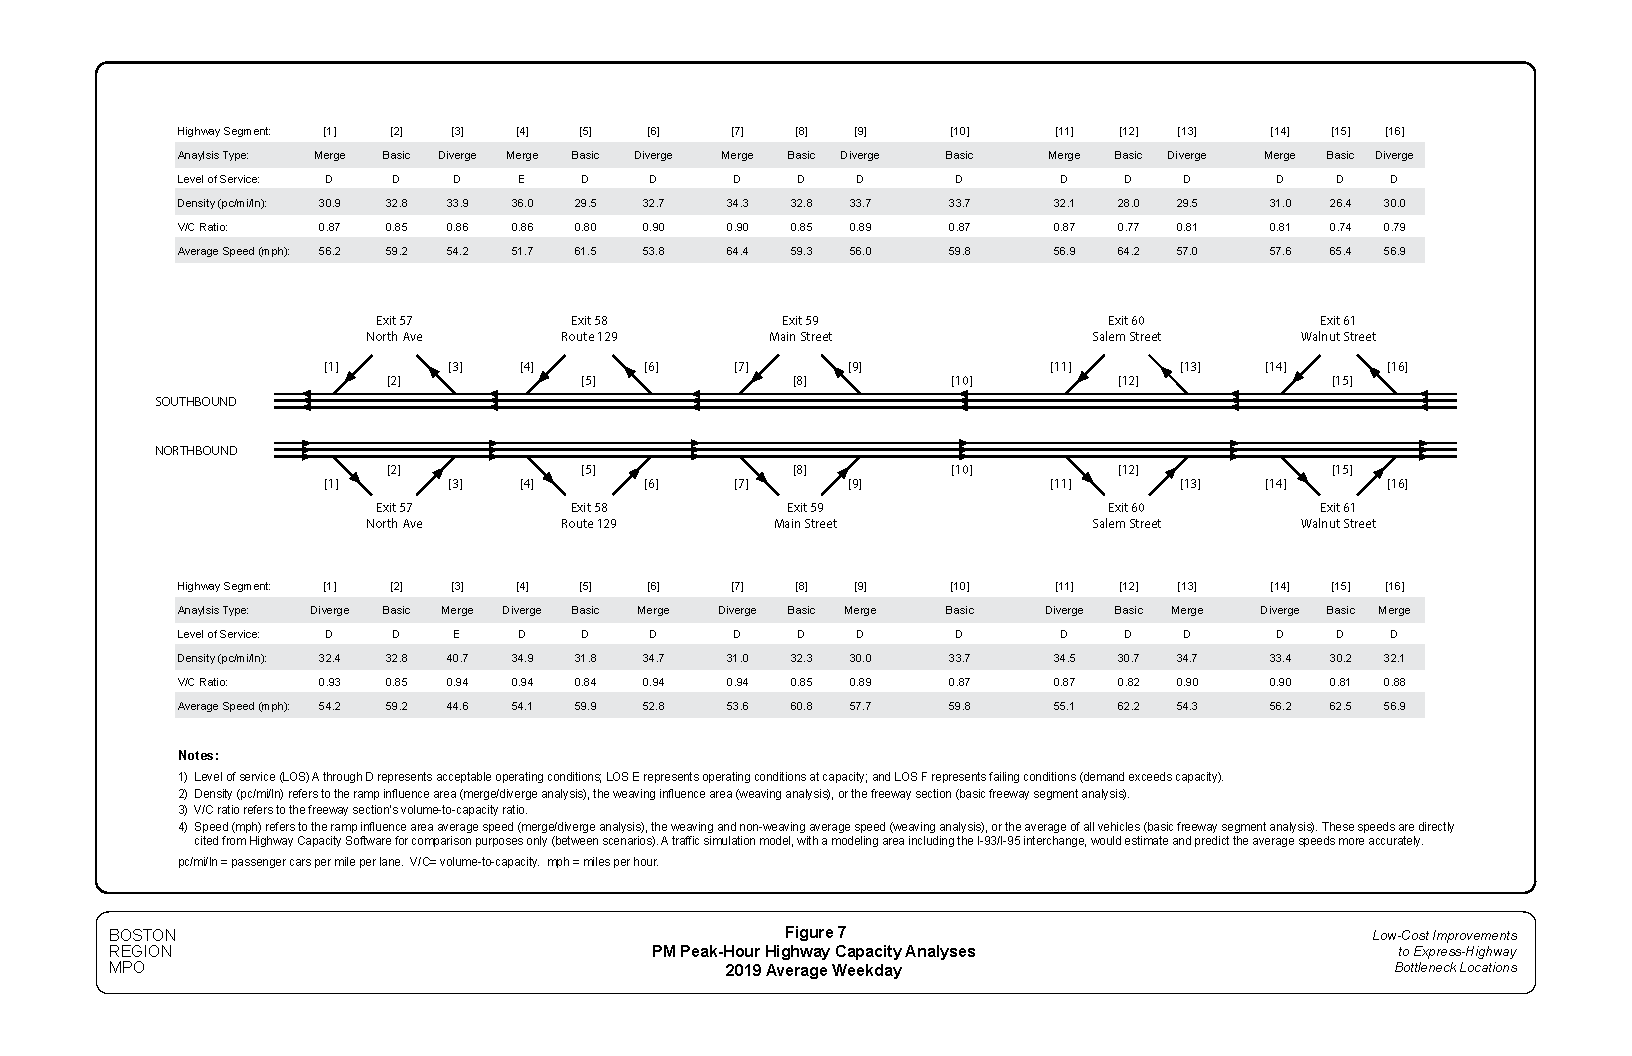
Figure 8
Freeway Congestion Scan: I-95 Northbound
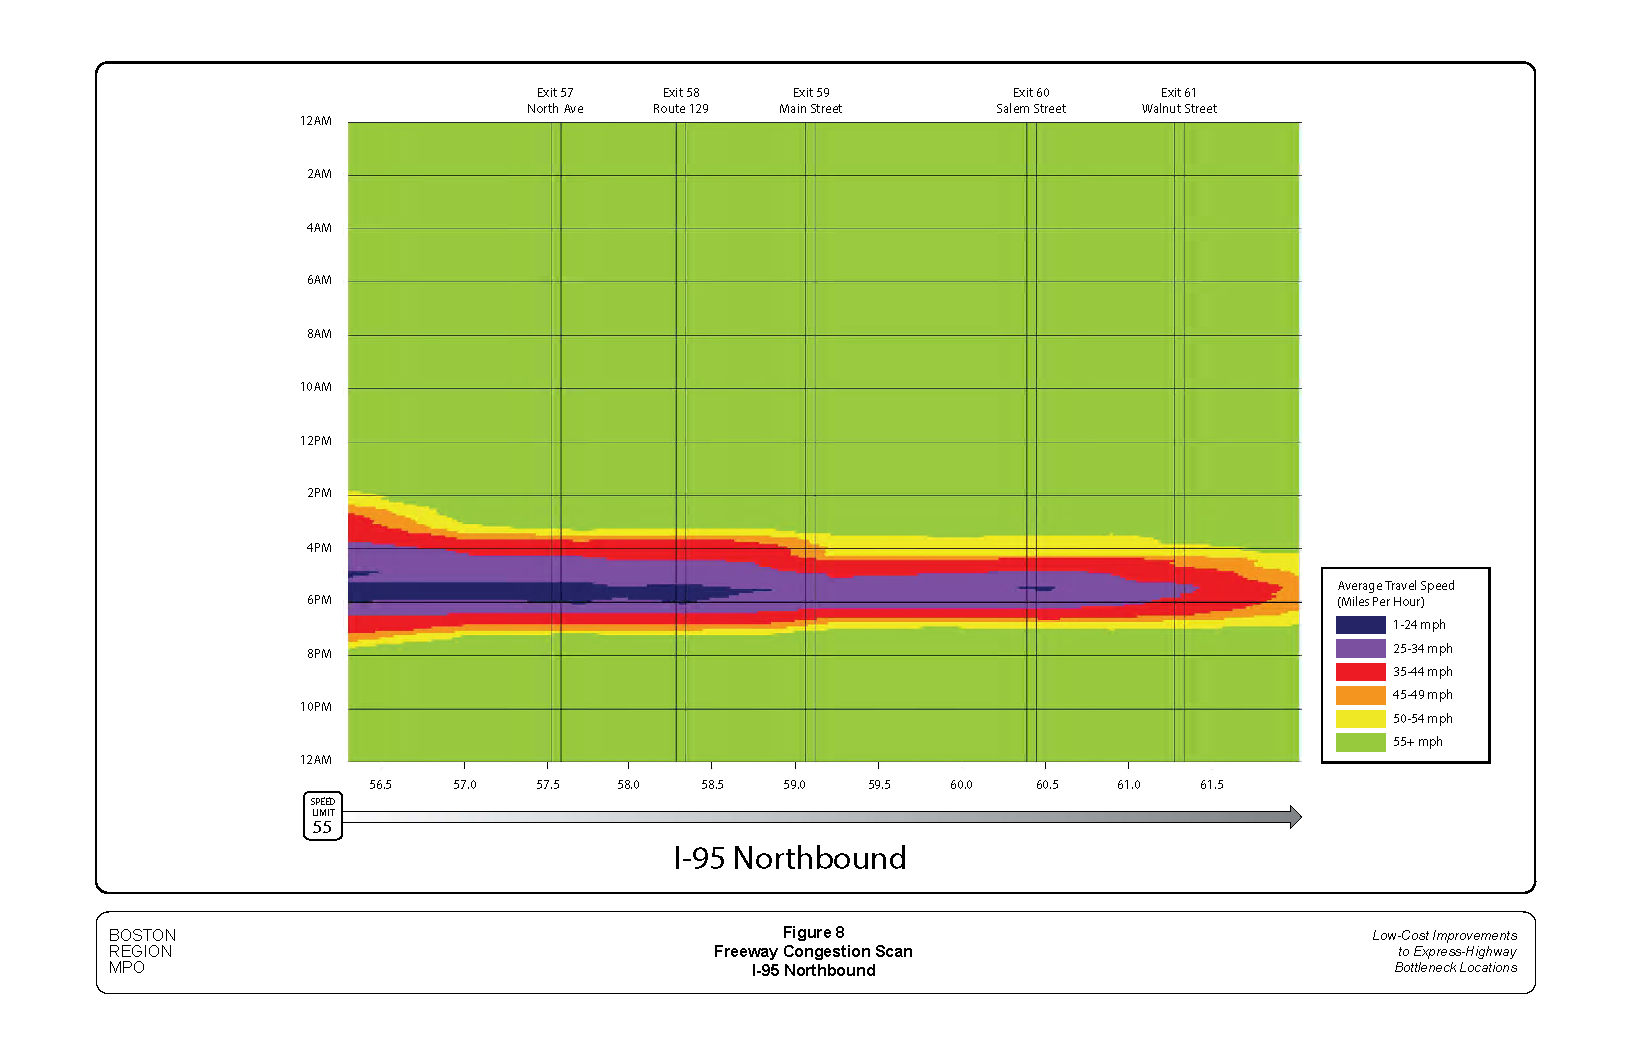
Figure 9
Freeway Congestion Scan: I-95 Southbound
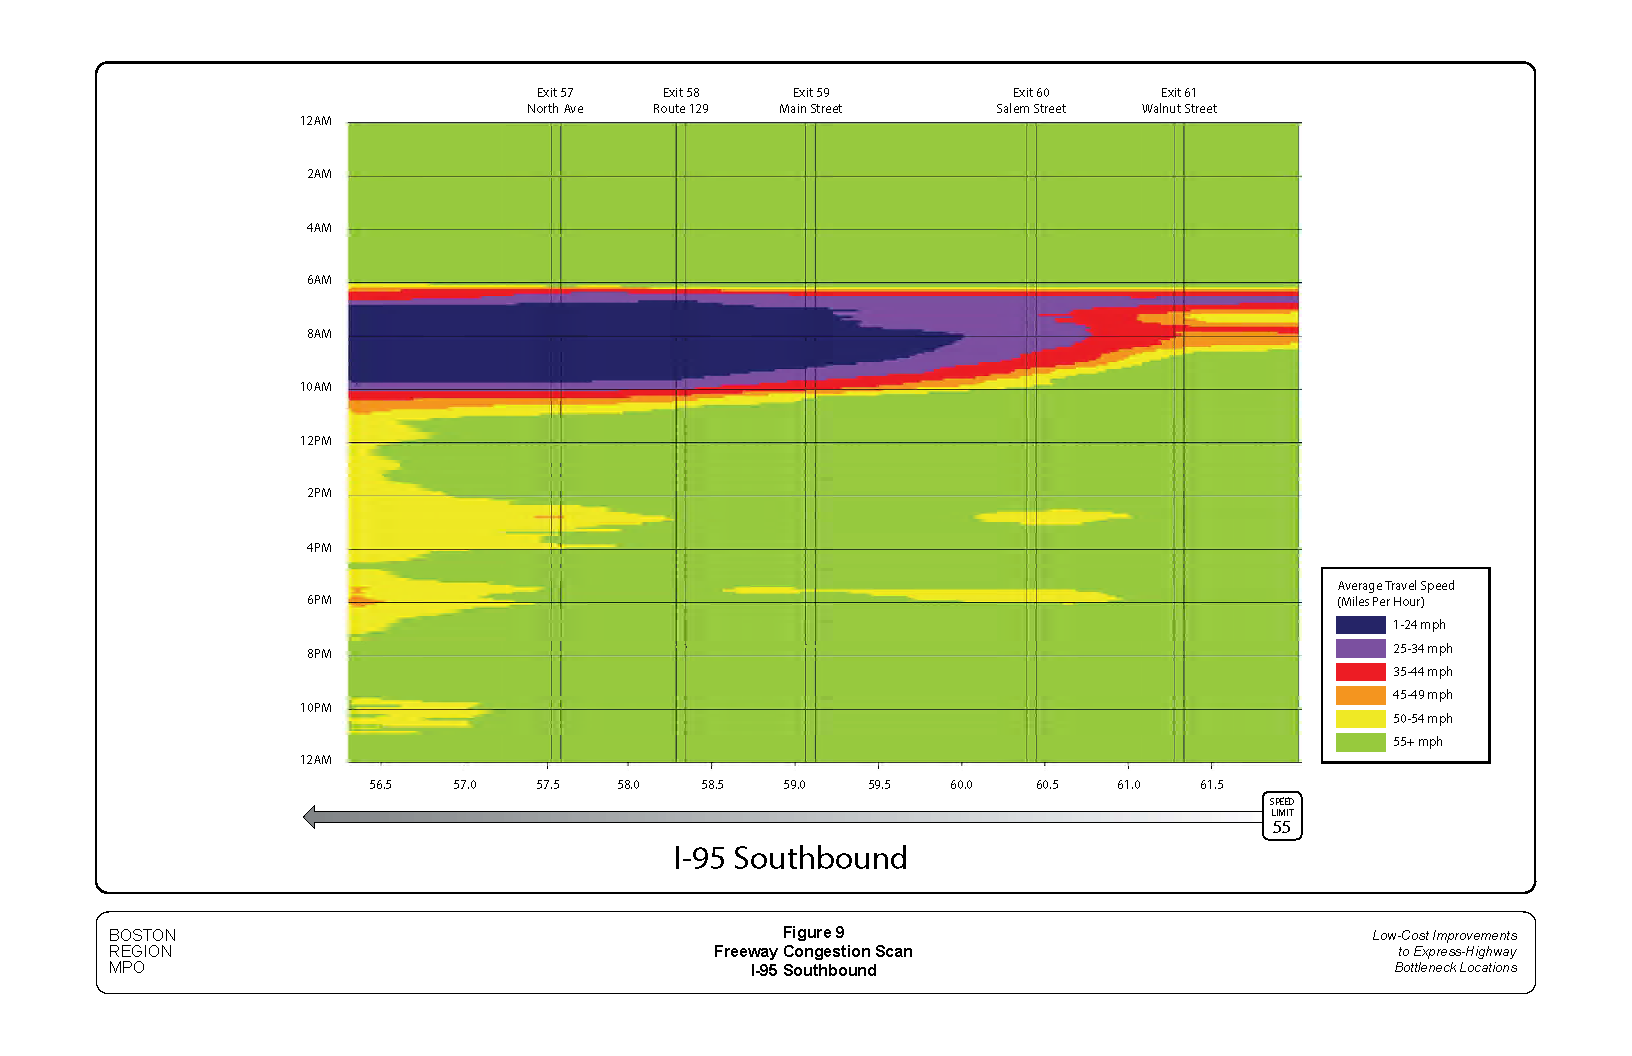
Figure 10
Crashes on I-95 Northbound from Exit 57 to Exit 61: MassDOT Crash Data 2015–17
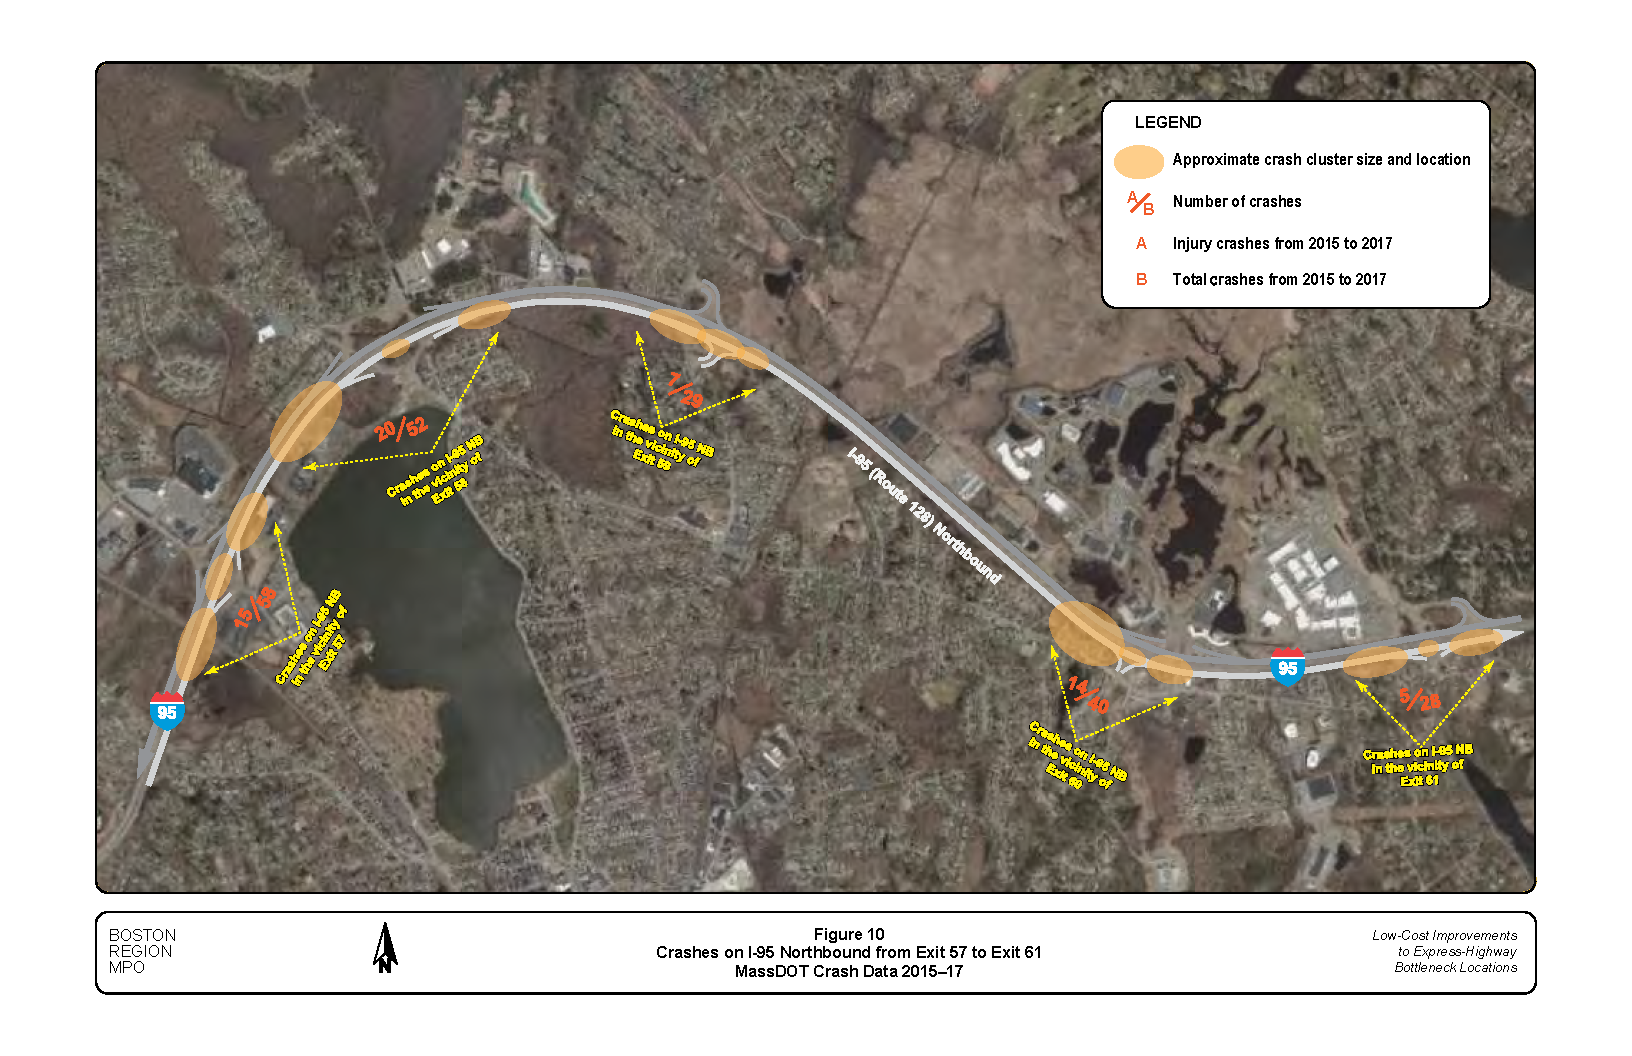
Figure 11
Crashes on I-95 Southbound from Exit 61 to Exit 57: MassDOT Crash Data 2015–17
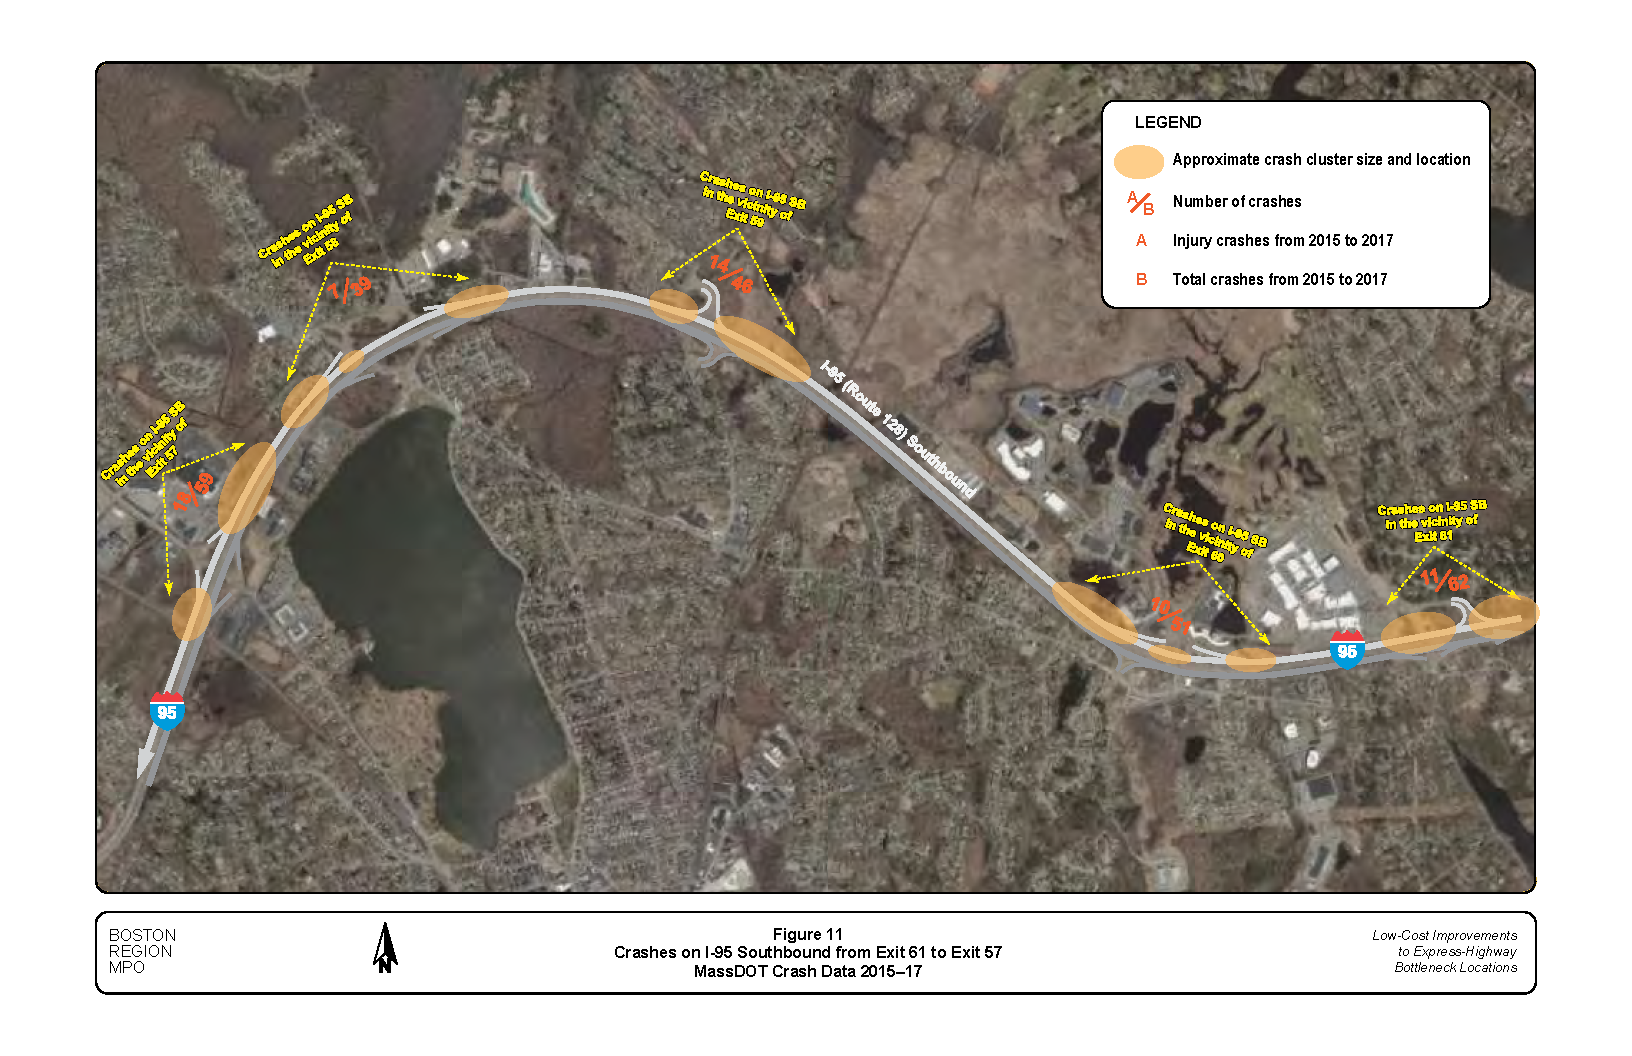
Figure 12
Projected AM Peak-Hour Traffic Volumes: 2030 Average Weekday

Figure 13
Projected PM Peak-Hour Traffic Volumes: 2030 Average Weekday
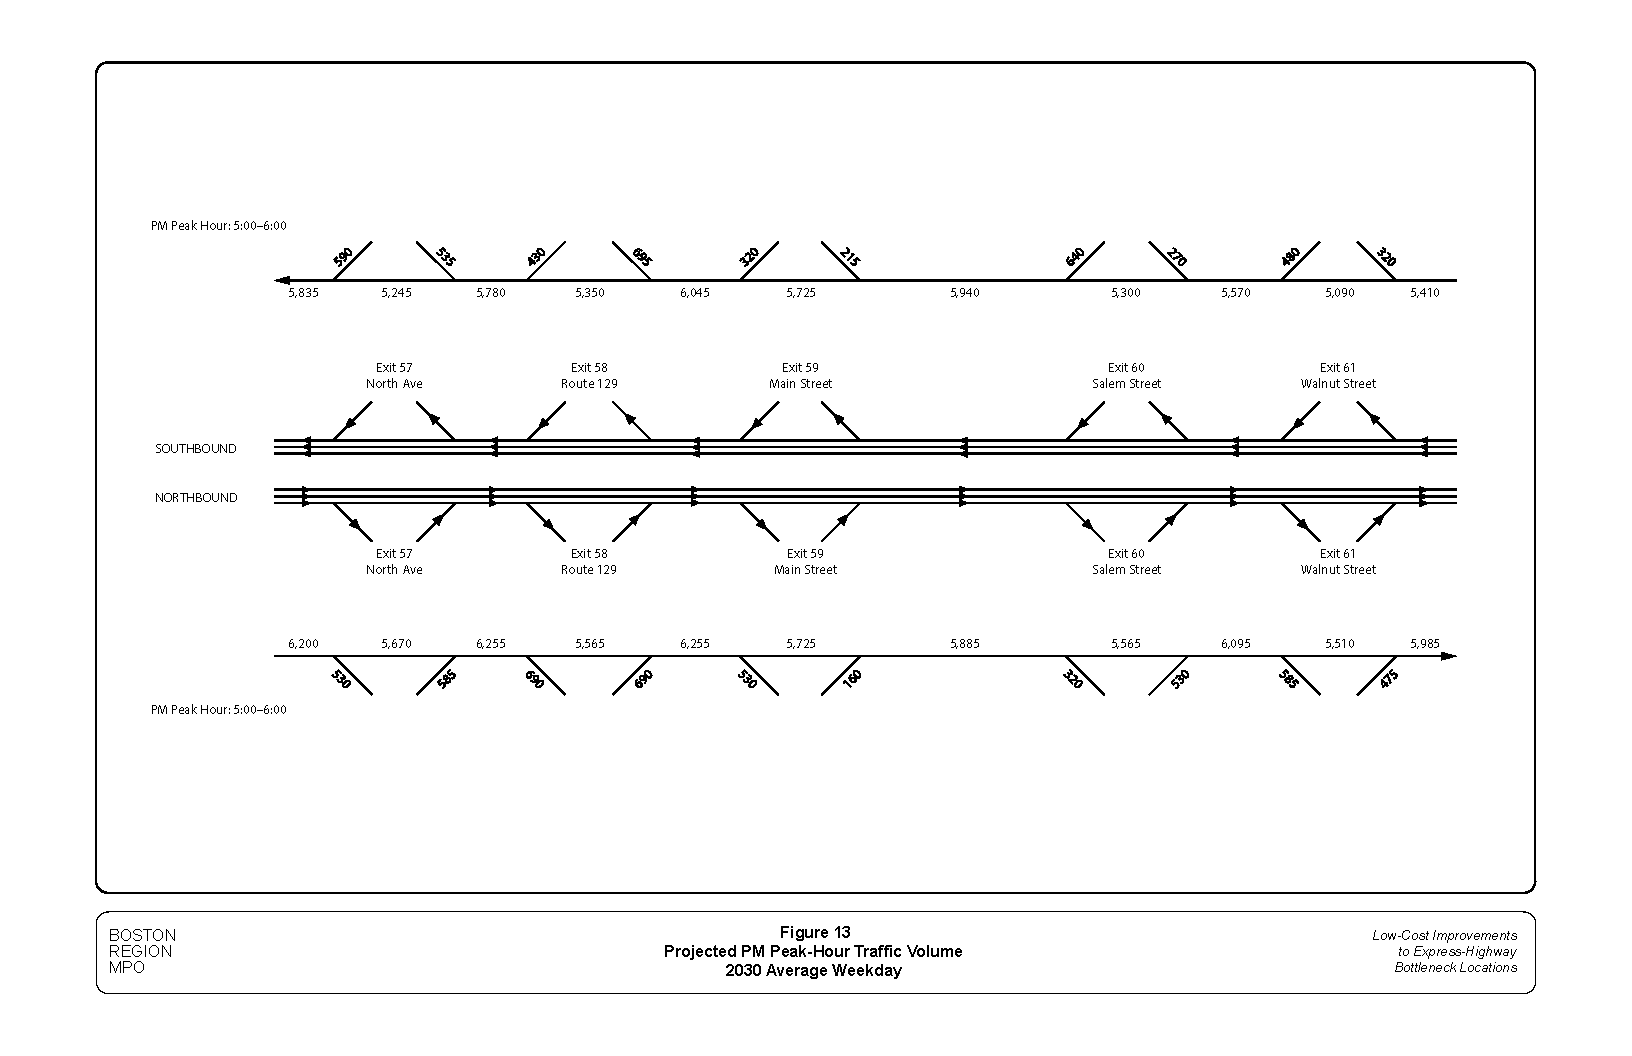
Figure 14
AM Peak-Hour Highway Capacity Analyses: 2030 No-Build Scenario
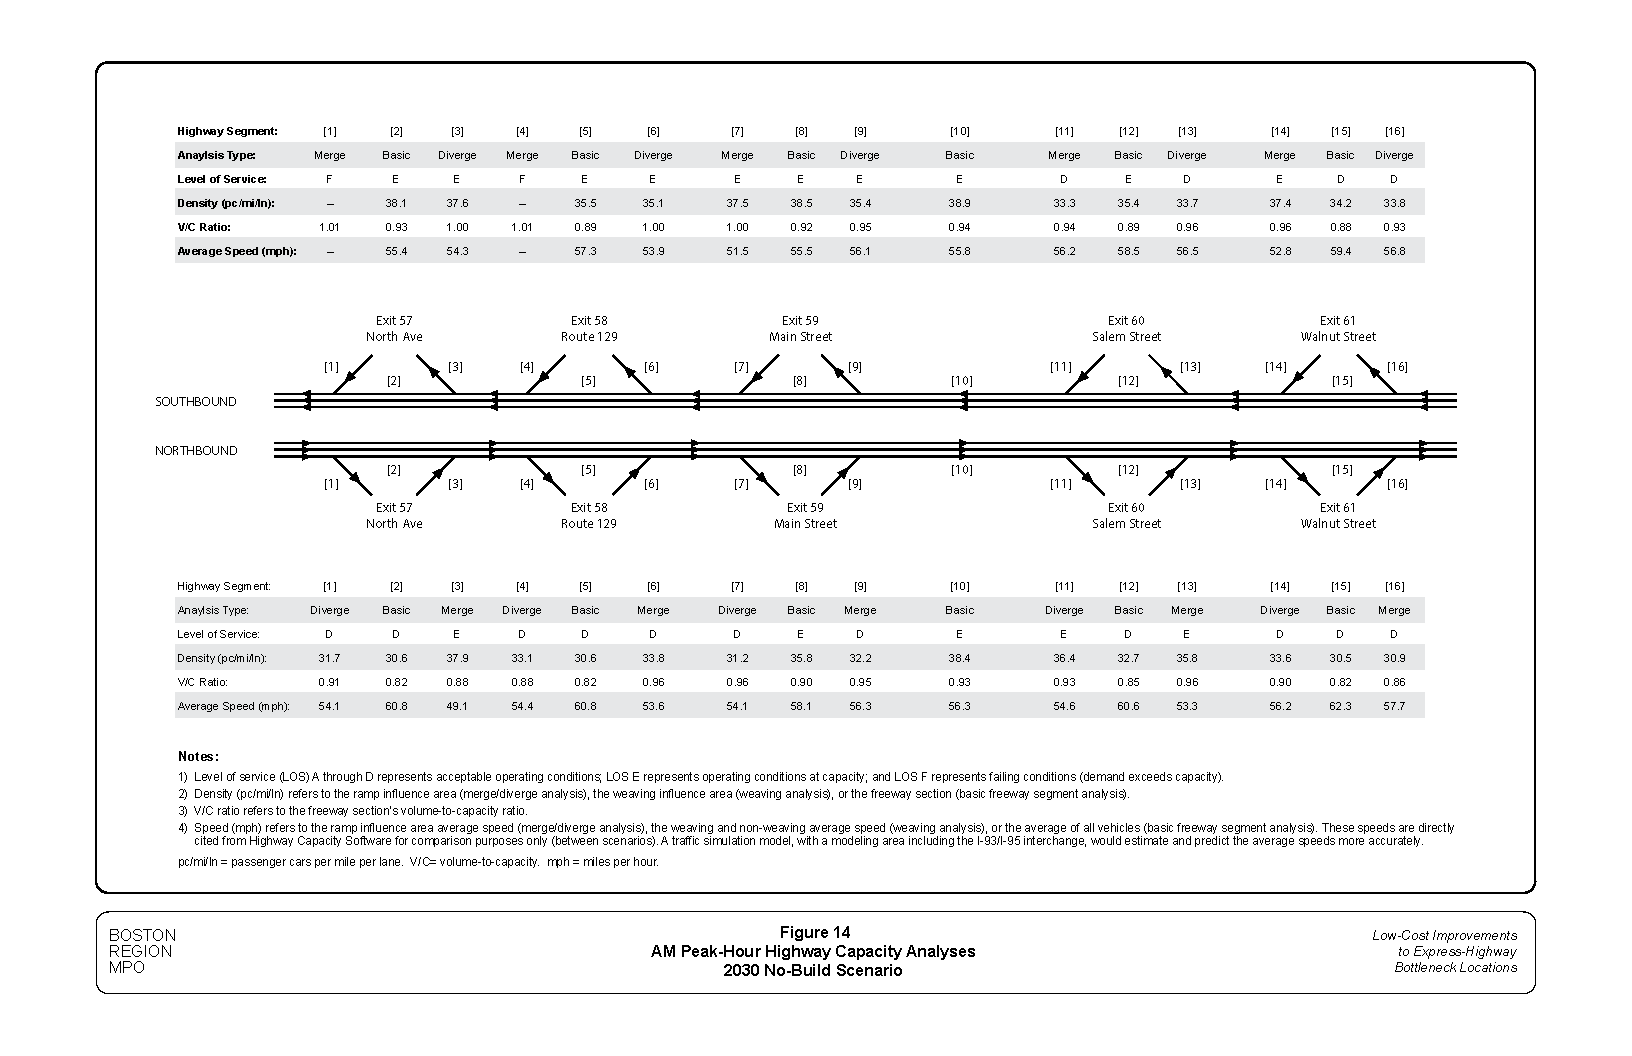
Figure 15
PM Peak-Hour Highway Capacity Analyses: 2030 No-Build Scenario

Figure 16
AM Peak-Hour Highway Capacity Analyses: 2030 Proposed Improvements Scenario
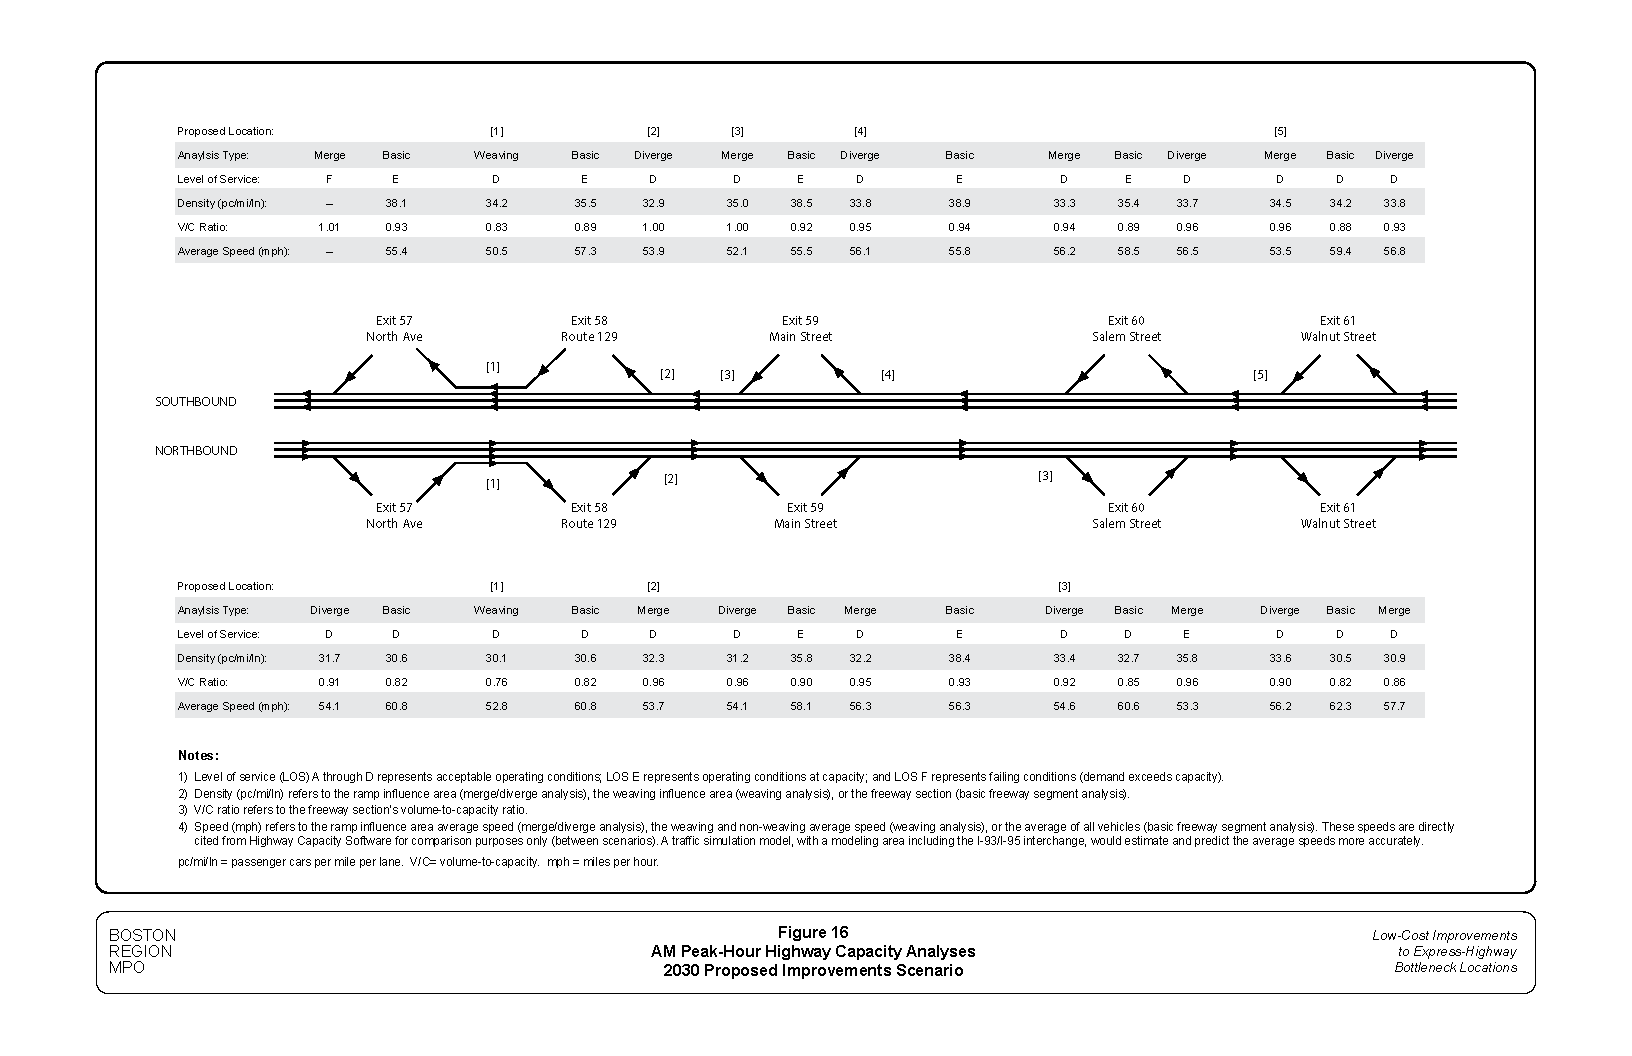
Figure 17
PM Peak-Hour Highway Capacity Analyses: 2030 Proposed Improvements Scenario
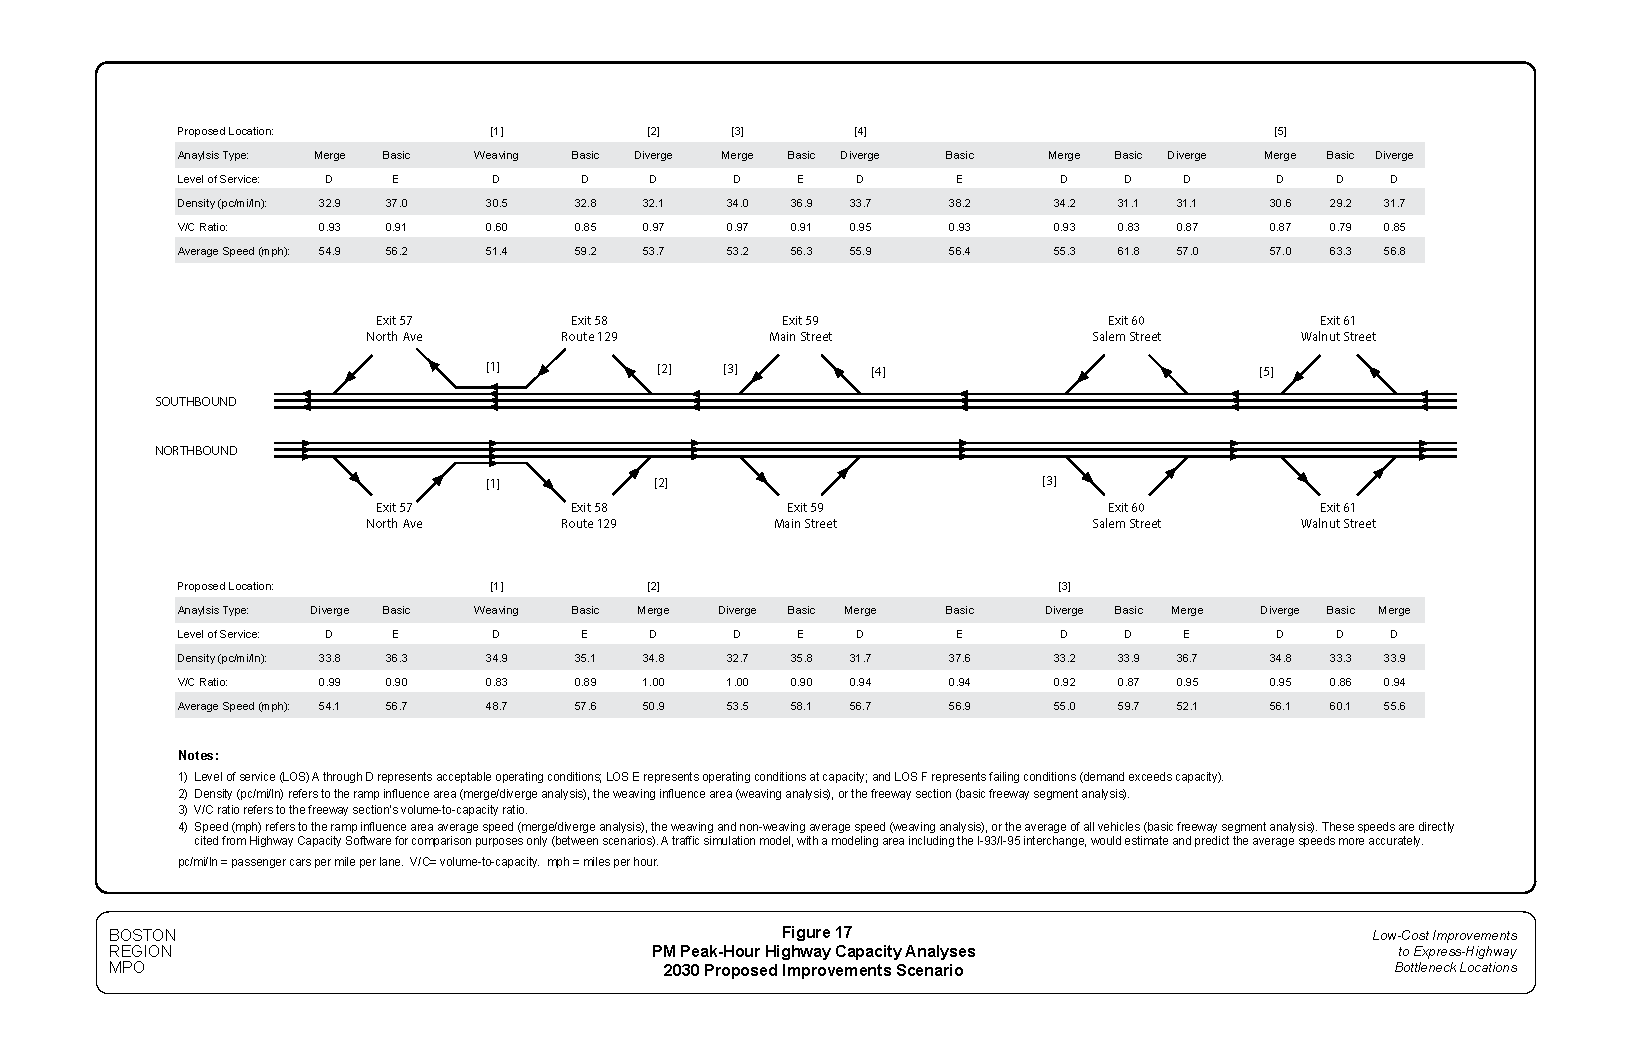
Figure 18
Approximate Locations and Conceptual Diagrams: Proposed Improvements at Exits 57, 58, and 59
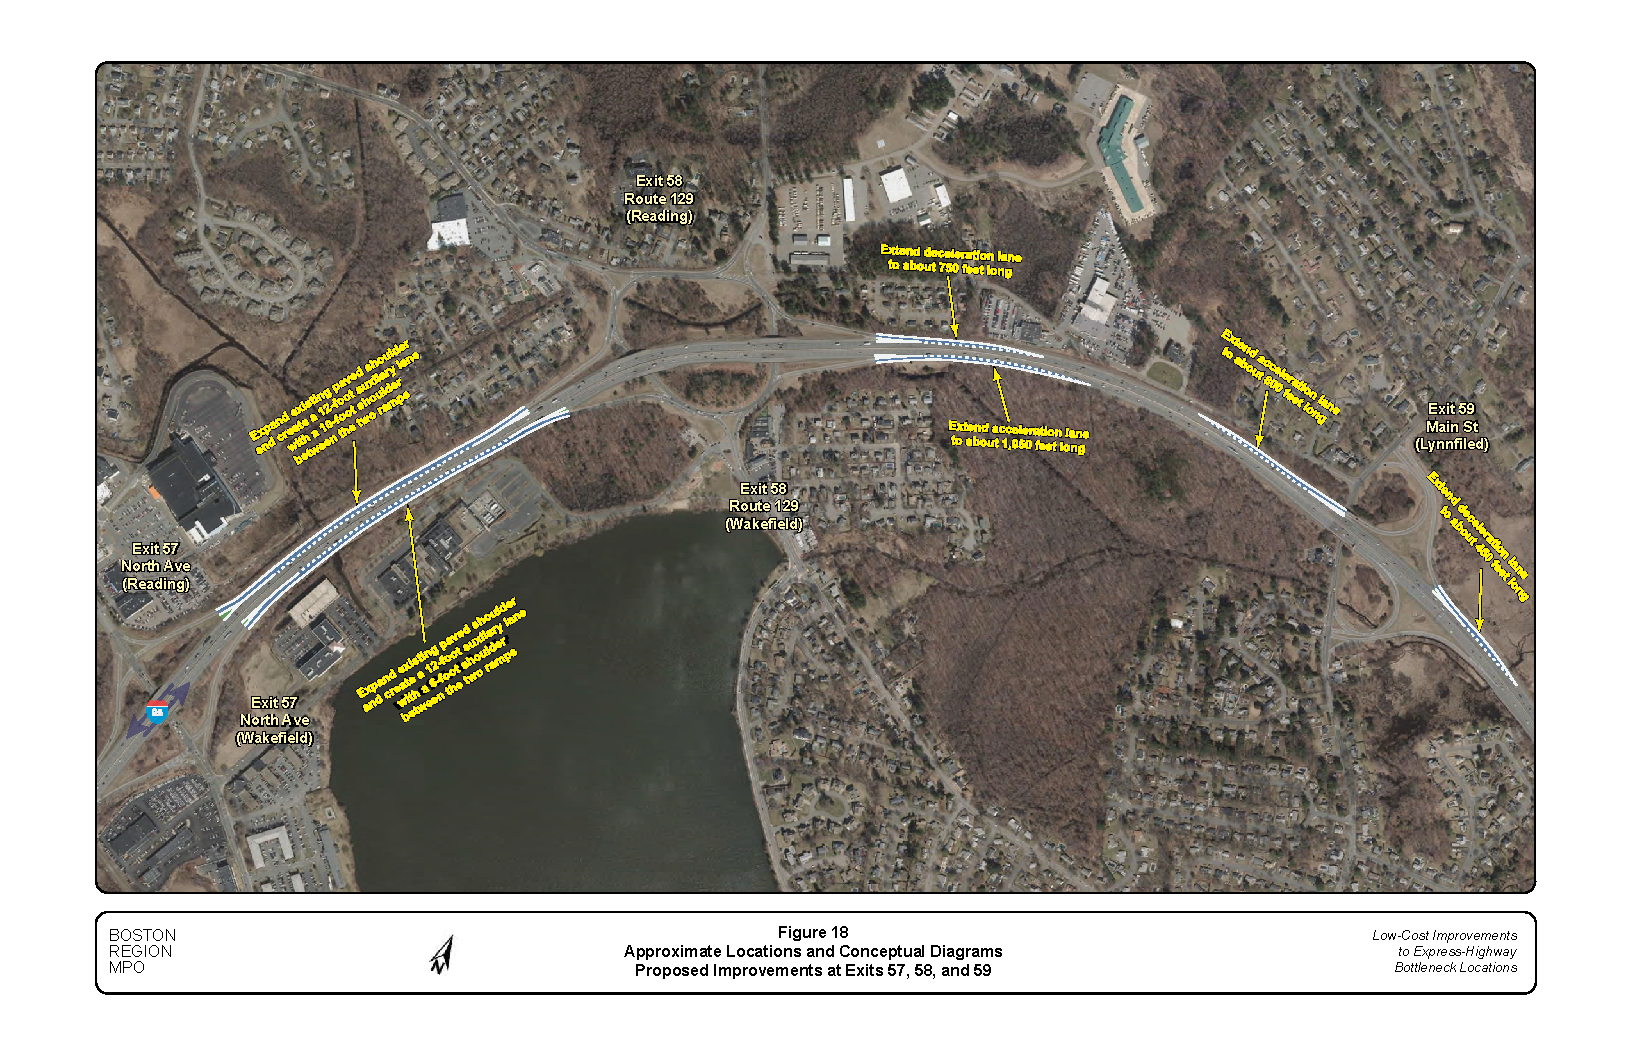
Figure 19
Approximate Locations and Conceptual Diagram: Proposed Improvements at Exits 60 and 61
1 Federal Highway Administration, Recurring Traffic Bottlenecks: A Primer: Focus on Low-Cost Operations Improvements (US Department of Transportation, June 2009) p. 1.
2 Seth Asante, MPO staff, memorandum to the Transportation Planning and Programming Committee of the Boston Region Metropolitan Planning Organization, “Low-Cost Improvements to Bottleneck Locations,” June 2, 2011; Chen-Yuan Wang, MPO staff, memorandum to the Transportation Planning and Programming Committee of the Boston Region Metropolitan Planning Organization, “Low-Cost Improvements to Bottleneck Locations, Phase II,” March 12, 2012; Seth Asante, MPO staff, memorandum to the Boston Region Metropolitan Planning Organization, “Low-Cost Improvements to Bottleneck Locations,” December 3, 2015; Seth Asante, MPO staff, “Low-Cost Improvements to Bottleneck Locations,” Boston Region Metropolitan Planning Organization, January 2018; and Seth Asante and Chen-Yuan Wang, MPO staff, “Low-Cost Improvements to Bottleneck Locations,” Boston Region Metropolitan Planning Organization, February 2020.
3 The data are available from Massachusetts government webpage: https://www.mass.gov/traffic-volume-and-classification.
4 See Section 4.2.1 of this report for further description of the estimation process.
5 INRIX is a private company that collects roadway travel times and origin-destination data for most roadways that are collectors, arterials, limited-access roadways, or freeways.
6 Transportation Research Board of the National Academies, Highway Capacity Manual Sixth Edition: A Guide for Multimodal Mobility Analysis, or HCM 2016, or HCM6, (Washington, DC, October 2016).
7 Highway Capacity Software 7(HCS7), Version 7.9, McTrans Center, University of Florida, July 15, 2020. HCS7 implements the methodologies of HCM6.
8 The counts were taken during a period when the COVID-19 pandemic was less severe but still prevailing. As no historical data at the count locations were available for comparisons and adjustments, these current data were used directly for analysis.
9 Massachusetts Governor's COVID-19 Order #5, which prohibited gatherings of more than 25 people, was issued on March 15, 2020.
10 The review was based on two resources: 1) available traffic counts on I-95 in the study area from MassDOT Transportation Data Management System, and 2) the MassDOT Mobility Dashboard (https://mobility-massdot.hub.arcgis.com) that provides information to monitor the impacts of COVID-19 on the state’s transportation network, including roadways and transit services, and published weekly traffic volumes at permanent count stations in the state with comparison of the volumes in the same period in 2019.
11 Massachusetts Highway Department, Project Development and Design Guide, January 2006. The guidebook describes the project development procedures and design guidelines applicable to projects with MassDOT Highway Division involvement. It provides guidance to municipalities, authorities, and other entities involved in the design and development of highways and streets, and other transportation facilities. The lengths of acceleration and deceleration lanes are measured from the point where the lane reaches 12 feet wide to the first controlling curve, according to A Policy on Geometric Design of Highways and Streets by AASHTO.
12 The total ramp density is the average number of on-ramp, off-ramp, major merge, and major diverge junctions per mile. It applies to a six-mile segment of a freeway facility, three miles upstream and three miles downstream of the midpoint of the study segment.
13 Synchro Version 11.1 was used for the analyses. This software is developed and distributed by Trafficware Ltd. It can perform capacity analysis and traffic simulation (when combined with SimTraffic) for an individual intersection or a series of intersections in a roadway network.
14 The MassDOT Crash Data Portal is located at https://apps.impact.dot.state.ma.us/cdp/home.
15 To distinguish the crash locations, staff applied a similar method to the method for defining freeway segments. The in-between area refers to the basic freeway segment between a diverge segment and a merge segment.
16 Most crash records indicate the location only at the freeway exit number with no indications of the on-ramp or off-ramp, or the location of the crash on the freeway. Staff plotted the crash data and found that the majority of the crashes were geocoded at the diverge point of the freeway at all the study interchanges. After further reviewing the police narratives and collision diagrams, staff identified the exact locations of approximately 40 to 50 percent of the total crashes at the study interchanges. These findings, however, were considered not sufficient to represent the exact number of crashes in the merge, diverge, and in-between areas at the study interchanges. As such, Figures 8 and 9 show the total number of crashes in the vicinity of each interchange with the approximate crash clusters in the merge, diverge, and in-between areas based on the proportions of the crashes whose locations were identified.
17 Federal Highway Administration, Freeway Management and Operations Handbook, Chapter 5 (US Department of Transportation, September 2003, updated January 2011).
18 Ramp spacing is defined as the distance between the painted tips of successive ramps. As in this case, both the entrance and exit ramps are the parallel type; the spacing is estimated at the end of the solid white line extending from the painted tip of the two ramps.
19 Transportation Research Board, Guidelines for Ramp and Interchange Spacing, National Cooperative Highway Research Program (NCHRP) Report 687 (Washington DC, 2011).
20 According to the Freeway Management and Operations Handbook, 8- to 12-foot shoulders are desirable for auxiliary lanes, with a minimal required width of six feet.
21 American Association of State Highway and Transportation Officials (AASHTO), Highway Safety Manual (Washington, DC, 2010).; The Crash Modification Factors Clearinghouse provides a searchable online database of CMFs along with guidance and resources on using CMFs in road safety practice (www.cmfclearinghouse.org/index.cfm).
22 The cost was approximated from the general expenses of similar projects. The estimation is only for design and construction; it does not include right-of-way, utility relocation, or contingency costs.