Low-Cost Improvements to Express-Highway Bottleneck Locations
Project Manager
Seth Asante
Project Principal
Mark Abbott
Data Analysts
Ben Erban
Kathy Jacob
Graphics
Ken Dumas
Kim DeLauri
Cover Design
Jane Gillis
The preparation of this document was supported
by the Federal Highway Administration through
MPO 3C PL contract #95411.
MPO 3C PL contract #101725
Central Transportation Planning Staff
Directed by the Boston Region Metropolitan
Planning Organization. The MPO is composed of
state and regional agencies and authorities, and
local governments.
To request additional copies of this document or copies in an accessible format, contact:
Central Transportation Planning Staff
State Transportation Building
Ten Park Plaza, Suite 2150
Boston, Massachusetts 02116
(857) 702-3700
(617) 570-9192 (fax)
(617) 570-9193 (TTY)
ctps@ctps.org
Candidate locations were selected based on input from the MassDOT Highway Division as well as Congestion Management Process (CMP) data. The screening process yielded four locations that had the potential to respond to low-cost improvement measures. These locations included:
All locations regularly experience poor level of service (LOS) as a result of one or more freeway bottlenecks during peak travel periods.
The MPO staff developed one or more low-cost improvement proposals to address each bottleneck. If implemented, the modifications would result in capacity and safety improvements on these four high-volume facilities. Some recommendations of three previous low-cost bottleneck studies have already been implemented with positive results.
This report summarizes the analyses and recommendations from the study. The report is divided into multiple chapters, with four chapters covering each study location. Each location chapter summarizes existing conditions, proposes various low-cost measures to address the bottlenecks, and evaluates the efficacy of the proposed alternatives using methodology from the Highway Capacity Manual (HCM). The report concludes with a summary of the recommendations, followed by figures that illustrate features of the proposed improvements. The report also includes technical appendices that cite the methods used and the data applied.
Chapter 2—Selection of Study Locations
2.3 Rationale for Not Selecting Location 9 for Study
3.4.5 Major Merge and Diverge Areas
3.5 Level-of-service Criteria for Analyses
4.1 Existing Freeway Characteristics
4.5.1 Alternative 1: Lengthen the Acceleration Lane at the On-Ramp from Route 2
4.5.2 Alternative 2: Create an Auxiliary Lane for Merging and Diverging Traffic
4.5.3 Alternative 3: Signage Improvements for Exit 30
4.6 Effectiveness and Cost of the Improvements
4.6.1 Effectiveness and Cost of Alternative 1
4.6.2 Effectiveness and Cost of Alternative 2
4.6.3 Effectiveness and Cost of Alternative 3
5.1 Existing Freeway Characteristics
5.3.2 Insufficient Queueing Space
5.5.1 Alternative 1: Create an Auxiliary Lane for Merging and Diverging Traffic at Exit 37B
5.5.2 Alternative 2: Lengthen the Acceleration Lane at the Merge from Commerce Way
5.5.3 Alternative 3: Use a Two-Lane Ramp at Exit 37B
5.6 Effectiveness and Cost of the Improvements
5.6.1 Effectiveness and Cost of Alternative 1
5.6.2 Effectiveness and Cost of Alternative 2
5.6.3 Effectiveness and Cost of Alternative 3
5.7 Long-Term Plan for I-93/I-95 Interchange
6.1 Existing Freeway Characteristics
6.3.2 Short Widening Distance at Major Diverge
6.3.3 Merge to Single Lane on I-93 Southbound Ramp
6.3.4 Geometry at I-93 Northbound Merge
6.5.1 Alternative 1: Widen Route 24 Northbound to Four Lanes between I-93 and Horse Bridge
6.5.2 Alternative 2: Widen Route 24 Northbound to Four Lanes between I-93 and Canton Street
6.5.3 Alternative 3: Remove the Merge on the Ramp to I-93 Southbound
6.6 Effectiveness and Cost of the Improvements
6.6.1 Effectiveness and Cost of Alternative 1
6.6.2 Effectiveness and Cost of Alternative 2
6.6.3 Effectiveness and Cost of Alternative 3
7.1 Existing Freeway Characteristics
7.3.2 Geometry at the Major Merge
7.5.1 Alternative 1: Lengthen the Merge Distance at the Ramp Junction
7.6 Effectiveness and Cost of the Improvement
7.6.1 Effectiveness and Cost of Alternative 1
Chapter 8—Conclusion and Next Steps
TABLE AND FIGURES
TABLE 1. Inventory of Express-Highway Bottleneck Locations for Screening
TABLE 2. LOS Criteria for Basic Freeway, Ramp Merge/Diverge, and Weaving Segments
Figure 1. Regional Map of Study Areas
This report summarizes the results of the analyses and improvement alternatives considered in the federal fiscal year (FFY) 2017 Low-Cost Improvements to Express-Highway Bottleneck Locations study. The report opens with background information and describes the purpose of the study, followed by the selection of study locations, an assessment of the safety and operational problems, and a discussion of the potential improvement strategies. The final section presents study recommendations. The report concludes with technical appendices, which cite the study methods and describe how the data were applied, including detailed reports from the freeway merge and diverge analyses. If implemented, the report’s recommendations are expected to result in improvements on the freeway facilities; they would improve traffic safety, make traffic operations more efficient, and reduce congestion at the bottlenecks.
According to the Federal Highway Administration (FHWA), “Much of recurring congestion is due to physical bottlenecks—potentially correctible points on the highway system where traffic flow is restricted. While many of the nation’s bottlenecks can only be addressed through costly major construction projects, there is a significant opportunity for the application of operational and low-cost infrastructure solutions to bring about relief at these chokepoints.”1 To be consistent with this guidance, the FHWA Massachusetts Division has recommended, as part of its comments on the Unified Planning Work Program process, that the Boston Region Metropolitan Planning Organization (MPO) identify the worst bottlenecks in the region that can be mitigated with low-cost countermeasures and develop recommendations for such countermeasures at these locations.
In general, recurring bottlenecks, the subject of this study, are influenced by the design or operation present at the point where the bottleneck begins (for example, merges, diverges, lane drops, traffic weaving, and abrupt changes in highway alignment). Previously, MPO staff analyzed several express-highway bottleneck locations in three consecutive studies, Low-Cost Improvements to Bottlenecks Phase I (FFY 2011), Phase II (FFY 2012), and Phase III (FFY 2015), which were well received by the Massachusetts Department of Transportation (MassDOT) and the FHWA.2 ,3 ,4 Previous study locations included sections of Interstate 95 in Burlington, Lexington, and Weston; sections of Interstate 93 in Woburn; and sections of Route 3 in Braintree.
Many of the recommendations from those studies have been implemented, and the FHWA has interviewed MPO staff about these successful implementations, including:
The purpose of this study is twofold:
The MPO has been conducting these studies in the Boston region to identify low-cost methods to reduce congestion, increase safety, and improve traffic operations. In the current study, the MPO staff will rely on their technical expertise regarding the nature of bottlenecks and will seek input from MassDOT Highway Division staff, who are familiar with the region’s express-highway system operations, to develop and evaluate a comprehensive list of potential improvements at the bottleneck locations.
Chapter 2—Selection of Study Locations
The selection of study locations included the inventorying and screening of candidate locations.5 MPO staff developed an initial list of candidate locations in the MPO region based on the following parameters:
The inventory process yielded nine bottleneck locations in the Boston Region MPO area for screening, which are presented in Table 1 .
TABLE 1
Inventory of Express-Highway Bottleneck Locations for Screening
Location Number |
City/Town |
MassDOT District |
Express-Highway Section |
Problem |
1 |
Lexington* |
4 |
I-95 northbound between Exit 29 (Rte. 2) and Exit 30 (Rte. 2A/ Service Plaza) |
Merge/diverge |
2 |
Woburn/Reading* |
4 |
I-93 southbound between Commerce Way and I-95 |
Merge/diverge |
3 |
Randolph/Canton* |
6 |
Rte. 24 northbound between Exit 20 |
Merge/diverge |
4 |
Randolph/Canton* |
6 |
Rte. 24 southbound between Exit 20 (Rte. 139) and Exit 21 (I-93) |
Merge/diverge |
5 |
Medford |
4 |
I-93 southbound between Rte. 16 on-ramp and Exit 31 (Rte. 16 off-ramp) |
Weave |
6 |
Wilmington |
4 |
I-93 northbound between Exit 40 (Rte. 62) and Exit 41 (Rte. 125) |
Merge/diverge |
7 |
Canton/Randolph |
6 |
I-93 northbound between Exit 1 (I-95) and Exit 4 (Rte. 24) |
Merge/diverge/weave |
8 |
Canton/Randolph |
6 |
I-93 southbound between Exit 1 (I-95) and Exit 4 (Rte. 24) |
Merge/diverge/weave |
9 |
Reading |
4 |
I-95 northbound between Exit 37 (I-93) and Exit 38 (Rte. 28) |
Weave |
* = locations selected for analysis
Source: Central Transportation Planning Staff.
MPO staff used the following three criteria to screen the bottleneck locations:
Each location must meet these criteria for it to be selected for study. In addition, the number of locations selected for study is also dependent on funding allocated for the study.
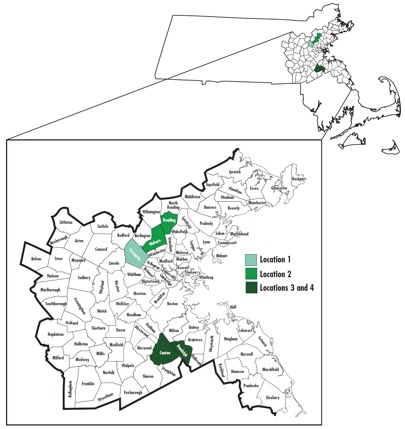
Based on the screening criteria and consultations with MassDOT Highway Division officials, MPO staff selected locations 1, 2, 3, and 4 for study. Figure 1 shows the study locations, which are described below. Although locations 5, 6, 7, and 8 met the screening criteria, they were not selected for study in this round of bottleneck study because of funding—these locations would be considered for the next round of bottleneck study. Appendix A contains comments about the study from the MassDOT Highway Division and a memorandum to the MPO that describes the selection process in detail. (All figures are included at the end of the report.)
This bottleneck is located on I-95 northbound between the Route 2 and Route 2A interchanges, and is present during AM and PM peak periods. The I-95 northbound mainline can carry up to 7,600 vehicles per hour, while up to 1,500 vehicles per hour merge from Route 2 westbound and up to 1,300 exit to Route 2A and the service plaza. The merging and diverging activities of these vehicles slow down traffic on the freeway upstream of the Route 2A interchange, making it difficult to enter the freeway from Route 2. The existing conditions analyses, problem identification, and the improvements proposed to this bottleneck location are described in Chapter 4.
This bottleneck is located on I-93 southbound upstream from the point where traffic begins to diverge onto I-95 southbound. During the AM peak period, traffic going to I-95 southbound backs up on the ramp and spills onto the I-93 mainline, thus impacting flow on the right most low-speed southbound lane. As a result, motorists attempt to get into the breakdown lane as soon as possible to stay clear of the low-speed lane. But usually vehicles are still queuing on the low-speed lane, compounding the problems. The other three southbound lanes are almost in free flow conditions (that is, uncongested conditions with drivers traveling at posted speeds) during this period. In the segment, the four I-93 southbound lanes carry up to 7,500 vehicles per hour, of which approximately 2,000 vehicles exit to I-95 southbound. The existing conditions analyses, problem identification, and the improvements proposed to this bottleneck location are described in Chapter 5.
This bottleneck is located on Route 24 northbound at the point where traffic diverges onto I-93 northbound and southbound. Bottleneck conditions emerge primarily during the AM peak period and extend south from I-93 in Randolph as far as Route 27 in Brockton, or approximately seven miles. During this period, Route 24 northbound carries approximately 4,600 vehicles per hour, with volumes of 2,300 vehicles heading northbound on I-93 and approximately 2,300 vehicles heading to I-93 southbound. These volumes are low because of the bottleneck, and they do not reflect actual traffic demand or traffic capacity of Route 24 mainline or connector ramps. The merging activity of these vehicles on I-93 slows down traffic on the Route 24 connector ramps and causes traffic to back up on Route 24. The existing conditions analyses, problem identification, and the improvements proposed to this bottleneck location are described in Chapter 6.
This bottleneck is located on Route 24 southbound at the point where traffic from the I-93 connector ramps merges onto Route 24 southbound. Bottleneck conditions emerge primarily during the PM peak period. During this period, Route 24 southbound carries approximately 5,300 vehicles per hour, of which approximately 2,700 vehicles enter from I-93 northbound and another 2,600 from I-93 southbound. The merging activity of these vehicles creates a bottleneck that causes a one-mile-long traffic queue to extend from the Canton Street Bridge under Route 24 onto the I-93 northbound and southbound lanes. The existing conditions analyses, problem identification, and the improvements proposed to this bottleneck location are described in Chapter 7.
MPO staff did not select Location 9: I-95 Northbound between Exit 37 (I-93) and Exit 38 (Route 28) in Reading for the study. This section of highway frequently is congested because of a lane drop, intensive weaving, and merging and diverging activities, which slow down mainline traffic, especially during the PM peak period. During that time, the I-95 northbound mainline carries approximately 6,000 vehicles per hour, and the Exit 37 off- and on-ramps carry approximately 3,000 and 2,600 vehicles per hour, respectively. Adding an auxiliary lane northbound on I-95 would provide more room for the merging and diverging activities and reduce disturbance to mainline traffic. Staff did not select this location because the weave problem at Exit 37 could not be corrected in a low-cost manner and an auxiliary lane would need to be extended for a long distance (three to four interchanges downstream) to reduce congestion and the queue, which could be expensive.
The MassDOT Highway Division’s Traffic Data Collection Program conducted automatic traffic recorder (ATR) counts for the ramps and freeways at the locations selected for study. The ATR counts traffic continuously for at least 48 hours. These counts are used to determine the average weekday daily traffic of a highway. The traffic volume data are included in Appendix B.
Although the ATR data that MassDOT collected for this study did not include vehicle classification, other count methods can capture this information. MPO staff used the MassDOT traffic count database to access classification data collected during previous traffic counts inside the study areas. The heavy vehicle percentages present in these counts were used to estimate truck traffic for the freeway analyses. All the counts used in this way were taken between 2014 and 2017. They are included in Appendix B.
MPO staff used crash data from January 2010 through December 2014 from the MassDOT’s Registry of Motor Vehicles database to evaluate safety for motorists. Crash data are included in Appendix C.
MPO staff used speed data from spring 2015 and fall 2015 for average weekday from the MPO’s CMP. The CMP maintains average speed data on express-highway systems in the MPO region with use of the INRIX historical traffic speed data archive.
Basic freeway segments are outside of the influence area of ramps or weaving areas of the freeway. The flow in such segments occurs more smoothly than segments with merging, diverging, or weaving. The exact point at where basic freeway segments begin or end—the area where the influence of merging, diverging, or weaving has dissipated—depends on local conditions, particularly the level of service (LOS) operating at the time. If traffic flow is light, the influence may be negligible, whereas under congested conditions, queues may be extensive.
An entrance ramp is a one-way roadway that allows traffic to enter a freeway from other crossing highways. Sufficient acceleration distance is needed to allow a vehicle to enter the freeway mainline safely and comfortably; drivers on the entrance ramp need to be able to see a sufficient distance upstream from the entrance to locate the gaps in the traffic stream within which to merge.
An exit ramp is a one-way roadway that allows traffic to exit from the freeway and provide access to other crossing highways. Sufficient deceleration distance is needed to allow a vehicle to leave the freeway mainline safely and comfortably.
Weaving segments are formed when a freeway merge is followed by a freeway diverge within one-half mile. This geometry creates an area of intense lane changing as the two streams of traffic travel in conflicting directions. Weaving length, or the distance between merge and diverge points, must be sufficient to allow drivers to make the required lane changes safely and comfortably.
A major merge occurs when two multilane freeway segments combine to form a single freeway segment with three or more lanes. Likewise, a major diverge occurs when a freeway segment with three or more lanes splits into two multilane basic freeway segments. While these locations can create turbulence in the traffic flow, they are less restrictive than freeway ramps because speed differences are smaller and lane changes are often unnecessary.
LOS is a quality measure describing operational conditions within a traffic stream, generally in terms of such service measures as speed and travel time, freedom to maneuver, traffic interruptions, and comfort and convenience. Factors influencing LOS are volume, lane width, lateral obstructions, traffic composition, grade, and speed. The Highway Capacity Manual (HCM) methodology demonstrates driving conditions on freeways in terms of LOS ratings from A through F.6 The LOS criteria characterize freeway performance measures in terms of density (passenger cars per lane mile, [pc/lane mile]). Table 2 shows the LOS criteria for basic freeway and ramp merge/diverge and weaving segments.
TABLE 2
LOS Criteria for Basic Freeway, Ramp Merge/Diverge, and Weaving Segments
|
Basic Freeway Segment |
Ramp Merge/Diverge and Weaving Segments |
LOS |
Density (pc/lane mile) |
Density (pc/lane mile) |
A |
≤ 11 |
≤ 10 |
B |
> 11–18 |
> 10–20 |
C |
> 18–26 |
> 20–28 |
D |
> 26–35 |
> 28–35 |
E |
> 35–45 |
> 35 |
F |
> 45, Demand exceeds capacity |
Demand exceeds capacity |
pc/lane mile = passenger cars per lane mile
Source: Highway Capacity Manual 2010.
LOS A represents the best operating conditions (unrestricted operations), while LOS F represents the worst operating conditions (queuing on the freeway and/or ramp). LOS A through LOS D represent acceptable operating conditions. LOS E represents operating conditions at capacity. LOS F represents failing conditions (demand exceeds capacity).
MPO staff conducted traffic operations analyses consistent with HCM methodologies. Using the data collected, MPO staff built traffic analysis networks for the AM and PM peak hours with the 2010 Highway Capacity Software (HCS) to assess the capacity and quality of traffic flow at the bottleneck area. Detailed reports generated by the HCS software are included in Appendix D.7
1 Federal Highway Administration, Recurring Traffic Bottlenecks: A Primer: Focus on Low-Cost Operations Improvements, US Department of Transportation, Federal Highway Administration, June 2009, p. 1.
2 Seth Asante, MPO staff, memorandum to the Transportation Planning and Programming Committee of the Boston Region MPO, “Low-Cost Improvements to Bottleneck Locations, Phase I,” June 2, 2011.
3 Chen-Yuan Wang, MPO staff, memorandum to the Transportation Planning and Programming Committee of the Boston Region MPO, “Low-Cost Improvements to Bottleneck Locations, Phase II,” March 12, 2012.
4 Seth Asante, MPO staff, memorandum to the Transportation Planning and Programming Committee of the Boston Region MPO, “Low-Cost Improvements to Express-Highway Bottleneck Locations,” December 3, 2015.
5 Seth Asante, MPO staff, memorandum to the Boston Region MPO, “Low-Cost Improvements to Express-Highway Bottleneck Locations: Selection of Study Locations,” April 2, 2015.
6 Highway Capacity Manual 2010, Transportation Research Board of the National Academies, Washington, DC, December 2010.
7 Highway Capacity Software 7, Version 7.3, McTrans Center, PO Box 116585, Gainesville, Florida, 2017.
Chapter 4—Location 1: I-95 Northbound Segment between Exit 29 (Route 2) and Exit 30 (Route 2A/Service Plaza) in Lexington
Location 1 is a stretch of Interstate 95/Route 128 northbound in Lexington. Figure 1 shows the location of the bottleneck within the MPO region. The northbound on- and off-ramps connect to and from Route 2 (Concord Turnpike), Route 2A (Merrett Road), and a service plaza. The bottleneck conditions form primarily during the PM peak period, when high volumes of rush hour traffic heads northbound on I-95. This interchange and the roadways are under the jurisdiction of MassDOT Highway Division, and they are located in District 4.
Operations at this bottleneck are associated with the freeway components described below.
The basic freeway section of I-95 northbound has four 12-foot travel lanes, a 10-foot right shoulder, and a 10- to 11-foot left shoulder. This section carries approximately 7,500 vehicles per hour during both the AM and PM peak periods.8 The posted speed limit is 65 miles per hour (mph). Freeway exit signs are posted at one-mile and one-half-mile intervals to guide drivers to Routes 2 and 2A. As a result of recent resurfacing, neither side of I-95 northbound at this location is equipped with a rumble strip.
The entrance ramp from Route 2 westbound to I-95 northbound is a one-lane, one-way roadway. It carries as many as 1,500 vehicles per hour during the AM peak period and 1,100 vehicles per hour during the PM peak period. The length of the acceleration lane for traffic entering the section from Route 2 westbound is approximately 500 feet long,9 and the posted speed limit on the entrance ramp is 25 mph. Based on highway design and entrance ramp curve design speeds, the length of the acceleration lane does not meet MassDOT’s standards. The MassDOT Highway Division’s current Project Development and Design Guide specifies a minimum acceleration lane of 1,220 feet for a freeway facility with a design speed of 65 mph, an entrance ramp curve design speed of 25 mph, and a grade of two percent or less.
The exit ramp from I-95 northbound to Route 2A is a one-way, one-lane roadway that leads to a connector-distributor road approximately 4,000 feet long. Traffic bound for Route 2A westbound, eastbound, and the Lexington service plaza all use Exit 30. Combined, these three destinations produce flows of 1,300 vehicles per hour on the ramp during peak hours. The length of the deceleration lane is approximately 740 feet long, and the posted speed limit on the exit ramp is 30 mph. Based on highway design and exit ramp curve design speeds, the length of the deceleration lane meets MassDOT’s standards. The MassDOT Highway Division’s current Project Development and Design Guide specifies a minimum deceleration length of 440 feet for a freeway facility with a design speed of 65 mph, an exit ramp curve design speed of 35 mph, and a grade of two percent or less. The MassDOT design guide recommends using parallel type deceleration lanes instead of the taper type that is used on Exit 30, although in this case the presence of a nearby bridge (over Lincoln Street) might make a parallel design difficult.
The existing bottleneck creates intense interruption of traffic flow primarily during PM peak travel periods, experienced by virtually all drivers in the section. It reduces travel speeds on the freeway mainline to 35 mph or less during the PM peak period. In addition, the bottleneck causes many crashes in this area and results in poor operating LOS, especially at the diverge area connecting the exit ramp to Route 2A eastbound.
MPO staff identified two factors that contribute to form the bottleneck:
Figure 2 shows the traffic flows during the AM and PM peak periods. The merging and diverging activities of vehicles using the ramps slow down traffic on the freeway upstream of the Route 2A interchange, creating a bottleneck and making it difficult to enter the freeway from Route 2.
Although ATR data show similar ramp and mainline volumes in the two peaks, vehicle speed data indicate that the worst congestion occurs during the PM peak (see Section 4.4.2). During this period of time, traffic slows considerably and queues extend for miles down I-95. This observation suggests that the actual demand on the facility is greater than the number of vehicles it is able to serve. True demand is nearly 8,800 vehicles per hour, which is the theoretical capacity of a four-lane freeway operating in uncongested conditions.
A short acceleration lane for the high-volume traffic entering I-95 northbound from Route 2 westbound forces drivers to merge quickly and does not give them the distance needed to reach safe freeway speeds. The intense merging maneuvers slow down traffic, causing a bottleneck upstream from the merge location.
A summary of the crashes in this segment is presented in Table 3. There were 108 crashes in this area between 2010 and 2014 (Appendix C). Figure 3 shows the location of these crashes. The majority (98 crashes) occurred in the vicinity of the off-ramp at Exit 30.
TABLE 3
Crash Summary (2010–14):
Location 1: I-95 Northbound Segment between Exit 29 (Route 2) and Exit 30 (Route 2A/Service Plaza)
|
Number of Crashes |
||
Crash Variable |
At Merge |
At Diverge |
Total |
Crash severity |
|
|
|
Fatal injury |
0 |
0 |
0 |
Nonfatal injury |
4 |
20 |
24 |
Property damage only |
6 |
75 |
81 |
Not reported/unknown |
0 |
3 |
3 |
Manner of collision |
|
|
|
Angle |
0 |
9 |
9 |
Rear-end |
5 |
49 |
54 |
Rear-to-rear |
0 |
2 |
2 |
Sideswipe, same direction |
2 |
7 |
9 |
Single-vehicle crash |
3 |
28 |
31 |
Not reported/unknown |
0 |
3 |
3 |
Road surface conditions |
|
|
|
Dry |
8 |
68 |
76 |
Wet |
2 |
6 |
8 |
Snow |
0 |
24 |
24 |
Ambient light conditions |
|
|
|
Daylight |
5 |
58 |
63 |
Dark: lighted roadway |
1 |
11 |
12 |
Dark: nonlighted roadway |
4 |
22 |
26 |
Dawn |
0 |
3 |
3 |
Dusk |
0 |
4 |
4 |
Weather conditions |
|
|
|
Clear |
7 |
59 |
66 |
Cloudy |
1 |
17 |
18 |
Rain |
2 |
11 |
13 |
Snow |
0 |
6 |
6 |
Not reported/unknown |
0 |
5 |
5 |
Travel period |
|
|
|
Peak |
5 |
60 |
65 |
Off-peak |
5 |
38 |
43 |
Total crashes |
10 |
98 |
108 |
Five-year average (rounded) |
2 |
20 |
22 |
Below is a summary of the crashes in this segment:
Figure 4 is a congestion scan that shows the average travel speeds on I-95 northbound at the bottleneck location between Route 2 and Route 2A. The bottleneck reduces travel speeds less than 25 mph between 3:00 PM and 5:00 PM. Vehicle speeds this far below free-flow correlate with LOS F conditions on the freeway. Travel speed during the AM peak is less affected and remains more than 50 mph.
MPO staff conducted traffic operations analyses consistent with HCM methodologies. Using data from MassDOT, MPO staff built traffic analysis networks for the AM and PM peak hours with the HCS suite to assess the capacity and quality of traffic flow at the bottleneck area.10 Full HCS reports are included in Appendix D.
Table 4 presents the results of the LOS analyses for existing conditions at Location 1. The primary bottleneck is located at the merge from Route 2 westbound. Some simplifications were necessary to fit the HCS model more closely with observed conditions and are stated in the table notes.
TABLE 4
LOS Analysis–Existing Conditions: Location 1: I-95 Northbound Segment between Exit 29 (Route 2) and Exit 30 (Route 2A/Service Plaza)
HCM = Highway Capacity Manual; LOS = level of service; mph = miles per hour; pc/lane mile = passenger cars per lane mile; V/C = volume-to-capacity; vph = vehicles per hour
Table 4 shows that most facilities operate at LOS D during the AM peak and LOS E during the PM peak. The two exceptions are the PM merge from Route 2 and the AM weaving segment analysis, both of which reach LOS F.
The high combined-ramp volume during the AM peak (2,600 entering and exiting vehicles per hour) also causes the weaving analysis to fail during this period. This means that the formulas in the HCM predict that not all vehicles using the ramps during the AM peak will be able to successfully merge within the available 1,720 feet. However, this does not fit with observed conditions. One possible explanation is that this and other bottlenecks along I-95 reduce speed on the northbound mainline below free-flow speed, giving vehicles more time to execute a lane change. Driver behavior may also be misrepresented in the formulas. At any rate, the fact that weaving fails during the AM peak period when congestion is not a big problem suggests that weaving analysis is not well suited to this bottleneck location.
MPO staff developed the following improvements to address safety and operational issues at the bottleneck:
The alternatives were analyzed using projected year 2030 traffic volumes. MPO staff estimated a five percent total background growth from 2017 to 2030.
The existing acceleration lane is short; it does not meet MassDOT’s standards and contributes to poor traffic operations. MPO staff recommends lengthening the acceleration lane from the Route 2 westbound on-ramp.
Figure 5 shows the following improvements recommended in Alternative 1:
An auxiliary laneis defined as the portion of the roadway adjoining the traveled freeway for speed change, merging, diverging, weaving, and other purposes supplementary to through-traffic movement. Alternative 2 would create an auxiliary lane between the on-ramp at Exit 29 and the off-ramp at Exit 30. This lane would extend the distance available for merging or diverging traffic maneuvers and would provide sufficient distance to accommodate speed changes and vehicle weaving. The auxiliary lane would also upgrade the acceleration lane to meet MassDOT’s standards.
Figure 6 shows the following improvements recommended in Alternative 2:
Alternative 2 does present some design difficulties. First, an existing bridge carries I-95 northbound over Lincoln Street in Lexington only 200 feet from the beginning of the gore area at Exit 30. Currently the taper for the Exit 30 ramp extends onto the bridge, and creating an auxiliary lane in this area would require expanding this taper to a full-width lane. The bridge looks to be approximately 64 to 66 feet wide, providing space for five 12-foot lanes and a two- to three-foot offset on each side. These less-than-minimal shoulders would require a Design Exception Report (DER). Second, while the paved shoulder along this stretch of highway is wide enough to accommodate an extra travel lane, it is not wide enough to fit an additional emergency pullover or stopping area. Any such area would require additional paving and possibly significant grading work because of a moderate slope to the right of the roadway.
Because of the high frequency of crashes observed in the vicinity of Exit 30, some signage modifications are recommended. The following improvements are recommended as part of Alternative 3:
These signage modifications are safety-oriented and do not result in operational improvements.
While signage is a factor, the underlying design of the Route 2A interchange may also play a role in the frequency of crashes observed here. The ramp at Exit 30 leads to a connector-distributor road that serves a high-speed off-ramp, then a service plaza, and then the remaining three legs of the cloverleaf interchange before rejoining the I-95 mainline. The placement of a service plaza in the midst of a high-speed interchange is an unusual design not seen elsewhere in the northeast and may confuse drivers, especially visiting drivers using the service plaza. This confusion could contribute to the high crash rate. However, re-designing the Route 2A interchange would be a high-cost project and is beyond the scope of this report.
Table 5 presents the 2030 future LOS analyses compiled using the HCS software. Results for the no-build scenario are compared against Alternative 1 and Alternative 2 for all facilities where modifications affect system operations. All scenarios use a uniform five percent growth for 2030 traffic volumes. Alternative 3 does not affect LOS and is not included in Table 5. Approximations made as part of the HCM analysis are given where applicable.
TABLE 5
LOS Analysis–Improvement Alternatives: Location 1: I-95 Northbound Segment between Exit 29 (Route 2) and Exit 30 (Route 2A/Service Plaza)
A Crash Modification Factor (CMF) is an estimate of the change in crashes expected after implementation of a countermeasure. Using CMFs from the Highway Safety Manual (HSM) and the CMF Clearinghouse for lengthening an acceleration lane show that Alternative 1 would reduce crashes at the merge area by 10 to 20 percent.11 ,12 In addition, Alternative 1 would have a positive, albeit small, effect on traffic operations in the bottleneck. Alternative 1 would not improve the diverge maneuver at Exit 30, the basic freeway capacity, or weaving operations.
Implementing the changes in Alternative 1 would only require restriping the existing Exit 29 ramp area. No right-of-way acquisition, pavement widening, or alignment changes would be required. Alternative 1 is estimated to cost between $10,000 and $20,000 to construct and would require restriping lanes and lengthening the acceleration lane on I-95 northbound.
Using CMFs from the Clearinghouse show that adding continuous auxiliary lane for weaving between entrance ramp and exit ramp would reduce crashes by 20 to 25 percent. Alternative 2 would significantly improve performance in this area, particularly at the Route 2A off-ramp. The LOS for Exit 30 would improve from E to C during the AM peak and from E to D during the PM peak. However, the merge from Route 2 would remain at LOS D in the AM peak and LOS F in the PM peak.
As with Alternative 1, weaving is the limiting factor with the lowest LOS. Alternative 2 does improve LOS for PM weaving from E to D, although according to the model the segment is still over its weaving capacity for the AM peak.
Using CMF from the Clearinghouse, Alternative 3 is expected to reduce crashes by up to 20 percent. Alternative 3 would significantly improve safety but would have limited effect on traffic operations in the bottleneck. Alternative 3 is estimated to cost between $10,000 and $20,000 to construct. This estimate includes the cost of installing new signs on overhead gantries, retrofitting existing sign assemblies, and relocating signs.
MPO staff recommends Alternative 2 in conjunction with Alternative 3 because of their beneficial effects on safety and operational efficiency. Alternative 2 removes entering and exiting traffic from the mainline travel lanes to the auxiliary lane. On the other hand, Alternative 1 forces traffic to merge onto the mainline as well as diverge from the mainline to exit the freeway, interrupting traffic flow.
8 The AM peak period is 6:00 AM to 10:00 AM, and the PM peak period is 3:00 PM to 7:00 PM. Source: Central Transportation Planning Staff.
9 Acceleration and deceleration lanes are measured from the point where the lane reaches 12 feet wide to the first controlling curve. Source: A Policy on Geometric Design of Highways and Streets, AASHTO, 2004. Chapter 10 Grade Separations and Interchanges.
10 Highway Capacity Software 7, Version 7.3, McTrans Center, PO Box 116585, Gainesville, Florida, 2017.
11 American Association of State Highway and Transportation Officials. Highway Safety Manual. Washington, DC, 2010.
12 Crash Modification Factors Clearinghouse, www.cmfclearinghouse.org/index.cfm.
Chapter 5— Location 2: I-93 Southbound Segment between Exit 37C (Commerce Way) and Exit 37B (I-95) in Woburn and Reading
Location 2 is on the I-93 southbound barrel before the I-95 interchange in Woburn. Figure 1 shows the location of the bottleneck within the MPO region. The affected section, approximately one-mile long, extends from the beginning of Commerce Way to Exit 37B (I-95 southbound). The interchange and roadways are under the jurisdiction of MassDOT Highway Division, which are located in District 4.
Operations at this bottleneck are associated with the freeway components described below.
The basic freeway section on I-93 southbound has four 12-foot travel lanes, a two- to three-foot left shoulder, and an 11- to 12-foot right shoulder. During the AM peak period, I-93 southbound carries as many as 7,500 vehicles per hour upstream of the section under study.13 The posted speed limit is 65 mph. As a result of recent resurfacing, neither side of I-93 southbound at this location is equipped with a rumble strip.
The basic freeway section on the adjacent I-95 southbound has three 12-foot travel lanes in the interchange that increase to four lanes after the merge from Exit 37B. It carries up to 6,800 vehicles per hour during the AM peak period and has a posted speed limit of 55 mph. The paved shoulder between ramps is about 10 feet wide.
There are two merge facilities relevant to congestion at this bottleneck location. The ramp following Exit 37C on I-93 southbound is an on-ramp with access from Commerce Way. It is a one-way, one-lane roadway with a generous 1,100-foot acceleration lane.14 During the peak period, however, it only carries a merging volume of 150 vehicles per hour. Even though the percentage of heavy vehicles is high (10.9 percent), the demand at this ramp is too small to affect operations at the bottleneck.
The ramp following Exit 36 on I-95 southbound is an on-ramp that connects to the southern end of Commerce Way. It has a 730-foot acceleration lane, a posted speed limit of 30 mph, and a peak volume of 1,200 vehicles per hour. It is considered as part of this analysis because of the high peak volume and because the widespread congestion near the I-93/I-95 interchange is likely the result of several interconnected bottlenecks.
At Exit 37B, the exit ramp to I-95 southbound is a one-way, one-lane roadway. It carries as many as 1,900 vehicles per hour during the AM peak period. The length of the deceleration lane is 980 feet. Based on the highway design and exit ramp curve design speeds, the length of the deceleration lane meets MassDOT’s standards. The posted speed limit on the exit ramp curve to I-93 is 30 mph.
Exit 36 on I-95 southbound is a low-volume ramp (600 vehicles per hour) that directly follows the merge from I-93 southbound. While the volume makes it unlikely to contribute to bottleneck conditions, it is important to note that recent restriping, which removed a lane upstream from this exit, means drivers now have to execute two lane changes within 1,500 feet to access this exit.
The high volume of traffic using Exit 37B during the AM peak period causes queues of exiting vehicles that stretch one-half mile or longer up the rightmost lanes of I-93 southbound. These queues frequently exceed the length of the deceleration lane. As a result of this, some drivers cross the rumble strip and queue in the right side shoulder. Other drivers stay in the main travel lanes and attempt to merge into the queue closer to the exit, either because of the lack of familiarity with the queues or the desire to cut ahead. This behavior interrupts the flow of through traffic on the southbound barrel.
MPO staff identified two factors that contribute to the bottleneck:
Figure 7 shows the traffic flows during the AM peak period. MassDOT ATR counts indicate that as many as 1,900 vehicles per hour are served by the Exit 37B ramp. However, vehicle speed data (see Section 5.4.2) and field observations show that there are significant queues present at this ramp during morning hours. This suggests that demand for the facility is likely greater than the capacity of the ramp. MPO staff estimates that the presence of a queue in this location adds 200 vehicles per hour to the peak value, bringing total peak ramp demand to 2,100 vehicles per hour.15
In addition to disrupting traffic on I-93 southbound, the high volume of traffic using Exit 37B also affects motorists on I-95 southbound. Merging vehicles interrupt the through traffic on I-95 southbound and force drivers to switch out of the right lane.
While the 980-foot deceleration lane is adequate for safe braking, it can only accommodate a queue of about 50 vehicles. Longer queues typically develop during the AM peak period, causing stopped traffic to spill into the breakdown or through lanes. This stopped traffic both interrupts smooth southbound flow and creates a safety hazard.
A summary of the crashes is presented in Table 6. There were 47 crashes in this section between 2010 and 2014 (Appendix C). Figure 8 shows the location of these crashes. The majority, 43 of the crashes, occurred in the vicinity of the diverge area at Exit 37B.
TABLE 6
Crash Summary (2010–14): Location 2: I-93 Southbound Segment between Exit 37C (Commerce Way) and Exit 37B (I-95)
|
Number of Crashes |
||
Crash Variable |
At Merge |
At Diverge |
Total |
Crash severity |
|
|
|
Fatal injury |
0 |
0 |
0 |
Nonfatal injury |
0 |
13 |
13 |
Property damage only |
3 |
29 |
32 |
Not reported/unknown |
1 |
1 |
2 |
Manner of collision |
|
|
|
Angle |
2 |
4 |
6 |
Rear-end |
0 |
23 |
23 |
Sideswipe, same direction |
1 |
9 |
10 |
Single-vehicle crash |
1 |
7 |
8 |
Road surface conditions |
|
|
|
Dry |
3 |
38 |
41 |
Wet |
0 |
2 |
2 |
Snow |
1 |
1 |
2 |
Ice |
0 |
1 |
1 |
Other |
0 |
1 |
1 |
Ambient light conditions |
|
|
|
Daylight |
0 |
34 |
34 |
Dark: lighted roadway |
1 |
4 |
5 |
Dark: nonlighted roadway |
3 |
4 |
7 |
Dark: unknown roadway lighting |
0 |
1 |
1 |
Weather conditions |
|
|
|
Clear |
1 |
28 |
29 |
Cloudy |
1 |
4 |
5 |
Rain |
0 |
3 |
3 |
Snow |
1 |
1 |
2 |
Not reported/unknown |
1 |
7 |
8 |
Travel period |
|
|
|
Peak |
2 |
33 |
35 |
Off-peak |
2 |
10 |
12 |
Total crashes |
4 |
43 |
47 |
Five-year average (rounded) |
1 |
9 |
9 |
Below is a summary of the crashes in this segment:
MPO staff believes that many of the rear-end and sideswipe crashes were caused by drivers slowing down to exit the freeway to I-95 or by drivers changing lanes. It appears that the short deceleration lane at this location may be contributing to poor traffic operations and the high number of crashes.
Figure 9 is a congestion scan that shows the average travel speeds on I-93 southbound at the bottleneck location ahead of Exit 37B. The bottleneck present at the I-95 interchange reduces travel speeds to less than 35 mph between the hours of 6 AM and 7 AM. Vehicle speeds this far below free-flow correlate with LOS F conditions on the freeway. Speeds can fall to less than 25 mph for up to half an hour at a time.
Figure 10 is a congestion scan that shows average travel speeds on I-95 southbound, which runs adjacent to the bottleneck at location 2. Conditions during the AM peak period are even worse on I-95 southbound, falling less than 25 mph between the hours of 7 AM and 9 AM. Importantly, the congestion scan shows that slowdowns worsen further down I-95 southbound. This suggests that the I-93 interchange is not the main cause of the congestion and that more issues are present further downstream on I-95.
MPO staff conducted traffic operations analyses consistent with HCM methodologies. Using the MassDOT data, MPO staff built traffic analysis networks for the AM peak hours with the HCS suite to assess the capacity and quality of traffic flow at the bottleneck area.16 Full HCS reports are included in Appendix D.
Table 7 presents the results of the LOS analyses for existing conditions at the bottleneck on I-93 southbound. The primary bottleneck is located at the diverge area at Exit 37B, but operations at nearby facilities are also included in Table 7. In addition, components of I-95 southbound were considered as part of the analysis as they affect merge conditions at the end of the Exit 37B ramp. Some simplifications were necessary to fit the HCS model more closely with observed conditions and are stated in the table notes.
TABLE 7
LOS Analysis–Existing Conditions: Location 2: I-93 Southbound Segment between Exit 37C (Commerce Way) and Exit 37B (I-95)
Location |
Density (pc/lane mile) |
Speed (mph)a |
V/C Ratio |
LOSb |
HCM Analysis Type: Basic Freeway Segment |
||||
I-93 southbound: Between Exit 37C and Exit 37B |
32.7 |
59.3 |
0.84 |
D |
I-95 southbound: Between Exit 37 and Exit 36 |
29.5 |
51.3 |
0.68 |
D |
HCM Analysis Type: Merge Areac |
||||
I-93 southbound: Ramp from Commerce Way |
33.5 |
57.2 |
0.83 |
C |
I-95 southbound: Ramp from I-93 southboundd,e |
N/Af |
N/A |
0.74 |
F |
I-95 southbound: Ramp from Commerce Way |
36.6 |
49.4 |
0.81 |
D |
HCM Analysis Type: Diverge Area |
||||
I-93 southbound: Exit 37B to I-95 southbound |
N/A |
N/A |
0.83 |
F |
I-95 southbound: Exit 36 to Commerce Way |
31.7 |
47.9 |
0.79 |
C |
HCM Analysis Type: Weaving Segment |
||||
I-95 southbound: Between Exit 37 and Exit 36g |
N/A |
N/A |
1.13 |
F |
a Refers to ramp influence area speed for merge/diverge areas. b LOS A through LOS D represent acceptable operating conditions; LOS E represents operating conditions at capacity; and LOS F represents failing conditions (demand exceeds capacity). c In HCM merge and diverge analyses, acceleration and deceleration lanes are measured from the tip of the painted gore to the end of the taper. This may differ from the AASHTO length. d Uses maximum acceleration lane length of 1,500 feet to approximate a lane addition at this merge. e Estimated demand flow rate of 2,100 vph used for Exit 37B ramp volumes in all existing condition analyses (see Section 5.3.1). f HCM does not provide density and speed data for scenarios that result in LOS F. g Uses a weaving segment of five lanes; therefore, limiting factor is weaving behavior and not mainline capacity. (HCM weaving analysis assumes a lane drop after the merge.) HCM = Highway Capacity Manual; LOS = level of service; mph = miles per hour; pc/lane mile = passenger cars per lane mile; V/C = volume-to-capacity; vph = vehicles per hour |
||||
Table 7 shows that the Exit 37B ramp from I-93 southbound operates at LOS F at both ends (the diverge on I-93 and the merge on I-95). However, the volume-to-capacity (V/C) ratio for both of these facilities is well below 1.0, indicating that the capacity to serve merging and diverging maneuvers is not exceeded. The reason these facilities fail is because the ramp itself is over capacity: the ramp roadway has a V/C ratio of 1.14, meaning the volume experienced on this ramp is 14 percent above the theoretical maximum throughput of a ramp with the given characteristics. (Any V/C ratio above 1.0 causes LOS F operations.) All other facilities operate at LOS D or above.
Alternative 1 would extend the deceleration lane and create a full-width auxiliary lane between the on- and off-ramps. This lane would provide drivers with ample distance to decelerate safely and comfortably enter and exit the freeway. More importantly, it would also increase the available space for vehicles queueing for Exit 37B, keeping them sheltered from the high-speed traffic on the main southbound barrel.
Figure 11 shows the improvements recommended in Alternative 1:
Because widening will not be possible on the bridge over West Street, a minor leftward shift (one to two feet) of the highway alignment may be necessary in this area if the right shoulder cannot provide enough width. There is plenty of clearance on the left shoulder on the bridge to allow for this shift.
I-95 southbound experiences chronic congestion during the AM peak period. While the merge from Commerce Way is not directly adjacent to the problem area, it is possible that it contributes to congested conditions on I-95, which may in turn reduce the capacity of the Exit 37B ramp.
While the existing acceleration lane is adequate according to MassDOT design standards, the ramp serves a high volume of traffic (1,200 vehicles per hour) during the AM peak. Extending the acceleration lane would help this traffic merge onto the I-95 mainline safely and efficiently.
Figure 12 shows the improvements recommended in Alternative 2:
Because the demand flow rate at Exit 37B (2,100 vehicles per hour) exceeds the capacity for a single-lane roadway, it is likely that the ramp itself is the limiting factor at this interchange. For this reason, the MPO staff decided to compare the advantages of this higher-cost alternative that would have the potential to increase capacity on the exit ramp.
Using a two-lane ramp at Exit 37B would require significant geometric changes on both I-93 southbound and I-95 southbound. Figure 13 shows the improvements recommended in Alternative 3:
While all of the other modifications mentioned above would be relatively minor in scale, the expansion of the ramp would require construction and, possibly, land takings, both at significant cost. The existing ramp is tightly spaced: directly abutting it to the left is the on-ramp from I-95 southbound, while the nearest property line is only approximately 50 feet from the edge of the pavement. There is also a fairly significant downgrade in this direction, meaning adding a lane on the right side of the ramp would probably require fill, and the resulting embankment could extend beyond the existing right-of-way.
Table 8 presents the 2030 future LOS analyses compiled using the HCS software. Results for the no-build scenario are compared against Alternative 1, Alternative 2, and Alternative 3 for all facilities where modifications affect system operations. All scenarios use a uniform five percent growth for 2030 traffic volumes. Approximations made as part of the HCM analysis are given where applicable.
TABLE 8
LOS Analysis–Improvement Alternatives:Location 2: I-93 Southbound Segment between Exit 37C (Commerce Way) and Exit 37B (I-95)
Scenario |
Density (pc/lane mile) |
Speed (mph) |
V/C Ratio |
LOS |
|
HCM Analysis Type: Basic Freeway Segment |
|||||
I-93 southbound: Between Exit 37C and Exit 37B |
No-Build |
35.2 |
57.8 |
0.88 |
E |
Alt 1 |
26.3 |
62.0 |
0.70 |
D |
|
I-93 southbound: After Exit 37B |
No-Build |
24.4 |
62.2 |
0.65 |
C |
Alt 3 |
35.0 |
57.9 |
0.87 |
D |
|
I-95 southbound: Between Exit 37 and Exit 36 |
No-Build |
34.0 |
51.3 |
0.79 |
D |
Alt 3 |
27.6 |
50.7 |
0.63 |
D |
|
HCM Analysis Type: Merge Area |
|||||
I-93 southbound: Ramp from Commerce Waya |
No-Build |
35.5 |
56.8 |
0.87 |
C |
Alt 1 |
35.3 |
57.4 |
0.87 |
C |
|
I-95 southbound: Ramp from Commerce Way |
No-Build |
38.8 |
49.0 |
0.85 |
D |
Alt 2 |
38.6 |
49.4 |
0.85 |
C |
|
I-95 southbound: Ramp from I-93 southbound |
No-Build |
N/Ab |
N/A |
0.78 |
F |
Alt 3 |
34.0 |
51.2 |
0.78 |
A |
|
HCM Analysis Type: Diverge Area |
|||||
I-93 southbound: Exit 37B to I-95 southbound |
No-Build |
N/A |
N/A |
0.87 |
F |
Alt 1 |
N/A |
N/A |
0.87 |
F |
|
Alt 3c |
35.7 |
48.9 |
0.87 |
A |
|
I-95 southbound: Exit 36 to Commerce Way |
No-Build |
33.5 |
47.8 |
0.83 |
D |
Alt 3 |
35.2 |
47.8 |
0.87 |
C |
|
HCM Analysis Type: Weaving Segmentd |
|||||
I-95 southbound: Between Exit 37 and Exit 36 |
No-Build |
N/A |
N/A |
1.19 |
F |
Alt 3 |
N/A |
N/A |
1.19 |
F |
|
a Uses an acceleration lane of 1,500 feet as an approximation for a full auxiliary lane in the Alternative 1 and Alternative 3 merge and diverge models. b HCM does not provide density and speed data for scenarios that result in LOS F. c Uses a diverge segment of four through lanes for Alternative 3; therefore, limiting factor is diverge capacity and not mainline capacity. (HCM analysis assumes lanes are never dropped after diverge.) d Uses a weaving segment of five lanes; therefore, limiting factor is weaving behavior and not mainline capacity. (HCM weaving analysis assumes a lane drop after the merge.) HCM = Highway Capacity Manual; LOS = level of service; mph = miles per hour; pc/lane mile = passenger cars per lane mile; V/C = volume-to-capacity |
|||||
CMF from HSM and the CMF Clearinghouse shows that adding a continuous auxiliary lane for weaving between entrance ramp and exit ramp would reduce crashes by 20 to 25 percent. Alternative 1 was able to improve the LOS of the basic freeway segment on I-93 southbound from LOS E to LOS D, meaning capacity of the facility was significantly improved.
The LOS experienced by motorists using Exit 37B remains unchanged at LOS F because the ramp capacity is unaffected. The V/C ratio of the Exit 37B ramp roadway increases from 1.14 to 1.20 under 2030 no-build conditions, resulting in LOS F performance for both the diverge at Exit 37B and the merge with I-93 southbound at the end of the ramp. However, these metrics do not take into account the safety and driver comfort provided by the additional queue space present under Alternative 1.
Alternative 1 is estimated to cost between $100,000 to $200,000 to construct. This estimate includes preparing the shoulder for a travel lane, restriping travel lanes, relocation and installation of signs, new rumble strips, and pavement markings. New paving may be required if an emergency pullover area is necessary.
CMF from HSM and the CMF Clearinghouse shows that lengthening an acceleration lane would reduce crashes by 10 to 20 percent. Alternative 2 was able to increase LOS at the on-ramp at Exit 36 (from Commerce Way to I-95 southbound) from D to C, even though the speed and density at this merge were essentially unchanged. This may lead to an improvement, albeit small, in the overall capacity of I-95 southbound in this area. While this may also lead to improved operations at the I-93 interchange and consequently at the bottleneck on I-93 southbound, HCM analysis methods are unable to directly correlate these two outcomes.
Alternative 2 is estimated to cost between $50,000 and $75,000 to construct and would require lengthening the acceleration lane, restriping travel lanes, minor paving, and relocating rumble strips.
CMF for converting a single-lane exit into a two-lane exit shows that Alternative 2 would reduce crashes at Exit 37B by up to 30 percent. Alternative 3 was the only option able to improve the LOS on the facilities at Exit 37B. Both the merge and diverge area change from LOS F to LOS A when the ramp is widened to two lanes. Accordingly, the V/C ratio for the ramp roadway is cut in half, improving from 1.20 to 0.60. This configuration required removing a lane on I-93 southbound downstream from the exit, which lowered the LOS in this area from C to D.
While the projected LOS improvements under Alternative 3 are significant, in reality induced demand as direct result of the improvements could lower the LOS from A to B or C. Alternative 3 is estimated to cost approximately $ 1.0million, which would include widening on the ramp to two lanes, reconfiguring travel lanes on both I-93 and I-95, installing new signs, preparing the shoulder on I-95 southbound for a travel lane, and new paving and rumble strips.
The Massachusetts Office of Transportation Planning has a long-range plan for the I-93/I-95 interchange because of its chronic problems. Conceptual alternatives for this plan are focused around adding flyovers or underpasses for some of the ramps at the interchange. Although it would keep all ramps with a single lane, this design would reduce the number of merge areas and make all ramps high speed, both of which would greatly increase overall capacity at the interchange. The new configuration would also reduce traffic noise experienced in neighboring residential communities by increasing clearance and adding noise barriers. The potential major investment planned at this interchange should be taken into account when deciding on short-term solutions.
MPO staff recommends Alternatives 1 and 2, both of which are low-cost solutions. Together, they would produce maximum operational benefits as Alternative 2 would reduce a downstream bottleneck and allow the auxiliary lane to function well. Because the I-93 and I-95 interchange already has a long-term improvement planned for it, the low-cost improvements identified in Alternatives 1 and 2 align with the objectives and vision for the interchange. Although Alternative 3 improves the LOS on the exit ramp, it is costly and will affect the abutting properties, and must be considered while taking into account the long-term plans for the interchange.
13 The AM peak period is 6:00 AM to 10:00 AM, and the PM peak period is 3:00 PM to 7:00 PM. Source: Central Transportation Planning Staff.
14 Acceleration and deceleration lanes are measured from the point where the lane reaches 12 feet wide to the first controlling curve. Source: A Policy on Geometric Design of Highways and Streets, AASHTO, 2004. Chapter 10 Grade Separations and Interchanges.
15 200 vehicles per hour estimate uses a one-mile queue of vehicles spaced with 25-foot headways.
16 Highway Capacity Software 7, Version 7.3, McTrans Center, PO Box 116585, Gainesville, Florida, 2017.
17 1-93/I-95 Interchange Transportation Study, produced by the Massachusetts Executive Office of Transportation Office of Transportation Planning, June 2007.
Chapter 6—Location 3: Route 24 Northbound Segment between Exit 20 (Route 139) and Exit 21 (I-93) in Randolph, Canton, and Stoughton
Location 3 is a stretch of Route 24 northbound leading up to its northern terminus at the interchange with Interstate 93 (Route 24, Exit 21). Figure 1 shows the location of the bottleneck within the MPO region. The high volumes at this merge are the main cause for poor operating conditions. During the AM peak period, congestion can extend south for more than five miles, all the way into Avon.18 The segment in question begins in Stoughton, which is in MassDOT Highway Division, District 5, and continues north through Canton and Randolph, which are both in MassDOT Highway Division, District 6.
Operations at this bottleneck are associated with the freeway components described below.
Route 24 northbound is a freeway segment with three 12-foot travel lanes, a 12- to 13-foot right shoulder, and a two- to three-foot left shoulder. This segment carries volumes of up to 4,600 vehicles per hour during the AM peak because of the severe bottleneck at the interchange with I-93, with trucks comprising a not insignificant amount of the volume at approximately five percent. The posted speed limit is 65 mph on the Route 24 northbound mainline and decreases to 50 mph at the ramps. Rumble strips are present on the right side of the northbound barrel.
A major diverge occurs when a basic freeway segment with three or more lanes splits into two multilane roadways. This is the case at the end of Route 24 northbound, where the main barrel splits into two two-lane, high-speed ramp segments that connect to I-93 northbound and southbound. The speed limit decreases from 65 mph to 50 mph at the connector ramps.
The right branch of Route 24 northbound merges with I-93 northbound at a major merge area. Figure 14 shows the lane configuration at this location. Here, the two-lane ramp merges into the right side of the three-lane main barrel. These five total lanes become a four-lane freeway by combining the two center lanes. This ramp serves approximately 2,300 vehicles per hour during the AM peak period.
The left branch of Route 24 northbound merges with I-93 southbound on the left-hand side, and continues in its own lane as shown in Figure 15. Approximately 1,200 feet before the merge with I-93, however, the two-lane traffic on the ramp is forced to merge into a single travel lane. This is the result of restriping that took place between 2010 and 2013.19 This ramp serves approximately 2,300 vehicles per hour during the AM peak period.
The existing bottleneck creates intense interruption of traffic flow during the AM peak travel period. During these hours, queues of up to five miles long form as drivers wait to merge onto I-93 southbound. These waiting drivers back up onto the Route 24 northbound mainline and prevent vehicles from accessing the otherwise uncongested ramp to I-93 northbound. This scenario results in slow speeds and low LOS that affect virtually all drivers using the facility. The bottleneck also likely contributes to crashes in this area.
MPO staff identified four primary factors contributing to this bottleneck:
Figure 14 shows the hourly traffic flow during the AM peak period. Usage of both the I-93 ramps is very high, especially in the AM peak as traffic flows north towards Boston and the business areas located along Route 128. The merging and diverging maneuvers of these vehicles interrupt traffic flow and reduce capacity, resulting in a traffic bottleneck.
The three-lane Route 24 northbound barrel begins to widen to four lanes only approximately 190 feet ahead of the painted gore nose at the I-93 ramps. The short maneuvering distance available causes sudden maneuvers, reducing speeds and producing unsafe conditions.
The ramp to I-93 southbound serves up to 2,300 vehicles per hour during the AM peak. On most mornings there is also a queue of vehicles waiting to use the ramp that can extend for up to five miles down Route 24. MPO staff estimate that the presence of a queue in this location adds 700 vehicles per hour to the peak value, bringing total peak demand for the I-93 southbound ramp to 3,000 vehicles per hour.20
According to the HCM, the capacity for a single lane ramp roadway segment with a free-flow speed of 50 mph is 2,200 vehicles per hour.21 Therefore the practical capacity of this ramp is exceeded even before queued vehicles are considered. This leads to severe congestion and is the largest contributor to bottleneck conditions at this location.
At major merge locations with lane drops, MassDOT design standards recommend that only the rightmost lanes be forced to merge. This is not the case at the I-93 northbound merge, where the middle lanes merge. Merging these lanes instead of the exterior lanes causes safety issues because of the higher vehicle speeds, and also may lead to confusion regarding who has the right of way. The merge also begins only 90 feet from the end of the gore area, forcing drivers to make very rapid maneuvers.
Because of the proximity to the next off-ramp (the ramp to Route 28 southbound begins to diverge only 1,450 feet downstream from the Route 24 merge), the only option for changing the geometry at this merge is to add an auxiliary lane covering the full distance between the two ramps. The existing shoulder along this stretch is not adequate to accommodate a fifth travel lane; creating an auxiliary lane would require extensive paving and fill, making this a high-cost option and, therefore, outside of the scope of this report. An analysis of an auxiliary lane on this segment of I-93 northbound can be found in the Boston MPO’s 2007 memorandum “Safety and Operational Improvements for the I-93/Route 24 Interchange.”22
A summary of the crashes in this segment is presented in Table 9. There were 96 crashes in this area between 2010 and 2014 (Appendix C). Figure 15 shows the location of these crashes. The majority (63 crashes) occurred leading up to the diverge at the I-93 interchange.
TABLE 9
Crash Summary (2010–14): Location 3: Route 24 Northbound Segment between Exit 20 (Route 139) and Exit 21 (I-93)
|
Number of Crashes |
|||
Crash Variable |
Rte. 24 NB Exit 21 (Diverge) |
Merge with I-93 NB |
Merge with I-93 SB |
Total |
Crash severity |
|
|
|
|
Fatal injury |
1 |
0 |
0 |
1 |
Non-fatal injury |
22 |
7 |
4 |
33 |
Property damage only |
32 |
10 |
10 |
52 |
Not reported |
8 |
1 |
1 |
10 |
Manner of collision |
|
|
|
|
Angle |
1 |
3 |
1 |
5 |
Head-on |
0 |
0 |
1 |
1 |
Rear-end |
24 |
9 |
4 |
37 |
Sideswipe, same direction |
10 |
2 |
2 |
14 |
Single-vehicle crash |
28 |
4 |
7 |
39 |
Road surface conditions |
|
|
|
|
Dry |
52 |
13 |
10 |
75 |
Snow |
3 |
0 |
1 |
4 |
Wet |
8 |
5 |
4 |
17 |
Ambient light conditions |
|
|
|
|
Dawn |
3 |
1 |
0 |
4 |
Daylight |
38 |
11 |
12 |
61 |
2 |
1 |
1 |
4 |
|
Dark: lighted roadway |
3 |
2 |
1 |
6 |
Dark: roadway not lighted |
16 |
3 |
1 |
20 |
Dark: unknown lighting |
1 |
0 |
0 |
1 |
Weather conditions |
|
|
|
|
Clear |
41 |
11 |
7 |
59 |
Cloudy |
10 |
0 |
3 |
13 |
Rain |
1 |
3 |
2 |
6 |
Snow |
4 |
0 |
1 |
5 |
Not reported |
7 |
4 |
2 |
13 |
Travel period |
|
|
|
|
Peak |
27 |
7 |
8 |
42 |
Off-peak |
36 |
11 |
7 |
54 |
Total crashes |
63 |
18 |
15 |
96 |
Five-year average (rounded) |
13 |
4 |
3 |
19 |
NB = northbound; SB = southbound
Below is a summary of the crashes in this area:
Figure 16 is a congestion scan that shows the average travel speeds on Route 24 northbound ahead of the bottleneck at the I-93 interchange. Congestion at this location reduces travel speeds to less than 35 mph between the hours of 6 AM and 9 AM. Vehicle speeds this far below free-flow correlate with a freeway LOS of F. Speeds on this segment can fall to less than 25 mph for up to 45 minutes at a time. Varying levels of congestion extend for more than six miles down Route 24. One notable feature of the congestion scan is that speeds begin to improve slightly approximately one-half mile ahead of the interchange. This is the result of traffic headed to I-93 northbound finally being able to pass the queue for I-93 southbound when they near the ramps. No congestion develops outside of AM peak hours.
Travel on I-93 is also affected by this bottleneck. Figure 17 shows a congestion scan for I-93 northbound near Route 24, and Figure 18 shows a congestion scan for I-93 southbound near Route 24. The congestion scans show moderate congestion on these roadways during the AM peak period. On I-93 northbound, traffic near the Route 24 interchange slows less than 45 mph between the hours of 8 AM and 9 AM. However, the scan shows that this is the tail end of congestion that originates further north on I-93. On I-93 southbound, congestion present between 7 AM and 9 AM slows travel speeds to less than 45 mph. Unlike the congestion in the northbound direction, this slowdown peaks around the Route 24 interchanges and begins to dissipate soon afterwards, suggesting that this interchange is the cause.
MPO staff conducted traffic operations analyses consistent with HCM methodologies. Using the MassDOT data, MPO staff built traffic analysis networks for the AM peak hours with the HCS suite to assess the capacity and quality of traffic flow at the bottleneck area.23 Full HCS reports are included in Appendix D.
Unfortunately, the HCM is unable to model performance effectively for major merge or diverge areas. LOS can be approximated by checking capacities of each component segment as basic freeway segments. However, using a basic freeway segment tends to overestimate the capacity of merge or diverge areas because merging maneuvers are ignored and because traffic is assumed to be evenly distributed across all lanes. The results of the analysis are shown in Table 10.
TABLE 10
LOS Analysis–Existing Conditions: Location 3: Route 24 Northbound Segment between Exit 20 (Route 139) and Exit 21 (I-93)
Location |
Density (pc/lane mile) |
Speed (mph)a |
V/C Ratio |
LOSb |
HCM Analysis Type: Basic Freeway Segment |
||||
25.9 |
62.5 |
0.70 |
C |
|
HCM Analysis Type: Merge Areac |
||||
Merge with I-93 southbound |
N/Ad |
N/A |
0.79 |
F |
HCM Analysis Type: Basic Freeway Segment |
||||
I-93 southbound downstream from merge |
33.9 |
51.8 |
0.79 |
D |
a Refers to ramp influence area speed for merge/diverge areas. b LOS A through LOS D represent acceptable operating conditions; LOS E represents operating conditions at capacity; and LOS F represents failing conditions (demand exceeds capacity). c Uses maximum acceleration lane length of 1,500 feet and a four-lane mainline to approximate a lane addition at this merge. d HCM does not provide density and speed data for scenarios that result in LOS F. HCM = Highway Capacity Manual; LOS = level of service; mph = miles per hour; pc/lane mile = passenger cars per lane mile; V/C = volume-to-capacity |
||||
Table 10 shows that the merge to I-93 southbound operates at LOS F during the AM peak period. However, the V/C ratio for this facility is well below 1.0, indicating that its capacity to accommodate merge maneuvers is not exceeded. The reason the facility fails is because the ramp itself is over capacity: the ramp roadway has a V/C ratio of 1.16, meaning the volume experienced on this ramp is 16 percent above the theoretical maximum throughput of a ramp with the given characteristics. (Any V/C ratio above 1.0 causes LOS F operations.) The merge area operates at LOS C during the AM peak, although, as stated before, this model is an approximation that will generally predict a LOS better than that experienced by drivers.
MPO staff developed the following improvements to address safety and operational issues at the bottleneck:
The alternatives were analyzed using projected year 2030 traffic volumes. MPO staff estimated a five percent total background growth from 2017 to 2030.
The 36-foot, three-lane mainline of Route 24 northbound widens to a 48-foot, four-lane diverge section only approximately 200 feet before the tip of the merge gore area. MPO staff recommends extending the four lanes present on the ramp for 1,200 feet down Route 24.
Figure 19 shows the improvements recommended in Alternative 1:
The modifications present in Alternative 1 help to address the vehicle slowdowns and safety risks that come as a result of turbulence ahead of the Exit 21 diverge. What is not addressed, however, is the fact that the queue for I-93 southbound inhibits vehicles from using the ramp to I-93 northbound. Since Alternative 1 only proposes a fourth lane across a distance of approximately one-quarter mile, any queues longer than this still have the potential to block access to the northbound ramp.
Alternative 2 would extend the fourth travel lane nearly one mile down to the bridge over Canton Street in Randolph. This would provide more room for approximately 400 vehicles to queue in the left two lanes for I-93 southbound without interrupting other traffic. While there is adequate right-hand side shoulder space for a fourth lane along almost this entire stretch, accommodating the horse bridge that passes over Route 24 may require a slight shift to the left of the traveled way.
Figure 20 shows the improvements recommended in Alternative 2:
The ramp from Route 24 northbound to I-93 southbound is wide enough to accommodate two travel lanes and was previously striped in this way. MPO staff recommends returning to a two-lane ramp to better meet the demand during the AM peak period.
Figure 21 shows the improvements recommended in Alternative 3:
The length of the acceleration lane and subsequent taper may be limited by the culvert structure that carries the Blue Hill River.
Table 11 presents the 2030 future LOS analyses compiled using the HCS software. Results for the no-build scenario are compared against Alternatives 1 and 2 combined and Alternative 3 for all facilities where modifications affect system operations. (The main difference between Alternative 1 and Alternative 2 is the queue length they can accommodate, and because this does not affect HCM analysis they are combined in Table 11.) All scenarios use a uniform five percent growth for 2030 traffic volumes. Approximations made as part of the HCM analysis are given where applicable.
TABLE 11
LOS Analysis–Improvement Alternatives: Location 3: Route 24 Northbound Segment between Exit 20 (Route 139) and Exit 21 (I-93)
Location |
Scenario |
Density (pc/lane mile) |
Speed (mph) |
V/C Ratio |
LOS |
|
HCM Analysis Type: Basic Freeway Segment |
||||||
Route 24 northbound at diverge |
No-Build |
27.4 |
62.0 |
0.73 |
D |
|
Alt 1 and 2 |
20.7 |
61.5 |
0.55 |
C |
||
I-93 southbound after merge |
No-Build |
35.6 |
51.8 |
0.83 |
E |
|
HCM Analysis Type: Merge Areaa |
||||||
Merge with I-93 southbound |
No-Build |
N/Ab |
N/A |
0.83 |
F |
|
Alt 3 |
36.6 |
51.0 |
0.83 |
B |
||
a Uses maximum acceleration lane length of 1,500 feet and a four-lane mainline to approximate a lane addition at this merge. b HCM does not provide density and speed data for scenarios that result in LOS F. HCM = Highway Capacity Manual; LOS = level of service; mph = miles per hour; pc/lane mile = passenger cars per lane mile; V/C = volume-to-capacity |
||||||
A CMF is an estimate of the change in crashes expected after implementation of a countermeasure. Using CMFs from the CMF Clearinghouse for installing an additional lane for an urban freeway shows that Alternative 1 would reduce crashes at the diverge area by up to 20 percent.24 ,25 As mentioned before, the only methodology HCM provides to study major diverge areas is to model them as basic freeway segments. Table 11 compares an analysis of a three-lane basic freeway segment at the diverge with a four-lane basic freeway segment. The additional lane improves LOS by one level over the no-build scenario, bringing it to LOS C from LOS D during the AM peak period.
The basic freeway segment analysis can be misleading because the real cause of the bottleneck is diverging vehicles and not the base capacity of the freeway. However, the analysis demonstrates that adding the lane significantly increases capacity. This increased capacity will help to offset the capacity reduction resulting from the diverge. The extra lanes will also help avoid driver confusion at the split lane, and allow traffic heading to I-93 northbound to bypass the queued traffic heading to I-93 southbound during the AM peak period.
Alternative 1 is estimated to cost between $100,000 and $200,000 to construct. This estimate includes preparing the shoulder for a travel lane, restriping travel lanes, relocation and installation of signs, and minor pavement markings. It may require a DER for using a less-than-minimal right shoulder. New paving may be required if an emergency pullover area is necessary.
Alternative 2 is expected to reduce crashes by the same percentage as in Alternative 1. Based on parameters that HCM methodology can measure, Alternative 2 performs the same as Alternative 1. However, the extended fourth travel lane will increase capacity on Route 24 over a longer distance and allow more drivers to use this extra lane to skip morning queues that develop in advance of the I-93 southbound merge. Alternative 2 is estimated to cost between $300,000 and $400,000 to construct. Similar to Alternative 1, Alternative 2 may require a DER for using a less-than-minimal right shoulder, and new paving may be required if an emergency pullover area is necessary.
Using CMFs from the HSM and the CMF Clearinghouse for lengthening an acceleration lane show that Alternative 3 would reduce crashes at the merge area by 10 to 20 percent.26 ,27 Using estimates for ramp roadway capacity, the single lane I-93 southbound ramp will be at a V/C ratio of 1.21 under the 2030 no-build scenario. A V/C ratio higher than 1.0 indicates that not only is user experience very poor, but that the facility cannot meet demand and extensive queues will form. This may lead to problems on nearby facilities. With a two-lane ramp, the V/C ratio drops to 0.61, demonstrating that two lanes are sufficient to meet the projected future demand.
The one- and two-lane ramps were also compared as traditional merge segments. Using this analysis, the two-lane ramp improved from LOS F to LOS B. However, the downstream basic freeway segment (after I-93 southbound returns to four travel lanes) has a LOS of E in 2030 and will not be changed by either proposed alternative. Therefore the downstream freeway segment is the limiting factor, meaning that only merging vehicles will see improved operations and through traffic will experience no change from Alternative 3.
Alternative 3 is estimated to cost between $100,000 and $200,000 to construct. This estimate consists of restriping the connector ramp, pavement markings, and preparing a short segment of shoulder on I-93 southbound to allow a two-lane entry from Route 24 northbound to I-93 southbound.
MPO staff recommends implementation of both Alternative 2 and Alternative 3 to improve operational efficiency for all traffic on Route 24 northbound. For a more in-depth discussion of alternatives affecting this bottleneck, including right-hand ramps and auxiliary lane additions, refer to the Boston MPO’s 2007 report on this location.28
18 The AM peak period is 6:00 AM to 10:00 AM, and the PM peak period is 3:00 PM to 7:00 PM. Source: Central Transportation Planning Staff.
19 I-93 and I-95 Transportation Improvement Project. This project, which is currently under construction, added a lane in each direction to I-93 and I-95 from Randolph to Wellesley.
20 700 vehicles per hour estimate uses a five-mile queue of vehicles spaced with 25-foot headways, spread over 1.5 lanes, and dispersed over the course of two hours.
21 Highway Capacity Manual 2010, Transportation Research Board of the National Academies, Washington, DC, December 2010. 13-18.
22 Seth Asante, MPO staff, memorandum to the Transportation Planning and Programming Committee of the Boston Region MPO, “Safety and Operational Improvements for the I-93/Route 24 Interchange,” September 2007.
23 Highway Capacity Software 7, Version 7.3, McTrans Center, PO Box 116585, Gainesville, Florida, 2017.
24 American Association of State Highway and Transportation Officials. Highway Safety Manual. Washington, DC, 2010.
25 Crash Modification Factors Clearinghouse, www.cmfclearinghouse.org/index.cfm
26 American Association of State Highway and Transportation Officials. Highway Safety Manual. Washington, DC, 2010.
27 Crash Modification Factors Clearinghouse, www.cmfclearinghouse.org/index.cfm
Chapter 7—Location 4: Route 24 Southbound Segment between Exit 21 (I-93) and Exit 20 (Route 139) in Randolph, Canton, and Stoughton
Location 4 is on Route 24 southbound after the Interstate 93 interchange. Figure 1 shows the location of the bottleneck within the MPO region. The high volumes at these ramps are the main cause of poor operating conditions. Heavy congestion is usually present on both the Route 24 southbound ramps for the entire duration of the PM peak period.29 The study area begins at the I-93 interchange in Randolph (I-93 Exit 4) and extends southward through Canton to the Route 139 ramp in Stoughton (Route 24 Exit 20). Randolph and Canton are part of MassDOT Highway Division, District 6 and Stoughton is part of District 5. This bottleneck parallels Location 3 in the southbound direction.
Operations at this bottleneck are associated with the freeway components described below.
A major diverge occurs when a basic freeway segment with three or more lanes splits into two multilane primary freeway segments. The off-ramps leading to Route 24 southbound are two-lane ramps splitting from a four-lane freeway, qualifying them as major diverge areas. Both geometries use a center lane that splits into two at the diverge, and both ramps have a speed limit of 50 mph. However, the ramp from I-93 southbound is a left-hand side diverge while the northbound ramp is a right-hand side diverge. Demand for these ramps is highest during the PM peak, with up to 2,700 vehicles per hour using the ramp from I-93 northbound and up to 2,600 vehicles per hour using the ramp from I-93 southbound.
The two Route 24 southbound ramps meet at a major merge area. The configuration at this location has two two-lane ramps merging to become the three-lane Route 24 southbound barrel. Lane balance is achieved by combining the two center lanes. This junction serves 6,200 vehicles per hour during the PM peak period.
Route 24 southbound is a freeway segment with three 12-foot travel lanes, a 12- to 13-foot right shoulder, and a two- to three-foot left shoulder. The posted speed limit is 65 mph on the Route 24 southbound mainline. Rumble strips are present on the right side of the southern barrel.
The existing bottleneck creates intense interruption of traffic flow during the PM peak travel period. During these hours, travel speeds are reduced and queues back up on both ramps leading to Route 24 southbound. These waiting drivers can spill onto both branches of I-93 and interfere with through traffic. In addition, the bottleneck likely contributes to crashes in this area.
MPO staff identified two primary factors contributing to this bottleneck:
Figure 22 shows the hourly traffic flow during the PM peak periods. Usage of both the I-93 ramps is very high in the evening hours as traffic flows south out of Boston. The merging and diverging maneuvers of these vehicles interrupt traffic flow and reduce capacity, resulting in a traffic bottleneck.
The geometry where the ramps from I-93 merge is problematic for two reasons. First, the merge distance is very short. The 48-foot width present where the four ramp lanes meet begins to narrow and merge into three lanes immediately after the end of the painted gore nose. Drivers using the two center lanes are forced to make merge decisions quickly as they negotiate for space with drivers in the opposite lane. This effect is amplified by the high-posted speed (50 mph) present on the ramps. The result is sudden merge maneuvers that lead to braking, reduced speeds, and unsafe conditions.
Second, the practice of merging the two center lanes at a major merge is not recommended. Unlike with a left- or right-hand side merge where vehicles in the merging lane must yield to through traffic, with a center merge neither movement has a clear right of way. Communication errors can lead to angle crashes when a driver refuses to yield and rear-end crashes when a driver yields unexpectedly. Where a lane drop at a major merge is necessary, the current MassDOT design guide recommends instead continuing all travel lanes for at least 1,000 feet and then merging the rightmost lane into the main barrel.
A summary of the crashes in this segment is presented in Table 12. There were 238 crashes in this area between 2010 and 2014 (Appendix C). Figure 23 shows the location of these crashes. Crashes were very high at all three locations studied, with both I-93 exits registering almost 100 crashes each.
TABLE 12
Crash Summary (2010–14):Location 4: Route 24 Southbound Segment between Exit 21 (I-93) and Exit 20 (Route 139)
|
Number of Crashes |
|||
Crash Variable |
Rte. 24 SB at Merge |
I-93 NB Exit 4 to Rte. 24 SB |
I-93 SB Exit 4 to Rte. 24 SB |
Total |
Crash severity |
|
|
|
|
Fatal injury |
0 |
0 |
0 |
0 |
Non-fatal injury |
14 |
25 |
25 |
64 |
Property damage only |
42 |
61 |
65 |
168 |
Not reported |
2 |
2 |
2 |
6 |
Manner of collision |
|
|
|
|
Rear-end |
20 |
58 |
51 |
129 |
Sideswipe, same direction |
9 |
10 |
16 |
35 |
Single-vehicle crash |
23 |
14 |
19 |
56 |
Angle |
5 |
4 |
4 |
13 |
Head-on |
0 |
1 |
1 |
2 |
Not reported |
1 |
1 |
1 |
3 |
Road surface conditions |
|
|
|
|
Snow |
0 |
1 |
0 |
1 |
Wet |
13 |
13 |
26 |
52 |
Dry |
45 |
74 |
64 |
183 |
Not reported |
0 |
0 |
2 |
2 |
Ambient light conditions |
|
|
|
|
Dawn |
0 |
0 |
3 |
3 |
Daylight |
31 |
50 |
58 |
139 |
Dusk |
1 |
2 |
2 |
5 |
Dark: lighted roadway |
18 |
27 |
20 |
65 |
Dark: roadway not lighted |
7 |
9 |
8 |
24 |
Dark: unknown lighting |
1 |
0 |
0 |
1 |
Not reported |
0 |
0 |
1 |
1 |
Weather conditions |
|
|
|
|
Clear |
33 |
51 |
55 |
139 |
Cloudy |
5 |
7 |
15 |
27 |
Rain |
10 |
9 |
14 |
33 |
Snow |
0 |
1 |
0 |
1 |
Not reported |
10 |
20 |
8 |
38 |
Travel period |
|
|
|
|
Peak |
22 |
58 |
52 |
132 |
Off-peak |
36 |
30 |
40 |
106 |
Total crashes |
58 |
88 |
92 |
238 |
Five-year average (rounded) |
12 |
18 |
18 |
48 |
NB = northbound; SB = southbound
Below is a summary of the crashes in this segment:
Figure 24 is a congestion scan that shows the average travel speeds on Route 24 southbound at the bottleneck location. Congestion at this location reduces travel speeds near the merge to less than 50 mph between the hours of 4 PM and 5 PM. These vehicle speeds correspond to LOS E conditions. Congestion begins to dissipate rapidly once the merge is passed and is almost entirely cleared two miles south of the I-93 interchange.
Figure 17 and Figure 18 contain congestion scans for I-93 northbound and I-93 southbound respectively. These figures demonstrate that the evening traffic peak lasts much longer than the morning peak, as congestion is present near Route 24 on I-93 northbound and southbound between 4 PM and 7 PM. In both directions, travel speeds are decreased to less than 35 mph for three hours at a time. However, traffic on I-93 begins to clear once Route 24 is passed and travel speeds rapidly return to free-flow speed, especially in the southbound direction.
MPO staff conducted traffic operations analyses consistent with HCM methodologies. Using the MassDOT data, MPO staff built traffic analysis networks for the PM peak hours with the HCS suite to assess the capacity and quality of traffic flow at the bottleneck area.30 Full HCS reports are included in Appendix D.
As mentioned in the previous chapter, the HCM is unable to model performance effectively for major merge or diverge areas. LOS can be approximated by checking capacities of each component segment as basic freeway segments. Using a basic freeway segment ignores merging maneuvers and distributes traffic evenly across all lanes, leading to an overstated capacity for these facilities. The results of the analysis are shown in Table 13.
TABLE 13
LOS Analysis–Existing Conditions:Location 4: Route 24 Southbound Segment between Exit 21 (I-93) and Exit 20 (Route 139)
Location |
Density (pc/lane mile) |
Speed (mph)a |
V/C Ratio |
LOSb |
HCM Analysis Type: Basic Freeway Segment |
||||
Route 24 southbound at merge |
28.8 |
61.5 |
0.76 |
D |
a Refers to ramp influence area speed for merge/diverge areas. b LOS A through LOS D represent acceptable operating conditions; LOS E represents operating conditions at capacity; and LOS F represents failing conditions (demand exceeds capacity). HCM = Highway Capacity Manual; LOS = level of service; mph = miles per hour; pc/lane mile = passenger cars per lane mile; V/C = volume-to-capacity |
||||
Table 13 shows LOS D for the merge segment, although as mentioned above this is an approximation. Speed data and field observations show much slower speeds indicative of LOS E or LOS F.
Unlike in Location 3, ramp roadway capacity is not a limiting factor at Route 24 southbound. Both of the ramps at this bottleneck location use a two-lane design that has a theoretical capacity of 4,400 vehicles per hour.31 This means that the capacity of the ramp roadway facilities at Location 4 is well above the demand flow rate and does not become a limiting factor in system performance.
MPO staff identified a low-cost improvement to address safety and operational issues at the bottleneck:
The alternative was analyzed using projected year 2030 traffic volumes. MPO staff estimated a five percent total background growth from 2015 to 2030.
The 48-foot width present where the ramps intersect begins to narrow almost immediately after the painted gore nose. The freeway becomes a 36-foot, three-lane segment within approximately 400 feet. MPO staff recommends bringing this merge in line with the MassDOT standards by extending the four lanes present on the ramps for approximately 1,000 feet down Route 24 and by using a right-hand lane drop.
Figure 25 shows the improvements recommended in Alternative 1:
Table 14 presents the 2030 future LOS analysis compiled using the HCS software. Results for the no-build scenario are compared against Alternative 1. Both scenarios use a uniform five percent growth for 2030 traffic volumes.
TABLE 14
LOS Analysis–Improvement Alternatives:Location 4: Route 24 Southbound Segment between Exit 21 (I-93) and Exit 20 (Route 139)
Location |
Scenario |
Density (pc/lane mile) |
Speed (mph) |
V/C Ratio |
LOS |
HCM Analysis Type: Basic Freeway Segment |
|||||
Route 24 southbound at merge |
No-Build |
30.7 |
60.6 |
0.80 |
D |
Alt 1 |
22.7 |
61.5 |
0.60 |
C |
|
HCM = Highway Capacity Manual; LOS = level of service; mph = miles per hour; pc/lane mile = passenger cars per lane mile; V/C = volume-to-capacity
Using CMFs from the CMF Clearinghouse for installing an additional lane for an urban freeway shows that Alternative 3 would reduce crashes at the merge area by up to 20 percent. In addition, Table 14 compares an analysis of a three-lane basic freeway segment at the merge with a four-lane basic freeway segment. The additional lane improves LOS by one level over the no-build scenario, from LOS D to LOS C in the PM peak.
The basic freeway segment analysis can be misleading because the real cause of the bottleneck is merging maneuvers of vehicles and not the base capacity of the freeway. However, the HCM model does show that adding the lane increases capacity significantly. This increased capacity will help mitigate the capacity reduction resulting from merge maneuvers. Changing the center merge to an exterior merge will also improve safety and bring the geometry at the interchange in line with MassDOT standards.
Alternative 1 is estimated to cost between $100,000 and $200,000 to construct. This estimate includes preparing the shoulder for travel lane, restriping travel lanes, relocation and installation of signs, and minor pavement markings. New paving may be required if an emergency pullover area is found to be necessary.
MPO staff recommends implementation of Alternative 1 to improve operational efficiency and safety for all traffic headed to Route 24 southbound.
Chapter 8—Conclusion and Next Steps
MPO staff, working in conjunction with the MassDOT Highway staff, identified, developed, and evaluated improvements for four bottleneck locations in the MPO region. The study provides the MassDOT Highway Division with an opportunity to begin identifying the needs at the four bottleneck locations and to start planning design and engineering efforts. If implemented, these low-cost, short-term improvements would increase traffic safety, make traffic operations more efficient, and reduce congestion at the bottlenecks. The study aligns with the MPO goals of managing capacity and improving mobility, and increasing safety on the region’s highway system.
29 The AM peak period is 6:00 AM to 10:00 AM, and the PM peak period is 3:00 PM to 7:00 PM. Source: Central Transportation Planning Staff.
30 Highway Capacity Software 7, Version 7.3, McTrans Center, PO Box 116585, Gainesville, Florida, 2017.
31 Highway Capacity Manual 2010, Transportation Research Board of the National Academies, Washington, DC, December 2010. 13-18.
Figure 1-Regional Map of Study Areas

FIGURE 2-Location 1: I-95 Northbound Segment between Exit 29 (Route 2) and Exit 30 (Route 2A/Service Plaz: Peak Period Traffic Volumes
 and Exit 30 (Route 2A/Service Plaza): Peak Period Traffic Volumes
Figure 2 shows the traffic flows during the AM and PM peak periods. The merging and diverging activities of vehicles using the ramps slow down traffic on the freeway upstream of the Route 2A interchange, creating a bottleneck and making it difficult to enter the freeway from Route 2.")
FIGURE 3-Location 1: I-95 Northbound Segment between Exit 29 (Route 2) and Exit 30 (Route 2A/Service Plaza): Location and Number of Crashes
 and Exit 30 (Route 2A/Service Plaza): Location and Number of Crashes
Figure 3 shows the location of crashes that occurred on 1-95 Northbound between Exit 29 and Exit 30 between 2010 and 2014. There were 108 crashes in this segment; the majority of the crashes (98) occurred in the vicinity of the off-ramp at Exit 30.")
FIGURE 4-Location 1: I-95 Northbound Segment between Exit 29 (Route 2) and Exit 30 (Route 2A/Service Plaza): Congestion Scan
 and Exit 30 (Route 2A/Service Plaza): Congestion Scan
Figure 4 is a congestion scan that shows the average travel speeds on I-95 northbound at the bottleneck location between Route 2 and Route 2A. The scan shows that a bottleneck reduces travel speeds to slower than 25 mph between 3:00 PM and 5:00 PM.")
FIGURE 5-Location 1: I-95 Northbound Segment between Exit 29 (Route 2) and Exit 30 (Route 2A/Service Plaza): Alternative 1–Lengthen Acceleration Lane at Exit 29
 and Exit 30 (Route 2A/Service Plaza): Alternative 1–Lengthen Acceleration Lane at Exit 29
Figure 5 shows the first alternative, which is to lengthen the acceleration lane at Exit 29. The figure shows the Route 2 westbound on-ramp extending the full-width of the lane as far as permitted by the existing right-hand paved shoulder, which would bring the new length to approximately 1,030 feet.")
FIGURE 6-Location 1: I-95 Northbound Segment between Exit 29 (Route 2) and Exit 30 (Route 2A/Service Plaza): Alternative 2–Create an Auxiliary Lane
 and Exit 30 (Route 2A/Service Plaza): Alternative 2–Create an Auxiliary Lane
Figure 6 shows the second alternative, which is to create an auxiliary lane. The figure shows lane restriping on I-95 northbound between Exit 29 and Exit 30 (about one-third of a mile), which would accommodate a fifth 12-foot auxiliary lane on the right. This would bring the total lane width to 60 feet along this distance.")
FIGURE 7-Location 2: I-93 Southbound Segment between Exit 37C (Commerce Way) and Exit 37B (I-95): Peak Period Traffic Volumes
 and Exit 37B (I-95): Peak Period Traffic Volumes
Figure 7 shows traffic flows during the AM and PM peak periods.")
FIGURE 8-Location 2: I-93 Southbound Segment between Exit 37C (Commerce Way) and Exit 37B (I-95)Location and Number of Crashes
 and Exit 37B (I-95): Location and Number of Crashes
Figure 8 shows the location of crashes that occurred on I-93 Southbound segment between Exit 37C and Exit 37B. There were 47 crashes in this segment; the majority of the crashes (43) occurred in the vicinity of the diverge area at Exit 37B.")
FIGURE 9-Location 2: I-93 Southbound Segment between Exit 37C (Commerce Way) and Exit 37B (I-95): Congestion Scan
 and Exit 37B (I-95): Congestion Scan
Figure 9 is a congestion scan that shows the average travel speeds on I-93 southbound at the bottleneck location ahead of Exit 37B. The bottleneck present at the I-95 interchange reduces travel speeds to less than 35 mph between the hours of 6 AM and 7 AM.")
FIGURE 10-Location 2: I-95 Southbound Segment between Exit 38 (Route 28) and Lowell MBTA Line: Congestion Scan
 and Lowell MBTA Line: Congestion Scan
Figure 10 is a congestion scan that shows average travel speeds on I-95 southbound. The scan shows that conditions during the AM peak period are worse on I-95 southbound, falling less than 25 mph between the hours of 7 AM and 9 AM.")
FIGURE 11-Location 2: I-93 Southbound Segment between Exit 37C (Commerce Way) and Exit 37B (I-95):Alternative 1–Create an Auxiliary Lane on I-93 Southbound
 and Exit 37B (I-95): Alternative 1–Create an Auxiliary Lane on I-93 Southbound
Figure 11 shows the creation of an auxiliary lane using an existing paved shoulder to add a fifth lane on I-93 Southbound between Exit 37C and Exit 37B.")
FIGURE 12-Location 2: I-95 Southbound Segment between Exit 38 (Route 28) and Lowell MBTA Line: Alternative 2–Lengthen the Acceleration Lane at I-95 Southbound Exit 36
 and Lowell MBTA Line: Alternative 2–Lengthen the Acceleration Lane at I-95 Southbound Exit 36
Figure 12 shows the extension of a full-width acceleration lane at the Exit 36 on-ramp by 460 feet, which would lengthen it from 700 feet to 1,160 feet.")
FIGURE 13-Location 2: I-93 Southbound Segment between Exit 37C (Commerce Way) and Exit 37B (I-95): Alternative 3–Two-Lane Ramp at Exit 37B
 and Exit 37B (I-95): Alternative 3–Two-Lane Ramp at Exit 37B
Figure 13 shows the improvements recommended in Alternative 3, which include creating an auxiliary lane, using a two-lane exit, dropping the rightmost lane for the bridge over I-95 and re-add the lane at the merge from I-95 southbound, and using existing shoulder space to widen the freeway to five lanes between exits 37 and 36 on 1-95 southbound.")
FIGURE 14-Location 3: Route 24 Northbound Segment between Exit 20 (Route 139) and Exit 21 (I-93): Peak Period Traffic Volumes
 and Exit 21 (I-93): Peak Period Traffic Volumes
Figure 14 shows the hourly traffic flow during the AM peak period. The figure shows that usage of both the I-93 ramps is very high, especially in the AM peak as traffic flows north towards Boston and the business areas located along Route 128.")
FIGURE 15-Location 3: Route 24 Northbound Segment between Exit 20 (Route 139) and Exit 21 (I-93): Location and Number of Crashes
 and Exit 21 (I-93): Location and Number of Crashes
Figure 15 shows the location of crashes that occurred on Routh 24 Northbound between Exit 20 and Exit 21 between 2010 and 2014. There were 96 crashes in this segment; the majority of which (63) occurred leading up to the diverge at the I-93 interchange.")
FIGURE 16-Location 3: Route 24 Northbound Segment between Exit 20 (Route 139) and Exit 21 (I-93): Congestion Scan
 and Exit 21 (I-93): Congestion Scan
Figure 16 is a congestion scan that shows the average travel speeds on Route 24 northbound ahead of the bottleneck at the I-93 interchange. Congestion at this location reduces travel speeds to less than 35 mph between the hours of 6 AM and 9 AM.")
FIGURE 17-Location 3: I-93 Northbound Segment between Exit 2 (Route 138) and Exit 5 (Route 28): Congestion Scan
 and Exit 5 (Route 28): Congestion Scan
Figure 17 shows a congestion scan for I-93 northbound near Route 24. The scan shows moderate congestion during the AM peak period. Traffic near the Route 24 interchange slows less than 45 mph between the hours of 8 AM and 9 AM. However, the scan shows that this is the tail end of congestion that originates further north on I-93.")
FIGURE 18-Location 3: I-93 Southbound Segment between Exit 5 (Route 28) and Exit 2 (Route 138): Congestion Scan
 and Exit 2 (Route 138): Congestion Scan
Figure 18 is a congestion scan that shows moderate congestion during the AM peak period. Congestion present between 7 AM and 9 AM slows travel speeds to less than 45 mph.")
FIGURE 19-Location 3: Route 24 Northbound Segment between Exit 20 (Route 139) and Exit 21 (I-93): Alternative 1–Widen to Four Lanes After Horse Bridge
 and Exit 21 (I-93): Alternative 1–Widen to Four Lanes After Horse Bridge
Figure 19 shows an alternative improvement in this location to address safety and operational issues at the bottleneck. The figure shows the widening of Route 24 northbound to four lanes for a stretch of approximately 1,200 feet between the I-93 interchange and the horse bridge.")
FIGURE 20-Location 3: Route 24 Northbound Segment between Exit 20 (Route 139) and Exit 21 (I-93): Alternative 2–Widen to Four Lanes After Canton Street Bridge
 and Exit 21 (I-93): Alternative 2–Widen to Four Lanes After Canton Street Bridge
Figure 20 shows an alternative improvement in this location to address safety and operational issues at the bottleneck. The figure shows the widening of Route 24 northbound to four lanes, continuing the extra lane south until the Canton Street bridge for a total length of approximately 4,000 feet.")
FIGURE 21-Location 3: Route 24 Northbound Segment between Exit 20 (Route 139) and Exit 21 (I-93): Alternative 3–Remove Merge in Ramp to I-93 Southbound
 and Exit 21 (I-93): Alternative 3–Remove Merge in Ramp to I-93 Southbound
Figure 21 shows an alternative improvement in this location to address safety and operational issues at the bottleneck. The figure shows the removal of the merge in the ramp on I-93 Southbound and the addition of an acceleration lane for the leftmost lane.")
FIGURE 22-Location 4: Route 24 Southbound Segment between Exit 21 (I-93) and Exit 20 (Route 139): Peak Period Traffic Volumes
 and Exit 20 (Route 139): Peak Period Traffic Volumes
Figure 22 shows the hourly traffic flow during the PM peak periods. The figure shows that usage of both the I-93 ramps is very high in the evening hours as traffic flows south out of Boston. The merging and diverging maneuvers of these vehicles interrupt traffic flow and reduce capacity, resulting in a traffic bottleneck.")
FIGURE 23-Location 4: Route 24 Southbound Segment between Exit 21 (I-93) and Exit 20 (Route 139): Location and Number of Crashes
 and Exit 20 (Route 139): Location and Number of Crashes
Figure 23 shows the location and number of crashes that occurred on the Route 24 southbound segment between Exit 21 and Exit 20. Crashes were very high at all three locations studied. The figure shows that both exits registered almost 100 crashes each.")
FIGURE 24-Location 4: Route 24 Southbound Segment between Exit 21 (I-93) and Exit 20 (Route 139): Congestion Scan
 and Exit 20 (Route 139): Congestion Scan
Figure 24 is a congestion scan that shows the average travel speeds on Route 24 southbound at the bottleneck location. The scan shows that congestion at this location reduces travel speeds near the merge to less than 50 mph between the hours of 4 PM and 5 PM.")
FIGURE 25-Location 4: Route 24 Southbound Segment between Exit 21 (I-93) and Exit 20 (Route 139): Alternative 1–Lengthen Merge Distance at Ramp Junction
 and Exit 20 (Route 139): Alternative 1–Lengthen Merge Distance at Ramp Junction
Figure 25 shows an improvement alternative for Route 24 southbound segment between Exit 21 and Exit 20. The figure shows the lengthening of the merge distance at the ramp junction by using the existing right-hand paved shoulder to add a fourth travel lane beginning at the merge and continuing 1,000 feet downstream.")