Technical Memorandum
DATE: November 8, 2018
TO: Boston Region Metropolitan Planning Organization
FROM: Casey-Marie Claude
RE: Development of a Scoring System for Bicycle Travel in the Boston Region
The Boston Region Metropolitan Planning Organization (MPO) works to maintain, adapt, and modernize the transportation network to meet existing and future needs within constrained fiscal resources. As a result, when programming the annual Transportation Improvement Program (TIP), the MPO reserves funding for small projects that support bicycle, pedestrian, and transit improvements to ease congestion instead of relying on expensive capital-expansion projects to reduce traffic. To encourage increased bicycle travel within the Boston region, it is important to create a bicycle environment that feels safe and comfortable to users. In addition, increasing bicycle ridership can reduce roadway congestion, minimize deterioration of the roadway system, and lower pollutant emissions from motor vehicles.
This project seeks to address issues within the bicycle environment by outlining a methodology for grading locations with features that are either beneficial or unsuitable for bicyclists. Areas well suited for bicycle travel are awarded high scores, reinforcing the inclusion of roadway features that positively affect the bicyclist experience. Conversely, unsuitable areas for bicyclists are awarded a poor grade. In so doing, this project allows for the identification of locations with low bicycle environment scores, which indicates the location is in need of improvement. This approach is similar to the Pedestrian Report Card Assessment (PRCA) tool, created by Boston Region MPO staff in 2017 to grade the pedestrian environment in the Boston metropolitan area. PRCA scoring is broken into four categories, with multiple criteria impacting each category score, which allows users to identify simultaneously the aspects of an area that need improvement and the qualities positively affecting pedestrian travel. This project outlines a similar approach for grading the Boston region roadway network for bicycle travel.
The first section of this memorandum summarizes pertinent research, analytics tools, and evaluation techniques for monitoring the bicycle environment that have been developed by myriad organizations over the last 15 years. The memorandum then provides an overview of work completed by the Boston Region MPO that has served as a foundation for this project. This is followed by an explanation of how MPO staff developed the bicycle report card, definitions of the performance measures used to quantify the quality of the roadway network for bicycle travel, and explanations of how each performance measure is scored. The memorandum concludes with examples completed by MPO staff to test the bicycle report card, illustrating how the tool can be used to score the quality of specific segments of the Boston region roadway network for bicycle travel.
This section provides an overview of the literature and various tools currently available for assessing a location’s suitability for bicycle travel. This research into the existing body of work summarizes methodologies for estimating bicycle suitability and includes the strengths and weaknesses of each resource.
The Highway Capacity Manual (HCM) bicycle level-of-service (BLOS) model, developed in 2010 by Sprinkle Consulting for the Transportation Research Board, uses several criteria to determine BLOS for multilane and two-lane highways.1 BLOS is calculated using an equation that includes the following variables, listed in order of importance:
As indicated by the list order, lane and shoulder widths are important in BLOS calculations. This means that it is important to have segment-specific information. However, if the information is not readily available, the HCM provides recommended default values. The aspects of the physical environment listed above that can affect bicycle travel choice all feed into one equation that produces a score that typically ranges from 0.5 to 6.5. The BLOS scores are stratified into grade categories that range from A to F, with a grade of A for scores 1.5 or smaller and a grade of F for scores 5.5 or greater.
The HCM provides a methodology for determining the performances of urban street facilities, urban street segments, and signalized intersections, each in terms of their service to bicyclists.2,3,4 Urban street facilities are composed of continuous urban street segments and might otherwise be referred to as an urban arterial or collector street. The urban street assessments are applicable to facilities and segments that are bounded by either signal-controlled or two-way stop sign-controlled intersections, and their quality is evaluated for each travel direction along the street. HCM signalized intersection performance assessments for bicycles begin by computing the capacity of a bicycle lane, then computing bicycle delay, both of which are used to calculate the intersection’s BLOS. This methodology focuses on one intersection approach and must be repeated for each approach of interest.5
The Mineta Transportation Institute developed four levels of traffic stress (LTS) categories to classify roadway segments based on how stressful they are for bicyclists.7 The categories are rated from one to four, with one being the least stressful category and four being the most challenging. Each category of LTS depends on whether bicyclists travel on paths separated from motor vehicles, in bike lanes, or in mixed traffic, in addition to the following traffic characteristics:
The lowest LTS, LTS 1, is defined as being suitable for almost all cyclists, including children trained to safely cross intersections. The characteristics of these segments, such as those where bicyclists are physically separated from traffic or are in an exclusive bicycling zone beside a slow traffic stream, reflect qualities that could be incorporated into roadways with a higher LTS classification in order to improve bicyclist comfort. Conversely, the various elements that contribute to the highest LTS, LTS 4, represent factors that can negatively affect the experience of people riding bicycles. LTS 4 is characterized as a level tolerated only by “strong and fearless” bicyclists. Examples of LTS 4 conditions include traffic speeds of 35–40 miles per hour (mph) or more, wide streets with many vehicle travel lanes, and vehicle turning speeds higher than 15 mph at pocket bike lane locations.
While LTS 1 and LTS 4 represent opposite ends of the bicycling environment spectrum, LTS 2 and LTS 3 can be characterized as satisfying the needs and concerns of many typical adult cyclists. The Mineta Transportation Institute describes LTS 2 as the level that would be tolerated by the mainstream adult population, with its criteria based on Dutch bicycle facility planning and design standards. The key distinction between LTS 1 and LTS 2 is that the latter requires more attention than might be expected from children, although most adults won’t find LTS 2 crossings to be difficult. Finally, LTS 3 is characterized as being tolerable for “enthused and confident” cyclists who still prefer having a space dedicated for bicycle travel. This allocation of space may take the form of an exclusive cycling zone such as a bike lane or a shared lane on a non-multilane street with moderately low speeds.
The Mineta Transportation Institute approach provides LTS criteria for intersections and crossings, as well as roadway segments. Bicyclist LTS at intersections with bike lanes and right-turning traffic is determined by the position of the bike lane relative to the vehicle right-turn lane and the traffic speed in the right-turn lane. This speed is estimated using the length of the right-turn lane, the turning angle, and the radius of the corner-curb returns. Bicyclist LTS at intersections with right-turning traffic where there is not a bike lane—causing bicyclists to mix with vehicular traffic—is solely determined by right-turn lane traffic speed. This is estimated using the length of the right-turn lane, the intersection angle, and the curb radius. At unsignalized crossings, LTS depends on whether there is a median refuge, the speed limit of the street being crossed, and the number of lanes within the street being crossed.
The Bicycle Level of Comfort (BLC) developed by the City of Cambridge is based on the Mineta Transportation Institute LTS, although Cambridge uses a five-point scale instead of the four Mineta Transportation Institute levels of traffic stress.8 The first four BLC categories are similar to the Mineta LTS. Cambridge added a fifth BLC, identified as “intolerable even for most experienced adults,” to address state highways. Like LTS, the BLC scores road segments using a “weakest link” principle because the most stressful or least comfortable feature of a bicycle route affects its overall comfort. The following qualities factor into Cambridge’s BLC:
In addition to adding a fifth BLC category, Cambridge included criteria specific to the city after applying the Mineta Transportation Institute’s LTS ranking criteria as a baseline for ranking the comfort of Cambridge’s streets and paths for bicyclists. The results of the analysis were vetted by Cambridge city staff, Cambridge’s Bicycle Committee, and the public to reach results that reflect the experience of those most familiar with the City’s roadway conditions. This led the BLC to incorporate operating space stress as a factor, which applies to traffic volumes on one-way, single-travel-lane streets with parking on both sides where bicyclists mix with traffic.9 The BLC also includes ranking criteria for all streets where bicyclists must mix with traffic and streets with high-frequency bus routes.
In support of the Massachusetts Department of Transportation’s (MassDOT) update of the Statewide Bicycle Plan, Central Transportation Planning Staff (CTPS) developed a Bike Environment Score (BES) to estimate where bicyclists are most inclined to travel when commuting or performing non-work trips. Several elements of the physical environment that contribute positively and negatively to bicyclist experience were factored into the bicyclist travel choice estimations, which CTPS modeled on each roadway link in the Massachusetts statewide bicycle network.
The following factors have a positive effect on the attractiveness of a route to bicycle users in BES calculations when they are present or increase:
The following factors have a negative effect on the attractiveness of a route to bicycle users in BES calculations when they are present or increase:
The BES scores are composite scores calculated using the scores assigned to each of the factors, or attributes, listed above. The attribute scores are summed and then normalized to a scale of 0 to 10, from most to least bicycle friendly. While every attribute is an important determinant of bicycle route choice, connectivity is weighted 1.5 times in BES scoring because of its significance.
The Bicycle Compatibility Index (BCI) has been around for approximately two decades and emerged to fill an important void in bicycle facility assessment at the time: the perspective of bicyclists. In the late 90s, studies had focused on developing methodologies for measuring the operational condition of roadways for bicycling. 10 These models either subjectively rated roadway segments and intersections or subjectively recommended bicycle facility widths based on the values of environmental variables.
BCI calculations are based on the following factors: 11
The BCI served two purposes: 1) establish a methodology to assess the capability of urban and suburban roadway segments to accommodate bicyclists, which was accomplished using typical bicycle friendliness variables for assessing a roadway; and 2) test the methodology for roadway segments on intersections to determine whether the approach successfully rates the bicycle compatibility of intersections. The work resulted in a tool that could be used to assess existing facilities for potential bicycle improvements and to identify what attributes new facilities would need to incorporate to produce a certain level of bicycle service”.12
The Bikeability Index was developed using data from actual bicycle trips taken in Graz, Austria.13 Using Geographic Information System (GIS) data, the researchers analyzed the physical environment in which the trips occurred. When the environmental characteristics of a bicycle trip route deviated significantly from those along the shortest possible route between the origin and destination, the researchers incorporated the characteristic into an additive bikeability index. The following environmental attributes positively correlated with route choice:
The following environmental attributes negatively correlated with route choice:
This information was used to map the bikeability of Graz, Austria, which illustrates that it can be applied visually and at a larger, perhaps even regional, scale.
Every two years the Copenhagenize Design Company publishes The Copenhagenize Index, which the company describes as the “world’s most comprehensive inventory and ranking of bicycle-friendly cities.”14 The Index uses 14 parameters to assess the bicycle-friendliness of each city:15
In 2016, Zayed published an article on his analysis of the top 20 cities listed in the 2015 Copenhagenize Index.16 Zayed used the following 12 variables to assess which attributes most strongly correlate with the cities listed in the 2015 Index.
Zayed found that five variables are strongly correlated with cycling rates in cities by assessing which attributes were reflected in the top 20 cities of the 2015 Copenhagenize Index. These are the five variables, starting with the most correlated and listed in descending order:
These findings indicate that more populated cities are better suited for bicycling. In addition, the longer a city’s roadway network, the more conducive it is to bicycling as a travel mode. The third variable illustrates that the more compact a city, the greater the likelihood of people bicycling in that city. Interestingly, the larger a city’s area, the higher its correlation with bicycling rates. Zayed explains that city area “indicates the average length of trips in the city, which is one of the main factors in cycling in cities.”17 Finally, Zayed suggests that cities with higher shares of the population using public transportation are cities that have better opportunities to choose bicycling as a principal transportation mode.
Walk Score created Bike Score to rate a location’s suitability for bicycling. The scoring is specifically made with two types of people in mind: urban planners looking to research bikeability and people looking for bikeable places to live. Bike scores range from 0 to 100 and are based on four components, each of which are equally weighted:18
Bike lane scoring is dependent on Open Street Map bike lane infrastructure information, which Bike Score processes into three types of features: bike paths, bike lanes, and shared infrastructure (such as shared lane markings). Bike Score calculates the total length of bike lanes within 1,000 meters of a given location. Afterwards, bike paths are weighted twice as much as bike lanes and three times as much as shared infrastructure. Bike score then normalizes the new, weighted value to a score between 0 and 100, based on the average of the highest bike lane scores sampled by Bike Score.
When calculating how hilly an area is, Bike Score refers to the National Elevation Data set from the United States Geological Survey to find the steepest grade within a 200 meter radius of a location. Grades between two percent and 10 percent are scored from 0 to 100.
The creators of Bike Score use a modified version of their original product, Walk Score, to look at a diverse set of amenities and measure the network distances to the features. In addition, the modified Walk Score methodology calculates connectivity metrics for Bike Score, such as average block length and intersection density.
Finally, Bike Score includes a fourth metric. Originally, the calculations were only going to include the three factors described above, each of which reflects the physical environment. However, the number of bicyclists in a city may not be entirely dependent on infrastructure. Research supports the idea of “safety in numbers” as the number of bicyclists increases because drivers have more experience sharing roadways with bicyclists and drivers are more likely to have experience as a bicyclist themselves. In addition, bicycling grew faster than any other mode share in San Francisco from 2007 to 2010, in spite of a lawsuit preventing the city from adding any new bike infrastructure during that time. This suggests that bicycle infrastructure is not the only factor that influences bikeability. Furthermore, if a high-volume street has a bike lane, that doesn’t inherently make it more comfortable for bicyclists than a slow residential street without bicycle infrastructure.
For these reasons, Bike Score also factors Bicycle Mode Share into the bikeability calculations. This component is measured using the bicycle commuting mode share from the United States Census. Bike Score normalizes bicycle mode share within a moving window over census tract level data for an area of one square kilometer from 0 to 10 percent to a score between 0 and 100.
This work does not act as a resource for calculating bicyclists’ perception or comfort in a given environment, but it may help inform such estimates.19 Researchers used Global Positioning System (GPS) units to monitor several days’ worth of travel behavior for 164 bicyclists in Portland, Oregon. The bicyclists recorded trip purpose and other variables about each trip and the researchers coded each trip accordingly. A total of 1,449 non-exercise, utilitarian trips informed the researchers’ creation of a bicycle route choice model. The model indicated that bicyclist travel is most influenced by the following factors:
The model also found that bicyclists favor off-street bridge facilities, bike paths, and bicycle boulevards, which are enhanced neighborhood bikeways with traffic calming features. Interestingly, bike lanes appealed no more or less to bicyclists than ordinary streets with low traffic volumes, although bike lanes were found to offset the negative effects of adjacent traffic. Lastly, the type of trip affects bicyclist route choice: commuter trips weren’t as sensitive to infrastructure characteristics as other utilitarian trips. Instead, work trips were influenced by distance, indicating that commuters care about the length of their trip to and from work more than any other factor.
The following variables were used to score or determine bikeability:
The following variables were used to score or determine bikeability:
The following variable was used to score or determine bikeability:
The following variables were used to score or determine bikeability:
This resource calculates LOS for shared-use paths. The methodology is not directly applicable to the assessment of roadways in the Boston region for bicycle suitability because shared-use paths are inherently separated from vehicles. As a result, instead of focusing on concerns related to motorists, this resource primarily considers the level of conflict that bicyclists experience, how busy a shared-use path is, and the amount of user travel space. However, because this tool gives better scores to shared-use paths with fewer conflicts and wider operating space, it can be concluded that minimizing conflicts and maximizing operating space positively affects BLOS, which is applicable to all bicycle environments.
The following variables were used to score or determine LOS:
This tool estimates how many people would walk or bike in a location if quality pedestrian or bicycle connections were present. This resource is not directly applicable for scoring existing bicycle environments because it assumes there are high BLOS facilities in place, whether they are present in reality or not. In spite of this, the tool emphasizes the importance of destinations as bicycle trip generators, which may support the inclusion of land use as a factor that influences the score of a location’s bicycle suitability.
The following variables were used to score or determine Local Access Score:
The current body of work on bicycle travel suitability informs practitioners’ knowledge about bicyclist preferences, travel choices, and sense of safety and comfort. However, the diversity of approaches and applications found in the existing work illustrates that consideration must be given to what approach should be used to incorporate existing knowledge about BLOS into a tool that best suits the Boston metropolitan region. The two most prevalent techniques after reviewing available tools and literature are (1) applying methodology that estimates bicyclists’ route choices throughout an area with a large geographic scale, such as the Boston region, or (2) looking at a specific area, such as a roadway segment or intersection, and providing a unique score for that location.
While the review illustrates that there are various approaches to assessing the bicycle environment, the disparate resources allowed MPO staff to compile an informed list of performance measures that influence bicyclist experience. Table 1 below indicates which measure was applied by which resource. The greater the number of Xs, the greater the number of instances that some form of that measure is incorporated into a resource’s bikeability calculations. Only those measures that were applied by more than one resource are included in Table 1. Due to the many measures that incorporate bicycle facilities and the popularity of such measures among resources (as indicated in the bicycle facilities row of Table 1), Table 2 shows the variety of measurements related to bicycle facilities that resources have applied when assessing the physical environment for bicyclists.
Table 1
Performance Categories in the Existing Literature
Performance Categories |
1.1 |
1.2 |
1.3 |
1.4 |
1.5 |
1.6 |
1.7 |
1.8 |
1.9 |
1.10a |
1.10b |
1.10c |
1.10d |
1.10e |
1.10f |
Traffic volume |
X |
NA |
X |
X |
X |
NA |
NA |
NA |
X |
NA |
NA |
NA |
NA |
NA |
NA |
Bicycle facility (presence, absence, type, quality, etc.) |
X |
XXXX |
XXX |
XX |
XX |
XXX |
NA |
X |
X |
XXXXX |
X |
NA |
X |
NA |
NA |
Bicyclist operating space (shoulder width, bike lane width, etc.) |
X |
X |
X |
NA |
X |
NA |
NA |
NA |
NA |
NA |
NA |
NA |
X |
X |
NA |
Number of travel lanes |
X |
X |
X |
NA |
NA |
NA |
NA |
NA |
NA |
NA |
NA |
NA |
NA |
NA |
NA |
On-street parking |
X |
X |
X |
NA |
X |
NA |
NA |
NA |
NA |
NA |
NA |
NA |
NA |
NA |
NA |
Vehicle speed |
X |
X |
X |
X |
X |
NA |
NA |
NA |
NA |
NA |
NA |
NA |
NA |
NA |
NA |
Heavy vehicles (trucks) |
X |
NA |
NA |
X |
X |
NA |
NA |
NA |
NA |
NA |
NA |
NA |
X |
NA |
NA |
Land use/destinations |
NA |
X |
NA |
X |
X |
NA |
NA |
X |
NA |
X |
X |
NA |
NA |
NA |
X |
Green space |
NA |
NA |
NA |
X |
NA |
X |
NA |
NA |
NA |
NA |
X |
X |
NA |
NA |
NA |
Slope |
NA |
NA |
NA |
X |
NA |
X |
NA |
X |
X |
X |
NA |
NA |
NA |
NA |
NA |
Connectivity |
NA |
NA |
NA |
X |
NA |
NA |
NA |
X |
NA |
X |
NA |
NA |
NA |
NA |
X |
Travel mode shares |
NA |
NA |
NA |
NA |
NA |
NA |
X |
X |
NA |
NA |
NA |
NA |
NA |
NA |
X |
Table 2
Existing Bicycle Facility Performance Measures
Performance Measures |
1.1 |
1.2 |
1.3 |
1.4 |
1.5 |
1.6 |
1.7 |
1.8 |
1.9 |
1.10a |
1.10b |
1.10c |
1.10d |
1.10e |
1.10f |
Presence |
X |
NA |
NA |
X |
X |
X |
NA |
X |
NA |
X |
X |
NA |
NA |
NA |
NA |
Type of bicycle facility |
NA |
X |
X |
X |
NA |
NA |
NA |
NA |
NA |
X |
NA |
NA |
NA |
NA |
NA |
Width/Operating space |
NA |
X |
X |
NA |
X |
NA |
NA |
NA |
NA |
NA |
NA |
NA |
X |
X |
NA |
Placement |
NA |
X |
NA |
NA |
NA |
NA |
NA |
NA |
NA |
NA |
NA |
NA |
NA |
NA |
NA |
Bike lane blockage frequency |
NA |
X |
NA |
NA |
NA |
NA |
NA |
NA |
NA |
NA |
NA |
NA |
NA |
NA |
NA |
Separation from vehicle traffic |
NA |
NA |
X |
NA |
NA |
X |
NA |
NA |
X |
X |
NA |
NA |
NA |
NA |
NA |
Absence on main roads |
NA |
NA |
NA |
NA |
NA |
X |
NA |
NA |
NA |
NA |
NA |
NA |
NA |
NA |
NA |
Density |
NA |
NA |
NA |
NA |
NA |
NA |
NA |
NA |
NA |
X |
NA |
NA |
NA |
NA |
NA |
Connectivity |
NA |
NA |
NA |
NA |
NA |
NA |
NA |
NA |
NA |
X |
NA |
NA |
NA |
NA |
NA |
Performance measures that only appeared in one resource from the literature review are listed below for reference:
When deciding which approach to use when assessing BLOS, MPO staff not only considered the two most prevalent techniques in the existing literature—regional route-mapping efforts versus specific roadway segment or intersection ratings—but also factored in the pedestrian environment assessment tool that MPO staff presented in federal fiscal year 2017 and the annual TIP scoring parameters for bicycle accommodations. The tool for assessing the pedestrian environment takes the specific approach of rating roadway segments or intersections, the latter of the two most prevalent techniques for bicycle assessments. The annual TIP scoring parameters focus on the safety effectiveness of proposed projects, specifically looking at bicycle accommodations and how they address current or anticipated bicycle use.
MPO staff developed the PRCA when it was tasked with creating a tool for assessing pedestrian level of service in the Boston metropolitan region. After speaking with professionals and researchers in the field of pedestrian transportation, MPO staff found that, for the walking environment, the most useful tool would be one that could identify specific factors that negatively or positively influence pedestrian experience. Instead of providing one cumulative score, like the LOS letter grades assigned to roadways that are primarily determined by vehicle delay, MPO staff found that the nuance of the pedestrian experience along a roadway calls for multiple grading categories.
To determine which categories to include when assessing the pedestrian environment, staff looked to the Boston region Long-Range Transportation Plan (LRTP), a document that outlines six long-term goals for the MPO: safety, preservation, capacity management and mobility, clean air and clean communities, transportation equity, and economic vitality. Due to the fact that construction projects searching for MPO funding through the annual TIP are required to meet Clean Air and Clean Communities standards before they are considered, MPO staff omitted the goal as a pedestrian environment-grading category. Four of the goals, however, were incorporated as assessment areas, each of which receives a grade similar to a student’s course grades on a report card.
The sixth remaining LRTP goal, Transportation Equity, serves the purpose of identifying the level of need for a good walking environment at a given location. The level of priority increases if a location is within an environmental justice zone, has a high elderly population, is within one-quarter mile of a school or university, or has a high share of households without access to a vehicle. Places that meet the thresholds for these factors, and especially those locations that meet two or more, can be expected to have high pedestrian use and need. Therefore, a high-quality pedestrian environment is especially necessary in such locations and should be prioritized.
The remainder of the Pedestrian Report Card Assessment consists of the grading categories: safety, preservation, capacity management and mobility, and economic vitality. The score for each category was calculated by quantifying performance measures related to each assessment area, weighting the importance of each performance measure for each grading category, and calculating the score for each assessment area accordingly (Tables 3 and 4, below).
Table 3
Roadway Segment PRCA Grading
Grading Category |
Performance Measures |
Weight |
Percent of Grading Category Score |
Capacity Management and Mobility |
Sidewalk Presence |
3 |
50% |
Capacity Management and Mobility |
Crossing Opportunities |
2 |
33% |
Capacity Management and Mobility |
Walkway Width |
1 |
17% |
Economic Vitality |
Pedestrian Volumes |
1 |
50% |
Economic Vitality |
Adjacent Bicycle Accommodations |
1 |
50% |
Safety |
Pedestrian Crashes |
3 |
60% |
Safety |
Pedestrian-Vehicle Buffer |
1 |
20% |
Safety |
Vehicle Travel Speed |
1 |
20% |
System Preservation |
Sidewalk Condition |
1 |
100% |
Table 4
Intersection PRCA Grading
Grading Category |
Performance Measures |
Weight |
Percent of Grading Category Score |
Capacity Management and Mobility |
Pedestrian Delay |
3 |
43% |
Capacity Management and Mobility |
Sidewalk Presence |
2 |
29% |
Capacity Management and Mobility |
Curb Ramps |
1 |
14% |
Capacity Management and Mobility |
Crossing Opportunities |
1 |
14% |
Economic Vitality |
Pedestrian Volumes |
1 |
100% |
Safety |
Sufficient Crossing Time (Index) |
3 |
38% |
Safety |
Pedestrian Crashes |
3 |
38% |
Safety |
Pedestrian Signal Presence |
1 |
13% |
Safety |
Vehicle Travel Speed |
1 |
13% |
System Preservation |
Sidewalk Condition |
1 |
100% |
Each year, MPO staff assesses the transportation projects that have applied for funding through the Boston region MPO’s TIP to determine how each project would affect the surrounding community. Analyzing the safety effectiveness of the proposed projects for bicyclists is part of this assessment process. Projects providing bicycle accommodations may receive one to three points depending on the type of bicycle facility proposed, the bicycle accommodations currently in place, Highway Safety Improvement Program (HSIP) crash cluster data, and the level of existing and anticipated bicycle use. The potential bicycle safety effectiveness of a project is judged based on how well the existing accommodations meet the needs of existing and future use and how much more effectively the proposed improvement would address the needs of bicyclists in the area. Using the information provided by the project proponent, MPO staff identifies existing and proposed bicycle facilities as belonging to one of three categories:
The TIP evaluation classifications for bicycle safety effectiveness may be directly applied to a BLOS grading tool. Developing a bicycle report card similar to the PRCA tool, with grading categories derived from the LRTP goals, would provide structure and detailed insight into which elements of a roadway segment or intersection are beneficial or detrimental to bicycle travel at the location. Following the example of the PRCA, the bicycle report card would include four grading categories—capacity management and mobility, economic vitality, safety, and system preservation—and prioritization based on the level of need for safe and comfortable bicycle accommodations at a given location, determined by factors used to calculate transportation equity.
The foundation provided by existing CTPS work afforded a clear path for MPO staff to follow when creating the bicycle report card. The next step in the process was to decide which factors would influence BLOS grading. As an end product, the performance measures selected must gauge progress toward achieving goals for improving the bicycle environment throughout Boston region roadway segments and intersections. The following sections describe the components of the bicycle report card, including an overview of performance measures types, the MPO’s goals (four of which serve as grading categories and one that prioritizes locations), and the Boston region MPO’s bicycle objectives that led to the creation of this tool.
The bicycle report card is intended to help users and planners assess the infrastructure that facilitates the movement of bicyclists through the transportation network and understand the presence and behavior of travelers. A significant purpose filled by the bicycle report card is that of identifying areas where people are expected to rely heavily on bicycle transportation.
Two types of performance measures are included in the bicycle report card: those related to infrastructure and those related to mobility. Infrastructure performance measures are used to analyze the existing transportation facilities or environment to determine if a location is suitable for bicycle travel. These measures monitor the physical space allocated for bicyclists or, if such accommodations do not exist, the roadway that bicyclists must share with vehicle traffic. Data that are used to monitor infrastructure performance measures are usually static and do not change from day to day. Data for infrastructure performance measures usually come from roadway inventories or intersection surveys.
Examples of infrastructure performance measures include the following:
Mobility performance measures are used to analyze the presence and behavior of travelers. Mobility performance measures can often vary from day to day, whereas infrastructure performance measures do not change unless infrastructure is under construction. Data for mobility performance measures usually come from vehicle or bicycle traffic monitoring efforts.
Examples of mobility performance measures include the following:
Monitoring transportation equity is a key attribute of the bicycle report card. Areas where residents are dependent on bicycle transportation are places where it is especially important to provide high-quality bicycle environments. Locations where there are high percentages of households that do not own vehicles or where residents are less likely to own cars because of low incomes are examples of the types of places where one might expect high use of bicycles as a travel mode. In addition, it is vital to provide high-quality bicycle environments near schools and locations where there are large numbers of children who are not old enough to drive.
The bicycle report card analyzes five factors, referred to by MPO staff as transportation equity factors, to determine if a specific area is a place where safe bicycle accommodations should be prioritized:
These factors address aspects of transportation equity, which is a key goal of the Boston Region MPO’s LRTP. Roadway segments and intersections are classified based on the number of transportation equity factors that apply to them. For example, a location with zero or one factor is classified with the lowest priority level; a location with two or three factors is a moderate priority; and a location with four or five factors has the greatest priority. The larger the presence of transportation equity factors at a location, the more important it is that there is a high-quality bicycle environment along the roadway segment or at the intersection.
The MPO has adopted the following six goals, each with associated objectives, as part of its LRTP.
To provide the optimum bicycle network for the Boston region, it is important to move toward achieving these goals. The bicycle report card grades the quality of the bicycling environment for the following four LRTP goals:
This goal focuses on the overall safety of bicyclists. Progress toward safety goals is often evaluated by monitoring HSIP bicycle cluster locations.27 Safety can also be assessed by determining if bicycle travel facilities are properly separated—horizontally or vertically—from automobile travel facilities.
System Preservation focuses on the condition of bicycle infrastructure that is located along roadways and at intersections, including bike lanes and shared-use paths.
Capacity Management and Mobility focuses on how people and vehicles move throughout the transportation network and the connectivity of the transportation network. This goal also emphasizes the need to facilitate multimodal transportation.
Economic Vitality focuses on the vibrancy, that is, energy and liveliness, of the bicycle network. Economic vitality is assessed in the LRTP Needs Assessment using resources such as population density and employment density.
The Clean Air and Clean Communities goal is monitored through the TIP selection process rather than the PRCA. This is because air quality standards are required to be met in order for a project to be included in the TIP, through which the Boston region MPO allocates federal funding. Finally, the Transportation Equity goal is incorporated into the bicycle report card through the monitoring of areas with a high presence of transportation equity factors, which suggest considerable dependence on bicycle facilities for daily travel.
The LRTP Needs Assessment objectives created to monitor progress towards achieving the goals are listed below:
This section describes the 10 performance measures and the scoring criteria staff recommends using in the bicycle report card for the Boston region. This section also describes the weights assigned to the selected bicycle report card measures. The prevalence of bicycle facilities as a measure used throughout the existing literature led MPO staff to incorporate the performance measure twice, once in the Capacity Management and Mobility grading category and again in the Safety category. This allows bicycle facilities to play a considerable role in scoring the suitability of a location for bicycle travel.
Unlike the PRCA, the bicycle report card does not incorporate detailed grading for intersections. The lack of intersection-specific scoring in the existing BLOS literature, combined with the lack of bicycle accommodations at intersections in the Boston metropolitan region, make it difficult to rate the suitability of intersections for bicycle travel. Furthermore, the complexity of the approaches outlined in the few resources that have included bicycle service assessments for intersections illustrate that grading BLOS at intersections is not currently an approachable practice. If accommodations such as bike boxes, bicycle signals, and protected bicycle intersections become increasingly common in the region, however, developing a scoring methodology for bicycles at intersections should be revisited.
When weighting the performance measures used to grade roadway segments for bicyclists, MPO staff most heavily weighted the measure deemed to most greatly affect the bicyclist experience: bicycle facility presence. Table 5 indicates the recommended weights that MPO staff allocated to each performance measure in each grading category. The weight assigned to each measure factors into the bicycle report card scores when the weight of each performance measure is multiplied by the score assigned to a specific location. The weighted scores of the performance measures in each grading category are then added together and divided by the number of total weights allocated to each specific grading category to calculate the final score for each LRTP goal. These weights can be reexamined.
Table 5
Roadway Segment Bicycle Report Card Grading
Grading Category |
Performance Measure |
Weight |
Percent of Grading Category Score |
Capacity Management and Mobility |
Bicycle Facility Presence |
3 |
50% |
Capacity Management and Mobility |
Proximity to Bike Network |
2 |
33% |
Capacity Management and Mobility |
Proximity to Transit |
1 |
17% |
Economic Vitality |
Bike Rack Presence |
1 |
50% |
Economic Vitality |
Land Use |
1 |
50% |
Safety |
Bicycle Facility Presence |
2 |
33% |
Safety |
Absence of Bicycle Crashes |
2 |
33% |
Safety |
Bicyclist Operating Space |
1 |
17% |
Safety |
Number of Travel Lanes |
1 |
17% |
System Preservation |
Bicycle Facility Continuity |
1 |
50% |
System Preservation |
Bicycle Facility Condition |
1 |
50% |
The Bicycle Facility Presence performance measure awards points to roadway segments that include bike lanes or separated bicycle accommodations. Locations without bicycle facilities do not receive points while increasingly higher scores are awarded as bicycle accommodations become increasingly separate from motor vehicle traffic. The lack of bicycle facilities at a location can lower its scores for two grading categories and, because low scores in any grading category indicates that a location is in need of improvement for bicycle travel, such locations would be prioritized for potential project development. Bicycle facilities are graded as follows:
The Proximity to Bike Network performance measure considers how a roadway segment serves as a connection along a bicycle route. This addresses the Boston region MPO’s eighth objective listed above as part of the LRTP, which calls for creating a connected network of bicycle facilities by expanding existing facilities and closing gaps. Roadway segments within one-quarter mile of a bicycle facility, defined as bicycle accommodations that separate bicyclists from mixed traffic, receive 100 points for Capacity Management and Mobility.
The Proximity to Transit performance measure considers how a roadway segment serves as a connection for a multimodal trip. This addresses the Boston region MPO’s ninth objective listed above as part of the LRTP, which calls for improving bicycle access to rapid transit and supporting last-mile connections. Roadway segments within one-half mile of a rapid transit station, commuter rail station, or bus stop receive 100 points for Capacity Management and Mobility.
The Bike Rack Presence performance measure addresses the important role that bike racks play in supporting bicycle transportation. The presence of bike racks improves the convenience and practicality of bicycle travel because the decision to travel via bicycle is limited by the ability to safely park at the end of a trip. Bicyclists are therefore more likely to patronize stores and visit locations with bicycle parking. In this way, bike racks serve as indicators of Economic Vitality. Locations lacking bike racks cannot receive a passing Economic Vitality score, so places with a failing grade would be identified as in need of improvement—likely in the form of new bike rack installations. Roadway segments are graded as follows:
The Land Use performance measure reflects the twelfth objective listed above, derived from the Boston region MPO’s LRTP: increase transportation options and access to places of employment by adding new bicycle facilities. This objective touches not only on the importance of people bicycling where retail is located, but also the reality that bicycle trips have a beginning and middle before cyclists arrive at their final destinations. Therefore, roadway segments located in the following areas receive 100 points for Economic Vitality:
The Absence of Bicycle Crashes performance measure indicates whether any individual bicycle crashes or HSIP-eligible bicycle crash clusters are located along a roadway segment. While bicycle crashes may be underreported and the data do not include locations where bicyclists have experienced many near miss crashes, the dataset does highlight areas that are unsafe and should be prioritized for improved bicycle travel conditions. Route segments without bicycle crashes or HSIP-eligible bicycle crash clusters receive 100 points for the Absence of Bicycle Crashes performance measure, which factors into the overall score for the Safety grading category. For every bicycle crash located along the route segment, the location loses 30 points. All route segments with more than three bicycle crashes or those located within an HSIP-eligible bicycle crash cluster receive 0 points for this performance measure.
The Bicyclist Operating Space performance measure quantifies the importance of providing bicyclists with adequate room to comfortably and safely accommodate bicycle travel. Narrow facilities alongside moving motor vehicle traffic or alongside parked vehicles do not provide bicyclists with adequate space to avoid potential collisions with swerving vehicles or opening car doors. In addition, bicyclists need space to circumvent debris or potholes along bicycle facilities. Bicyclist Operating Space along bicycle facilities is graded as follows:
The Number of Travel Lanes performance measure serves as a proxy for two factors that influence BLOS: traffic volume and stress. The number of motor vehicles traveling along the roadway increases as the number of travel lanes in one direction increases. In addition, vehicle travel speeds increase as streets become wider. The combination of high motor vehicle volumes and fast travel speeds creates an unsafe environment for bicyclists. The Number of Travel Lanes along a roadway segment is graded as follows:
The Bicycle Facility Continuity performance measure addresses the sixth objective above, derived from the Boston region MPO’s LRTP, seeking to improve existing bicycling infrastructure where bike lanes end suddenly without sufficient road space. Bicycle facility grading for this performance measure is listed below:
The Bicycle Facility Condition performance measure also addresses the sixth objective above, derived from the Boston region MPO’s LRTP, seeking to improve existing bicycling infrastructure where bike lanes are filled with potholes or debris. Roadway segments receive 100 points if they include bicycle accommodations but may lose 25 points for each of the following issues that affect the condition of the bicycle environment if found along the bicycle facility:
Each of the selected performance measures were tested on two roadway segments located in the Boston region. MPO staff recorded its calculations for each performance measure at the locations. The scores for every performance measure were based on the information MPO staff collected for the roadway segments.
The weighted scores of all the performance measures within the same grading category are averaged, as explained above, and given a score from 0 to 100. The grading category scores are classified as follows:
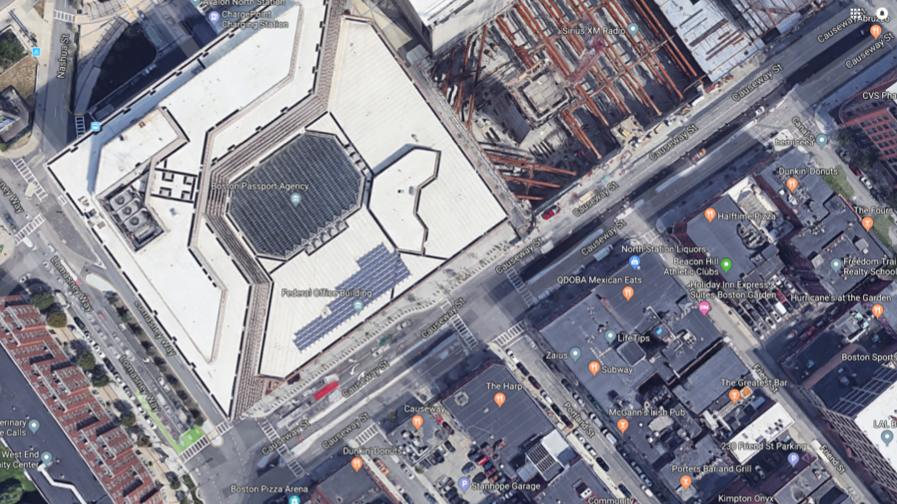
Tables 6 and 7 present the bicycle report card grades that MPO staff calculated for each category during test runs on selected segments of Causeway Street and Boylston Street in Boston. Tables 6 and 7 also indicate whether or not transportation equity concerns exist at each location. These were determined using the transportation equity factors described in section 3.1. Transportation equity factors do not directly affect the score of the other bicycle report card categories. However, the greater the number of transportation equity factors at a location, the more important it is for the roadway to earn high scores in each category of the bicycle report card.
The Causeway Street segment is located in the West End, an area of high density that is growing at a rapid pace. The TD Garden, where the Bruins and Celtics play and where many performances are held, is located on one side of Causeway Street. The street also includes high-rise residential buildings, bars and restaurants, offices, and retail. It is a very high traffic area and Connect Historic Boston recently constructed separated bike lanes in the middle of Causeway Street, with two raised medians separating the bi-directional bike lanes from motor vehicle traffic on either side. Figure 1 below shows an aerial image of Causeway Street.
Figure 1
Aerial of Causeway Street
Table 6
Results from Causeway Street Test Runs:
Staniford Street/Lomasney Way to Canal Street
Performance Measure |
Score |
Weight |
Percent of Grading Category Score |
Grading Category |
Grade |
Bicycle facility presence |
90 |
3 |
50% |
Capacity Manage-ment and Mobility |
blank |
Proximity to bike network |
100 |
2 |
33% |
Capacity Manage-ment and Mobility |
blank |
Proximity to transit |
100 |
1 |
17% |
Capacity Manage-ment and Mobility |
blank |
Capacity Management and Mobility |
blank |
blank |
blank |
blank |
A |
Bike rack presence |
0 |
1 |
50% |
Economic Vitality |
blank |
Land use |
100 |
1 |
50% |
Economic Vitality |
blank |
Economic Vitality |
blank |
blank |
blank |
blank |
F |
Bicycle facility presence |
100 |
2 |
33% |
Safety |
blank |
Absence of Bicycle Crashes |
100 |
2 |
33% |
Safety |
blank |
Bicyclist operating space |
100 |
1 |
17% |
Safety |
blank |
Number of travel lanes |
75 |
1 |
17% |
Safety |
blank |
Safety |
blank |
blank |
blank |
blank |
A |
Bicycle facility continuity |
100 |
1 |
50% |
System Preservation |
blank |
Bicycle facility condition |
100 |
1 |
50% |
System Preservation |
blank |
System Preservation |
blank |
blank |
blank |
blank |
A |
Income equal to/less than $45,392 |
No |
X |
X |
Transportation Equity |
blank |
28.2% minority population |
Yes |
X |
X |
Transportation Equity |
blank |
18.2% + of pop. < 16 years old |
No |
X |
X |
Transportation Equity |
blank |
16.1% + households w/o vehicle |
Yes |
X |
X |
Transportation Equity |
blank |
Within ¼ mile of school/college |
Yes |
X |
X |
Transportation Equity |
|
Transportation Equity |
blank |
blank |
blank |
blank |
Moderate Priority |
The Boylston Street segment is also located in the Back Bay, which is also an area of high density. Many shops and restaurants are located along the roadway segment and homes are located above retail locations. Boylston Street is a high-traffic, three-lane, one-way roadway with only minor bicycle accommodations, such as post and ring style bicycle racks. Figure 2 below shows an aerial image of Boylston Street.
Figure 2
Aerial of Boylston Street
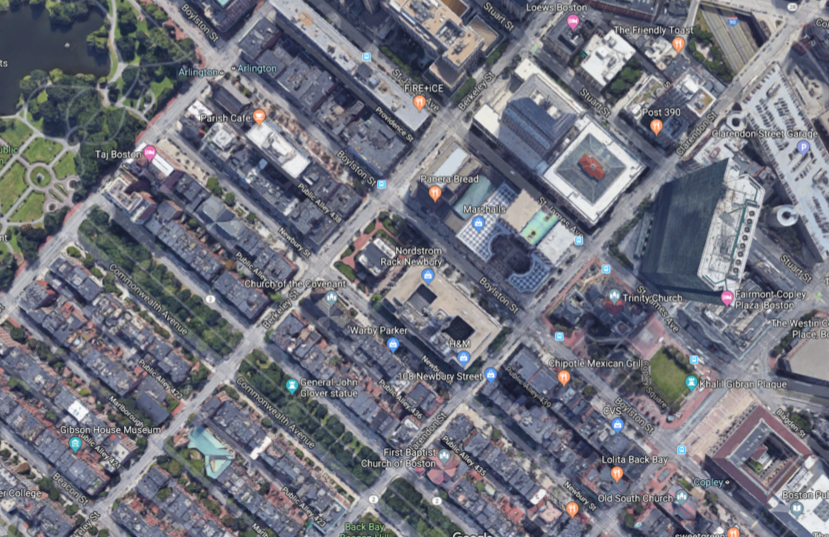
Table 7
Results from Boylston Street Test Runs:
Dartmouth Street to Arlington Street
Performance Measure |
Score |
Weight |
Percent of Grading Category Score |
Grading Category |
Grade |
Bicycle facility presence |
0 |
3 |
50% |
Capacity Manage-ment and Mobility |
Blank |
Proximity to bike network |
100 |
2 |
33% |
Capacity Manage-ment and Mobility |
Blank |
Proximity to transit |
100 |
1 |
17% |
Capacity Manage-ment and Mobility |
Blank |
Capacity Management and Mobility |
Blank |
Blank |
Blank |
Blank |
F |
Bike rack presence |
100 |
1 |
50% |
Economic Vitality |
Blank |
Land use |
100 |
1 |
50% |
Economic Vitality |
Blank |
Economic Vitality |
Blank |
Blank |
Blank |
Blank |
A |
Bicycle facility presence |
0 |
2 |
33% |
Safety |
Blank |
Absence of Bicycle Crashes |
100 |
2 |
33% |
Safety |
Blank |
Bicyclist operating space |
0 |
1 |
17% |
Safety |
Blank |
Number of travel lanes |
25 |
1 |
17% |
Safety |
Blank |
Safety |
Blank |
Blank |
Blank |
Blank |
F |
Bicycle facility continuity |
0 |
1 |
50% |
System Preservation |
Blank |
Bicycle facility condition |
0 |
1 |
50% |
System Preservation |
Blank |
System Preservation |
Blank |
Blank |
Blank |
Blank |
F |
Income equal to/less than $45,392 |
No |
X |
X |
Transportation Equity |
Blank |
28.2% minority population |
No |
X |
X |
Transportation Equity |
Blank |
18.2% + of pop. < 16 years old |
No |
X |
X |
Transportation Equity |
Blank |
16.1% + households w/o vehicle |
Yes |
X |
X |
Transportation Equity |
Blank |
Within ¼ mile of school/college |
Yes |
X |
X |
Transportation Equity |
|
Transportation Equity |
Blank |
Blank |
Blank |
Blank |
Moderate Priority |
The bicycle report card developed for the Boston metropolitan region relies on data that are readily available for all four grading categories. The information is not easily susceptible to data limitation issues in the way that traffic volume or speed data can be along local/residential routes and shared-use paths, where such information is often not available and difficult to collect on a case-by-case basis. Grading for the bicycle report card is straightforward and allows users to identify specific qualities that are and are not beneficial for bicycle travel along a roadway segment.
Although the four grading categories use readily available data and the information required to establish a roadway segment’s priority level is readily available to practitioners, it would be difficult for a member of the public to calculate the TAZ-level information required to assess the importance of including bicycle facilities in a given location. Furthermore, the report card does not include factors that have been used in previous BLOS calculations, such as whether a roadway is a high-crash location or the average daily traffic rate along a segment. These measurements can serve as a proxy for indicating bicyclist comfort. Fortunately, performance measures such as Bicyclist Operating Space and Number of Travel Lanes provide a similar sense of bicyclist comfort at a given location.
MPO staff recommends adoption of the bicycle report card methodology for grading the quality of the bicycle environment along roadways in the Boston region. Municipal employees and the public can grade bicycle report cards for any roadway segment, so long as they have access to accurate data or are willing to conduct fieldwork to collect the necessary information. Rather than one cumulative score, the bicycle report card grades the quality of the bicycle environment using multiple categories to give a score for several goals. In the best interest of the Boston region and for the development of the next LRTP, MPO staff recommends that staff pursue a follow-up project that would create a bicycle report card monitoring program for the MPO. If the bicycle report card monitoring program project is approved, MPO staff will calculate the bicycle report card scores for select roadway segments throughout the Boston region. Once implemented, MPO staff recommends developing a dashboard to support planners, engineers, and the general public as a tool to analyze the bicycle friendliness of roadway segments around the region.
The next step is to develop and launch a bicycle report card outreach plan, which will inform and educate planners and engineers from local communities about the tool. MPO staff will present this methodology to the MPO board and at local conferences. This memorandum will be posted on the MPO’s website, under the Livability section. In addition, staff will work with the MPO’s outreach coordinator and the MassDOT Director of Sustainability to determine other innovative ways to inform the public and professionals about this tool, as part of the Congestion Management Process, LRTP needs assessment, and TIP work.
This project focused on developing a methodology that outlines how to grade roadway segments for bicycles. The next step is to focus on the implementation of this project. In early 2019, MPO staff will present a proposal for a follow-up project for the creation of a dashboard that would monitor bicycle report card grading on roadways in the Boston region. This new project will include collecting raw data for the selected performance measures throughout the entire defined network. The information would be used to calculate performance measure scores, which will be used to evaluate the performance of roadways for bicyclists. Once developed, the dashboard will be available for public use on the MPO’s website. This project will be proposed for federal fiscal years 2020–21.
CMC/cmc
1 Highway Capacity Manual 2010 Volume 2: Uninterrupted Flow; Chapter 15: Two-Lane Highways; Transportation Research Board of the National Academies; December 2010; page 15-8.
2 Highway Capacity Manual 2010 Volume 3: Interrupted Flow; Chapter 16: Urban Street Facilities; Transportation Research Board of the National Academies; December 2010; page 16-21.
3 Highway Capacity Manual 2010 Volume 3: Interrupted Flow; Chapter 17: Urban Street Segments; Transportation Research Board of the National Academies; December 2010; page 17-55.
4 Highway Capacity Manual 2010 Volume 3: Interrupted Flow; Chapter 18: Signalized Intersections; Transportation Research Board of the National Academies; December 2010; page 18-70.
5 Highway Capacity Manual 2010 Volume 3: Interrupted Flow; Chapter 18: Signalized Intersections; Transportation Research Board of the National Academies; December 2010; page 18-71.
6 Highway Capacity Manual 2010 Volume 3: Interrupted Flow; Chapter 19: Two-Way STOP-Controlled Intersections; Transportation Research Board of the National Academies; December 2010; page 19-36.
7 Maaza C. Mekuria, Peter G. Furth, and Hilary Nixon, Low-Stress Bicycling and Network Connectivity; Mineta Transportation Institute; May 2012; page 1.
8 City of Cambridge Bicycle Plan: Toward a Bikeable Future; City of Cambridge Environmental & Transportation Planning Division of the Community Development Department; Toole Design Group; Chapter 5: Creating a Bicycle Network Vision, 2015; page 75.
9 City of Cambridge Bicycle Plan: Toward a Bikeable Future; City of Cambridge Environmental & Transportation Planning Division of the Community Development Department; Toole Design Group; Appendix E: Bicycle Level of Comfort Criteria, 2015.
10 David L. Harkey, Donald W. Reinfurt, Matthew Knuiman, and others, Development of the Bicycle Compatibility Index: A Level of Service Concept, Final Report; (McLean, VA: Federal Highway Administration, December 1998) page 108.
11 David L. Harkey, Donald W. Reinfurt, Matthew Knuiman, and others, Development of the Bicycle Compatibility Index: A Level of Service Concept, Final Report; (McLean, VA: Federal Highway Administration, December 1998) page 54.
12 David L. Harkey, Donald W. Reinfurt, Matthew Knuiman, and others, Development of the Bicycle Compatibility Index: A Level of Service Concept, Final Report (McLean, VA: Federal Highway Administration, December 1998) page 115.
13 P.J. Kreen, P. Oja, and S. Titze. Development of a Bikeability Index to Assess the Bicycle-Friendliness of Urban Environments, Institute of Sport Science, University of Graz, Graz, Austria; UKK Institute, Tampere, Finland; December 31, 2015.
14 The Copenhagenize Bicycle Friendly Cities Index 2017; Copenhagenize Design Company; 2018; http://copenhagenizeindex.eu/about.html.
15 The Criteria for the Copenhagenize Index; Copenhagenize Design Company; 2018; http://copenhagenizeindex.eu/criteria.html.
16 M.A Zayed, “Towards an Index of City Readiness for Cycling,” International Journal of Transportation Science and Technology 5, Issue 3 (October 2016): 210-225.
17 M.A Zayed, “Towards an Index of City Readiness for Cycling,” International Journal of Transportation Science and Technology, 5, Issue 3 (October 2016): 210-225.
18 Bike Score; Walk Score; 2018; https://www.walkscore.com/bike-score-methodology.shtml.
19 J Broach, J Dill, and J. Gliebe, “Where do cyclists ride? A route choice model developed with revealed preference GPS data,” Transportation Research Part A: Policy and Practice, 46, Issue 10 (December 2012); 1730-1740.
20 Meghan Winters, Michael Brauer, Eleanor M. Setton, and others, “Mapping Bikeability: A Spatial Tool to Support Sustainable Travel,” Environmental and Planning B: Urban Analytics and City Science, 40, no 5 (January 2013); 865-883 http://journals.sagepub.com/doi/abs/10.1068/b38185
21 Hélène Charreire, Christiane Weber, Basile Chaix, and others, “Identifying built environmental patterns using cluster analysis and GIS: Relationships with walking, cycling and body mass index in French adults,” International Journal of Behavioral Nutrition and Physical Activity, 9, no. 59 (May 2012) https://ijbnpa.biomedcentral.com/articles/10.1186/1479-5868-9-59
22 Wanda Wendel-Vos, Jantine A. Schuit, and others, "Factors of the Physical Environment Associated with Walking and Bicycling," Medicine & Science in Sports & Exercise, 36, Issue 4 (April 2004): 725-730 https://journals.lww.com/acsm-msse/Fulltext/2004/04000/Factors_of_the_Physical_Environment_Associated.22.aspx
23 Elizabeth G. Jones, “Development of Rural Bicycle Compatibility Index,” Nebraska Department of Transportation Research Reports, July 2004.
24 Elizabeth G. Jones, Ph.D., Development of Rural Bicycle Compatibility Index (Lincoln, NE: Department of Civil Engineering, College of Engineering and Technology, 2004)
https://digitalcommons.unl.edu/cgi/viewcontent.cgi?article=1018&context=ndor
25 Federal Highway Administration. Shared-Use Path Level of Service Calculator, A User's Guide (US Department of Transportation, July 2006) https://www.fhwa.dot.gov/publications/research/safety/pedbike/05138/05138.pdf
26 Local Access Score, http://localaccess.mapc.org
27 An HSIP cluster is a location that ranks in the top five percent of all crash clusters in the region based on Equivalent Property Damage Only (EPDO) scores. EPDO scoring is a method for assessing the frequency and severity of crashes at a given location over a period of time. This method assigns weighting factors to indicate the severity of a crash; a crash that causes a fatality is weighted by 10, a crash causing injury is weighted by 5, and a crash resulting in property damage is weighted by 1.