Technical Memorandum
DATE: February 1, 2024
TO: Boston Region Metropolitan Planning Organization
FROM: Samuel Taylor, Boston Region MPO Staff
RE: Roadway Safety Targets, Calendar Year 2024
The United States Department of Transportation (USDOT) requires states and metropolitan planning organizations (MPO) to establish annual targets for federally required roadway safety performance measures, which pertain to fatalities and serious injuries from motor vehicle crashes. The Boston Region MPO has voted to support the Commonwealth of Massachusetts’ federally required annual targets for these roadway safety performance measures each year from 2018 through 2023, since the inception of Roadway Safety performance measures into Transportation Performance Management (TPM). The Commonwealth has set its roadway safety targets for calendar year (CY) 2024, and the MPO is required to establish its CY 2024 targets by February 27, 2024, by either agreeing to support the Commonwealth’s targets or setting its own. MPO staff recommends that the MPO vote to support the Commonwealth’s CY 2024 targets for these federally required measures and requests that the MPO take action to do so at its February 1, 2024, meeting.
The National Performance Management Measures: Highway Safety Improvement Program rule identifies five performance measures related to crashes involving motor vehicles for which targets must be set:
The USDOT requires states to establish and report targets for these measures for the next calendar year by August 31 each year. After August 31st, MPOs have 180 days to establish their own targets using one of the following methods:
In either case, the MPO will need to coordinate with the Commonwealth when setting targets. It will also need to incorporate goals, objectives, measures, and targets from the Commonwealth’s safety plans and processes into the MPO’s planning processes.
Table 1 shows the Commonwealth’s CY 2024 roadway safety performance targets for the federally required performance measures. The table also notes the Commonwealth’s long-term target of zero fatalities and serious injuries on Massachusetts roadways. Like the Commonwealth, the Boston Region MPO has a long-term target of zero fatalities and serious injuries and is currently working on a Vision Zero Action Plan, funded by USDOT and MassDOT, to reach this goal.
The targets in all columns of Table 1 reflect five-year rolling annual averages, as required by USDOT. The two-year targets are a target of rolling averages for the years 2020–24, and the four-year targets are a target of rolling averages for the years 2022–26. The 2020–24 targets are called two-year targets due to the two years for which data is incomplete, 2023 and 2024. The 2022–26 targets are called four-year targets due to the four years for which data is complete, 2023, 2024, 2025, and 2026.
Table 1
Proposed Roadway Safety Targets (CY 2024)
Performance Measure |
2-Year Target (2020–24) |
4-Year Target (2022–26) |
Long-Term Target |
Number of Fatalities |
377 |
362 |
0 |
Rate of Fatalities per 100 Million VMT |
0.61 |
0.54 |
0 |
Number of Serious Injuries |
2,708 |
2,603 |
0 |
Rate of Serious Injuries per 100 Million VMT |
4.36 |
3.91 |
0 |
Number of Nonmotorized Fatalities and Nonmotorized Serious Injuries |
445 |
435 |
0 |
*This target value is expressed as a five-year rolling annual average.
CY = Calendar Year. VMT = Vehicle-Miles Traveled.
Sources: Federal Highway Administration, Commonwealth of Massachusetts, and Boston Region MPO
Staff.
For more information and context about how the state and MPO set roadway safety performance targets, see Appendix A.”1
MPO staff recommends that the Boston Region MPO vote to support the Commonwealth’s CY 2024 roadway safety performance targets. This option would satisfy federal requirements and would reflect the way the MPO will need to collaborate with the Commonwealth on safety strategies to reduce fatalities and injuries in the Boston region. Staff requests that the MPO take action to do so at its February 1, 2024, meeting. Should the MPO select this target-setting approach, staff will present and describe these targets in the performance chapters of the Federal Fiscal Years 2025–29 TIP document. The targets adopted by the Boston Region MPO will inform the planning and investment activities that will support improvements in roadway safety outcomes.
1 MassDOT CY24 Safety Performance Measure Targets (PM1). Available at https://www.ctps.org/calendar/day/20240201.
Appendix A: MassDOT CY24 Safety Performance Measure Targets (PM1)
The National Performance Management Measures: Highway Safety Improvement Program rule identifies five performance measures related to crashes involving motor vehicles for which targets must be set:
All targets are expressed in terms of rolling 5-year annual averages. The 2020-2024 targets are called 2-year targets in reference to the two calendar years for which data is unavailable or has not occurred, 2023 and 2024.1 The 2022-2026 targets are called 4-year targets in reference to the four calendar years for which data is unavailable or has not occurred, 2023, 2024, 2025, and 2026.
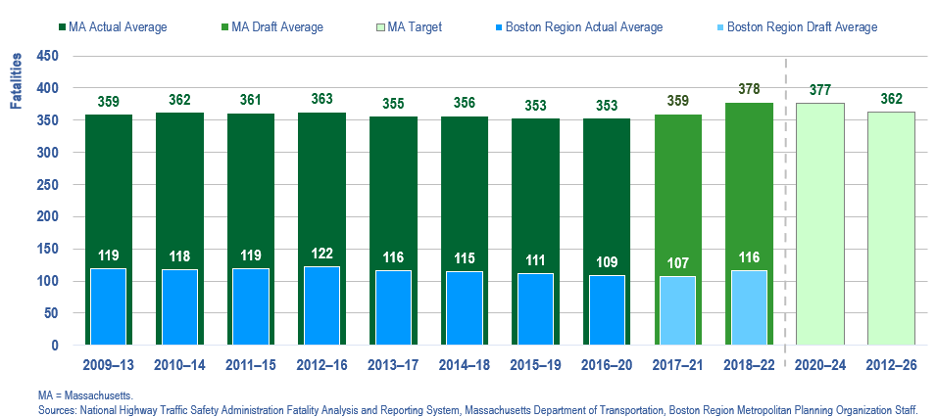
Per Federal Highway Administration (FHWA) guidance, the calendar year (CY) 2024 target setting process began with a trend line projection based on the most recent available data. This year, MassDOT also developed a 2022-2026 target to be consistent with the Highway Safety Office and National Highway Traffic Safety Administration (NHTSA). Due to higher rates of speeding caused by decreased vehicle miles traveled (VMT) amid pandemic shutdowns in 2020 and the lingering impacts in 2021 and 2022, roadway fatalities were increasing relative to previous years. Furthermore, the Infrastructure Investment and Jobs Act (IIJA) requires “performance targets to demonstrate constant or improved performance,” so Massachusetts is unable to use increasing “targets.” Although the latest 2023 data suggests fatalities are trending towards pre-COVID levels, the data is incomplete and was not used when the target setting process began. Therefore, MassDOT developed the target for CY 2024 by projecting the 2023 and 2024 fatalities to be similar to those before the COVID-19 pandemic. As a result, year over year changes reflect a decrease of approximately 20% when comparing 2021 and 2022 to 2023 and 2024. However, the 5-year average from 2018-2022 to 2020-2024 sees only a minor decrease from 378 to 377. If this trend continues, the 2022-2026 average will drop to 362, a reduction of 4%.
Figure 1
Number of Fatalities
As always, MassDOT’s overarching goal is zero deaths and this goal will be pursued by implementing strategies from the Strategic Highway Safety Plan (SHSP). The Massachusetts SHSP and Vulnerable Road User Safety Assessment were both updated and finalized in 2023. Like the Commonwealth, the Boston Region MPO has a long-term target of zero fatalities and serious injuries, and has embarked on a Vision Zero program, as well as a USDOT grant-funded Safe Streets and Roads for All Action Plan. These strategies help provide details on how the state will drive down fatalities and serious injuries. In future years, the Boston Region MPO, with the guidance of the Vision Zero program would be positioned to create region-specific targets on roadway fatalities. Moreover, it should be restated that while MassDOT developed numeric targets, the goal is 0 and MassDOT will continue to work toward that goal by implementing SHSP strategies.
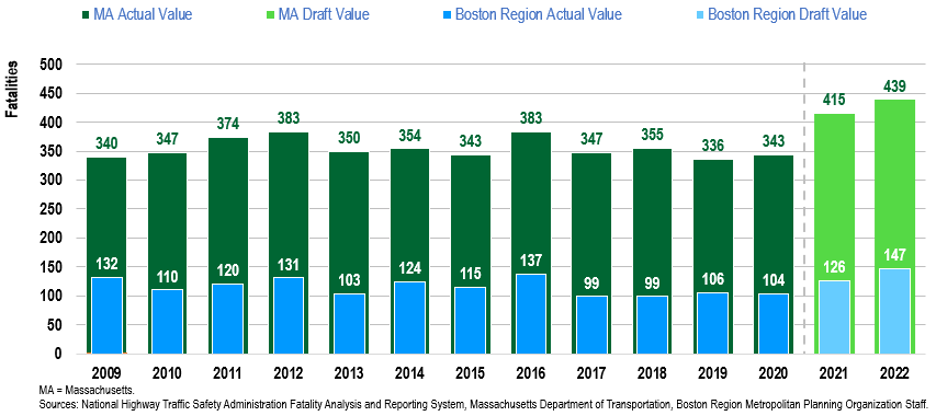
In the Boston region, fatalities increased slightly between 2020 and 2021, and again between 2021 and 2022. The 147 fatalities that occurred in the region in 2022 accounted for 33% of the state’s fatalities. Despite the Boston region’s large share of fatalities, it is lower than the proportion we may expect given the region’s VMTs are 43% of the state’s and the region holds nearly half of the state’s population.
Figure 2
Number of Fatalities (Annual)
Fatality Rate
The fatality rate represents 5-year average fatalities divided by 5-year average VMT. The COVID-19 pandemic greatly impacted VMT, causing fatality rates to spike in 2020 with significantly lower VMT and slightly higher fatalities. Projections for 2023 indicate statewide VMT will exceed pre-pandemic levels. Consequently, the five-year average fatality rate is expected to decrease from 0.62 fatalities per 100 million VMT for 2018-2022, to 0.61 fatalities per 100 million VMT in 2020-2024, a reduction of 1.63% If this trend continues, MassDOT projects a decrease to 0.54 fatalities per 100 million VMT, a reduction of 12%.
Figure 3
Fatality Rate per 100 Million VMT
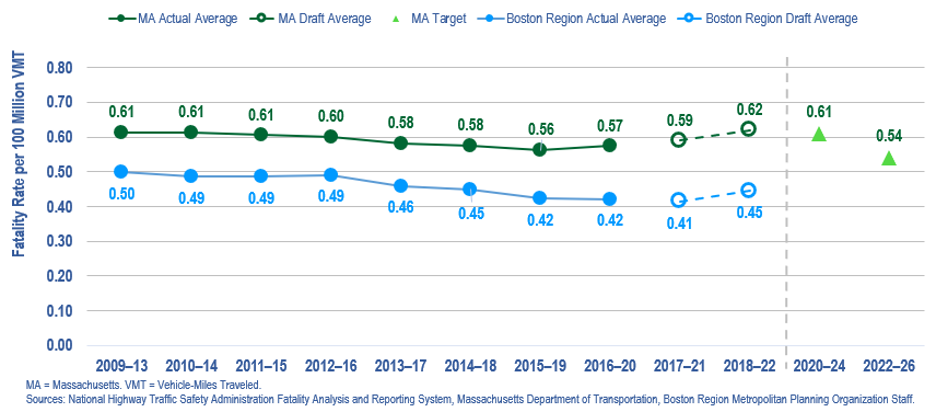
Note: 2023 data is not complete and therefore was not used for target setting purposes.
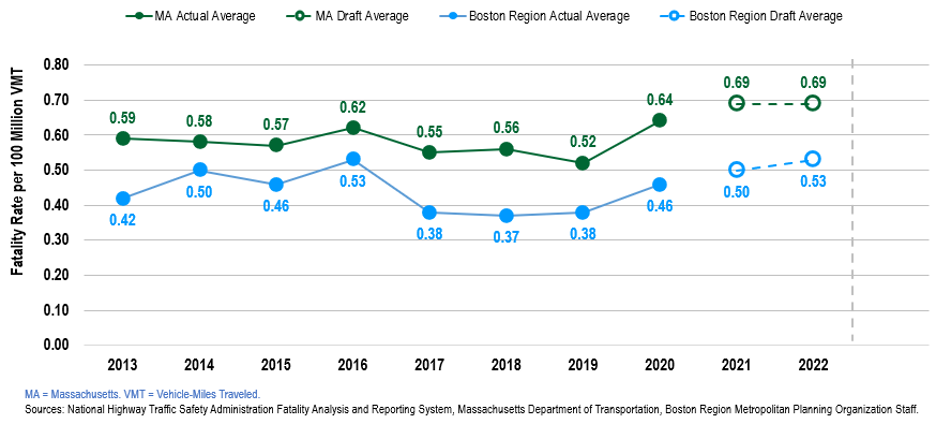
Shown in Figure 4, the Boston Region’s 1-year fatality rate rose for the fourth year in a row. However, both Boston’s 1-year fatality rate and rolling 5-year average rate continue to be lower than that of the state, with 0.45 fatalities per 100 million VMT in the Boston region, and 0.62 statewide.
Figure 4
Fatality Rate per 100 Million VMT (Annual)
Total Serious Injuries
The target setting process began with a trend line projection based on the most recent available data. The 2021 and 2022 serious injury data were not finalized in the statewide crash system during this process, so it is possible these figures will change once that data becomes final.
Due to higher rates of speeding caused by decreased vehicle miles and congestion amid pandemic shutdowns in 2020 and the lingering impacts in 2021 and 2022, serious injuries increased relative to previous years. Although the latest 2023 data suggests serious injuries are trending towards pre-COVID levels, the data is incomplete and was not used when the target setting process began. Therefore, MassDOT developed the target for CY 2024 by projecting the 2023 and 2024 serious injuries to be in line with pre-COVID data. As a result, year over year changes reflect a decrease of approximately 10% when comparing 2021 and 2022 to 2023 and 2024. However, the 5-year average from 2018-2022 to 2020-2024 remains the same at 2,708 serious injuries. If this trend continues, the 2022-2026 average will drop to 2,603, a 4% reduction.
Figure 5
Number of Serious Injuries
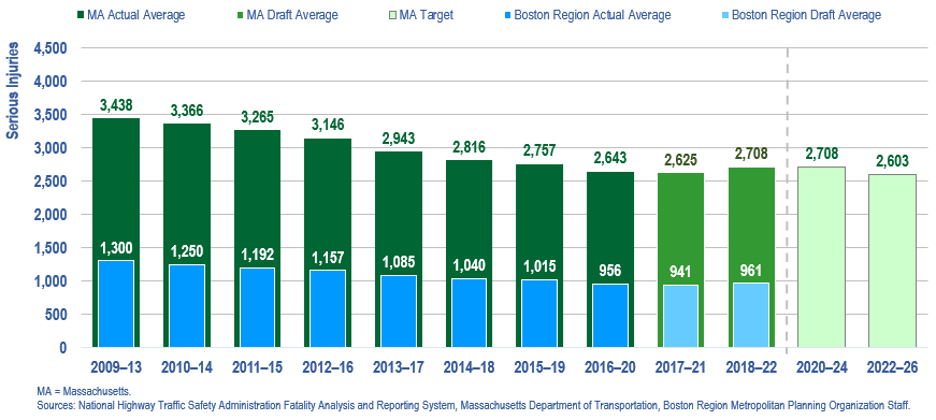
In the Boston region, an increase in serious injuries2 has corresponded with an increase in fatalities over the past two years. There were 1,040 serious injuries from crashes in the Boston region as compared to 2,987 statewide. The rolling 5-year averages increased slightly at the regional and state level in 2018-2022 from the previous 5-year period of 2017-2021.
Serious Injuries Rate
Similar to the fatality rate, serious injury rates were greatly impacted due to COVID. Following the methods above, the projection is now 4.36 serious injuries per 100 million VMT for 2020-2024. This reflects a 1.36% reduction compared to the 2018-2022 serious injuries rate of 4.42. If this trend continues, the 2022-2026 rate will drop to 3.91 serious injuries per 100 million VMT, a 11% reduction.
In the Boston region, the 1-year serious injury rate increased in 2021 before decreasing in 2022, following the same pattern as serious injuries statewide. The 5-year rolling average for 2018-2022 was 3.68 in the region and 4.42 statewide.
Figure 6
Serious Injury Rate per 100 Million VMT
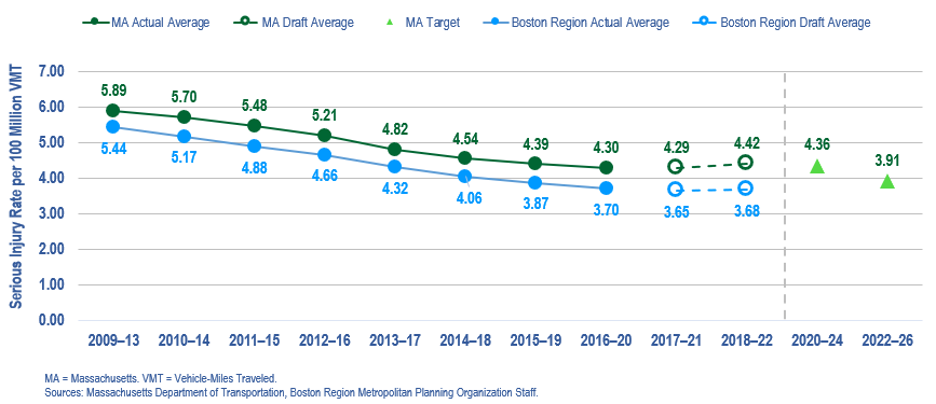
Note: 2023 data is not complete and therefore was not used for target setting purposes.
Total Number of Non-Motorized Fatalities and Serious Injuries
The number of non-motorized fatalities and serious injuries decreased during the start of the pandemic in 2020, followed by an increase in 2021 and dramatic spike in 2022. Based on the state’s emphasis on vulnerable road users, MassDOT anticipates the 2023 and 2024 numbers to match those from 2020. This results in a 5-year average of non-motorist fatalities and serious injuries decreasing from 480 (2018-2022) to 445 (2020-2024), a 7.3% reduction. Looking ahead to 2026, the average combined non-motorist fatalities and serious injuries is expected to decrease to 435, a reduction of approximately 9%.
Figure 7
Number of Nonmotorized Fatalities and Nonmotorized Serious Injuries
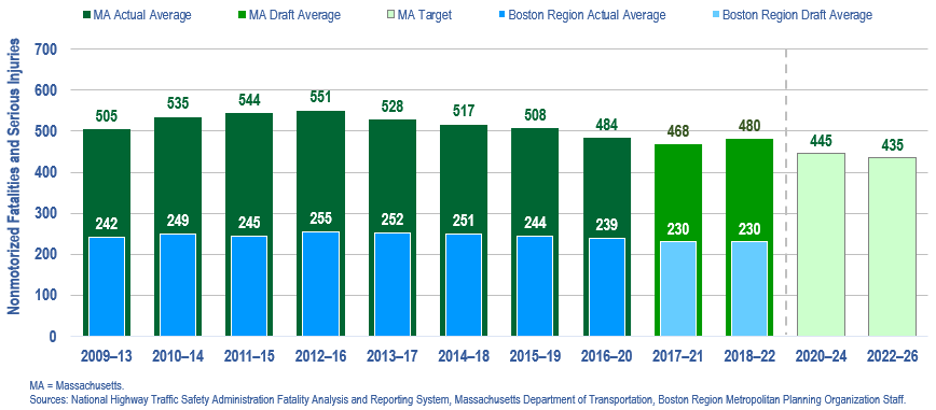
Note: 2023 data is not complete and therefore was not used for target setting purposes.
While for federal reporting purposes, nonmotorized fatalities and serious injuries are reported as one metric, totals for the two outcomes can be decoupled to present more detailed information on outcomes for nonmotorized commuters.
In the Boston Region, both the 5-year rolling averages of nonmotorized fatalities and nonmotorized serious injuries increased over the past two years. Nonmotorized fatalities increased from 32 to 44 between 2021 and 2022, while nonmotorized serious injuries increased from 191 to 210 during the same years. The regional trends follow the statewide patterns of increases in harm to nonmotorized commuters in 2021 and 2022.
Note: The fatality and serious injury data contained here was developed to align with the data included in MassDOT's annual Highway Safety Improvement Program (HSIP) report. As such, historical data may be different from what was reported in prior years.
The targets were developed in coordination with the Executive Office of Public Safety and Security (EOPSS), the Highway Safety Division (HSD), and other sections within MassDOT. Although MassDOT emphasizes that the state’s goal is zero fatalities and serious injuries, the state targets presented here are not “goals” but realistic targets considering the events of the last 3+ years. The Secretary of Transportation and Highway Division Administrator for MassDOT approved the targets recognizing that MassDOT must demonstrate short term incremental steps in order to achieve the Commonwealth’s goal.
1 Since performance data for 2023 had not yet been certified and calendar year 2024 had not finished at the time targets were presented, MassDOT and the Boston Region MPO refer to their targets for 2020-2024 metrics as 2-year targets. Similarly, since performance data for 2023 had not yet been certified, and calendar years 2024, 2025, 2026 had not finished at the time targets were presented, MassDOT and the Boston Region MPO refer to their targets for 2022-2026 metrics as 4-year targets.
2 As of April 15, 2019, states are required to define serious injuries using the definition of “Suspected Serious Injury (A),” as detailed in the Model Minimum Uniform Crash Criteria 4th Edition.
The Boston Region Metropolitan Planning Organization (MPO) operates its programs, services, and activities in compliance with federal nondiscrimination laws including Title VI of the Civil Rights Act of 1964 (Title VI), the Civil Rights Restoration Act of 1987, and related statutes and regulations. Title VI prohibits discrimination in federally assisted programs and requires that no person in the United States of America shall, on the grounds of race, color, or national origin (including limited English proficiency), be excluded from participation in, denied the benefits of, or be otherwise subjected to discrimination under any program or activity that receives federal assistance. Related federal nondiscrimination laws administered by the Federal Highway Administration, Federal Transit Administration, or both, prohibit discrimination on the basis of age, sex, and disability. The Boston Region MPO considers these protected populations in its Title VI Programs, consistent with federal interpretation and administration. In addition, the Boston Region MPO provides meaningful access to its programs, services, and activities to individuals with limited English proficiency, in compliance with U.S. Department of Transportation policy and guidance on federal Executive Order 13166.
The Boston Region MPO also complies with the Massachusetts Public Accommodation Law, M.G.L. c 272 sections 92a, 98, 98a, which prohibits making any distinction, discrimination, or restriction in admission to, or treatment in a place of public accommodation based on race, color, religious creed, national origin, sex, sexual orientation, disability, or ancestry. Likewise, the Boston Region MPO complies with the Governor's Executive Order 526, section 4, which requires that all programs, activities, and services provided, performed, licensed, chartered, funded, regulated, or contracted for by the state shall be conducted without unlawful discrimination based on race, color, age, gender, ethnicity, sexual orientation, gender identity or expression, religion, creed, ancestry, national origin, disability, veteran's status (including Vietnam-era veterans), or background.
A complaint form and additional information can be obtained by contacting the MPO or at http://www.bostonmpo.org/mpo_non_discrimination.
To request this information in a different language or in an accessible format, please contact
Title VI Specialist
Boston Region MPO
10 Park Plaza, Suite 2150
Boston, MA 02116
civilrights@ctps.org
By Telephone:
857.702.3700 (voice)
For people with hearing or speaking difficulties, connect through the state MassRelay service:
Relay Using TTY or Hearing Carry-over: 800.439.2370
Relay Using Voice Carry-over: 866.887.6619
Relay Using Text to Speech: 866.645.9870
For more information, including numbers for Spanish speakers, visit https://www.mass.gov/massrelay.