Technical Memorandum
DATE: February 4, 2021
TO: Boston Region Metropolitan Planning Organization
FROM: Michelle Scott, Boston Region MPO Staff
RE: Federally Required Calendar Year 2021 Safety Targets
The United States Department of Transportation (US DOT) requires states and metropolitan planning organizations (MPO) to establish targets each year for federally required roadway safety performance measures, which pertain to fatalities and serious injuries from motor vehicle crashes. The Boston Region MPO has voted to support the Commonwealth of Massachusetts’ federally required annual targets for these roadway safety performance measures in 2018, 2019, and 2020. The Commonwealth has set its roadway safety targets for calendar year (CY) 2021, and the MPO is required to establish its CY 2021 targets by February 27, 2021, by either agreeing to support the Commonwealth’s targets or setting its own. MPO staff recommends that the MPO vote to support the Commonwealth’s CY 2021 targets for these federally required measures, and requests that the MPO take action to do so at its February 4, 2021, meeting.
A series of federal rules designed to focus the federal surface transportation program on achieving performance outcomes was initiated under the Moving Ahead for Progress in the 21st Century (MAP-21) legislation and continued under the Fixing America’s Surface Transportation (FAST) Act (see Appendix A for more details). The National Performance Management Measures: Highway Safety Improvement Program rule identifies five performance measures related to crashes involving motor vehicles for which targets must be set:
The US DOT requires states to establish and report targets for these measures for the next calendar year by August 31 each year. MPOs have 180 days—no later than February 27 of the applicable calendar year—to establish their own targets using one of the following methods:
In either case, the MPO will need to coordinate with the Commonwealth when setting targets. It will also need to incorporate goals, objectives, measures, and targets from the Commonwealth’s safety plans and processes into the MPO’s planning process.
The MPO has reported on these roadway safety measures and targets, along with other performance measures and targets, in its current Long-Range Transportation Plan (LRTP), Destination 2040. In the LRTP, the MPO identified baseline values for these measures and listed recent MPO targets. The MPO provides similar information in the Transportation Improvement Program (TIP), along with descriptions of how projects programmed in the TIP may support improvements in these performance measures and progress toward achieving roadway safety targets.
As previously mentioned, the Commonwealth has set targets for these federally required roadway safety performance measures since 2017. The Federal Highway Administration (FHWA) encourages states to set targets that are “data-driven, realistic, and attainable,” and that align with US DOT’s performance management framework and legislative intent. 1 The Commonwealth has applied these principles when setting targets for these federally required measures.
Table 1 lists the Commonwealth’s CY 2018 safety targets (set in August 2017), CY 2019 targets (set in August 2018), and CY 2020 targets (set in August 2019). Finally, the table notes the Commonwealth’s long-term goal to eliminate fatalities and serious injuries on Massachusetts roadways. This goal is described in MassDOT’s Tracker performance report card and in the Commonwealth’s 2018 Strategic Highway Safety Plan (SHSP).2 The 2018 SHSP also identifies interim goals that the Commonwealth will work toward to advance its long-term goal, and describes the planning, programming, and other strategies that the Commonwealth and partner entities can implement to improve safety outcomes.
Table 1
Massachusetts CY 2018–20 Targets and
Long-Term Targets for Roadway Safety Performance Measures
Performance Measure |
2018 Target (2014–18)* |
2019 Target (2015–19)* |
2020 Target (2016–20)* |
MA Long- Term Target |
Number of Fatalities |
352.00 |
353.00 |
347.00 |
0.00 |
Fatality Rate per 100M VMT |
0.61 |
0.58 |
0.56 |
0.00 |
Number of Serious Injuries |
2,896.00 |
2,801.00 |
2,689.00 |
0.00 |
Serious Injury Rate per 100M VMT |
5.01 |
4.37 |
4.30 |
0.00 |
Number of Nonmotorized Fatalities and Serious Injuries |
540.80 |
541.00 |
505.40 |
0.00 |
* These target values are expressed as five-year rolling annual averages.
CY = Calendar Year. M = Million. MA = Massachusetts. VMT = Vehicle-Miles Traveled.
Sources: Commonwealth of Massachusetts, Boston Region MPO Staff.
The FHWA assesses each state’s performance regarding its targets as data become available to determine whether the state has made significant progress toward meeting its performance targets. To make significant progress, a state must meet four out of the five roadway safety performance targets or have actual performance better than the baseline for those measures. Should a state not make significant progress, FHWA will limit that state’s flexibility when spending federal transportation dollars to direct funding toward projects and initiatives that would improve roadway safety.
In 2020, the US DOT determined it had sufficient data to assess state performance against CY 2018 roadway safety performance targets. For Massachusetts, US DOT compared the 2018 target for each measure (which reflected a 2014–18 rolling annual average) to baseline values for that measure (the 2012–16 rolling annual average) and the outcome for that measure (actual 2014–18 rolling annual average, based on US DOT data).3 Table 2 summarizes US DOT’s assessment of Massachusetts’s performance against CY 2018 performance targets. For four of the measures, Massachusetts’s performance met or was better than the CY 2018 target. While the actual 2014–18 average for the number of fatalities was not better than the target, it was better than the baseline (2012–16 average). As a result, the FHWA determined that Massachusetts made significant progress with respect to its CY 2018 performance targets.
Table 2
US DOT Assessment of
Massachusetts CY 2018 Safety Performance Targets
Performance Measure |
2014–18 Target |
2014–18 Outcome* |
Target Achieved |
2012–16 Baseline |
Outcome Better than Baseline |
Number of Fatalities |
352.0 |
358.4 |
No |
363.8 |
Yes |
Fatality Rate per 100M VMT |
0.610 |
0.584 |
Yes |
0.626 |
Yes |
Number of Serious Injuries |
2896.0 |
2,809.8 |
Yes |
3,145.8 |
Yes |
Serious Injury Rate per 100M VMT |
5.10 |
4.588 |
Yes |
5.426 |
Yes |
Number of Nonmotorized Fatalities and Serious Injuries |
540.8 |
505.8 |
Yes |
540.6 |
Yes |
Notes: All baseline and target values for federally required performance measures are expressed as five-year rolling annual averages.
* Data used to measure the 2014–18 outcomes was compiled by US DOT.
CY = Calendar Year. M = Million. MPO = Metropolitan Planning Organization. US DOT = US Department of Transportation. VMT = Vehicle-Miles Traveled.
Sources: Federal Highway Administration, Commonwealth of Massachusetts, Boston Region MPO Staff.
The FHWA will not review MPO progress on these performance measures directly, and the MPO will neither be penalized for not achieving roadway safety targets nor rewarded for attaining them. During quadrennial certification reviews, the FHWA will examine how MPOs are implementing performance-based planning and programming principles and assess how MPOs are progressing toward their own targets or assisting the state in making progress toward its targets.
Roadway safety performance targets for CY 2021 will reflect a 2017–21 rolling annual average, as required by US DOT. When setting targets, the Commonwealth considered the following:
Table 3 shows the Commonwealth’s CY 2021 roadway safety performance targets and reiterates the Commonwealth’s long-term targets.
Table 3
Massachusetts CY 2021 Safety Performance Targets
Performance Measure |
CY 2021 Target |
MA Long-Term Target |
Number of Fatalities |
339.00 |
0.00 |
Fatality Rate (per 100M VMT) |
0.55 |
0.00 |
Number of Serious Injuries |
2,580.00 |
0.00 |
Serious Injury Rate (per 100M VMT) |
4.23 |
0.00 |
Number of Nonmotorized Fatalities and Serious Injuries |
506.00 |
0.00 |
* This target value is expressed as a five-year rolling annual average.
CY = Calendar Year. M = Million. MA = Massachusetts. MPO = Metropolitan Planning Organization. VMT = Vehicle-Miles Traveled.
Sources: Federal Highway Administration, Commonwealth of Massachusetts, Boston Region MPO Staff.
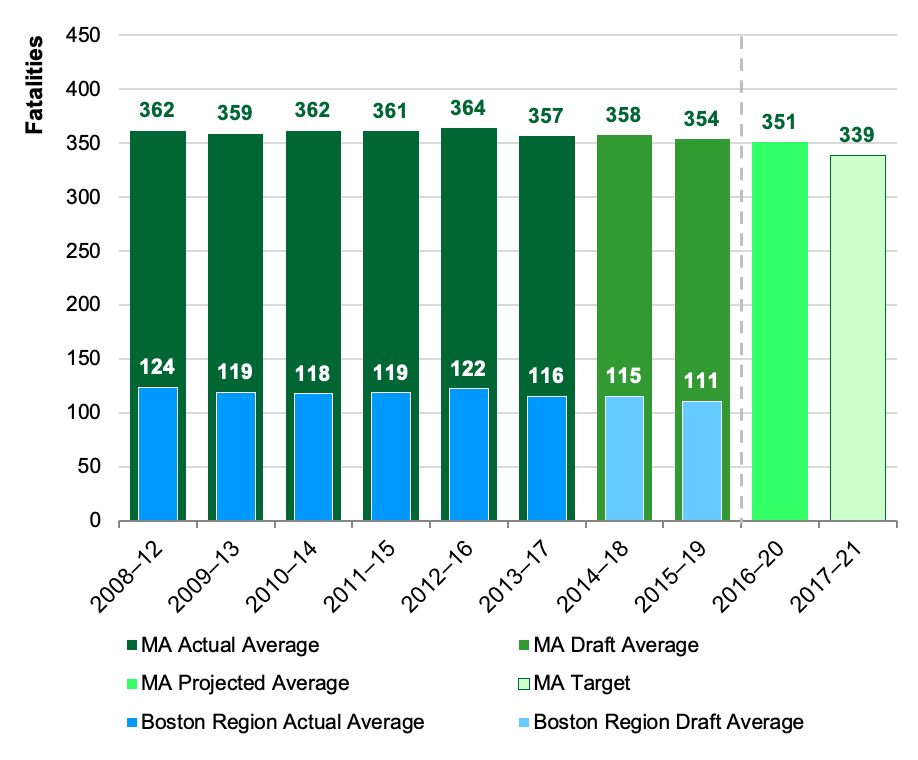
Figures 1 through 5 display actual and draft data, projections, and CY 2021 targets for Massachusetts for each of the roadway safety performance measures. These figures show information that was available in spring and summer 2020, when the Commonwealth was setting CY 2021 targets. These figures also show actual and draft data for the Boston region. Supplementary data are available in Appendix B.
Figure 1 shows data, projections, and the CY 2021 target for the number of fatalities, while Figure 2 shows data and targets pertaining to the fatality rate per 100 million VMT. As shown in the table, five-year rolling averages for the fatality-oriented measures have gradually decreased over time at both the Massachusetts level and the Boston region level. The Commonwealth sought to (1) create targets for the number of fatalities and the fatality rate that were lower than those set in CY 2020, and (2) account for the changes in VMT prompted by the COVID-19 pandemic. As previously mentioned, VMT decreased in CY 2020 compared to prior years and is likely to remain lower than pre-pandemic levels in CY 2021. (Figures B-1 and B-2 in Appendix B provide annual values for fatalities and VMT.) To establish targets for the fatality measures, the Commonwealth
Figure 1
Number of Fatalities
Notes: Values reflect five-year rolling annual averages and have been rounded to the nearest integer. Draft 2018 and 2019 data in these averages are from July 2020.
MA = Massachusetts. MPO = Metropolitan Planning Organization.
Sources: National Highway Traffic Safety Administration Fatality Analysis and Reporting System, Massachusetts Department of Transportation, Boston Region MPO Staff.
Figure 2
Fatality Rate per 100 Million VMT
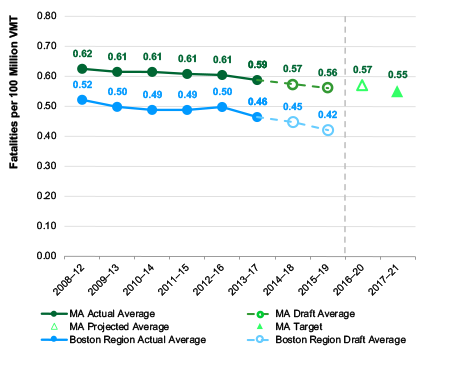
Notes: Values reflect five-year rolling annual averages and have been rounded to the hundredths decimal place. Draft 2018 and 2019 data in these averages are from July 2020. MassDOT plans to revisit 2018 VMT data for future target setting activities.
MA = Massachusetts. MPO = Metropolitan Planning Organization. VMT = Vehicle-Miles Traveled.
Sources: National Highway Traffic Safety Administration Fatality Analysis and Reporting System, Massachusetts Department of Transportation, Boston Region MPO Staff.
Figure 3 shows data, projections, and the CY 2021 target for the number of serious injuries, while Figure 4 shows data and targets pertaining to the serious injury rate per 100 million VMT. For Massachusetts as a whole and the Boston Region in particular, the average number of serious injuries and the average serious injury rate has decreased over time. The Commonwealth followed a process like the one used to set targets for the number of fatalities and the fatality rate per 100 million VMT, which involved setting lower targets compared to prior years while accounting for travel behavior changes in response to the COVID-19 pandemic. When developing its projections and targets, the Commonwealth assumed a five percent decrease in serious injuries from 2019 to 2020, and another five percent decrease from 2020 to 2021. Figures B-2 and B-3 in Appendix B provide annual values for VMT and serious injuries.
Figure 3
Number of Serious Injuries

Notes: Values reflect five-year rolling annual averages and have been rounded to the nearest integer. Draft 2018 and 2019 data in these averages are from July 2020.
MA = Massachusetts. MPO = Metropolitan Planning Organization. VMT = Vehicle-Miles Traveled.
Sources: Massachusetts Department of Transportation, Boston Region MPO Staff.
Figure 4
Serious Injury Rate per 100 Million VMT

Note: Values reflect five-year rolling annual averages and have been rounded to the hundredths decimal place. Draft 2018 and 2019 data in these averages are from July 2020. MassDOT plans to revisit 2018 VMT data for future target setting activities.
MA = Massachusetts. MPO = Metropolitan Planning Organization. VMT = Vehicle-Miles Traveled.
Sources: Massachusetts Department of Transportation, Boston Region MPO Staff.
Figure 5 shows data, projections, and the CY 2021 target for the number of nonmotorized fatalities and serious injuries. As shown in the figure, the average number of nonmotorized fatalities and serious injuries in the Commonwealth had increased in the years leading up to 2016 and has since declined. For CY 2021, the Commonwealth established a target by assuming that nonmotorized fatalities would decrease by two percent each year from CY 2019 to 2021, and that nonmotorized serious injuries would decrease by one percent each year from CY 2019 to 2021. While the resulting target value for CY 2021 (the 2017–21 rolling annual average) is not lower than the Commonwealth’s CY 2020 target for this measure, it is lower than the draft 2015–19 average and the projected 2016–20 average. As previously mentioned, counts of nonmotorized fatalities and serious injuries now reflect information related to people who skate and people who use wheelchairs and other mobility devices, which has affected data used to calculate targets. Figure B-4 in Appendix B shows annual values for combined nonmotorized fatalities and serious injuries while Figures B-5 and B-6 show annual values for nonmotorized fatalities and nonmotorized serious injuries, respectively.
Figure 5 shows recent decreases in the five-year rolling average of nonmotorized fatalities and serious injuries for both Massachusetts and the Boston Region. However, on average, the Boston region makes up a larger share of nonmotorized fatalities and serious injuries in Massachusetts than of overall fatalities or of overall serious injuries. This safety performance area in particular should be addressed through coordinated planning, investment, and strategy implementation between the Massachusetts Department of Transportation (MassDOT), the Boston Region MPO, the region’s municipalities, and other stakeholders.
Figure 5
Number of Nonmotorized Fatalities and Serious Injuries

Notes: Values reflect five-year rolling annual averages and have been rounded to the nearest integer. Draft 2018 and 2019 data in these averages are from July 2020.
MA = Massachusetts. MPO = Metropolitan Planning Organization.
Sources: National Highway Traffic Safety Administration Fatality Analysis and Reporting System, Massachusetts Department of Transportation, Boston Region MPO Staff.
MPO staff recommends that the Boston Region MPO vote to support the Commonwealth’s CY 2021 roadway safety performance targets. This option would satisfy federal requirements and would reflect the way the MPO will need to collaborate with the Commonwealth on safety strategies to reduce fatalities and injuries in the Boston region, which include education campaigns and driver behavior laws as well as infrastructure investment. Should the MPO select this target-setting approach, staff will present and describe these targets in the performance chapters of the federal fiscal years 2022–26 TIP document. FHWA will review the Commonwealth’s progress with respect to its targets once data are available and will notify the Commonwealth about whether it has met or made significant progress toward its safety performance targets. MPO staff expects that the FHWA will report on Massachusetts’ progress toward CY 2021 targets in CY 2023.
MassDOT and the MPO will continue to work together to examine how planning and programming at the Commonwealth and MPO levels can support improvements in roadway safety outcomes. To supplement these federally required targets, the MPO could explore and identify other measures or targets that it could incorporate into its planning process. For example, the MPO could monitor performance measures that focus on specific groups of roadway users, such as pedestrians. The MPO could also choose to set targets that would cover a time period longer than one year. MPO staff hopes the data presented here can serve as a springboard for future discussions in this area.
MS/ms
Appendix A: Federal Roadway Safety Performance Rules
Appendix B: Supplementary Roadway Safety Performance Charts
The Boston Region Metropolitan Planning Organization (MPO) operates its programs, services, and activities in compliance with federal nondiscrimination laws including Title VI of the Civil Rights Act of 1964 (Title VI), the Civil Rights Restoration Act of 1987, and related statutes and regulations. Title VI prohibits discrimination in federally assisted programs and requires that no person in the United States of America shall, on the grounds of race, color, or national origin (including limited English proficiency), be excluded from participation in, denied the benefits of, or be otherwise subjected to discrimination under any program or activity that receives federal assistance. Related federal nondiscrimination laws administered by the Federal Highway Administration, Federal Transit Administration, or both, prohibit discrimination on the basis of age, sex, and disability. The Boston Region MPO considers these protected populations in its Title VI Programs, consistent with federal interpretation and administration. In addition, the Boston Region MPO provides meaningful access to its programs, services, and activities to individuals with limited English proficiency, in compliance with U.S. Department of Transportation policy and guidance on federal Executive Order 13166. The Boston Region MPO also complies with the Massachusetts Public Accommodation Law, M.G.L. c 272 sections 92a, 98, 98a, which prohibits making any distinction, discrimination, or restriction in admission to, or treatment in a place of public accommodation based on race, color, religious creed, national origin, sex, sexual orientation, disability, or ancestry. Likewise, the Boston Region MPO complies with the Governor's Executive Order 526, section 4, which requires that all programs, activities, and services provided, performed, licensed, chartered, funded, regulated, or contracted for by the state shall be conducted without unlawful discrimination based on race, color, age, gender, ethnicity, sexual orientation, gender identity or expression, religion, creed, ancestry, national origin, disability, veteran's status (including Vietnam-era veterans), or background. A complaint form and additional information can be obtained by contacting the MPO or at http://www.bostonmpo.org/mpo_non_discrimination. To request this information in a different language or in an accessible format, please contact Title VI Specialist |
1 US Federal Highway Administration. “State Safety Performance Targets.” July 8, 2020. Accessed January 21, 2021, at https://safety.fhwa.dot.gov/hsip/spm/state_safety_targets/. US Federal Highway Administration. “What is TPM?” December 11, 2019. Accessed January 21, 2021, at https://www.fhwa.dot.gov/tpm/about/tpm.cfm.
2 Massachusetts Department of Transportation. “MassDOT Tracker 2020.” Accessed January 21, 2021, at https://www.massdottracker.com/wp/. Massachusetts Department of Transportation. Massachusetts Strategic Highway Safety Plan. Accessed January 21, 2021, at https://www.mass.gov/doc/massachusetts-shsp-2018/download, page i.
3 Federal Highway Safety Administration. “State Highway Safety Report – Massachusetts.” August 11, 2020. Accessed January 21, 2020, at https://www.fhwa.dot.gov/tpm/reporting/state/safety.cfm?state=Massachusetts.
4 As of April 15, 2019, states are required to define serious injuries using the definition of “Suspected Serious Injury (A),” as detailed in the Model Minimum Uniform Crash Criteria 4th Edition. Massachusetts Department of Transportation implemented this change in its statewide crash data system as of January 1, 2019.