Technical Memorandum
DATE: February 7, 2019
TO: Boston Region Metropolitan Planning Organization
FROM: Michelle Scott, MPO Staff
RE: Federally Required Calendar Year 2019 Roadway Safety Targets
The United States Department of Transportation (US DOT) requires states and MPOs to establish targets each year for federally required roadway safety performance measures, which pertain to fatalities and serious injuries from motor vehicle crashes. The Boston Region Metropolitan Planning Organization (MPO) voted to support the Commonwealth’s calendar year (CY) 2018 performance targets for these measures in February 2018. The Commonwealth has set its roadway safety targets for CY 2019, and the MPO is required to establish its CY 2019 targets by agreeing to support the Commonwealth’s targets or setting its own by February 27, 2019.
MPO staff recommends that the MPO vote to support the Commonwealth’s CY 2019 roadway safety performance targets for these federally required measures, and requests that the MPO take action to do so at its February 7, 2019, meeting. MPO staff also proposes that the MPO explore other roadway measures and targets for the MPO’s performance-based planning and programming (PBPP) process, which would supplement these federally required measures and targets.
A series of federal rules designed to focus the federal surface transportation program on achieving performance outcomes were initiated under the Moving Ahead for Progress in the 21st Century (MAP-21) legislation and continued under the Fixing America’s Surface Transportation (FAST) Act (see Attachment 2 for more details). The National Performance Management Measures: Highway Safety Improvement Program rule identifies five performance measures related to crashes involving motor vehicles for which targets must be set:
The US DOT requires states to establish and report targets for these measures for the next calendar year by August 31 each year. MPOs have 180 days—no later than February 27 of the applicable calendar year—to establish their own targets using one of the following methods:
In either case, the MPO will need to coordinate with the Commonwealth when setting targets. It will also need to incorporate goals, objectives, measures, and targets from the Commonwealth’s safety plans and processes into the MPO’s planning process.
The MPO will report on these roadway safety and other measures and targets in its Long-Range Transportation Plan (LRTP) and its Transportation Improvement Program (TIP).The LRTP will discuss progress made toward meeting these targets compared to past performance or baseline data. The TIP will provide, to the maximum extent practicable, a description of the anticipated effect of the TIP toward achieving performance targets identified in the LRTP.
Highway safety performance targets for CY 2019 will reflect a 2015–19 rolling annual average, as required by the Federal Highway Administration (FHWA). When setting targets, the Commonwealth considered the following:
Table 1 lists Massachusetts’ 2012–16 rolling average values for the fatality and serious injury performance measures, along with the Commonwealth’s CY 2018 safety targets (set in August 2017) and its CY 2019 targets (set in August 2018). The Commonwealth’s targets generally reflect a decrease compared to 2012–16 rolling annual averages, except for the nonmotorized fatalities and serious injuries target. The Commonwealth has set its CY 2019 target approximately equal to its 2018 target—which was set equal to the 2011–15 rolling annual average—and will work towards counteracting an increasing trend in this performance measure. Charts showing trend data for these five measures for Massachusetts and the Boston region are included at the conclusion of this memorandum.
Table 1
Massachusetts Roadway Safety Performance Trends and Targets
Highway Safety Performance |
2016 Safety |
2018 Safety Measure Target (Expected |
2019 Safety Measure Target (Expected |
Number of fatalities |
363.80 |
352.00 |
353.00 |
Rate of fatalities per 100 million vehicle-miles traveled |
0.61 |
0.61 |
0.58 |
Number of serious injuries* |
3,145.80 |
2,896.00 |
2801.00 |
Rate of serious injuries per 100 million vehicle-miles traveled* |
5.24 |
5.01 |
4.37 |
Number of nonmotorized fatalities and nonmotorized serious injuries |
540.80 |
540.80 |
541.00 |
* MassDOT defines serious injuries as incapacitating injuries, which are identified through incident reporting by police and vehicle operators using the Commonwealth of Massachusetts Motor Vehicle Crash Operator Report.
Note: All values have been rounded to the hundreths place.
MassDOT = Massachusetts Department of Transportation.
Sources: National Highway Traffic Safety Administration Fatality Analysis Reporting System, Massachusetts Crash Data System, Massachusetts Department of Transportation.
While the Commonwealth has set targets for these five measures to meet federal requirements, it also has a long-term goal to eliminate fatalities and serious injuries on Massachusetts roadways.1 The Commonwealth’s 2018 Strategic Highway Safety Plan identifies interim goals that the Commonwealth will work toward to advance its long-term goal. It also describes the planning, programming, and other strategies that the Commonwealth and partner entities can implement to improve safety outcomes.
FHWA will review the Commonwealth’s progress with respect to its targets once data are available and will notify the Commonwealth about whether it has met or made significant progress toward its CY 2019 safety performance targets. To make significant progress, a state must meet four out of the five roadway safety performance targets or have actual performance better than the baseline for those measures. Should a state not make significant progress, FHWA will limit its flexibility when spending federal transportation dollars in an effort to direct funding toward projects and initiatives that would improve roadway safety. FHWA will not review MPO progress on these performance measures directly, and the MPO will neither be penalized for not achieving roadway safety targets nor rewarded for attaining them. During quadrennial certification reviews, FHWA will examine how MPOs are implementing a PBPP process, and assess how MPOs are progressing toward their own targets or assisting the state in making progress toward its targets.
MPO staff recommends that the Boston Region MPO vote to support the Commonwealth’s CY 2019 highway safety performance targets. Should the MPO select this approach, staff will present and describe these targets in the performance chapters of the federal fiscal years (FFY) 2020–24 TIP document and Destination 2040, the MPO’s next LRTP. Going forward, MassDOT and the Boston Region MPO will continue to work together to examine how planning and programming at the Commonwealth and MPO levels can support improvements in roadway safety outcomes.
MPO staff recommends that the MPO explore and identify other measures or targets that it could incorporate into its planning process to supplement these federally required performance measures and targets. For example, the MPO could monitor performance measures that focus on specific groups of roadway users, such as pedestrians. The MPO could also choose to set targets that would cover a time horizon longer than one year. MPO staff would provide the MPO with information that staff gathered and analyzed when developing the draft Needs Assessment for Destination 2040 and through other activities, which the MPO can use when expanding its PBPP process.
MS/ms
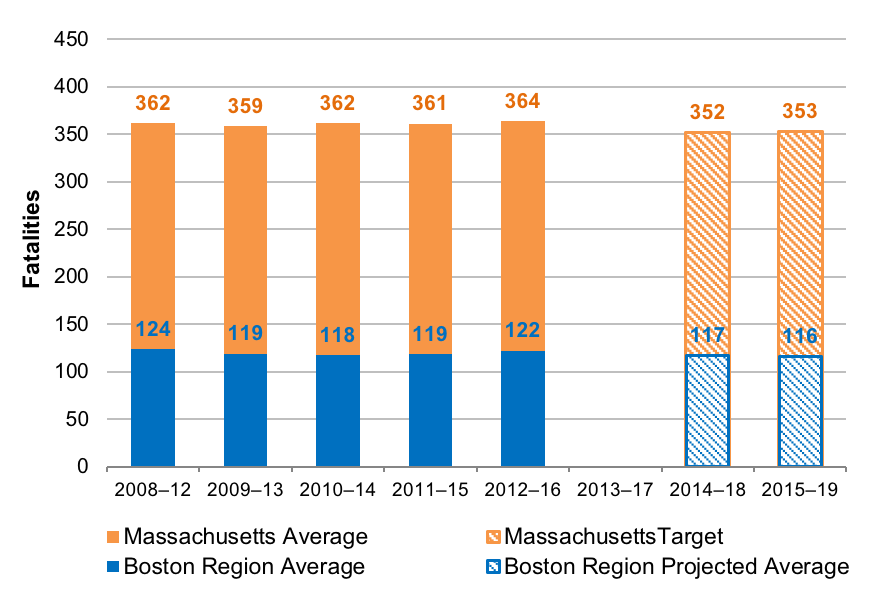
The five charts in this section illustrate roadway safety performance trends in Massachusetts, expressed in five-year rolling annual averages, along with the Commonwealth’s CY 2018 and 2019 targets. For context, MPO staff has included historic five-year rolling annual averages for the Boston Region for these performance measures. MPO staff has also included estimated 2014–18 and 2015–19 rolling annual averages for the Boston region for these performance measures. MPO staff used linear trend lines, historic data from 2008 to 2016, and draft estimates for 2017 to develop the Boston region projected averages shown in the charts below. More information is included in the notes below each figure.
Figure 1
Number of Fatalities
Notes: Values reflect five-year rolling annual averages and have been rounded to the nearest integer. MPO staff developed projections for the Boston region using a linear trend line and a draft estimate of 103 fatalities for CY 2017.
CY = Calendar Year. MPO = Metropolitan Planning Organization.
Sources: National Highway Traffic Safety Administration Fatality Analysis and Reporting System, Massachusetts Department of Transportation, Boston Region MPO staff.
Figure 2
Fatality Rate per 100 Million VMT
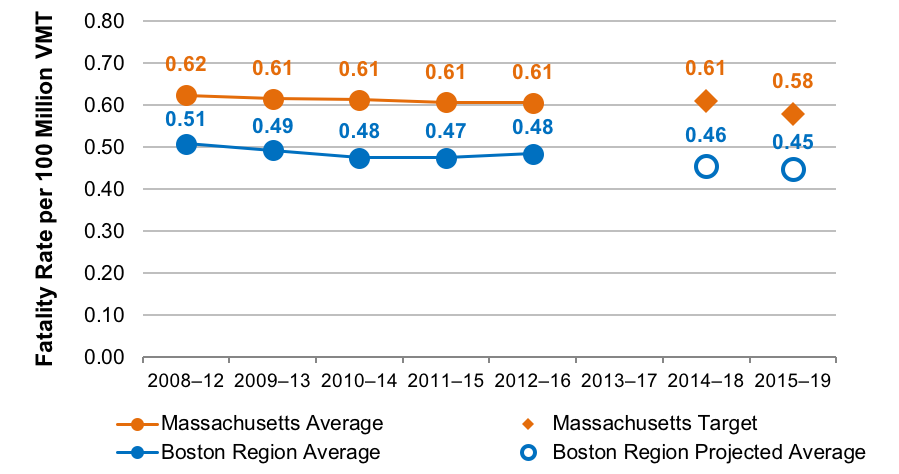
Notes: Values reflect five-year rolling annual averages and have been rounded to the hundreths decimal place. MPO staff developed projections for the Boston region using a linear trend line, a draft estimate of 103 fatalities for CY 2017, and an estimate of CY 2017 VMT from MassDOT (approximately 25.5 billion VMT).
CY = Calendar Year. MassDOT = Massachusetts Department of Transportation. VMT = Vehicle-Miles Traveled.
Sources: National Highway Traffic Safety Administration Fatality Analysis and Reporting System, Massachusetts Department of Transportation, Boston Region MPO staff.
Figure 3
Number of Serious Injuries
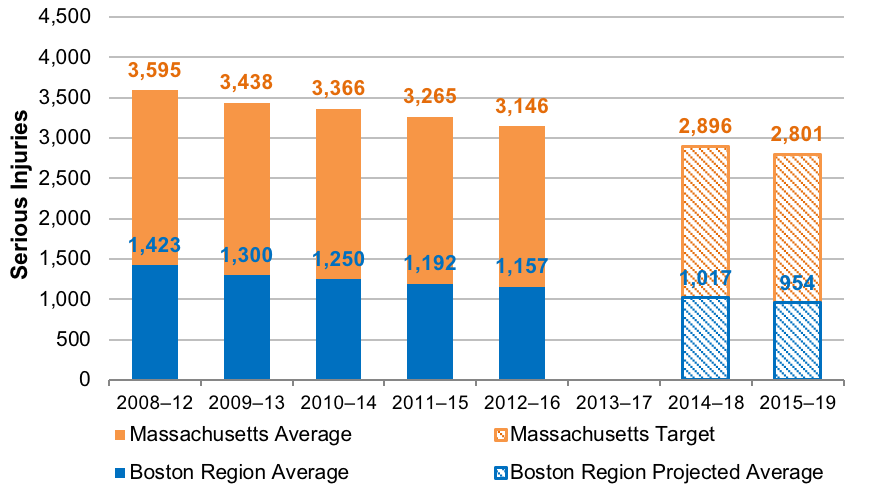
Notes: Values reflect five-year rolling annual averages and have been rounded to the nearest integer. MPO staff developed projections for the Boston region using a linear trend line and a draft estimate of 938 serious injuries for CY 2017.
CY = Calendar Year. MPO = Metropolitan Planning Organization.
Sources: Massachusetts Crash Data System, Massachusetts Department of Transportation, Boston Region MPO staff.
Figure 4
Serious Injury Rate per 100 Million VMT
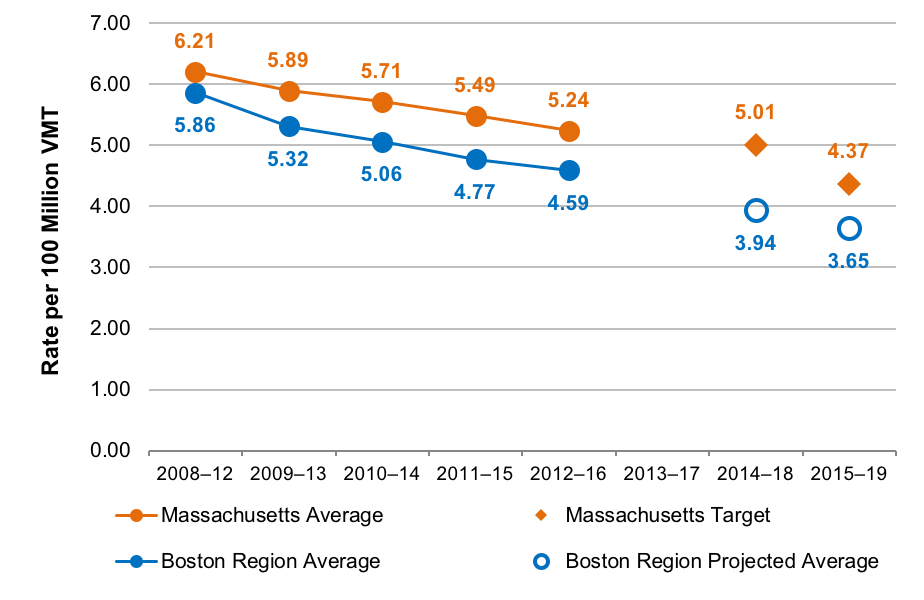
Notes: Values reflect five-year rolling annual averages and have been rounded to the hundreths decimal place. MPO staff developed projections for the Boston region using a linear trend line, a draft estimate of 938 serious injuries for CY 2017, and an estimate of CY 2017 VMT from MassDOT (approximately 25.5 billion VMT).
CY = Calendar Year. MassDOT = Massachusetts Department of Transportation. MPO = Metropolitan Planning Organization. VMT = Vehicle-Miles Traveled.
Sources: Massachusetts Crash Data System, Massachusetts Department of Transportation, Boston Region MPO staff.
Figure 5
Number of Nonmotorized Fatalities and Serious Injuries
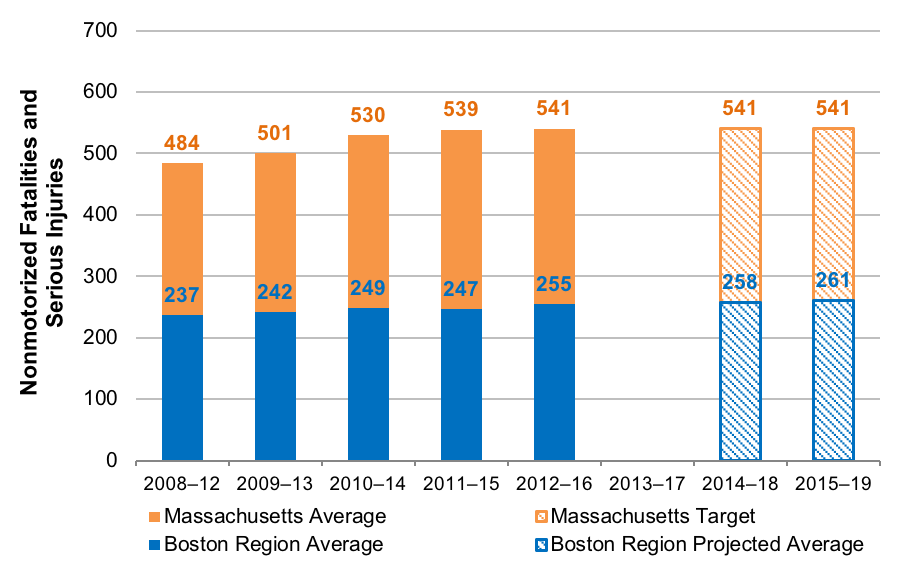
Notes: Values reflect five-year rolling annual averages and have been rounded to the tenth decimal place. MPO staff developed projections for the Boston region using a linear trend line, a draft estimate of 32 nonmotorized fatalities for CY 2017, and a draft estimate of 220 nonmotorized serious injuries for CY 2017.
CY = Calendar Year. MPO = Metropolitan Planning Organization.
Sources: National Highway Traffic Safety Administration Fatality Analysis and Reporting System, Massachusetts Crash Data System, Massachusetts Department of Transportation, Boston Region MPO staff.
Several federal rules pertain to PBPP for highway safety and inform this aspect of the MPO’s PBPP process:
1 Commonwealth of Massachusetts. Massachusetts 2018 Strategic Highway Safety Plan, 2019, p. 5.