Federal Fiscal Years 2021-25
Boston Region MPO
Prepared by
The Central Transportation Planning Staff:
Staff to the Boston Region Metropolitan Planning Organization
Directed by the Boston Region Metropolitan Planning Organization,
which is composed of the
Massachusetts Department of Transportation
Metropolitan Area Planning Council
Massachusetts Bay Transportation Authority
MBTA Advisory Board
Massachusetts Port Authority
Regional Transportation Advisory Council
City of Boston
City of Beverly
City of Everett
City of Framingham
City of Newton
City of Somerville
City of Woburn
Town of Arlington
Town of Acton
Town of Rockland
Town of Lexington
Town of Medway
Town of Norwood
Federal Highway Administration (nonvoting)
Federal Transit Administration (nonvoting)
Prepared by
The Central Transportation Planning Staff:
Staff to the Boston Region Metropolitan Planning Organization
The Boston Region Metropolitan Planning Organization (MPO) operates its programs, services, and activities in compliance with federal nondiscrimination laws including Title VI of the Civil Rights Act of 1964 (Title VI), the Civil Rights Restoration Act of 1987, and related statutes and regulations. Title VI prohibits discrimination in federally assisted programs and requires that no person in the United States of America shall, on the grounds of race, color, or national origin (including limited English proficiency), be excluded from participation in, denied the benefits of, or be otherwise subjected to discrimination under any program or activity that receives federal assistance. Related federal nondiscrimination laws administered by the Federal Highway Administration, Federal Transit Administration, or both, prohibit discrimination on the basis of age, sex, and disability. The Boston Region MPO considers these protected populations in its Title VI Programs, consistent with federal interpretation and administration. In addition, the Boston Region MPO provides meaningful access to its programs, services, and activities to individuals with limited English proficiency, in compliance with U.S. Department of Transportation policy and guidance on federal Executive Order 13166.
The Boston Region MPO also complies with the Massachusetts Public Accommodation Law, M.G.L. c 272 section 92a, 98, 98a, which prohibits making any distinction, discrimination, or restriction in admission to, or treatment in a place of public accommodation based on race, color, religious creed, national origin, sex, sexual orientation, disability, or ancestry. Likewise, the Boston Region MPO complies with the Governor's Executive Order 526, section 4, which requires that all programs, activities, and services provided, performed, licensed, chartered, funded, regulated, or contracted for by the state shall be conducted without unlawful discrimination based on race, color, age, gender, ethnicity, sexual orientation, gender identity or expression, religion, creed, ancestry, national origin, disability, veteran's status (including Vietnam-era veterans), or background.
A complaint form and additional information can be obtained by contacting the MPO or at www.bostonmpo.org/mpo_non_discrimination. To request this information in a different language or in an accessible format, please contact
Title VI Specialist
Boston Region MPO
10 Park Plaza, Suite 2150
Boston, MA 02116
civilrights@ctps.org
857.702.3700 (voice)
617.570.9193 (TTY)
Abbreviation |
Term |
3C AAB AC |
continuous, comprehensive, cooperative [metropolitan transportation planning process] Architectural Access Board advance construction |
A&F |
Administration and Finance Committee |
AADT |
average annual daily traffic |
ACS |
American Community Survey [US Census Bureau data] |
ADA |
Americans with Disabilities Act of 1990 |
AFC ALI |
automated fare collection activity line item |
BRT |
bus rapid transit |
BTD |
Boston Transportation Department |
CA/T |
Central Artery/Tunnel [project also known as “the Big Dig”]
|
CAA |
Clean Air Act |
CAAA |
Clean Air Act Amendments |
CATA |
Cape Ann Transportation Authority |
CECP |
Massachusetts Clean Energy and Climate Plan |
CFR |
Code of Federal Regulations |
CIP |
Capital Investment Plan [MassDOT] |
CMAQ |
Congestion Mitigation and Air Quality [federal funding program] |
CMR |
Code of Massachusetts Regulations |
CMP CNG |
Congestion Management Process compressed natural gas |
CO |
carbon monoxide |
CO2 |
carbon dioxide |
CTPS |
Central Transportation Planning Staff |
CY |
calendar year |
DCR |
Department of Conservation and Recreation |
DEIR |
draft environmental impact report |
DEP |
Department of Environmental Protection [Massachusetts] |
DOT |
department of transportation |
EDTTT |
excessive delay threshold travel time |
EJ |
environmental justice |
ENF |
environmental notification form |
EO |
executive order |
EOEEA |
Massachusetts Executive Office of Energy and Environmental Affairs |
EOHED |
Massachusetts Executive Office of Housing and Economic Development |
EPA |
Environmental Protection Agency [federal] |
EPDO |
equivalent property damage only [a traffic-related index] |
FARS |
Fatality Analysis and Reporting System [FHWA] |
FAST Act |
Fixing America’s Surface Transportation Act |
FDR |
functional design report |
FEIR |
final environmental impact report |
FFGA |
full funding grant agreement |
FFY |
federal fiscal year |
FHWA |
Federal Highway Administration |
FMCB |
MBTA Fiscal and Management Control Board |
FR |
Federal Register |
FTA |
Federal Transit Administration |
GANS |
grant anticipation notes [municipal bond financing] |
GHG GLX |
greenhouse gas Green Line Extension |
GWSA |
Global Warming Solutions Act of 2008 [Massachusetts] |
HOV |
high-occupancy vehicle |
HSIP |
Highway Safety Improvement Program [federal funding program] |
ICC |
Inner Core Committee [MAPC municipal subregion] |
IRI |
International Roughness Index |
ITS |
intelligent transportation systems |
LED |
light-emitting diode |
LEP |
limited English proficiency |
LOTTR |
level of travel time ratio |
LRTP |
Long-Range Transportation Plan [MPO certification document] |
MAGIC |
Minuteman Advisory Group on Interlocal Coordination [MAPC municipal subregion] |
MAP-21 |
Moving Ahead for Progress in the 21st Century Act |
MAPC |
Metropolitan Area Planning Council |
MARPA |
Massachusetts Association of Regional Planning Agencies |
MassDOT |
Massachusetts Department of Transportation |
Massport |
Massachusetts Port Authority |
MBTA |
Massachusetts Bay Transportation Authority |
MCCA |
Massachusetts Convention Center Authority |
MEPA |
Massachusetts Environmental Policy Act |
MGL |
Massachusetts General Laws |
MOVES |
Motor Vehicle Emissions Simulator [EPA air quality model] |
MPO |
metropolitan planning organization [Boston Region MPO] |
MOU |
memorandum of understanding |
MWRC |
MetroWest Regional Collaborative [MAPC municipal subregion] |
MWRTA |
MetroWest Regional Transit Authority |
NAAQS NFA NFP |
National Ambient Air Quality Standards non-federal aid National Freight Program |
NH DOT |
New Hampshire Department of Transportation |
NHFP |
National Highway Freight Program |
NHPP |
National Highway Performance Program |
NHS |
National Highway System |
NHTSA |
National Highway Traffic Safety Administration |
NMCOG |
Northern Middlesex Council of Governments |
NOx |
nitrogen oxides |
NPMRDS |
National Performance Measure Research Data Set [FHWA] |
NSPC |
North Suburban Planning Council [MAPC municipal subregion] |
NSTF |
North Shore Task Force [MAPC municipal subregion] |
NTD |
National Transit Database |
OTP |
MassDOT Office of Transportation Planning |
PBPP |
performance-based planning and programming |
PHED |
peak hours of excessive delay |
PfP |
Planning for Performance |
PL |
metropolitan planning funds [FHWA] or public law funds |
PMT |
Program for Mass Transportation [MBTA] |
ppm |
parts per million |
PRC |
Project Review Committee [MassDOT] |
PSAC |
Project Selection Advisory Council [MassDOT] |
PSI |
Pavement Serviceability Index |
PTASP |
Public Transportation Agency Safety Plan |
RMV RSA |
Registry of Motor Vehicles [MassDOT division] road safety audit |
RTA |
regional transit authority |
RTAC |
Regional Transportation Advisory Council [of the Boston Region MPO] |
SAFETEA-LU |
Safe, Accountable, Flexible, Efficient Transportation Equity Act: A Legacy for Users |
SEIR |
Single Environmental Impact Report [MEPA] |
SFY |
state fiscal year |
SHSP |
Strategic Highway Safety Plan |
SIP |
State Implementation Plan |
SOV |
single-occupant vehicle |
SPR |
Statewide Planning and Research |
SRTS |
Safe Routes to School [federal program] |
SSC |
South Shore Coalition [MAPC municipal subregion] |
STBGP |
Surface Transportation Block Grant Program [federal funding program; replaced STP] |
STIP |
State Transportation Improvement Program |
STP |
Surface Transportation Program [federal funding program; replaced by STBGP] |
SWAP |
South West Advisory Planning Committee [MAPC municipal subregion] |
TAM |
Transit Asset Management Plan |
TAMP |
Transportation Asset Management Plan |
TAP |
Transportation Alternatives Program [federal funding program] |
TCM |
transportation control measure |
TE |
transportation equity |
TERM TFPC |
Transit Economic Requirements Model [FTA] total federal participating cost |
TIP |
Transportation Improvement Program [MPO certification document] |
TRIC |
Three Rivers Interlocal Council [MAPC municipal subregion] |
TTI |
travel time index |
TTTR |
Truck Travel Time Reliability Index |
ULB |
Useful Life Benchmark |
UPWP |
Unified Planning Work Program [MPO certification document] |
USC |
United States Code |
USDOT |
United States Department of Transportation [oversees FHWA and FTA] |
UZA |
urbanized area |
VMT |
vehicle-miles traveled |
VOCs |
volatile organic compounds [pollutants] |
VRM |
vehicle revenue-miles |
Executive Summary
Chapter 1: 3C Transportation Planning and the Boston Region MPO
Chapter 2: The TIP Process
Chapter 3: Highway and Transit Programming
Chapter 4: Performance Analysis
Chapter 5: Determination of Air Quality Conformity
Chapter 6: Transportation Equity Performance
The Boston Region Metropolitan Planning Organization’s (MPO) five-year transportation capital investment plan, the federal fiscal years (FFYs) 2021–25 Transportation Improvement Program (TIP), is the near-term investment program for the region’s transportation system. Guided by the Boston Region MPO’s vision, goals, and objectives, the TIP prioritizes investments that preserve the current transportation system in a state of good repair, provide safe transportation for all modes, enhance livability, promote equity and sustainability, and improve mobility throughout the region. These investments fund major highway reconstruction, arterial roadway and intersection improvements, maintenance and expansion of the public transit system, bicycle path construction, and infrastructure improvements for pedestrians.
The Boston Region MPO is guided by a 22-member board with representatives of state agencies, regional organizations, and municipalities; its jurisdiction extends roughly from Boston north to Ipswich, south to Marshfield, and west to municipalities along Interstate 495. Each year, the MPO conducts a process to decide how to spend federal transportation funds for capital projects. The Central Transportation Planning Staff (CTPS), which is the staff to the MPO, manages the TIP development process.
MPO staff coordinates the evaluation of project funding requests, proposes programming of current and new projects based on anticipated funding levels, supports the MPO board in developing a draft TIP document, and facilitates a public review of the draft before the MPO board endorses the final document.
The complete TIP program is available in Chapter 3 of this document and online at www.ctps.org/tip. The TIP tables provide details on how funding is allocated to each programmed project and capital investment program. These tables are organized by FFY, and are grouped by highway and transit programs.
The Highway Program of the TIP funds the priority transportation projects advanced by the Massachusetts Department of Transportation (MassDOT) and the cities and towns within the Boston region. The program is devoted primarily to preserving and modernizing the existing roadway network by reconstructing arterial roadways, resurfacing highways, and replacing bridges.
In Massachusetts, Federal-Aid Highway Program funding is apportioned by MassDOT, which allocates funding to Grant Anticipation Notes (GANs) payments, various statewide programs, and Regional Targets for the state’s MPOs. In the FFYs 2021–25 TIP, roadway, bridge, and bicycle and pedestrian programs account for more than $1.3 billion in funding to the Boston region. The Regional Target funding provided to the MPOs may be programmed for projects at the discretion of each MPO, whereas MassDOT has discretion to propose its recommended projects for statewide programs, such as those related to bridge repairs and interstate highway maintenance.
The Transit Program of the TIP provides funding for projects and programs that address the capital needs prioritized by the three transit authorities in the region: the Massachusetts Bay Transportation Authority (MBTA), the Cape Ann Transportation Authority (CATA), and the MetroWest Regional Transit Authority (MWRTA). The Transit Program is predominantly dedicated to achieving and maintaining a state of good repair for all assets throughout the transit system. The FFYs 2021–25 TIP includes $3.1 billion in transit investments by the transit authorities that will support state of good repair, modernize transit systems, and increase access to transit. The Green Line Extension project is a major project programmed in this TIP that will expand transit service. Additionally, beginning in FFY 2025, the MPO is allocating five percent of its annual Regional Target funds to its new Transit Modernization investment program. This program aims to build on the investments made through the Transit Program by using a portion of Highway Program funding to fulfill unmet transit project needs in the region.
During FFYs 2021–25, the Boston Region MPO plans to fund 47 projects with its Regional Target funding. In total, eight new projects were added to the MPO’s Regional Target program during this TIP cycle. These projects include:
Other investment decisions made this year include the allocation of significant new funding in FFY 2025 to the Reconstruction of Rutherford Avenue in Boston. FFY 2025 is the fourth year of a five-year funding commitment made by the MPO to this project, which is expected to be completed in FFY 2026. The MPO also set aside continued funding for its Community Connections Program (in FFYs 2022–25) and began allocating funding to its Transit Modernization Program (in FFY 2025) for the first time during this TIP cycle. The funding set aside through both of these programs will be allocated to specific projects during future TIP programming cycles.
During the development of the FFYs 2021–25 TIP, the MPO was very limited in its financial capacity to fund new projects. In addition to the inherently constrained nature of transportation infrastructure funding, the need for which greatly exceeds available resources in any given year, significant cost increases for many projects already programmed in FFYs 2020–24 consumed funding for prospective new projects in FFY 2025. Although this challenge inevitably arises during every TIP cycle, this year saw an especially severe level of cost increases, with additional money needed for already programmed projects comprising 14 percent of the Boston Region MPO’s five-year funding capacity. This dynamic drove decision-making during this fiscal year and led to a relatively low number of new projects being selected for programming in FFY 2025.
Figure ES-1 shows how the Regional Target funding for FFYs 2021–25 is distributed across the MPO’s investment programs. As the chart shows, the Boston Region MPO’s Regional Target Program is devoted primarily to enhancing mobility and safety for all travel modes through significant investments in Complete Streets projects. A large portion of the MPO’s funding also supports the modernization of key regional roadways and expansion of transit infrastructure through investments in Major Infrastructure projects.
Figure ES-1
FFYs 2021–25 TIP Regional Target Funding by MPO Investment Program
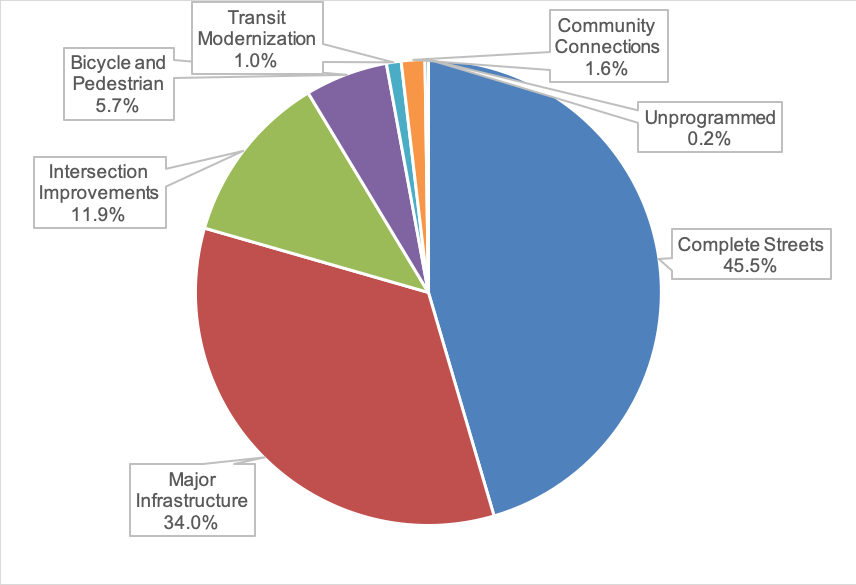
Source: Boston Region MPO.
In addition to the distribution of funding across the MPO’s investment programs listed above, Table ES-1 details the number of projects and the allocation of funds across each program in the FFYs 2021–25 TIP. As noted in the table, the MPO has programmed more than 99.7 percent of its available funding over five years, leaving just $1,257,656 to be programmed in future TIP cycles. More details about every project funded through the MPO’s Regional Target program are available in Chapter 3.
Table ES-1
FFYs 2021–25 Boston Region MPO Regional Target Investment Summary
MPO Investment Program |
Number of Projects |
Regional Target Dollars Programmed |
Bicycle Network and Pedestrian Connections |
4 |
$30,905,263 |
Community Connections (Allocated to Projects) |
5 |
$822,000 |
Community Connections (Not Yet Allocated to Projects) |
N/A |
$8,000,000 |
Complete Streetsa |
23 |
$244,774,339 |
Intersection Improvements |
11 |
$64,157,136 |
Major Infrastructure—Flex to Transitb |
1 |
$27,096,238 |
Major Infrastructure—Roadwayc |
3 |
$156,036,944 |
Transit Modernization (Not Yet Allocated to Projects) |
N/A |
$5,500,000 |
Unprogrammed |
N/A |
$1,257,656 |
Total |
47 |
$538,549,576 |
Note: Funding amounts in this table include both federal and non-federal funds, including matching funds.
a Project 606501, Reconstruction of Union Street (Route 139) in Holbrook, is also supported by $1,527,250 in earmark funds, which are not shown in this table.
b The MPO will flex federal highway improvement dollars to support the Green Line Extension.
c In FFYs 2021 and 2022, the MPO will contribute $22,115,687 to Project 606476—Summer Tunnel Improvements, with other funds contributed by MassDOT. This project is included in the total number of projects in this category.
Source: Boston Region MPO.
In making decisions about which projects to fund, the MPO considers not only the relative distribution of funds across projects and investment programs, but also how the allocation of funds to each investment program compares to the funding goals outlined in the MPO’s Long-Range Transportation Plan (LRTP), Destination 2040. The investment program sizes set forth in the LRTP reflect the types of projects the MPO seeks to fund to achieve its goals and objectives for the region, from enhancing safety for all users to promoting mobility and accessibility across the region. More information on the MPO’s goals and objectives are available in Chapter 1, and a comparison between LRTP investment program sizes and program funding levels in the FFYs 2021–25 TIP is shown in Figure ES-2 below.
Figure ES-2
FFYs 2021-25 TIP: Regional Target Funding Levels Relative to LRTP Goals, by MPO Investment Program
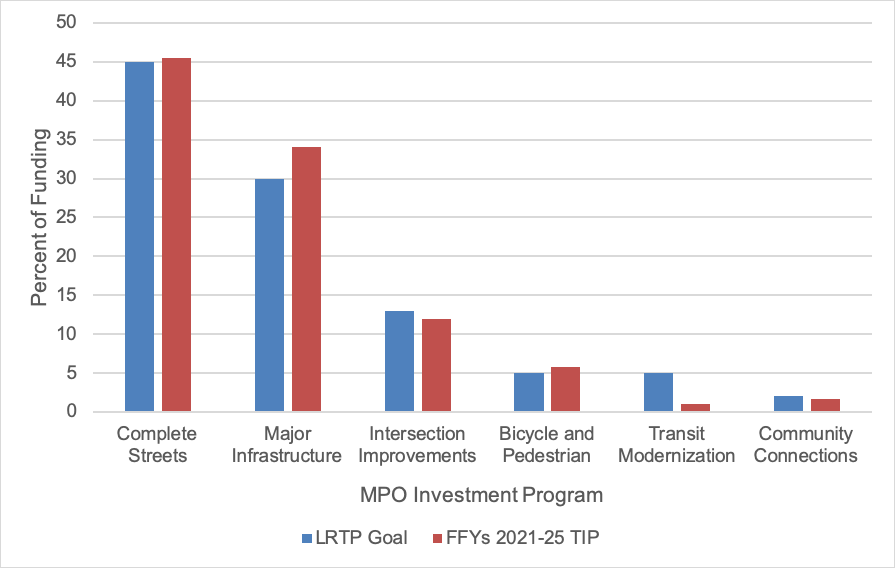
Source: Boston Region MPO.
The investments made in the FFYs 2021–25 TIP will be implemented in 38 cities and towns throughout the MPO region, ranging from dense inner core communities to developing suburbs further from the urban center. Figure ES-3 illustrates the distribution of Regional Target funding across the eight subregions within the Boston Region MPO’s jurisdiction, as defined by the Metropolitan Area Planning Council (MAPC). This figure also includes information on how the distribution of funds compares to key metrics for measuring the need for funding by subregion, including the percent of regional population, employment, and Federal-Aid roadway miles within each subregion.
Figure ES-3
FFYs 2021–25 TIP: Regional Target Funding Levels Relative to Key Indicators, by MAPC Subregion
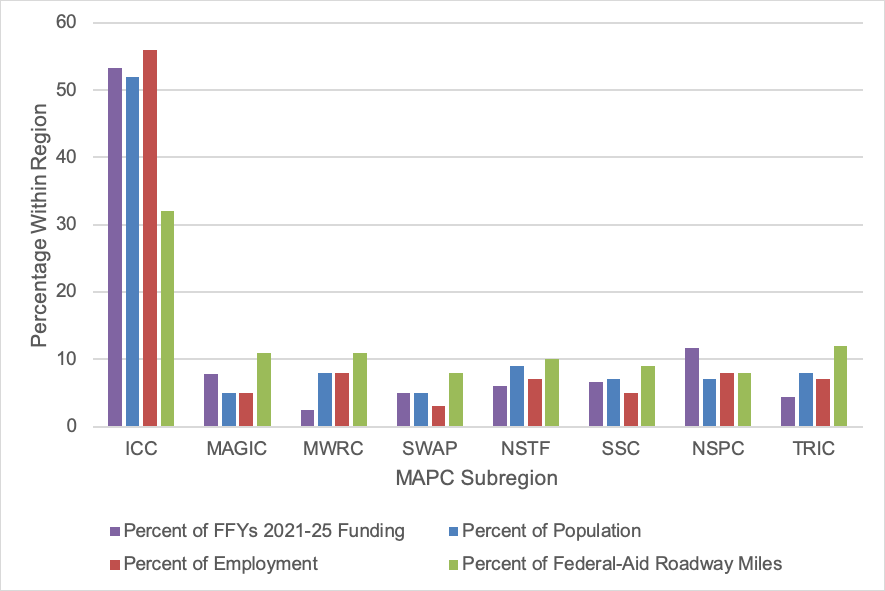
Source: Boston Region MPO.
Additional information on the geographic distribution of Regional Target funding across the region, including a breakdown of historical funding by municipality, is included in Appendix D.
The TIP Highway Program was developed with the assumption that federal funding for the state would range between $671 million and $725 million annually over the next five years. These amounts include the funds that would be set aside initially by MassDOT as payments for the Accelerated Bridge Program, and exclude required matching funds.
The process of deciding how to use this federal funding in the Boston region follows several steps. First, MassDOT reserves funding for GANs debt service payments for the Accelerated Bridge Program; annual GANs payments range between $82 million and $122 million annually over the five years of this TIP.
The remaining Federal-Aid Highway Program funds are budgeted to support state and regional (i.e., MPO) priorities. In this planning cycle, $728 million to $763 million annually was available for programming statewide, including both federal dollars and the local match. MassDOT customarily provides the local match (which can also be provided by other entities); thus, projects are typically funded with 80 percent federal dollars and 20 percent state dollars, depending on the funding program.
Next, MassDOT allocates funding across the following funding categories:
Finally, once these needs have been satisfied, MassDOT allocates the remaining funding among the state’s 13 MPOs for programming. This discretionary funding for MPOs is suballocated by formula to determine the Regional Target amounts. The Boston Region MPO receives the largest portion of MPO funding in the state, with approximately 43 percent of Massachusetts’ Regional Target funds allocated to the region. MassDOT develops these targets in consultation with the Massachusetts Association of Regional Planning Agencies (or MARPA). This TIP was programmed with the assumption that the Boston Region MPO will have between $105 million and $110 million annually for Regional Target amounts, which consist of federal funding and state funding for the local match.
Each MPO may decide how to prioritize its Regional Target funding. Given that the Regional Target funding is a subset of the Highway Program, the MPO typically programs the majority of funding for roadway projects; however, the MPO has flexed portions of its highway funding to the Transit Program for both transit expansion and transit modernization projects. The TIP Highway Program details the projects that will receive Regional Target funding from the Boston Region MPO and statewide infrastructure projects within the Boston region. Details on these investments are outlined in Chapter 3.
The Federal Transit Administration (FTA) allocates the funds programmed in the TIP Transit Program according to formula. The three regional transit authorities in the Boston Region MPO area that are recipients of these funds are the MBTA, CATA, and MWRTA. The MBTA, with its extensive transit program and infrastructure, receives the majority of federal transit funds in the region.
Under the federal transportation legislation, Fixing America’s Surface Transportation (or FAST) Act, funding is allocated by the following categories:
When determining which projects to fund through the Regional Target funding process, MPO members collaborate with municipalities, state agencies, members of the public, advocacy groups, and other stakeholders. The MPO board uses evaluation criteria in its project selection process to help identify and prioritize projects that advance progress on the MPO’s six goal areas, which are:
Additionally, the MPO has established investment programs that are designed to direct Regional Target funding towards MPO priority areas over the next 20 years to help meet these goals. The investment programs are as follows:
Projects that the MPO selects to receive Regional Target funding through the TIP development process are included in one of the six investment programs listed above.
In recent years, the MPO has been incorporating performance-based planning and programming (PBPP) practices into its TIP development and other processes. These practices are designed to help direct MPO funds towards achieving specific outcomes for the transportation system. The MPO’s goals and investment programs are key components of its PBPP framework. In FFY 2018, the MPO began to set targets for specific performance measures. Over time, the MPO will more closely link its performance targets, investment decisions, and monitoring and evaluation activities.
The outreach process begins early in the FFY when cities and towns designate TIP contacts and begin developing a list of priority projects to be considered for federal funding, and the MPO staff reaches out to the cities and towns in the region to identify their priority projects. MPO staff compiles the project funding requests into a Universe of Unprogrammed Projects, a list of all Bicycle Network and Pedestrian Connections, Complete Streets, Intersection Improvements, and Major Infrastructure projects identified as potential candidates to receive funding through the TIP. This year, a second Universe was compiled containing all of the projects under consideration for funding through the pilot round of the MPO’s Community Connections Program. These lists include projects at varying levels of readiness, from those with significant engineering and design work complete to those still early in the conceptual or planning stage. MPO staff also collects data on each project in both Universes so that the projects may be evaluated.
MPO staff evaluates projects based on how well they address the MPO’s goals. In order for MPO staff to conduct a complete project evaluation, Bicycle Network and Pedestrian Connections, Complete Streets, Intersection Improvements, and Major Infrastructure projects must have a functional design report or its plans must include the level of detail defined in a functional design report, a threshold typically reached when a project nears the 25 percent design stage. To complete an evaluation for projects under consideration through the MPO’s Community Connections Program, project proponents must submit a completed application to MPO staff. The evaluation results for all projects are presented to the MPO board for their consideration for programming in the TIP. These scores are also posted on the MPO’s website where project proponents, municipal officials, and members of the public may review them and provide feedback.
An important step toward TIP programming takes place midway through the TIP development cycle at a meeting—referred to as TIP Readiness Day—that both MassDOT and MPO staff attend. At this meeting, MassDOT project managers provide updates about cost and schedule changes related to currently programmed projects. As MPO staff helps the MPO board consider updates to the already programmed years of the TIP, these cost and schedule changes must be taken into account, as well as the addition of new projects in the outermost year of the TIP.
Using the evaluation results and information about project readiness (that is, the extent to which a project is fully designed and ready for construction), MPO staff prepares a recommendation or a series of programming scenarios for how to program the Regional Target funding in the TIP. Other considerations, such as whether a project was included in the LRTP, addresses an identified transportation need, or promotes distribution of transportation investments across the region, are also incorporated into these programming scenarios. The staff recommendation is always financially constrained—meaning, subject to available funding. There was approximately $538 million of Regional Target funding available to the Boston Region MPO for FFYs 2021–25. In this TIP cycle, the MPO discussed several scenarios for the Regional Target Program for highway projects and selected a preferred program in March 2020.
In addition to prioritizing the Regional Target funding, the MPO also reviews and endorses the statewide highway program that MassDOT recommends for programming. The MPO also reviews and endorses the programming of funds for the MBTA’s, CATA’s, and MWRTA’s transit capital programs.
After selecting a preferred programming scenario, usually in late March, the MPO votes to release the draft TIP for a 21-day public review period. The comment period typically begins in late April or early May. During this time, the MPO invites members of the public, municipal officials, and other stakeholders in the Boston region to review the proposed program and submit feedback. During the public review period, MPO staff hosts public meetings to discuss the draft TIP document and elicit additional comments.
After the public review period ends, the MPO reviews all municipal and public comments and may change elements of the document or its programming. The MPO then endorses the TIP and submits it to the Federal Highway Administration (FHWA) and the FTA for approval. MassDOT incorporates the MPO-endorsed TIP into the State Transportation Improvement Program (STIP). The FHWA, FTA, and United States Environmental Protection Agency (EPA) review the STIP for certification by September 30, the close of the FFY.
Even after the TIP has been finalized, administrative modifications, amendments, and adjustments often must be introduced because of changes in project schedule, project cost, funding sources, or available revenues. This may necessitate reprogramming a project in a different funding year or programming additional funds for a project.
Notices of administrative modifications and amendments are posted on the MPO’s website. If an amendment is necessary, the MPO notifies affected municipalities, other stakeholders, and members of the public via email. The MPO typically holds a 21-day public review period before taking final action on an amendment. In extraordinary circumstances, the MPO may vote to shorten the public comment period to a minimum of 15 days. Administrative modifications and adjustments are minor and usually do not warrant a public review period.
Public input is an important aspect of the transportation planning process. Please visit www.bostonmpo.org for more information about the MPO, to view the entire TIP, and to submit your comments. You also may wish to sign up for email news updates and notices by visiting www.ctps.org/subscribe and submitting your contact information. To request a copy of the TIP in accessible formats, please contact the MPO staff by any of the following means:
Mail: Boston Region MPO c/o CTPS Certification Activities Group
10 Park Plaza, Suite 2150 Boston, MA 02116-3968
Telephone: 857.702.3700
TTY: 617.973.7089
Fax: 617.570.9192
Email: publicinfo@ctps.org
Decisions made on how to allocate transportation funds in a metropolitan area are guided by information and ideas gathered from a broad group of people, including elected officials, municipal planners and engineers, transportation advocates, and interested residents. Metropolitan planning organizations (MPOs) are the bodies responsible for providing a forum for this decision-making process. Each metropolitan area in the United States with a population of 50,000 or more, also known as an urbanized area, is required by federal legislation to establish an MPO, which decides how to spend federal transportation funds for capital projects and planning studies for the area.
The federal government regulates the funding, planning, and operation of the surface transportation system through the federal transportation program, which was enacted into law through Titles 23 and 49 of the United States Code. Section 134 of Title 23 of the Federal Aid Highway Act of 1956 and Section 5303 of the Federal Transit Act, as amended, require that urbanized areas conduct a transportation planning process, resulting in plans and programs consistent with the planning objectives of the metropolitan area, in order to be eligible for federal funds.
The most recent reauthorization of the surface transportation law is the Fixing America’s Surface Transportation (FAST) Act. The FAST Act sets policies related to metropolitan transportation planning. The law requires that all MPOs carry out a continuing, comprehensive, and cooperative (3C) transportation planning process.
The Boston Region MPO is responsible for carrying out the 3C planning process in the Boston region, and has established the following objectives for the process:
More information about the federal, state, and regional guidance governing the transportation planning process, and about the regulatory framework in which the MPO operates can be found in Appendix F.
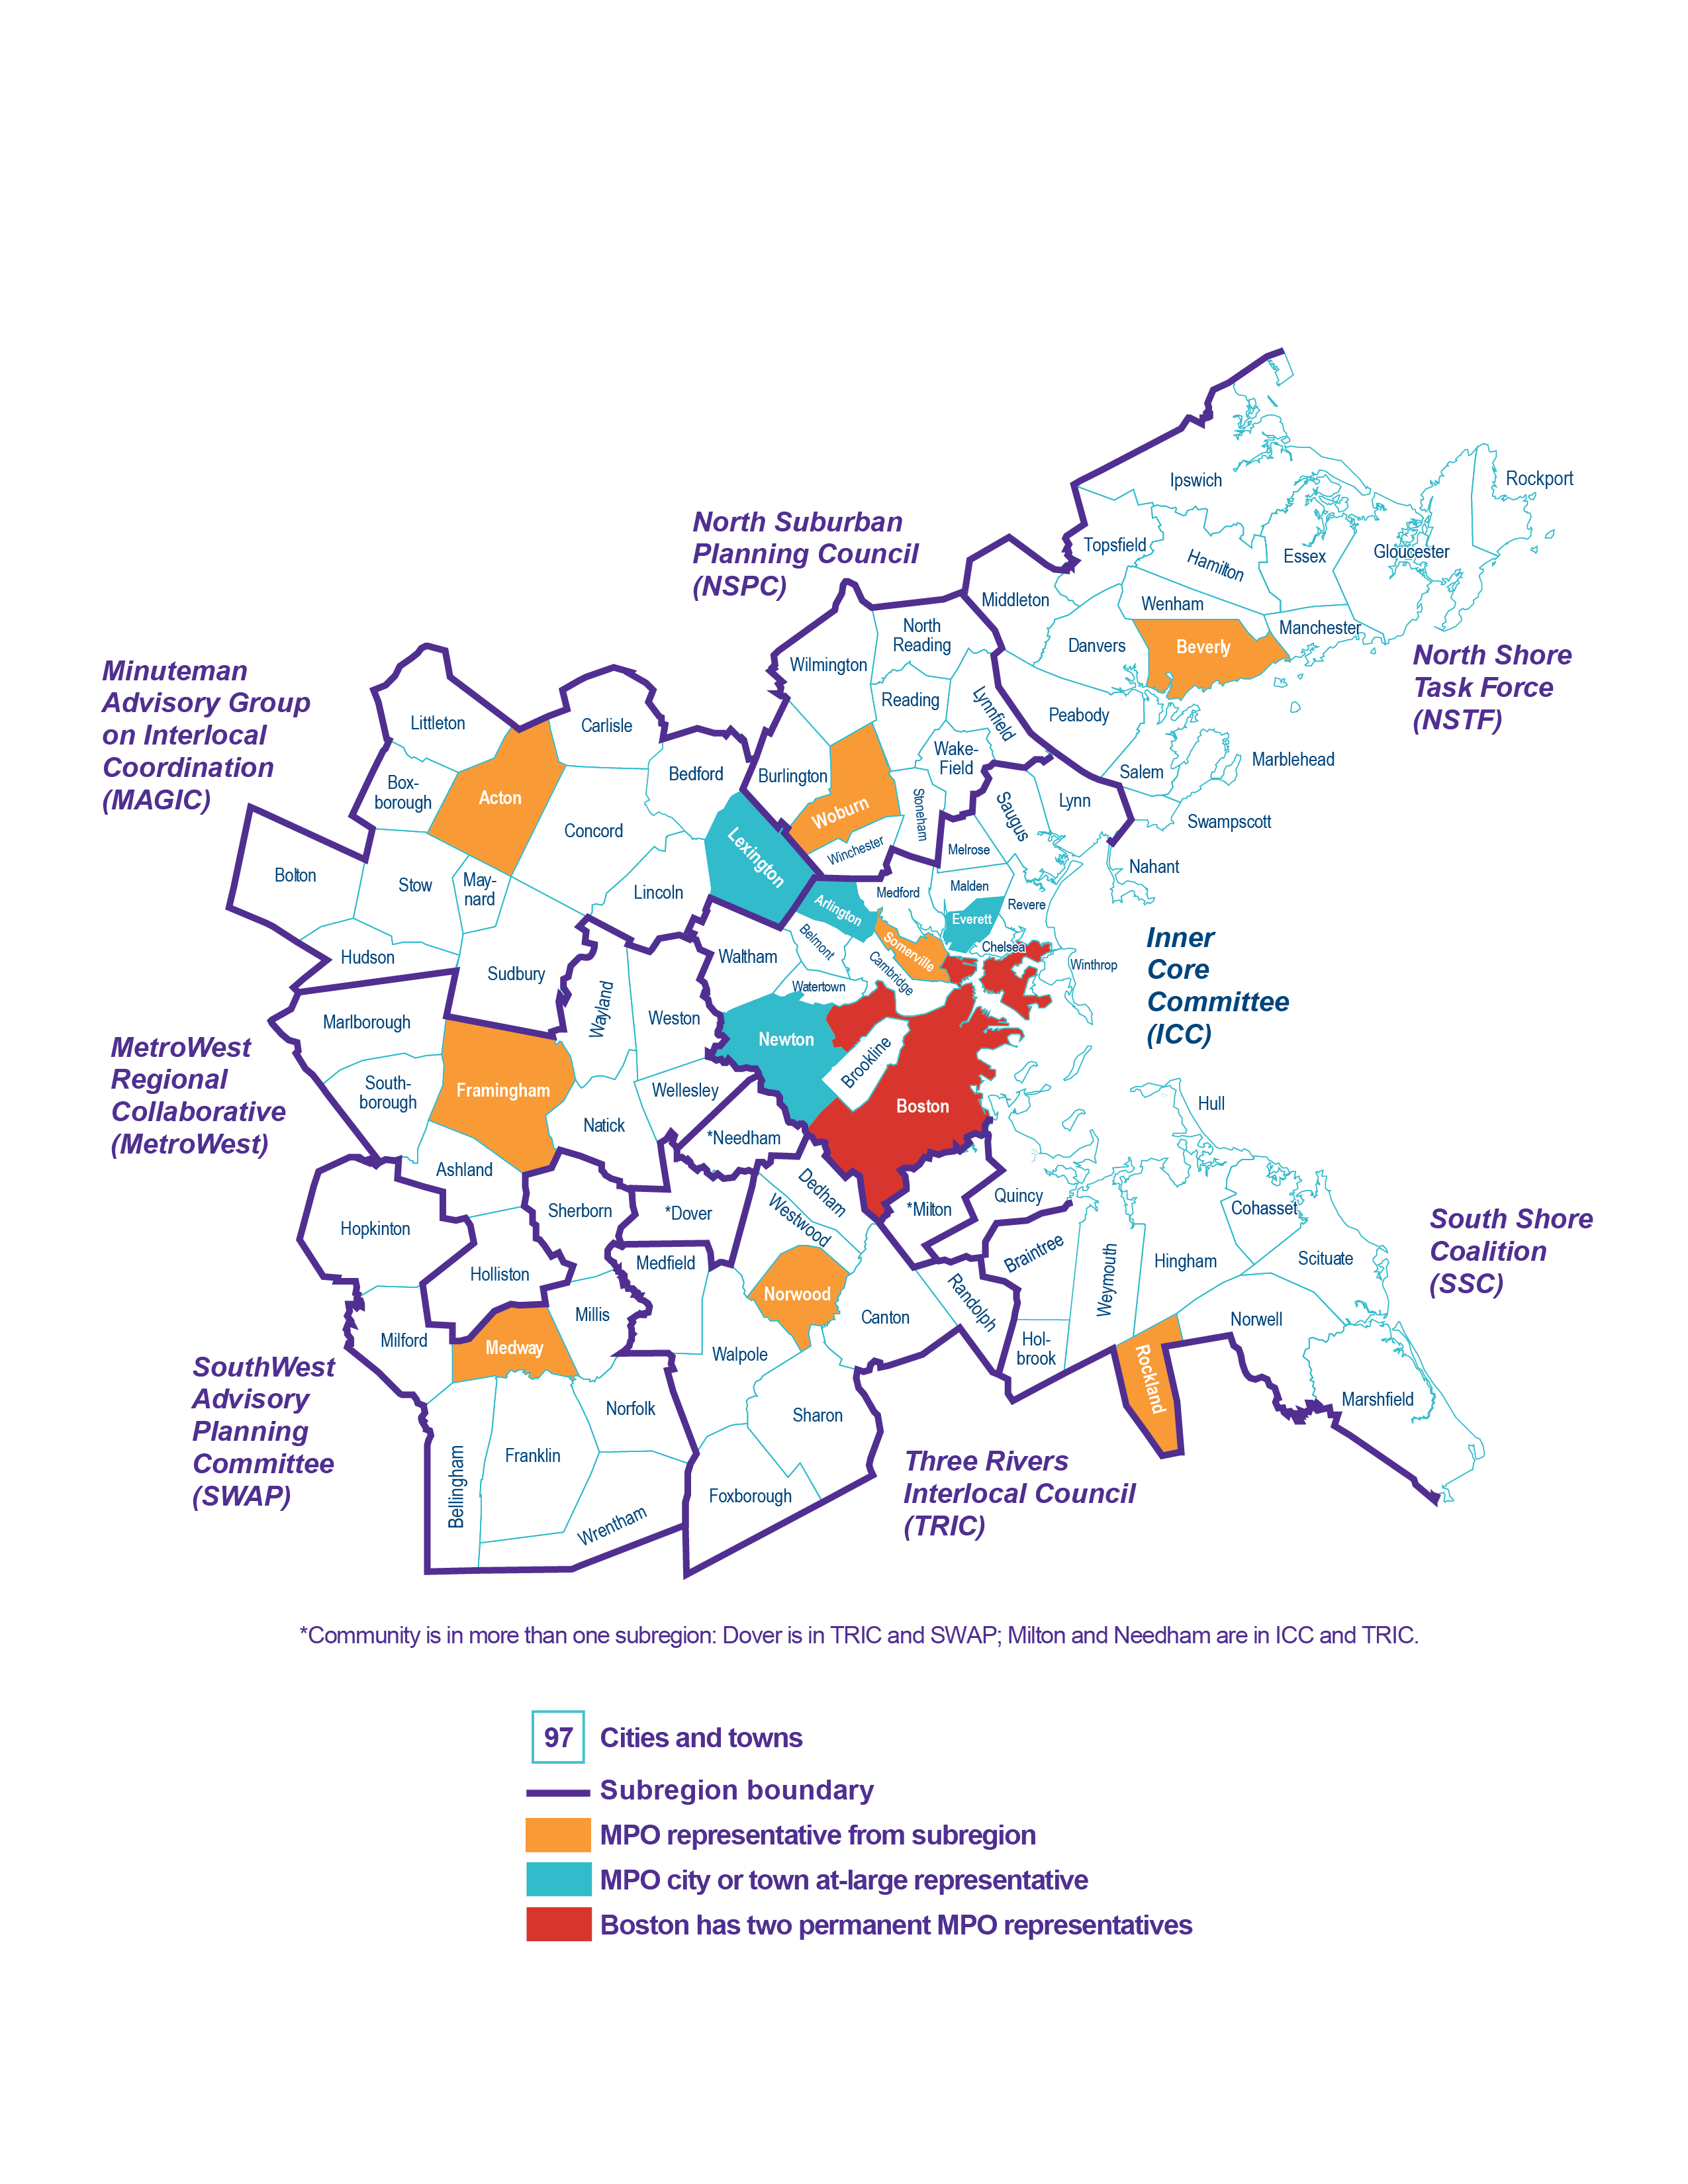
The Boston Region MPO’s planning area extends across 97 cities and towns from Boston north to Ipswich, south to Marshfield, and west to Interstate 495.
Figure 1-1 shows the map of the Boston Region MPO’s member municipalities.
Figure 1-1: Municipalities in the Boston Region
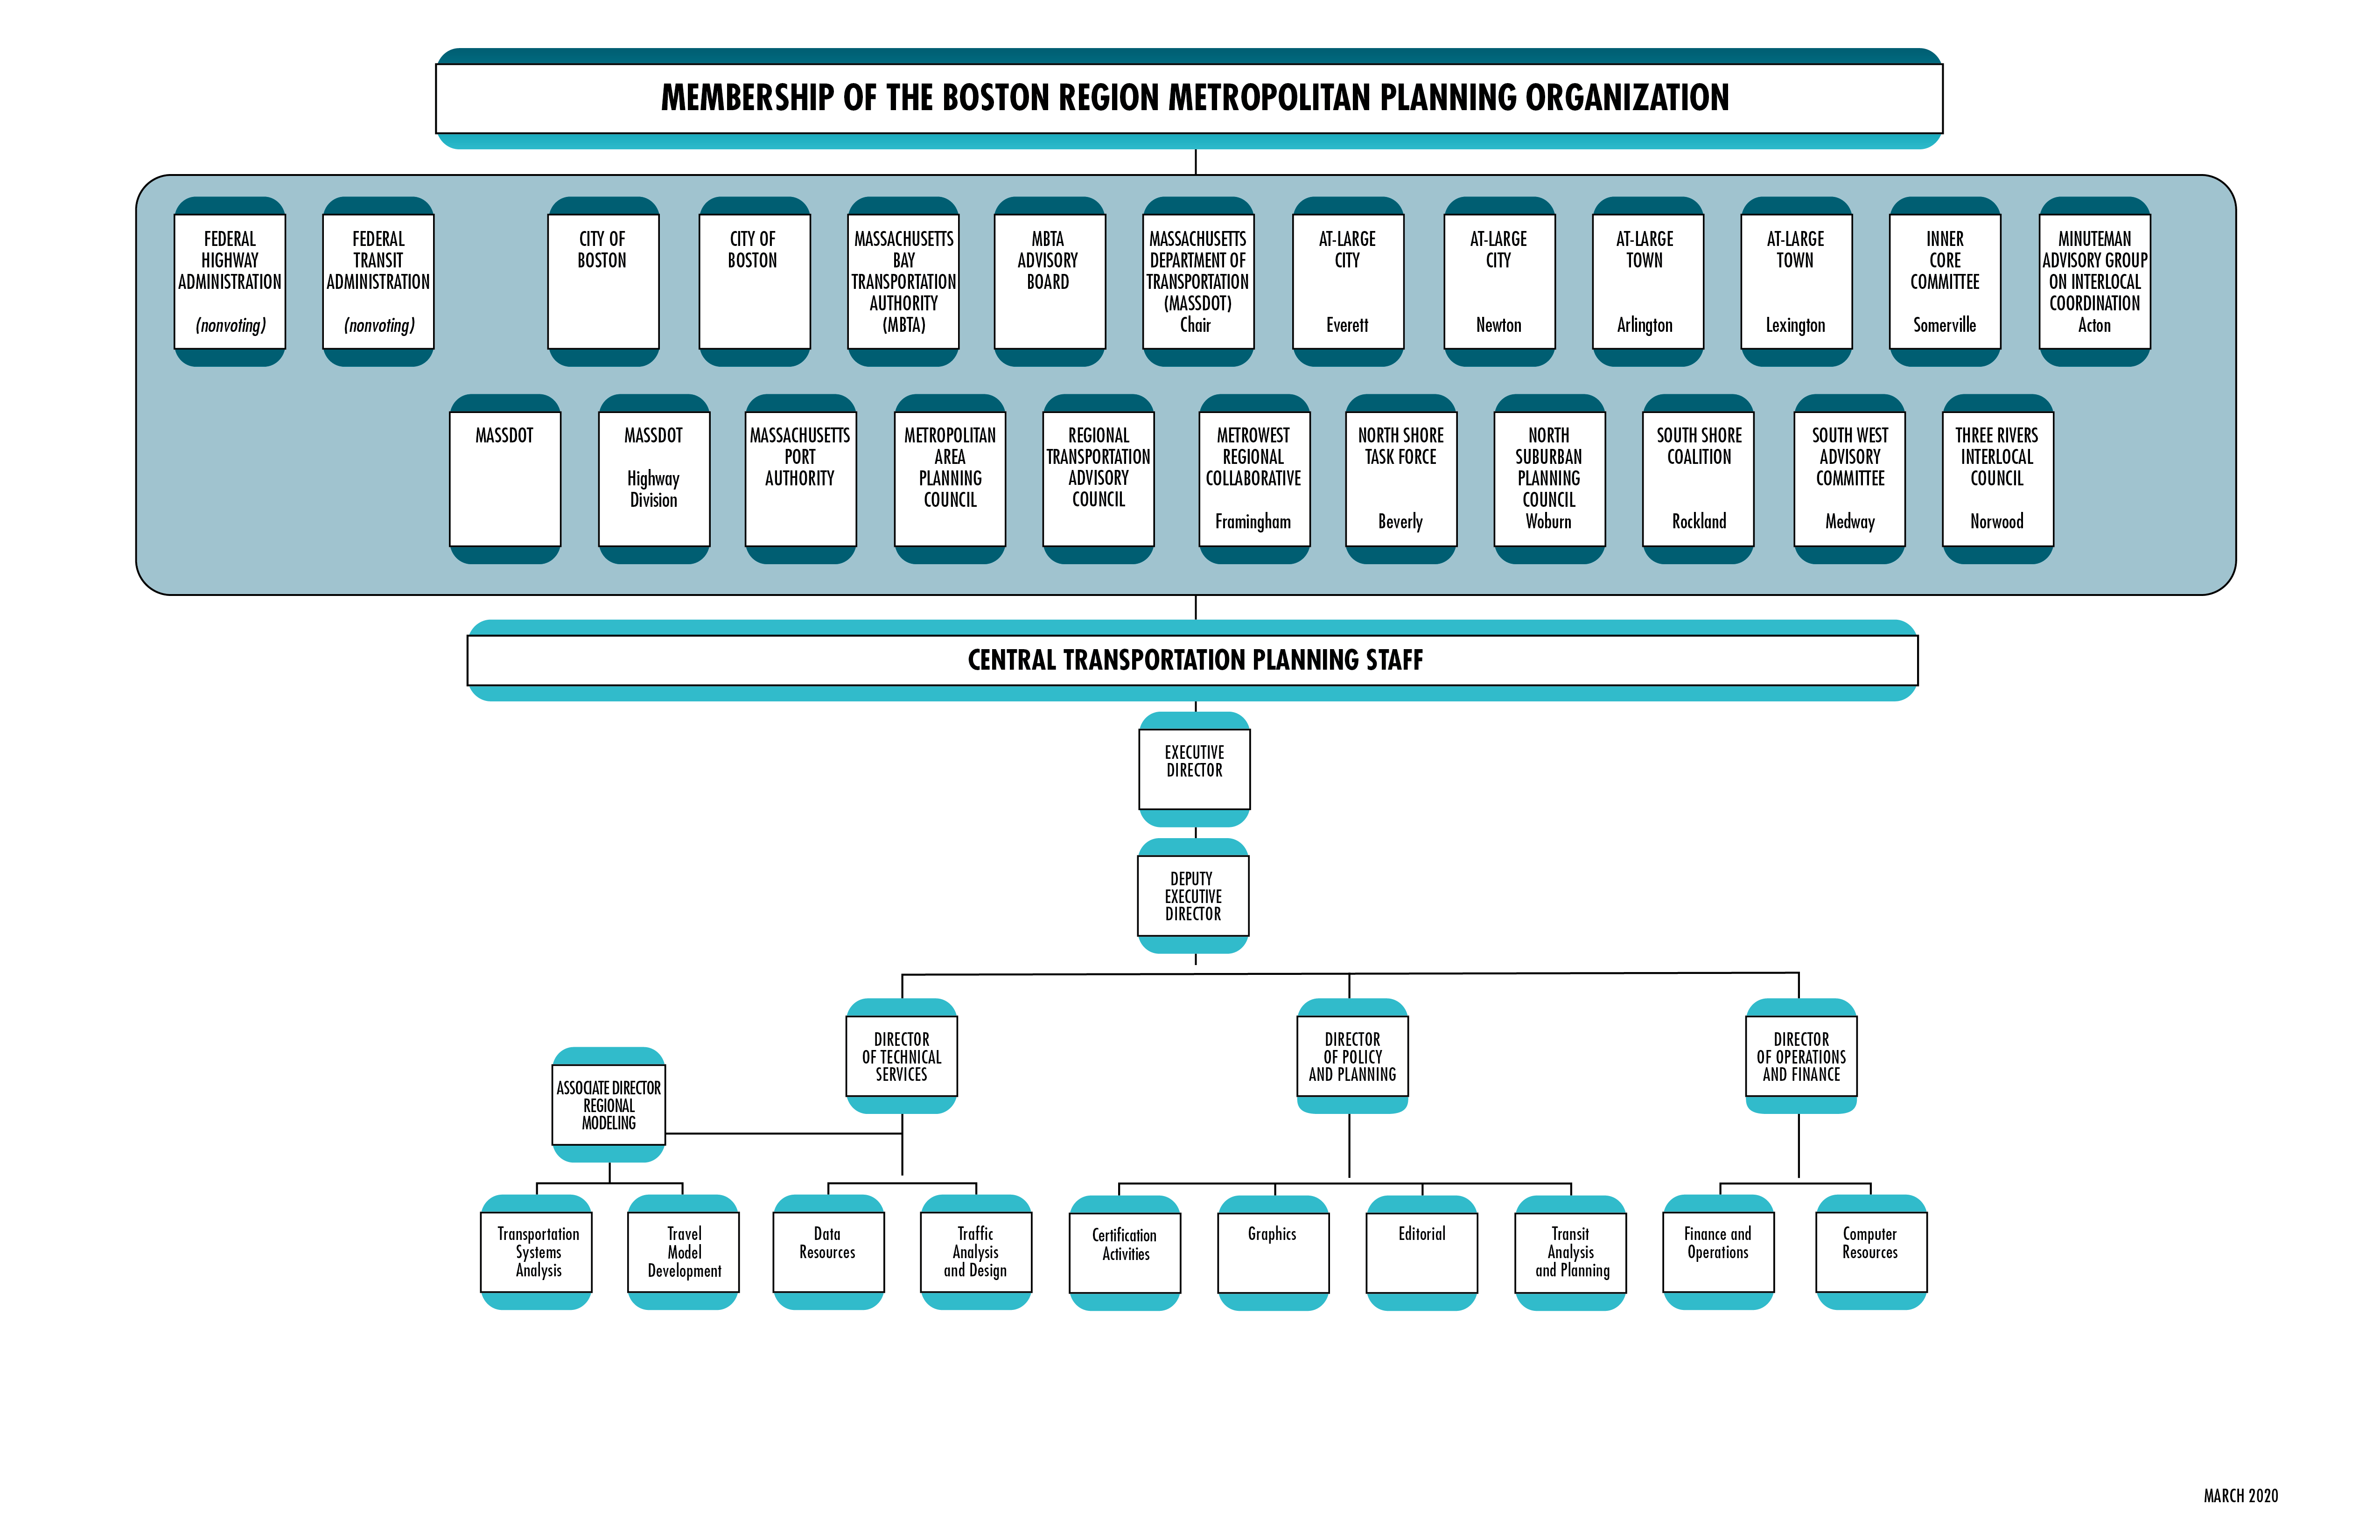
The MPO’s board comprises 22 voting members. Several state agencies, regional organizations, and the City of Boston are permanent voting members, while 12 municipalities are elected as voting members for three-year terms. Eight municipal members represent each of the eight subregions of the Boston region, and there are four at-large municipal seats. The Federal Highway Administration (FHWA) and Federal Transit Administration (FTA) participate on the MPO board as advisory (nonvoting) members. More details about the MPO’s permanent members can be found in Appendix F.
Figure 1-2 shows MPO membership and the organization of the Central Transportation Planning Staff, which serves as staff to the MPO.
Figure 1-2: Boston Region MPO Organizational Chart
The following paragraph is the MPO’s central vision statement, as adopted in Destination 2040, the MPO’s current Long-Range Transportation Plan (LRTP).
The Boston Region MPO envisions a modern, well-maintained transportation system that supports a sustainable, healthy, livable, and economically vibrant region. To achieve this vision, the transportation system must be safe and resilient; incorporate emerging technologies; and provide equitable access, excellent mobility, and varied transportation options.
This vision statement takes into consideration the significant public input received during the drafting of the Needs Assessment for Destination 2040. This statement also reflects the MPO’s desire to add emphasis to the maintenance and resilience of the transportation system while supporting its six core goals: Safety, System Preservation and Modernization, Capacity Management and Mobility, Clean Air and Sustainable Communities, Transportation Equity, and Economic Vitality. More information on the MPO’s vision, goals, and objectives for the transportation system is available in Figure 1-3 below.
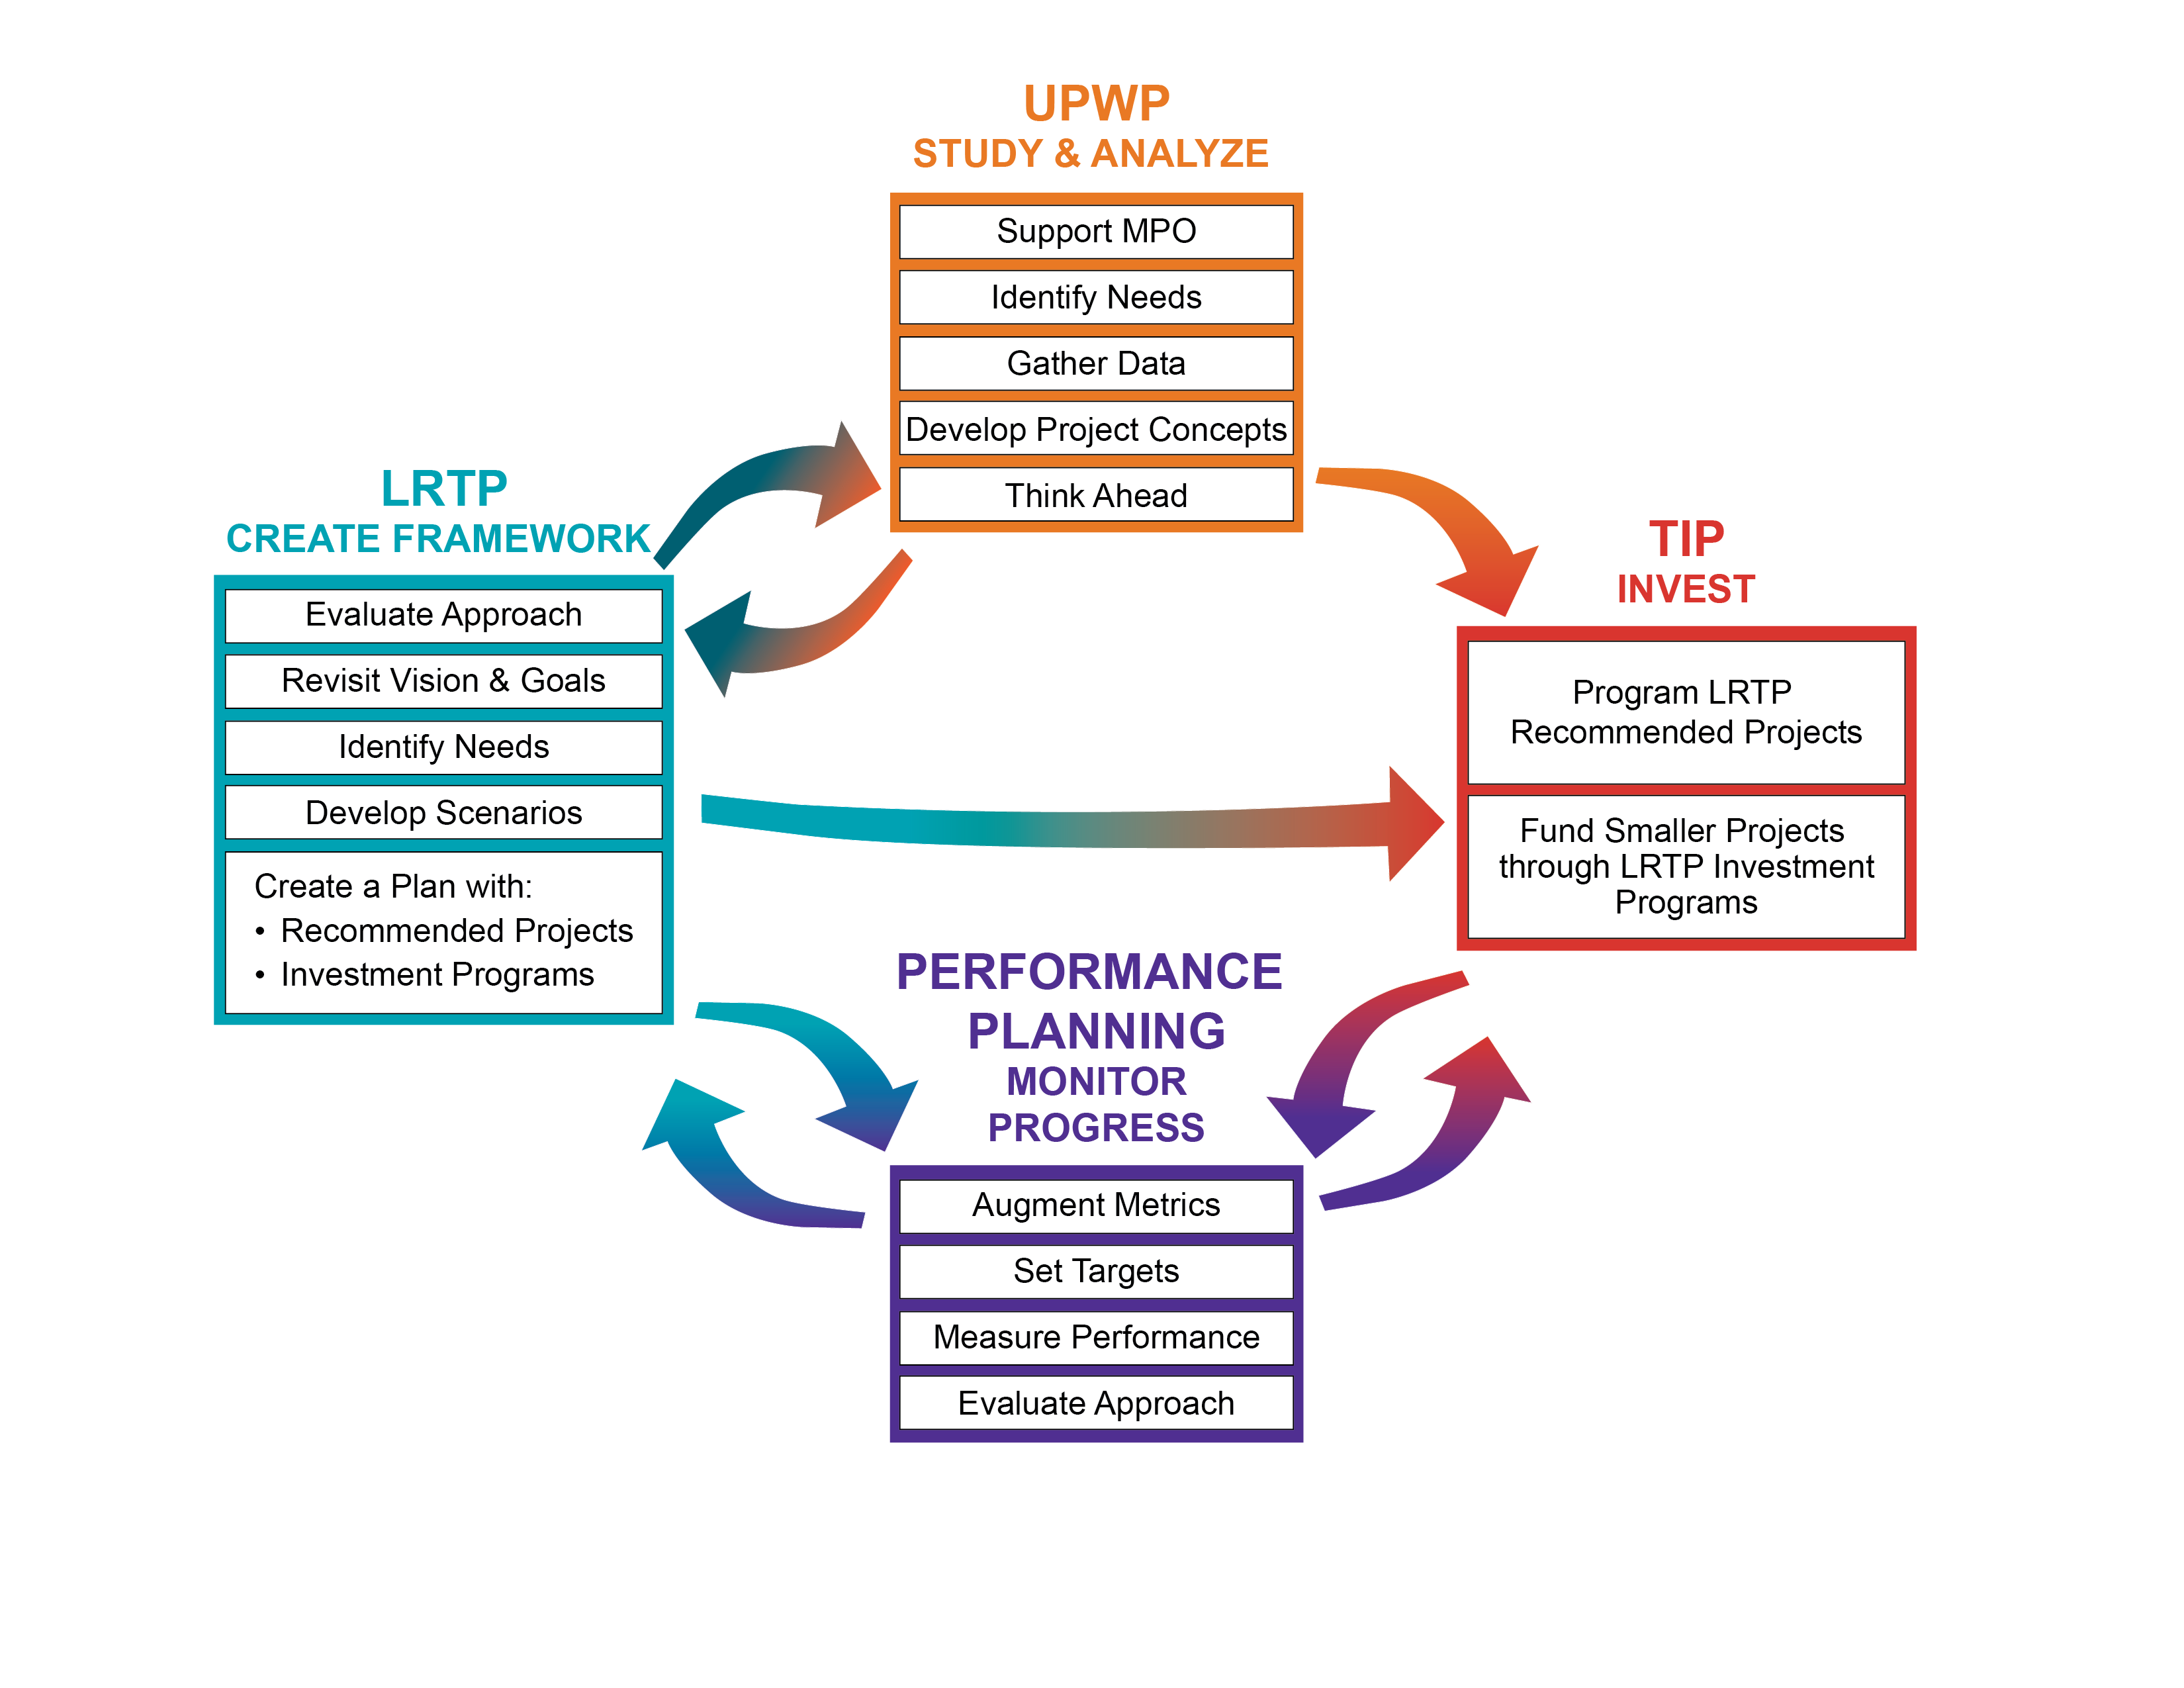
As part of its 3C process, the Boston Region MPO annually produces the Transportation Improvement Program (TIP) and the Unified Planning Work Program (UPWP). These documents, along with the quadrennial LRTP, are referred to as certification documents and are required for the MPO’s certification process for meeting federal requirements; this certification is a prerequisite for receiving federal transportation funds. In addition to the requirement to produce the LRTP, TIP, and UPWP, the MPO must establish and conduct an inclusive public participation process, and maintain transportation models and data resources to support air quality conformity determinations and long- and short-range planning work and initiatives.
The following is a summary of each of the certification documents.
Figure 1-4 depicts the relationship between the three certification documents and the MPO’s performance-based planning and programming process, which is a means to monitor progress towards the MPO’s goals and to evaluate the MPO’s approach in achieving those goals.
Figure 1-3: LRTP Goals and Objectives
The Boston Region Metropolitan Planning Organization envisions a modern, well-maintained transportation system that supports a sustainable, healthy, livable, and economically vibrant region. To achieve this vision, the transportation system must be safe and resilient; incorporate emerging technologies; and provide equitable access, excellent mobility, and varied transportation options.
| Goals | Objectives |
SAFETY: Transportation by all modes will be safe |
|
SYSTEM PRESERVATION: Maintain and modernize the transportation system and plan for its resiliency |
|
CAPACITY MANAGEMENT AND MOBILITY: Use existing facility capacity more efficiently and increase transportation options |
|
TRANSPORTATION EQUITY: Ensure that all people receive comparable benefits from, and are not disproportionately burdened by, MPO investments, regardless of race, color, national origin, age, income, ability, or sex |
|
CLEAN AIR/SUSTAINABLE COMMUNITIES: Create an environmentally friendly transportation system |
|
ECONOMIC VITALITY: Ensure our transportation network provides a strong foundation for economic vitality |
|
Figure 1-4: Relationship between the LRTP, TIP, UPWP, and Performance-Based Planning Process
One of the most important decisions a metropolitan planning organization (MPO) faces is deciding how to allocate limited funds for transportation projects and programs. Transportation improvements are part of the solution to many critical regional, state, national, and even global problems, such as traffic congestion, air pollution, fatalities and injuries on roadways, climate change, and environmental injustice. However, there is not nearly enough funding available for all of the necessary and worthy projects that would address these problems. Therefore, it is important that an MPO’s investment choices are guided by policies that help identify the most viable and effective solutions.
As described in Chapter 1, the Boston Region MPO develops a Long-Range Transportation Plan (LRTP) and a Transportation Improvement Program (TIP) to prioritize the expenditure of federal funds on transportation projects. The MPO staff manages the development of both plans. The annual development process for the TIP involves evaluating project funding requests from municipalities and state transportation agencies. The MPO staff then proposes programming for new and ongoing projects based on anticipated yearly funding levels, supports the MPO board by creating a draft TIP document, and facilitates a public involvement process that affords the public an opportunity to comment on proposed projects and review the draft TIP before the MPO board endorses the final document.
The first step in allocating federal transportation funds is the passage of a multiyear act by the United States (US) Congress that establishes a maximum level of federal transportation funding per federal fiscal year (FFY).2-1 The establishment of this level of funding is referred to as an authorization.
After the authorization level has been established, the US Department of Transportation annually allocates funding among the states according to various federal formulas. This allocation is referred to as an apportionment. The annual apportionment rarely represents the actual amount of federal funds that are ultimately committed to a state because of federally imposed limitations on spending in a given FFY, referred to as the obligation authority. In Massachusetts, TIPs are developed based on the estimated obligation authority.
The FFYs 2021–25 TIP’s Highway Program was developed with the assumption that funding from the Federal-Aid Highway Program for the Commonwealth of Massachusetts would range between approximately $671 million and $725 million annually over the next five years. These amounts include the funds that would be set aside initially by the Massachusetts Department of Transportation (MassDOT) as payments for the Accelerated Bridge Program and exclude required matching funds.
The process of deciding how to use this federal funding in the Boston region follows several steps. MassDOT first reserves funding for Grant Anticipation Notes (GANs) debt service payments for the Accelerated Bridge Program. Annual GANs payments range between approximately $82 million and $122 million annually over the five years of this TIP.
The remaining Federal-Aid Highway Program funds are budgeted to support state and regional (i.e., MPO) priorities. In the FFYs 2021–25 TIP, there is a total of approximately $728 million to $763 million assumed to be annually available statewide for programming (these amounts include both federal dollars and the state-provided local match). MassDOT customarily provides the local match (which can also be provided by other entities); thus, the capital costs of projects are typically funded with 80 percent federal dollars and 20 percent state dollars, depending on the funding program. The proponent of the project is required to bear the costs for project design.
The Regional Targets are discretionary funds for MPOs, suballocated by formula to each metropolitan planning region. The Boston Region MPO receives about 43 percent of the total funds available statewide for Regional Targets. MassDOT developed the target formula in consultation with the Massachusetts Association of Regional Planning Agencies (or MARPA).
Each MPO in the state can decide how to prioritize its Regional Target funding. Given that the Regional Target funding originates from the Federal-Aid Highway Program, the Boston Region MPO board typically programs the majority of its target funding on roadway projects; however, the MPO board has flexed portions of its TIP Highway Program funding to the TIP’s Transit Program, most notably when the MPO board gave its support to the Green Line Extension transit expansion project. Additionally, the FFYs 2021–25 TIP includes an annual allotment of funding to the MPO’s Transit Modernization program beginning in FFY 2025. This represents the MPO’s first formalized effort to flex Federal-Aid Highway funds to transit projects on a yearly basis, an affirmation of the region’s goals to support multimodal transportation options in a meaningful way. More information on the MPO’s investment strategy is included in Section 2.3 below.
During the next five years, the Boston Region MPO’s total Regional Target funding will be approximately $538 million, an average of $107.6 million per year. To decide how to spend its Regional Target funding, the MPO engages its 97 cities and towns in an annual TIP development process.
The Federal-Aid Highway Program dollars discussed in this section come through several Federal Highway Administration (FHWA) funding programs, each of which has unique requirements. Table 2-1 shows these programs, which come from the Fixing America’s Surface Transportation (FAST) Act and fund projects in the FFYs 2021–25 TIP.
Table 2-1: Federal Highway Administration Programs Applicable to the FFYs 2021–25 Transportation Improvement Program
FAST Act Program |
Eligible Uses |
Congestion Mitigation and Air Quality Improvement (CMAQ) |
A wide range of projects to reduce congestion and improve air quality in nonattainment and maintenance areas for ozone, carbon monoxide, and particulate matter |
Highway Safety Improvement Program (HSIP) |
Implementation of infrastructure-related highway safety improvements |
National Highway Performance Program (NHPP) |
Improvements to interstate routes, major urban and rural arterials, connectors to major intermodal facilities, and the national defense network; replacement or rehabilitation of any public bridge; and resurfacing, restoring, and rehabilitating routes on the Interstate Highway System |
Surface Transportation Block Grant Program (STBGP) [formerly the Surface Transportation Program (STP)] |
A broad range of surface transportation capital needs, including roads; transit, sea, and airport access; and vanpool, bicycle, and pedestrian facilities |
Transportation Alternatives Program (TAP) |
A set-aside from the STBGP that funds the construction of infrastructure-related projects (for example, sidewalk, crossing, and on-road bicycle facility improvements) |
Metropolitan Planning |
Facilities that contribute to an intermodal transportation system, including intercity bus, pedestrian, and bicycle facilities |
National Highway Freight Program (NHFP) |
Projects that improve the efficient movement of freight on the National Highway Freight Network |
Source: Federal Highway Administration
Federal aid for public transit authorities is allocated by formula to urbanized areas (UZAs). MassDOT is the recipient of this federal aid in the Boston UZA. In UZAs with populations greater than 200,000, such as the Boston UZA, the distribution formula factors in passenger-miles traveled, population density, and other factors associated with each transit provider. The three regional transit authorities (RTAs) in the Boston Region MPO area are the Massachusetts Bay Transportation Authority (MBTA), MetroWest Regional Transit Authority (MWRTA), and Cape Ann Transportation Authority (CATA). The MBTA, with its extensive transit program and infrastructure, receives the majority of federal transit funds in the region.
The Federal Transit Administration (FTA) distributes funding to transit agencies through several different programs. Table 2-2 shows FTA programs that come from the FAST Act and support transit investments in the FFYs 2021–25 TIP.
Table 2-2: Federal Transit Administration Programs Applicable to the FFYs 2021–25 Transportation Improvement Program
FAST Act Program |
Eligible Uses |
Urbanized Area Formula Grants (Section 5307) |
Transit capital and operating assistance in urbanized areas |
Fixed Guideway/Bus (Section 5337) |
Replacement, rehabilitation, and other state-of-good-repair capital projects |
Bus and Bus Facilities (Section 5339) |
Capital projects to replace, rehabilitate, and purchase buses and related equipment, and to construct bus-related facilities |
Enhanced Mobility of Seniors and Individuals with Disabilities (Section 5310) |
Capital expenses that support transportation to meet the special needs of older adults and persons with disabilities |
Fixed-Guideway Capital Investment Grants (Section 5309) Ferry Boat Program |
Grants for new and expanded rail, bus rapid transit, and ferry systems that reflect local priorities to improve transportation options in key corridors
A program that funds the design or construction of ferry boats or the design, construction, or acquisition of right of way for ferry terminal facilities. |
Source: Federal Transit Administration
As mentioned, each MPO in the state can decide how to prioritize the Regional Target funding it receives through the processes established by FHWA and MassDOT. The Boston Region MPO’s LRTP defines the investment framework that informs the specific investment decisions made in the TIP by establishing
The MPO’s goals and objectives provide the foundation for the evaluation criteria the MPO board uses when selecting transportation projects to be funded with Regional Target dollars. MPO staff compares candidate projects’ characteristics to these criteria to evaluate whether individual projects can help the MPO advance its various goals. The criteria used to select projects for this TIP are based on the MPO’s goals and objectives, adopted as part of Destination 2040, which is the LRTP the MPO endorsed in August 2019. These goals and objectives are listed in Chapter 1.
In Destination 2040, the MPO strengthened the link between its spending and improvements to transportation performance by revising its investment programs to include a broader range of prospective projects. These investment programs focus on specific types of projects that the MPO expects will help achieve its goals and objectives for the transportation system. The MPO created these programs to give municipalities the confidence that if they design these types of projects, the MPO will be willing to fund them through the TIP. The investment programs include:
Figure 2-1 provides details about the Destination 2040 investment programs and their relationship to the MPO’s goals. When developing the FFYs 2021–25 TIP, the MPO allocated its Regional Target dollars to these investment programs by assigning them to projects that meet the investment programs’ criteria.
Figure 2-1: Destination 2040 Investment Programs
Funds projects to modernize intersection geometry and signalization to improve safety and mobility.
Improvements may include:
Funds projects that modernize roadways to improve safety and mobility for all users.
Improvements may include:
Funds projects to expand bicycle and pedestrian networks to improve safe access to transit, schools, employment centers, and shopping destinations.
Improvements may include:
Funds a variety of project types, including first- and last-mile solutions and other small, nontraditional transportation projects to enhance mobility and improve air quality.
Improvements may include:
Funds projects that enhance major arterials for all users and modernize or expand transit systems to increase capacity. Projects in this program cost more than $20 million and/or add capacity to the transportation system.
Improvements may include
Funds projects that modernize transit infrastructure and promote the enhanced ridership, accessibility or resiliency of transit services.
Improvements may include:
Newly created in Destination 2040, the Transit Modernization program represents a significant shift in the MPO’s investment strategy, as funding is allocated to transit projects on an annual basis beginning in FFY 2025. In prior years, the MPO has only funded transit projects on a one-off basis when funding was requested for specific projects in the region. By creating the programming infrastructure to flex Regional Target highway funds to transit projects annually, the Boston Region MPO has established itself as a leader among MPOs nationally in crafting an investment strategy that is truly multimodal and has taken a clear stance that investing in transit is central to improving the region’s broader transportation system. The MPO’s five other investment programs were created during the development of prior Long-Range Transportation Plans.2-2
While the MPO did not fund any specific Transit Modernization projects in this TIP cycle, funding was reserved in FFY 2025 for future allocation. In the meantime, the MPO will continue to work with municipalities and transit providers in the region to identify transit needs and determine the most effective use of this funding to address those needs.
Destination 2040 also reflects an updated set of priorities for the MPO's Complete Streets investment program, adding dedicated bus lanes and climate resiliency measures to the types of projects targeted for funding through this program. As with the Transit Modernization program, the MPO will continue to work with municipalities in future TIP cycles to develop and fund projects in these new areas of emphasis.
Finally, while the MPO’s Community Connections investment program was created through the 2015 LRTP, Charting Progress to 2040, the FFYs 2021–25 TIP represents the first TIP cycle that allocates this funding to specific projects. In prior TIP cycles, the $2 million in annual funding for this program was reserved for future use but not allocated, as the development timeline for the first- and last-mile projects funded through this program is much shorter than for other TIP projects. In the FFYs 2021–25 TIP, Community Connections funding in FFY 2021 was allocated to five projects, while funding in FFYs 2022–25 remains reserved for allocation in future TIP cycles. More information on the projects selected for funding in each of the MPO’s investment programs can be found in Chapter 3.
When creating investment program guidelines for Destination 2040, the MPO elected to decrease the amount of funding allocated to large-scale projects that would be included in its Major Infrastructure program in order to focus a larger percentage of funding on lower cost, operations and management-type projects. (For the development of the FFYs 2021–25 TIP, the MPO defined Major Infrastructure projects as those that cost more than $20 million or that add capacity to the transportation network). Such a funding mix will help the MPO address its goals and provide more opportunities for the MPO to distribute federal transportation dollars to projects throughout the region, as opposed to concentrating it on a few large-scale projects. Destination 2040 focused on investing federal transportation dollars over a 20-year period, but several guidelines are relevant to shorter-term TIP programming, including the following:
The MPO considers LRTP-based guidelines such as these when determining how to program Regional Target funding over the relevant five-year period for the TIP.
MassDOT, in coordination with the MBTA, updates its rolling five-year Capital Investment Plan (CIP) on an annual basis. This planning document identifies priority roadway, transit, bridge, and statewide infrastructure projects for the five MassDOT divisions and the MBTA. The CIP process uses a framework that prioritizes funding according to MassDOT’s strategic goals. Reliability is the top priority for MassDOT, followed by Modernization and then Expansion. MassDOT and the MBTA have created investment programs for the CIP that relate to these strategic goals, and allocate funding to these goals and programs in ways that emphasize their priority. These goals and investment programs are as follows:
The MPO applies its investment framework when developing the TIP. The MPO board’s process for selecting projects to receive highway discretionary—or Regional Target—funding relies on evaluation criteria to help identify and prioritize projects that advance the MPO’s goals. The criteria are based on the MPO’s goals and objectives outlined in the LRTP. All projects are required to show consistency with the LRTP and other statewide and regional plans. Other considerations include the readiness of a project for construction and municipal support for the project. Background information about the TIP project evaluation process is presented in Appendix A.
In the wake of the adoption of Destination 2040 in August 2019, the MPO began the process of revising the TIP evaluation criteria to enhance alignment with the MPO’s updated goals, objectives, and investment programs. These new criteria will be adopted by the MPO by October 1, 2020, and will be employed during the project selection process for the FFYs 2022–26 TIP. The MPO developed project selection criteria to evaluate and fund projects through the Community Connections program during the FFYs 2021–25 TIP cycle. These criteria will also be revised based on feedback received on the pilot round of this program, and the updated criteria will be used to select the next round of projects through this funding program in the FFYs 2022–26 TIP.
The TIP development process begins early in the FFY when cities and towns in the region designate staff as TIP contacts and begin developing a list of priority projects to be considered for federal funding. Each fall, the MPO staff asks these TIP contacts to identify their city or town’s priority projects and then MPO staff elicits input from interested parties and members of the general public.
All new Bicycle Network and Pedestrian Connections, Complete Streets, Intersection Improvements, and Major Infrastructure projects must be initiated by the MassDOT Highway Division before they can be considered for programming in the TIP. MassDOT details this process on its project initiation webpage, https://www.mass.gov/info-details/massdot-highway-initiating-a-project. To be considered for programming, Community Connections projects must submit an application for funding directly to MPO staff, as these projects do not need to be initiated by MassDOT.
During the fall, municipal TIP Contacts and MPO staff coordinate to update the information for currently programmed projects in the MPO’s Interactive TIP Database, https://www.ctps.org/maploc/www/apps/tipApp/index.html, which summarizes information on each project's background, infrastructure condition and needs, development status, evaluation scores, and ability to help the region attain the MPO’s goals and objectives.
The MPO staff compiles project funding requests for projects into a Universe of Unprogrammed Projects list, which consists of all identified projects being advanced for possible funding in the Bicycle Network and Pedestrian Connections, Complete Streets, Intersection Improvements, and Major Infrastructure investment programs. The Universe includes projects that are fully designed and ready to be advertised for construction, those that are undergoing preliminary engineering and design, and projects still in the conceptual planning stage. Projects that are active municipal priorities and that are feasibly ready to be programmed in the current TIP cycle continue forward into the MPO’s project evaluation process. Projects that are not ready for programming remain in the Universe for consideration in future TIP cycles.
The TIP development process also features a Universe of Unprogrammed Projects for the Community Connections Program. This list was compiled by MPO staff in December 2018 after significant outreach to municipalities and transportation service providers. Like the project list mentioned above, this list includes projects at various stages of design. To conduct the pilot round of the Community Connections Program, project proponents from this list were contacted during the fall TIP outreach period and encouraged to submit applications for their projects.
The MPO staff uses its project evaluation criteria to logically and transparently evaluate and select projects for programming in the TIP that advance the MPO’s vision for transportation in the region. This process favors projects that support the following goals:
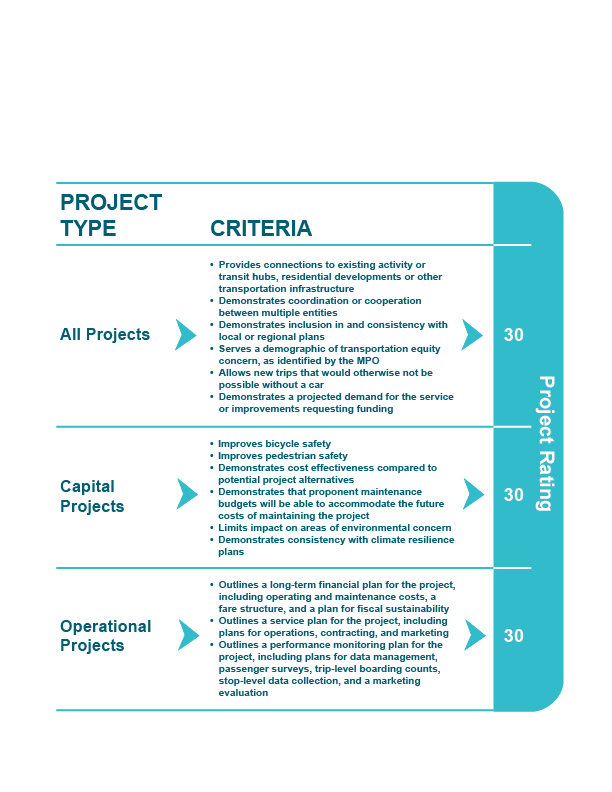
MPO staff used two sets of evaluation criteria to score projects for the FFYs 2021–25 TIP. For the Bicycle Network and Pedestrian Connections, Complete Streets, Intersection Improvements, and Major Infrastructure investment programs, projects were scored on 28 criteria, each of which measure aspects of these projects that support the MPO's goals and objectives, as outlined in Destination 2040. Figure 2-2 provides an overview of these goals, criteria, and scoring values. Given the distinct nature of the smaller-scale, first- and last-mile projects considered for funding through the Community Connections Program, a unique set of evaluation criteria were applied to these projects. The full list of these criteria are available in Figure 2-3. As noted earlier in this chapter, Transit Modernization projects were not evaluated for funding during this TIP cycle, as this new investment program remains under development.
Figure 2-2: Transportation Improvement Program Evaluation Criteria (Bicycle Network and Pedestrian Connections, Complete Streets, Intersection Improvements, and Major Infrastructure Projects)
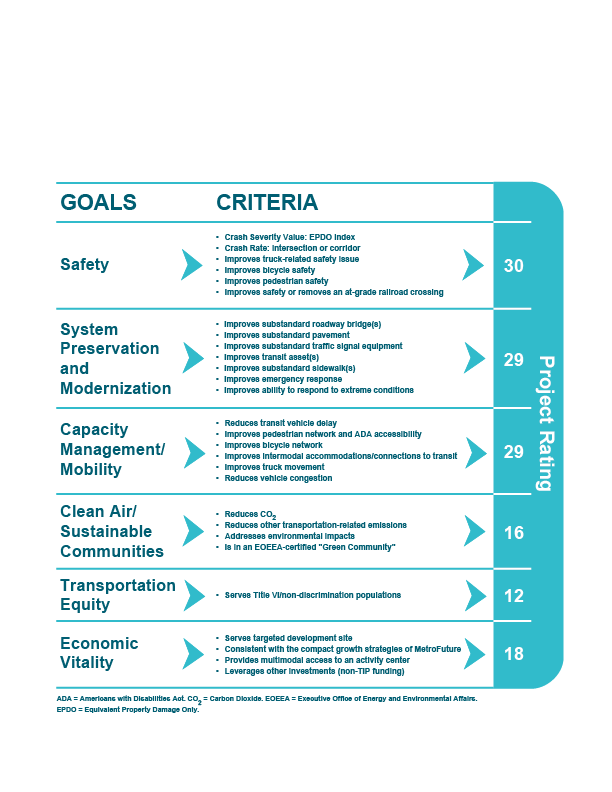
Figure 2-3: Community Connections Project Evaluation Criteria
In order for the MPO staff to conduct a complete project evaluation, each project proponent must provide enough information to meaningfully apply the criteria listed above. Bicycle Network and Pedestrian Connections, Complete Streets, Intersection Improvements, and Major Infrastructure projects must have a functional design report or its plans must include the level of detail defined in a functional design report, a threshold typically reached when a project nears the 25 percent design stage. (See MassDOT’s Project Development and Design Guide for information about the contents of a functional design report.) This guide is available at
https://www.mass.gov/lists/design-guides-and-manuals. For Community Connections projects, proponents must submit a complete application to the MPO, including any required supporting documentation.
For more details about the criteria used to score projects, as well as project evaluation results for projects considered for programming in this TIP, see Appendix A.
The MPO staff meets with members of the MassDOT Highway Division to review cost and schedule changes related to currently programmed projects, which are undergoing design review, permitting, and right-of-way acquisition. The MPO board then considers these updated project construction costs and changes to the expected dates for construction advertisement when making decisions about changes to TIP programming. These changes have an impact on the ability of the MPO to program its target funds for new projects in the five-year TIP.
Using the evaluation scores and information gathered about project readiness (when a project is expected to be fully designed and ready for advertisement) and cost, staff prepares possible TIP project programming scenarios for the MPO’s consideration. In developing these scenarios, MPO staff also considers whether a project was programmed in the LRTP, LRTP-based guidelines for allocating funds to different programs or project types, the distribution of investments across the region, and the availability of sufficient funding. MPO staff then gather feedback from board members, project proponents, and the public to inform a final staff recommendation, which is presented to the MPO for approval before it is included in the draft TIP for public review.
As discussed above, the selection of transit, bridge, and statewide infrastructure projects for programming in the TIP draws primarily from MassDOT’s CIP. MassDOT and the MBTA evaluate projects for inclusion in CIP programs using criteria established by the independent Project Selection Advisory Council (PSAC). The following criteria from the PSAC process guide project evaluation:
Projects that receive the highest score are those that meet MassDOT’s goals for maintaining and improving the overall condition and reliability of the system; modernizing the system to make it safer and more accessible and to accommodate growth; and expanding and diversifying transportation options for communities. These project prioritization processes may also reflect other planning initiatives, such as Focus40, the MBTA’s 25-year investment plan. Once project prioritization is complete, programming decisions are made based on these evaluations and information regarding project readiness, program sizing, and existing asset management plans.
As discussed above, the transit element of the TIP also includes the Federal-Aid Programs of the other two RTAs in the region, CATA and MWRTA.
Once selection processes are complete, these agencies submit their lists of bridge projects, statewide infrastructure items, and transit capital projects to the MPO for review.
The MPO board considers the project evaluation results and staff recommendation when prioritizing projects for Regional Target funding. The board also considers public comments, the regional importance of projects, and other factors. In addition to prioritizing the Regional Target funding, the MPO board reviews statewide infrastructure items, the Bridge Program, and the capital programs for the MBTA, CATA, and MWRTA before voting to release a draft TIP for public review.
The MPO board votes to release the draft document for public review and invites members of the public, municipal and elected officials, and other stakeholders in the Boston region to review the proposed TIP. The MPO staff hosts outreach events during the public review period to elicit comments on the draft document (see Appendix C for a full list of public comments submitted on the draft TIP).
After the public review period ends, the MPO staff and board review all public comments, and the board may change the programming or the document as appropriate before endorsing the TIP. MassDOT staff incorporates the MPO-endorsed TIP into the State Transportation Improvement Program (STIP) and submits it to the FHWA and FTA for approval. The FHWA, FTA, and US Environmental Protection Agency review the STIP and certify it by September 30, the end of the FFY.
The TIP is a dynamic program that may be amended and adjusted throughout the year. Administrative modifications and amendments are often introduced due to changes in project status (advertisement readiness), project cost, project design scope, or available revenue. An amendment is a revision that requires public review and a demonstration of fiscal constraint.
Consistent with federal guidance, the Boston Region MPO must release an amendment if there is (1) a change in project cost of $500,000 or more for projects valued at $5 million or less, or (2) a change of 10 percent or more of the project cost for projects valued greater than $5 million. TIP amendments are also released if a project is proposed to be added or removed from the TIP, if the programming year of a project is changed, or if there is a large enough change in a project's scope to necessitate additional review by MassDOT's Project Review Committee. Cost changes that are less than the above threshold amounts may be considered in the form of administrative modifications or adjustments, which must still undergo MPO board action for approval. Administrative modifications or adjustments are also undertaken in the event that a project’s funding source changes. Although a public review period is not required for administrative modifications or adjustments, one may be offered at the MPO board’s discretion.
All proposed amendments are presented in a public setting at an MPO meeting, and details are posted on the MPO’s website, bostonmpo.org. Public notices are distributed through the MPO’s email contact list, which members of the public may join by signing up on the MPO’s website. TIP contacts at the affected municipalities and the public are notified of pending amendments at the start of an amendment’s public review period.
Notices of draft TIP amendments include a summary of the amendment’s contents, dates of the public review period, contact information for submitting a comment to the MPO, and the date, time, and location that the MPO will vote on that amendment. Also during the public review period, the MPO staff notifies and briefs the Regional Transportation Advisory Council (Advisory Council) about the amendment and relays any comments from the Advisory Council to the MPO board. Municipal representatives and members of the public are invited to submit written or oral testimony at the MPO meetings at which amendments are discussed or voted on.
The MPO typically holds a 21-day public review period before taking final action on an amendment. In extraordinary circumstances, the MPO may vote to shorten the public review period to a minimum of 15 days. (These circumstances are detailed in the MPO’s Public Participation Plan.)
The MPO’s website is the best place to find current information about the TIP. All changes to the draft TIP and changes to the endorsed TIP, such as amendments and modifications that have been approved by the MPO, are available on the TIP webpage, bostonmpo.org/tip.
Comments or questions about the draft TIP materials may be submitted directly to the MPO staff via the website, email, or US mail, or voiced at MPO meetings and other public MPO events.
2-1 The most recent authorization act, Fixing America’s Surface Transportation Act, was signed into law on December 4, 2015.
2-2 The Community Connections Program was formerly referred to as the Community Transportation/Parking/Clean Air and Mobility Program when it was originally created in the MPO’s 2015 LRTP, Charting Progress to 2040.
The Transportation Improvement Program (TIP) tables included in this chapter present a listing of all the projects and programs funded with federal highway and transit aid in the Boston region during federal fiscal years (FFYs) 2021–25. These funding tables are also included as part of the State Transportation Improvement Program (STIP).
Table 3-1 presents a summary of the Boston Region Metropolitan Planning Organization’s (MPO) share of Regional Target funds from the Federal-Aid Highway Program. The allocation of these funds is constrained by projections of available federal aid. As shown in Table 3-1, the MPO has programmed nearly all available discretionary funds within the limits of projected funding for highway funding programs. As such, the FFYs 2021–25 TIP Regional Target Program complies with financial constraint requirements. The details of this funding and the specific projects programmed with Regional Target funding are shown in Section 1A of each annual element of the TIP tables (Table 3-6). Section 1A includes the regionally prioritized projects funded during a given federal fiscal year. The other sections in Table 3-6 (Sections 1B, 2A, 2B, and 2C) list the following:
Tables 3-7, 3-8, and 3-9 list the federally funded transit projects and programs in the Boston region that the Massachusetts Bay Transportation Authority (MBTA), MetroWest Regional Transit Authority (MWRTA), and Cape Ann Transportation Authority (CATA) plan to undertake.
The second part of the chapter includes detailed descriptions of projects funded through both the Regional Target and statewide portions of the Highway Program, including evaluation scores (for MPO-funded projects), project proponents, and funding details. The pages are organized alphabetically by the municipality in which each project is located.
Table 3-1
Boston Region MPO Regional Target Program Funding Summary
FFY 2021 |
FFY 2022 |
FFY 2023 |
FFY 2024 |
FFY 2025 |
Total |
|
Regional Target Obligation Authority |
$104,552,877 |
$106,681,829 |
$109,011,849 |
$110,440,638 |
$107,862,383 |
$538,549,576 |
Regional Target Funds Programmed |
$104,373,589 |
$106,681,829 |
$109,011,849 |
$110,440,638 |
$106,784,015 |
$537,291,920 |
Regional Target Funds Unprogrammed |
$179,288 |
$0 |
$0 |
$0 |
$1,078,368 |
$1,257,656 |
This section summarizes the investments made by the Boston Region MPO, Massachusetts Department of Transportation (MassDOT), MBTA, CATA, and MWRTA in the FFYs 2021–25 TIP. Table 3-2 shows the Boston Region MPO’s investments of Regional Target funding— including both the number of projects and the dollar amount—by investment program. These investments are aimed at making progress towards the MPO’s goals for the region, including enhancing safety for all users, preserving and modernizing the transportation system, promoting mobility and reducing congestion, supporting clean air and sustainability, ensuring all have equitable access to the transportation system, and fostering economic vitality in the region through investments in transportation.
Table 3-2
FFYs 2021–25 Boston Region MPO Regional Target Investment Summary
MPO Investment Program |
Number of Projects |
Regional Target Dollars Programmed |
Bicycle Network and Pedestrian Connections |
4 |
$30,905,263 |
Community Connections (allocated to projects) |
5 |
$822,000 |
Community Connections (not yet allocated to projects) |
N/A |
$8,000,000 |
Complete Streets* |
23 |
$244,774,339 |
Intersection Improvements |
11 |
$64,157,136 |
Major Infrastructure—Flex to Transit† |
1 |
$27,096,238 |
Major Infrastructure—Roadway‡ |
3 |
$156,036,944 |
Transit Modernization (not yet allocated to projects) |
N/A |
$5,500,000 |
Unprogrammed |
N/A |
$1,257,656 |
Total |
47 |
$538,549,576 |
Note: Funding amounts in this table include both federal and non-federal funds, including matching funds.
* Project 606501—Reconstruction of Union Street (Route 139) in Holbrook—is also supported by $1,527,250 in earmark funds, which are not shown in this table.
† The MPO will flex federal highway improvement dollars to support the Green Line Extension.
‡ In FFYs 2021 and 2022, the MPO will contribute $22,115,687 to Project 606476—Summer Tunnel Improvements—and MassDOT will contribute other funds. This project is included in the total number of projects in this category.
Source: Boston Region MPO.
Table 3-3 shows MassDOT’s FFYs 2021–25 TIP investments—including both the number of projects or programs and the dollar amount—by MassDOT program. MassDOT’s investments are distributed across a variety of programs and will support bridge and pavement improvements, roadway improvements and reconstruction, new bicycle and pedestrian infrastructure, and safety improvements.
Table 3-3
MassDOT Highway Program Investment Summary
MassDOT Program |
Number of Projects |
MassDOT Dollars Programmed |
Bicycles and Pedestrians |
7 |
$34,962,826 |
Bridge Program |
21 |
$290,941,713 |
Earmark or Discretionary Grant-funded Projects*†‡ |
3 |
$118,443,681 |
Intersection Improvements§ |
6 |
$21,704,768 |
Interstate Pavement |
3 |
$45,021,228 |
Non-Interstate Pavement |
13 |
$110,136,012 |
Non-Federal Aid |
1 |
$72,449,932 |
Roadway Improvements |
2 |
$1,022,095 |
Roadway Reconstruction |
7 |
$136,919,214 |
Safety Improvements |
7 |
$30,614,567 |
Total |
66 |
$862,216,036 |
Note: Funding amounts in this table include both federal and non-federal funds, including matching funds.
* Funding has been earmarked for three projects. Two of these projects are also receiving funding through MassDOT’s Roadway Reconstruction Program (606476—Summer Tunnel Improvements, and 607977—Interstates 90/495 Interchange Reconstruction). Each project is counted in the tally for the Earmark Projects and Roadway Reconstruction categories, but is only counted once in the total number of projects funded.
† Project 606476—Sumner Tunnel Improvements—is also funded with $22,115,687 in Regional Target funds, which are not shown in this table.
‡ Project 606501—Reconstruction of Union Street (Route 139) in Holbrook—is also supported by $2,287,523 in Regional Target funds, which are not shown in this table.
§ Two projects are funded through this program while also receiving funding through MassDOT’s Safety Improvements Program (607748—Intersection and Signal Improvements in Acton, and 607759—Intersection and Signal Improvements in Boston). Each project is counted the tally for the Intersection Improvements and Safety Improvements categories, but is only counted once in the total number of projects funded.
Sources: MassDOT and the Boston Region MPO.
Table 3-4 shows the MBTA’s programs and associated TIP funding amounts.
Table 3-4
MBTA Transit Program Investment Summary
FTA Program |
MBTA Program |
MBTA Dollars Programmed |
Section 5307: Urbanized Area Formula Grants |
Revenue Vehicle Program |
$765,310,434 |
Section 5307: Urbanized Area Formula Grants |
Signals/Systems Upgrade Program |
$195,683,036 |
Section 5307: Urbanized Area Formula Grants |
Stations and Facilities Program |
$13,458,398 |
Section 5337: Fixed Guideway/Bus Funds |
Bridge and Tunnel Program |
$243,400,908 |
Section 5337: Fixed Guideway/Bus Funds |
Revenue Vehicle Program |
$84,930,592 |
Section 5337: Fixed Guideway/Bus Funds |
Signals/Systems Upgrade Program |
$222,914,750 |
Section 5337: Fixed Guideway/Bus Funds |
Stations and Facilities Program |
$404,383,042 |
Section 5339: Bus and Bus Facilities Funds |
Bus Program |
$43,712,367 |
Section 5309: Fixed Guideway Capital Investment Grants |
Green Line Extension—New Starts (Full Funding Grant Agreement) |
$292,242,000 |
Other Federal Funds |
Positive Train Controla |
$822,250,000 |
Total |
N/A |
$3,088,285,527 |
Note: FTA formula funds (Sections 5307, 5337 and 5339) are based on estimated apportionments. TIP programs and projects are based on a preliminary draft Capital Investment Program as of April 30, 2020. Adjustments will be made to federal projects and budgets as the CIP process is finalized. Funding amounts in this table include both federal and non-federal funds, including matching funds.
a Positive Train Control investments are funded with Railroad Rehabilitation and Improvement Financing.
Sources: MBTA and the Boston Region MPO.
Table 3-5 summarizes CATA and MWRTA investments included in the FFYs 2021-25 TIP.
Table 3-5
CATA and MWRTA Transit Program Investment Summary
Regional Transit Authority |
Federal Transit Administration Program |
RTA Dollars Programmed |
CATA |
Section 5307: Urbanized Area Formula Funding |
$3,916,250 |
CATA |
Regional Transit Authority Capital Assistance Program |
$356,250 |
MWRTA |
Section 5307: Urbanized Area Formula Funding |
$21,609,600 |
MWRTA |
Section 5339: Bus and Bus Facilities |
$2,237,250 |
Total |
N/A |
$28,119,350 |
Note: Funding amounts in this table include both federal and non-federal funds, including matching funds.
Sources: CATA, MWRTA, and the Boston Region MPO.
Tables 3-6 through 3-9 build on the summary tables listed above by detailing investments made through both the Highway and Transit Programs by project, program, and funding year.
Table 3-6
FFYs 2021-25 Transportation Improvement Program Highway Table
| Year | MassDOT Project ID | MPO | Municipality | MassDOT Project Description | District | Funding Source | Adjusted TFPC | Total Programmed Funds | Federal Funds | Non-Federal Funds | MPO Project Score | Other Information | ||
| Federal Fiscal Year 2025 | $242,707,763 | $201,667,069 | $41,040,694 | |||||||||||
| Section 1A / Regionally Prioritized Projects | $106,784,015 | $85,927,212 | $20,856,803 | |||||||||||
| Roadway Reconstruction | $92,480,615 | $74,484,492 | $17,996,123 | |||||||||||
| 2025 | 605168 | Boston Region | Hingham | HINGHAM- IMPROVEMENTS ON ROUTE 3A FROM OTIS STREET/COLE ROAD INCLUDING SUMMER STREET AND ROTARY; ROCKLAND STREET TO GEORGE WASHINGTON BOULEVARD | 5 | STBG | $15,272,850 | $13,772,850 | $11,018,280 | $2,754,570 | 55 | Construction; TAP+STBG Total Cost = $15,272,850; MPO Evaluation Score = 55; TAP Proponent = Hingham | ||
| 2025 | 605168 | Boston Region | Hingham | HINGHAM- IMPROVEMENTS ON ROUTE 3A FROM OTIS STREET/COLE ROAD INCLUDING SUMMER STREET AND ROTARY; ROCKLAND STREET TO GEORGE WASHINGTON BOULEVARD | 5 | TAP | $15,272,850 | $1,500,000 | $1,200,000 | $300,000 | 55 | Construction; TAP+STBG Total Cost = $15,272,850; MPO Evaluation Score = 55; TAP Proponent = Hingham | ||
| 2025 | 606226 | Boston Region | Boston | BOSTON- RECONSTRUCTION OF RUTHERFORD AVENUE, FROM CITY SQUARE TO SULLIVAN SQUARE | 6 | NHPP | $146,377,974 | $12,000,000 | $9,600,000 | $2,400,000 | 59 | Construction; NHPP+STBG+TAP Total Cost = $146,377,974; AC schedule over 5 years (2022-2026); Total funding in this TIP = $111,685,278 $71,592,970; MPO Evaluation Score = 59; TAP Proponent = Boston | ||
| 2025 | 606226 | Boston Region | Boston | BOSTON- RECONSTRUCTION OF RUTHERFORD AVENUE, FROM CITY SQUARE TO SULLIVAN SQUARE | 6 | STBG | $146,377,974 | $30,047,396 | $24,037,917 | $6,009,479 | 59 | Construction; NHPP+STBG+TAP Total Cost = $146,377,974; AC schedule over 5 years (2022-2026); Total funding in this TIP = $111,685,278 $71,592,970; MPO Evaluation Score = 59; TAP Proponent = Boston | ||
| 2025 | 606226 | Boston Region | Boston | BOSTON- RECONSTRUCTION OF RUTHERFORD AVENUE, FROM CITY SQUARE TO SULLIVAN SQUARE | 6 | TAP | $146,377,974 | $2,000,000 | $1,600,000 | $400,000 | 59 | Construction; NHPP+STBG+TAP Total Cost = $146,377,974; AC schedule over 5 years (2022-2026); Total funding in this TIP = $111,685,278 $71,592,970; MPO Evaluation Score = 59; TAP Proponent = Boston | ||
| 2025 | 608045 | Boston Region | Milford | MILFORD- REHABILITATION ON ROUTE 16, FROM ROUTE 109 TO BEAVER STREET | 3 | HSIP | $3,887,537 | $1,000,000 | $900,000 | $100,000 | 43 | Construction; HSIP+STBG Total Cost = $3,887,537; MPO Evaluation Score = 43 | ||
| 2025 | 608045 | Boston Region | Milford | MILFORD- REHABILITATION ON ROUTE 16, FROM ROUTE 109 TO BEAVER STREET | 3 | STBG | $3,887,537 | $2,887,537 | $2,310,030 | $577,507 | 43 | Construction; HSIP+STBG Total Cost = $3,887,537; MPO Evaluation Score = 43 | ||
| 2025 | 608067 | Boston Region | Woburn | WOBURN- INTERSECTION RECONSTRUCTION AT ROUTE 3 (CAMBRIDGE ROAD) & BEDFORD ROAD AND SOUTH BEDFORD STREET | 4 | CMAQ | $1,670,400 | $1,670,400 | $1,336,320 | $334,080 | 52 | Construction; CMAQ Total Cost = $1,670,400; MPO Evaluation Score = 52 | ||
| 2025 | 609257 | Boston Region | Everett | EVERETT- RECONSTRUCTION OF BEACHAM STREET | 4 | HSIP | $10,921,632 | $1,000,000 | $900,000 | $100,000 | 54 | Construction; HSIP+TAP+STBG Total Cost = $10,921,632; MPO Evaluation Score = 54; TAP Proponent = Everett | ||
| 2025 | 609257 | Boston Region | Everett | EVERETT- RECONSTRUCTION OF BEACHAM STREET | 4 | STBG | $10,921,632 | $8,421,632 | $6,737,306 | $1,684,326 | 54 | Construction; HSIP+TAP+STBG Total Cost = $10,921,632; MPO Evaluation Score = 54; TAP Proponent = Everett | ||
| 2025 | 609257 | Boston Region | Everett | EVERETT- RECONSTRUCTION OF BEACHAM STREET | 4 | TAP | $10,921,632 | $1,500,000 | $1,200,000 | $300,000 | 54 | Construction; HSIP+TAP+STBG Total Cost = $10,921,632; MPO Evaluation Score = 54; TAP Proponent = Everett | ||
| 2025 | 610662 | Boston Region | Woburn | WOBURN- ROADWAY AND INTERSECTION IMPROVEMENTS AT WOBURN COMMON, ROUTE 38 (MAIN STREET), WINN STREET, PLEASANT STREET AND MONTVALE AVENUE | 4 | HSIP | $16,680,800 | $3,000,000 | $2,700,000 | $300,000 | 75 | Construction; HSIP+STBG Total Cost = $16,680,800; MPO Evaluation Score = 75 | ||
| 2025 | 610662 | Boston Region | Woburn | WOBURN- ROADWAY AND INTERSECTION IMPROVEMENTS AT WOBURN COMMON, ROUTE 38 (MAIN STREET), WINN STREET, PLEASANT STREET AND MONTVALE AVENUE | 4 | STBG | $16,680,800 | $13,680,800 | $10,944,640 | $2,736,160 | 75 | Construction; HSIP+STBG Total Cost = $16,680,800; MPO Evaluation Score = 75 | ||
| Bicycle and Pedestrian | $6,803,400 | $5,442,720 | $1,360,680 | |||||||||||
| 2025 | 610544 | Boston Region | Peabody | PEABODY- MULTI-USE PATH CONSTRUCTION OF INDEPENDENCE GREENWAY AT I-95 AND ROUTE 1 | 4 | CMAQ | $6,803,400 | $4,000,000 | $3,200,000 | $800,000 | 53 | Construction; CMAQ+TAP Total Cost = $6,803,400; MPO Evaluation Score = 53; TAP Proponent = Peabody | ||
| 2025 | 610544 | Boston Region | Peabody | PEABODY- MULTI-USE PATH CONSTRUCTION OF INDEPENDENCE GREENWAY AT I-95 AND ROUTE 1 | 4 | TAP | $6,803,400 | $2,803,400 | $2,242,720 | $560,680 | 53 | Construction; CMAQ+TAP Total Cost = $6,803,400; MPO Evaluation Score = 53; TAP Proponent = Peabody | ||
| Transit Grant Program | $2,000,000 | $1,600,000 | $400,000 | |||||||||||
| 2025 | S10782 | Boston Region | COMMUNITY CONNECTIONS PROGRAM | CMAQ | $8,320,000 | $2,000,000 | $1,600,000 | $400,000 | N/A | Planning, Design, or Construction; Set Aside for LRTP Clean Air and Mobility Program | ||||
| Flex to FTA | $5,500,000 | $4,400,000 | $1,100,000 | |||||||||||
| 2025 | S10783 | Boston Region | TRANSIT MODERNIZATION PROGRAM | CMAQ | $6,380,000 | $5,500,000 | $4,400,000 | $1,100,000 | N/A | Construction; Flex to FTA; Set Aside for LRTP Transit Modernization Program | ||||
| Section 2A / State Prioritized Reliability Projects | $85,830,967 | $71,108,755 | $14,722,212 | |||||||||||
| Safety Improvements | $7,631,397 | $6,868,257 | $763,140 | |||||||||||
| 2025 | 607748 | Boston Region | Acton | ACTON- INTERSECTION & SIGNAL IMPROVEMENTS ON SR 2 & SR 111 (MASSACHUSETTS AVENUE) AT PIPER ROAD & TAYLOR ROAD | 3 | HSIP | $4,382,329 | $961,396 | $865,256 | $96,140 | N/A | |||
| 2025 | 609532 | Boston Region | Chelsea | CHELSEA- TARGETED SAFETY IMPROVEMENTS AND RELATED WORK ON BROADWAY, FROM WILLIAMS STREET TO CITY HALL AVENUE | 6 | HSIP | $6,670,001 | $6,670,001 | $6,003,001 | $667,000 | 83 | |||
| Bridge On-system NHS | $31,552,232 | $25,241,786 | $6,310,446 | |||||||||||
| 2025 | 608703 | Boston Region | Wilmington | WILMINGTON- BRIDGE REPLACEMENT, W-38-029 (2KV), ST 129 LOWELL STREET OVER I 93 | 4 | NHPP | $17,133,432 | $17,133,432 | $13,706,746 | $3,426,686 | N/A | |||
| 2025 | 610776 | Boston Region | CAMBRIDGE- US RTE 3 OVER RTE 2 & RTE 16 OVER ALEWIFE | NHPP | $14,418,800 | $14,418,800 | $11,535,040 | $2,883,760 | N/A | |||||
| Non-Interstate Pavement | $29,838,925 | $23,871,140 | $5,967,785 | |||||||||||
| 2025 | 609402 | Boston Region | Multiple | FRAMINGHAM- NATICK- RESURFACING AND RELATED WORK ON ROUTE 9 | 3 | NHPP | $21,714,852 | $21,714,852 | $17,371,882 | $4,342,970 | N/A | |||
| 2025 | 610722 | Boston Region | Multiple | ACTON- BOXBOROUGH- LITTLETON- PAVEMENT PRESERVATION ROUTE 2 | 3 | NHPP | $8,124,073 | $8,124,073 | $6,499,258 | $1,624,815 | N/A | |||
| Interstate Pavement | $16,808,413 | $15,127,572 | $1,680,841 | |||||||||||
| 2025 | 610726 | Boston Region | Multiple | MEDFORD- WINCHESTER- STONEHAM- INTERSTATE PAVEMENT PRESERVATION ON I93 | 4 | NHPP-I | $16,808,413 | $16,808,413 | $15,127,572 | $1,680,841 | N/A | |||
| Section 2B / State Prioritized Modernization Projects | $45,568,780 | $41,011,902 | $4,556,878 | |||||||||||
| Intersection Improvements | $7,625,934 | $6,863,341 | $762,593 | |||||||||||
| 2025 | 607748 | Boston Region | Acton | ACTON- INTERSECTION & SIGNAL IMPROVEMENTS ON SR 2 & SR 111 (MASSACHUSETTS AVENUE) AT PIPER ROAD & TAYLOR ROAD | 3 | HSIP | $4,382,329 | $3,420,933 | $3,078,840 | $342,093 | N/A | |||
| 2025 | 610665 | Boston Region | Stoneham | STONEHAM- INTERSECTION IMPROVEMENTS AT ROUTE 28 (MAIN STREET), NORTH BORDER ROAD AND POND STREET | 4 | HSIP | $4,205,001 | $4,205,001 | $3,784,501 | $420,500 | N/A | |||
| Roadway Reconstruction | $37,942,846 | $34,148,561 | $3,794,285 | |||||||||||
| 2025 | 607977 | Boston Region | Multiple | HOPKINTON- WESTBOROUGH- RECONSTRUCTION OF I-90/I-495 INTERCHANGE | 3 | NHPP-I | $281,640,202 | $15,000,000 | $13,500,000 | $1,500,000 | N/A | Project ACd over 2022-2027. TFPC = $270,807,887. Total Construction Cost = $395M. HIP-BR = $40M, NHPP-I = $135,908,436. NFP-I = $105,731,365. NFA = $113,157,232. | ||
| 2025 | 607977 | Boston Region | Multiple | HOPKINTON- WESTBOROUGH- RECONSTRUCTION OF I-90/I-495 INTERCHANGE | 3 | NFP-I | $281,640,202 | $22,942,846 | $20,648,561 | $2,294,285 | N/A | Project ACd over 2022-2027. TFPC = $270,807,887. Total Construction Cost = $395M. HIP-BR = $40M, NHPP-I = $135,908,436. NFP-I = $105,731,365. NFA = $113,157,232. | ||
| Section 2C / State Prioritized Expansion Projects | $4,524,001 | $3,619,201 | $904,800 | |||||||||||
| Bicycle and Pedestrian | $4,524,001 | $3,619,201 | $904,800 | |||||||||||
| 2025 | 610660 | Boston Region | Multiple | SUDBURY- WAYLAND- MASS CENTRAL RAIL TRAIL (MCRT) | 3 | CMAQ | $4,524,001 | $4,524,001 | $3,619,201 | $904,800 | N/A | |||
| 2025 | 610674 | Boston Region | Newton | NEWTON- RECONSTRUCTION OF COMMONWEALTH AVENUE (ROUTE 30), FROM EAST OF AUBURN STREET TO ASH STREET | 6 | CMAQ | $5,914,556 | $5,914,556 | $4,731,645 | $1,182,911 | 51 | |||
| 2025 | 610680 | Boston Region | Natick | NATICK- LAKE COCHITUATE PATH | 3 | CMAQ | $3,848,402 | $3,848,402 | $3,078,722 | $769,680 | N/A | |||
Table 3-7
FFYs 2021-25 Transportation Improvement Program Transit Table (MBTA)
| Federal Funding Program | ALI | 2021 | 2022 | 2023 | 2024 | 2025 | FFY21-25 Total (Federal) | FFY21-25 Total (Incl. Match) |
| 5307 | $150,670,497 | $153,246,962 | $155,867,485 | $158,532,819 | $161,243,730 | $779,561,494 | $974,451,867 | |
| Revenue Vehicle Program | 12.12.00 | $97,660,130 | $124,671,267 | $127,291,790 | $129,957,124 | $132,668,035 | $612,248,347 | $765,310,433 |
| Signals/Systems Upgrade Program | 12.63.01 | $48,000,000 | $27,136,607 | $27,136,607 | $27,136,607 | $27,136,607 | $156,546,427 | $195,683,034 |
| Stations and Facilities Program | 12.34.00 | $5,010,366 | $1,439,088 | $1,439,088 | $1,439,088 | $1,439,088 | $10,766,720 | $13,458,400 |
| 5337 | $147,760,137 | $150,286,835 | $152,856,739 | $155,470,590 | $158,129,137 | $764,503,437 | $955,629,296 | |
| Bridge & Tunnel Program | 12.24.05 | $23,927,558 | $42,698,292 | $42,698,292 | $42,698,292 | $42,698,292 | $194,720,727 | $243,400,909 |
| Revenue Vehicle Program | 12.12.00 | $0 | $16,986,118 | $16,986,118 | $16,986,118 | $16,986,118 | $67,944,474 | $84,930,592 |
| Signals/Systems Upgrade Program | 12.63.01 | $62,601,253 | $28,932,637 | $28,932,637 | $28,932,637 | $28,932,637 | $178,331,803 | $222,914,753 |
| Stations and Facilities Program | 12.34.00 | $61,231,326 | $61,669,786 | $64,239,691 | $66,853,541 | $69,512,089 | $323,506,434 | $404,383,042 |
| 5339 | $6,758,840 | $6,874,416 | $6,991,968 | $7,111,531 | $7,233,138 | $34,969,893 | $43,712,367 | |
| Bus Program | 11.14.00 | $6,758,840 | $6,874,416 | $6,991,968 | $7,111,531 | $7,233,138 | $34,969,893 | $43,712,367 |
| FY21-25 FTA Formula Funding | $305,189,473 | $310,408,213 | $315,716,193 | $321,114,940 | $326,606,005 | $1,579,034,824 | $1,973,793,530 | |
| 5309 - GLX | $100,000,000 | $46,121,000 | $0 | $0 | $0 | $146,121,000 | $292,242,000 | |
| Green Line Extension | 13.23.03 | $100,000,000 | $46,121,000 | $0 | $0 | $0 | $146,121,000 | $292,242,000 |
| Other Federal | $100,570,000 | $526,000,000 | $115,680,000 | $80,000,000 | $0 | $822,250,000 | $822,250,000 | |
| Passenger Ferry Grant Program | 12.33.05 | $0 | $0 | $0 | $0 | $0 | $0 | $0 |
| PTC/ATC/Fiber - RRIF Financing | 12.63.01 | $100,570,000 | $526,000,000 | $115,680,000 | $80,000,000 | $0 | $822,250,000 | $822,250,000 |
| FY21-25 Total Federal Funding | $505,759,473 | $882,529,213 | $431,396,193 | $401,114,940 | $326,606,005 | $2,547,405,824 | $3,088,285,530 | |
| Note: | ||||||||
| FTA formula funds (5307, 5337 and 5339) are based on estimated apportionments. | ||||||||
| TIP programs and projects are based on a draft FY21-24 CIP as of Apr-20. Adjustments will be made to federal projects and budgets as the CIP process is finalized. | ||||||||
| The Activity Line Item (ALI) codes are preliminary only and generally reflects the bulk of the TIP program. Within a program there may be several different ALI codes used. | ||||||||
| Green Line Extension funding is based on the FFGA. $550M has been obligated to date; $300M has been programmed in FFY20. | ||||||||
| RRIF loan funding for the PTC/ATC/Fiber Resiliency project is based on the planned drawdown schedule as of Apr-20, and is subject to change. | ||||||||
Table 3-8
FFYs 2021-25 Transportation Improvement Program Transit Table (MWRTA)
| FTA Program | Project Number | Project Title | Notes | Bond Cap | State | 100% State | Federal | FTA | Section 5307 | Federal | FTA | Other Federal Transit | Operating | Additional State Assistance | State Contract Assistance | Federal | FHWA | Transportation Development Credits | Total |
| FFY 2021 | |||||||||
| RTA Facility and Vehicle Maintenance | RTD0008907 | Terminal, Intermodal (Transit) - Framingham Commuter Rail Station (FCRS) | Framingham Intermodal Enhancements/Improvements; MWRTA applies for competitive funding for this line item as well and will reduce the RTACAP request upon award of additional federal funds. | $34,000 | $34,000 | $0 | $0 | $0 | $68,000 |
| RTA Facility and Vehicle Maintenance | RTD0008889 | Terminal, Intermodal (Transit) - Blandin | 12/3/2015 update CIP Project: State of Good Repair / Notes: Blandin Avenue Call Center Technology Updates |
$350,000 | $350,000 | $0 | $0 | $0 | $700,000 |
| RTA Facility and System Modernization | RTD0008891 | Technology Support/Capital Outreach | Mobility Management; IT; Call Center; Travel Training Enhancements/Improvements; MWRTA applies for competitive funding for this line item as well and will reduce the RTACAP request upon award of additional federal funds. | $100,000 | $100,000 | $0 | $0 | $0 | $200,000 |
| RTD0008888 | Non-Fixed Route ADA Paratransit Service | $0 | $1,600,000 | $0 | $400,000 | $0 | $2,000,000 | ||
| RTA Replacement Facilities | RTD0008993 | Front Entrance Blandin (FEB) Project | ** Removed 5339 Statewide and moved to RTACAP - MWRTA Front Entrance Blandin (FEB) Renovation Project - $1,875,000 of Section 5339 Statewide funding request with $625k TDC - Toll Credit Match | $975,000 | $0 | $0 | $0 | $625,000 | $975,000 |
| RTA Vehicle Replacement | RTD0009174 | Buy Replacement Van | FY20 5339 Statewide Funds (previously supported by 5310 MAP) Replacement Vehicles Combination of Compressed Natural Gas (CNG) Vehicles to include Types: 8 x Ds (w/CNG Option), 6 x Es in order to maintain State of Good Repair (SOGR) at the MWRTA. MassDOT supported 2 x Es via the FY20 5310 MAP Program in FY20. | $0 | $0 | $2,237,250 | $0 | $559,250 | $2,237,250 |
| RTA Facility and System Modernization | TBD | AFC Transition | $92,500 | $0 | $0 | $0 | $0 | $ 92,500 | |
| RTA Facility and Vehicle Maintenance | RTD0008997 | Terminal, Intermodal (Transit) - Framingham Commuter Rail Station (FCRS) | Framingham Intermodal Enhancements/Improvements; MWRTA applies for competitive funding for this line item as well and will reduce the RTACAP request upon award of additional federal funds. | $12,500 | $12,500 | $0 | $0 | $0 | $25,000 |
| RTA Facility and System Modernization | TBD | MWRTA Modernization - Fleet Electrification | Electrification costs; Change to 1 pilot vehicle + charger. Defer all facility improvements and additional deployments. | $130,000 | $0 | $0 | $0 | $0 | $130,000 |
| FFY 2022 | |||||||||
| RTA Replacement Facilities | RTD0008906 | Terminal, Intermodal (Transit) - Framingham Commuter Rail Station (FCRS) | Framingham Intermodal Enhancements/Improvements; MWRTA applies for competitive funding for this line item as well and will reduce the RTACAP request upon award of additional federal funds. | $34,000 | $34,000 | $0 | $0 | $0 | $68,000 |
| RTA Facility and System Modernization | RTD0008894 | Terminal, Intermodal (Transit) - Blandin | Facility and System Modernization | $250,000 | $250,000 | $0 | $0 | $0 | $500,000 |
| RTA Facility and System Modernization | RTD0008895 | Technology Support/Capital Outreach | Mobility Management; IT; Call Center; Travel Training Enhancements/Improvements; MWRTA applies for competitive funding for this line item as well and will reduce the RTACAP request upon award of additional federal funds. | $150,000 | $150,000 | $0 | $0 | $0 | $300,000 |
| RTA Vehicle Replacement | TBD | Buy Replacement Van | FY20 5339 Statewide Funds (previously supported by 5310 MAP) Replacement Vehicles Combination of Compressed Natural Gas (CNG) Vehicles to include Types: 7 x Ds (w/CNG Option), 3 x Es | $493,000 | $493,000 | $0 | $0 | $0 | $985,000 |
| RTD0008892 | Non-Fixed Route ADA Paratransit Service | $0 | $1,600,000 | $0 | $400,000 | $0 | $2,000,000 | ||
| RTA Replacement Facilities | TBD | Front Entrance Blandin (FEB) Project | $721,100 | $0 | $0 | $0 | $0 | $ 721,100 | |
| RTA Facility and System Modernization | TBD | AFC Transition | $250,000 | $0 | $0 | $0 | $0 | $ 250,000 | |
| FFY 2023 | |||||||||
| RTA Facility and Vehicle Maintenance | RTD0008905 | Terminal, Intermodal (Transit) - Framingham Commuter Rail Station (FCRS) | Framingham Intermodal Enhancements/Improvements; MWRTA applies for competitive funding for this line item as well and will reduce the RTACAP request upon award of additional federal funds. | $34,000 | $34,000 | $0 | $0 | $0 | $68,000 |
| RTA Facility and Vehicle Maintenance | RTD0008897 | Acquisition of Bus Support Equipment/Facilities | $225,000 | $225,000 | $0 | $0 | $0 | $450,000 | |
| RTA Facility and System Modernization | RTD0008898 | Technology Support/Capital Outreach | Mobility Management; IT; Call Center; Travel Training Enhancements/Improvements; MWRTA applies for competitive funding for this line item as well and will reduce the RTACAP request upon award of additional federal funds. | $150,000 | $150,000 | $0 | $0 | $0 | $300,000 |
| RTA Facility and Vehicle Maintenance | RTD0008899 | Terminal, Intermodal (Transit) - Blandin | Blandin Hub Enhancements/Improvements | $250,000 | $250,000 | $0 | $0 | $0 | $500,000 |
| RTA Vehicle Replacement | TBD | Buy Replacement Van | FY20 5339 Statewide Funds (previously supported by 5310 MAP) Replacement Vehicles Combination of Compressed Natural Gas (CNG) Vehicles to include Types: 6 x Ds (w/CNG Option), 4 x Es | $591,000 | $591,000 | $0 | $0 | $295,500 | $1,182,000 |
| RTD0008896 | Non-Fixed Route ADA Paratransit Service | $0 | $1,600,000 | $0 | $400,000 | $0 | $2,000,000 | ||
| RTA Facility and System Modernization | TBD | AFC Transition | $250,000 | $0 | $0 | $0 | $0 | $ 250,000 | |
| FFY 2024 | |||||||||
| RTA Facility and Vehicle Maintenance | RTD0008901 | Acquisition of Bus Support Equipment/Facilities | $225,000 | $225,000 | $0 | $0 | $0 | $450,000 | |
| RTA Facility and System Modernization | RTD0008902 | Technology Support/Capital Outreach | Mobility Management; IT; Call Center; Travel Training Enhancements/Improvements; MWRTA applies for competitive funding for this line item as well and will reduce the RTACAP request upon award of additional federal funds. | $150,000 | $150,000 | $0 | $0 | $0 | $300,000 |
| RTA Replacement Facilities | RTD0008903 | Terminal, Intermodal (Transit) - Blandin | Blandin Hub Enhancements/Improvements | $250,000 | $250,000 | $0 | $0 | $0 | $500,000 |
| RTA Facility and Vehicle Maintenance | RTD0008904 | Terminal, Intermodal (Transit) - Framingham Commuter Rail Station (FCRS) | Intermodal at the Framingham Commuter Rail Station (FCRS) Enhancements/Improvements;MWRTA applies for competitive funding for this line item as well and will reduce the RTACAP request upon award of additional federal funds. | $34,000 | $34,000 | $0 | $0 | $0 | $68,000 |
| RTD0008900 | Non-Fixed Route ADA Paratransit Service | $0 | $1,600,000 | $0 | $400,000 | $0 | $2,000,000 | ||
| FFY 2025 | |||||||||
| RTA Facility and Vehicle Maintenance | RTD0008994 | Acquisition of Bus Support Equipment/Facilities | Acquisition of Bus Support Equip/Facilities; Additional Bus Accessories; MWRTA applies for competitive funding for this line item as well and will reduce the RTACAP request upon award of additional federal funds. | $225,000 | $225,000 | $0 | $0 | $0 | $450,000 |
| RTA Facility and Vehicle Maintenance | RTD0008995 | Technology Support/Capital Outreach | Mobility Management; IT; Call Center; Travel Training Enhancements/Improvements; Fare Collection Transition; MWRTA applies for competitive funding for this line item as well and will reduce the RTACAP request upon award of additional federal funds. 12/3/2015 update CIP Project: State of Good Repair / Notes: Blandin Avenue Call Center Technology Updates | $172,000 | $172,000 | $0 | $0 | $0 | $345,200 |
| RTA Facility and Vehicle Maintenance | RTD0008996 | Terminal, Intermodal (Transit) - Blandin | Blandin Hub Enhancements/Improvements; MWRTA applies for competitive funding for this line item as well and will reduce the RTACAP request upon award of additional federal funds. 12/3/2015 CIP Project: State of Good Repair; Miscellaneous improvements to existing property (landscape, fence, lights, asphalt, cameras, security devices, benches, passenger amenities. | $250,000 | $250,000 | $0 | $0 | $0 | $500,000 |
| RTD0008998 | Non-Fixed Route ADA Paratransit Service | $0 | $1,600,000 | $0 | $400,000 | $0 | $2,000,000 | ||
| RTA Vehicle Replacement | TBD | Buy Replacement Van | FY20 5339 Statewide Funds (previously supported by 5310 MAP) Replacement Vehicles Combination of Compressed Natural Gas (CNG) Vehicles to include Types: 8 x Ds (w/CNG Option), 6 x Es | $616,000 | $616,000 | $0 | $0 | $308,000 | $1,232,000 |
Table 3-9
FFYs 2021-25 Transportation Improvement Program Transit Table (CATA)
| FTA Program | Project Number | Project Title | Notes | Bond Cap | State | 100% State | Federal | FTA | Section 5307 | Other | Municipal and Local | Transit | Total |
| FFY 2021 | |||||||
| RTA Facility and System Modernization | RTD0008436 | Acquire - Shop Equipment/Computers/Software | $13,750 | $55,000 | $0 | $68,750 | |
| RTA Vehicle Replacement | RTD0008438 | Replace 30' Buses/Trolleys | Replacement of one 2001 and one 2003 rubber-tire trolley bus | $500,000 | $0 | $0 | $500,000 |
| RTA Facility and Vehicle Maintenance | RTD0008441 | Buy Assoc. Capital Maintenance Items | Miscellaneous small capital items | $15,000 | $0 | $0 | $15,000 |
| RTD0008431 | Preventive Maintenance | $0 | $285,000 | $71,250 | $356,250 | ||
| FFY 2022 | |||||||
| RTA Facility and System Modernization | RTD0008433 | Acquire - Shop Equipment/Computers/Software | $13,750 | $55,000 | $0 | $68,750 | |
| RTD0008432 | Preventive Maintenance | $0 | $285,000 | $71,250 | $356,250 | ||
| FFY 2023 | |||||||
| RTA Vehicle Replacement | RTD0008435 | Replace Two 30-FT Buses | Replacement of two 30-ft low floor buses that will have reached the end of their useful life | $175,000 | $700,000 | $0 | $875,000 |
| RTA Facility and Vehicle Maintenance | RTD0008443 | Buy Assoc. Capital Maintenance Items | Miscellaneous small capital items | $15,000 | $0 | $0 | $15,000 |
| RTD0008434 | Preventive Maintenance | $0 | $285,000 | $71,250 | $356,250 | ||
| FFY 2024 | |||||||
| RTA Facility and Vehicle Maintenance | RTD0008440 | Repave Parking Lot | State match to repave parking area | $20,000 | $80,000 | $0 | $100,000 |
| RTA Facility and Vehicle Maintenance | RTD0008444 | Buy Assoc. Capital Maintenance Items | Miscellaneous small capital items | $15,000 | $0 | $0 | $15,000 |
| RTA Facility and System Modernization | RTD0008952 | AFC 2.0 | AFC 2.0 for RTAs | $300,000 | $0 | $0 | $300,000 |
| RTD0008439 | Preventive Maintenance | $0 | $285,000 | $71,250 | $356,250 | ||
| FFY 2025 | |||||||
| RTA Facility and Vehicle Maintenance | RTD0008951 | Acquire Small Capital | $28,750 | $55,000 | $0 | $83,750 | |
| RTA Vehicle Replacement | RTD0008953 | Replace 1 30' bus | Replace one 30' bus (2012) | $225,000 | $225,000 | $0 | $450,000 |
| RTD0008950 | Preventive Maintenance | $0 | $285,000 | $71,250 | $356,250 | ||
Proponent: This field lists the primary advocate for each project, who is responsible for seeing the project through to completion.
ID Number: This number references the project’s identification number in MassDOT’s project-tracking system.
Project Type: This field provides the type of project programmed. For those projects programmed with Regional Target funds (projects listed in Section 1A of the TIP tables), the projects are categorized according to the MPO’s six investment categories (Bicycle and Pedestrian, Complete Streets, Intersection Improvements, Major Infrastructure, Community Connections, and Transit Modernization). For those projects programmed directly by MassDOT (projects listed in Sections 1B, 2A, 2B, and 2C), MassDOT’s STIP Program categories are applied.
Cost: This is the total project cost as programmed in the TIP across all fiscal years, including years outside of FFYs 2021–25.
Funding Source: This identifies whether a project is funded using the MPO’s Regional Target funds or MassDOT’s statewide highway funds.
Scoring Summary: This table shows the number of points awarded to the project across each of the MPO’s project evaluation categories. MPO staff has not evaluated all projects in the TIP; staff only evaluates projects that are being considered for funding with the MPO’s Regional Target funds. The field definitions for the tables are as follows:
Project Description: The description of the project is based, in part, on the written description of the project on MassDOT’s Project Information website. In some cases, these descriptions have been modified to clarify the details of the projects. Projects evaluated by the MPO tend to have more detailed descriptions, as more complete project documentation was provided to MPO staff for these projects.
Funding Summary: Funding tables are included for each project and show the following information:
For more information on all projects please visit MassDOT’s Project Information website, https://hwy.massdot.state.ma.us/projectinfo/projectinfo.asp, the Boston Region MPO’s website, www.bostonmpo.org, or contact Matt Genova, TIP Manager, at mgenova@ctps.org.
Proponent: Acton
ID Number: 608229
Project Type: Intersection Improvements
Cost: $14,687,418
Funding Source: Regional Target Funds
Category |
Safety |
Sys Pres |
CM/M |
CA/SC |
TE |
EV |
Total |
Score |
15 out of 30 |
8 out of 29 |
10 out of 29 |
8 out of 16 |
0 out of 12 |
4 out of 18 |
45 out of 134 |
This project involves improvements to address traffic congestion and the safety of pedestrians and bicyclists through the addition of turning lanes and the reduction and consolidation of curb cuts. Full accommodations for vehicular, bicycle, and pedestrian travel and upgraded signage and wayfinding will also be established to improve accessibility for all users who travel to and from the nearby businesses.
Source |
(FFY) 2021 |
2022 |
2023 |
2024 |
2025 |
Total |
Federal Funds |
--- |
$11,749,934 |
--- |
--- |
--- |
$11,749,934 |
Non-Federal Funds |
--- |
$2,937,484 |
--- |
--- |
--- |
$2,937,484 |
Total Funds |
--- |
$14,687,418 |
--- |
--- |
--- |
$14,687,418 |
Proponent: Acton
ID Number: 607748
Project Type: Intersection Improvements
Cost: $4,382,329
Funding Source: Statewide Highway Funds
This is a MassDOT-prioritized project and is therefore not directly evaluated using the MPO’s TIP scoring criteria.
The project will make upgrades at the intersection to improve safety. The upgrades will include signs, pavement markings, and traffic signals as identified through a Road Safety Audit process in the Town of Acton.
Source |
(FFY) 2021 |
2022 |
2023 |
2024 |
2025 |
Total |
Federal Funds |
$3,944,096 |
--- |
--- |
--- |
--- |
$3,944,096 |
Non-Federal Funds |
$438,233 |
--- |
--- |
--- |
--- |
$438,233 |
Total Funds |
$4,382,329 |
--- |
--- |
--- |
--- |
$4,382,329 |
Proponent: MassDOT
ID Number: 610722
Project Type: Non-Interstate Pavement
Cost: $ 8,124,073
Funding Source: Statewide Highway Funds
This is a MassDOT-prioritized project and is therefore not directly evaluated using the MPO’s TIP scoring criteria.
This project includes pavement preservation work on Route 2 in Acton, Boxborough, and Littleton.
Source |
(FFY) 2021 |
2022 |
2023 |
2024 |
2025 |
Total |
Federal Funds |
--- |
--- |
--- |
--- |
$6,499,258 |
$6,499,258 |
Non-Federal Funds |
--- |
--- |
--- |
--- |
$1,624,815 |
$1,624,815 |
Total Funds |
--- |
--- |
--- |
--- |
$8,124,073 |
$8,124,073 |
Proponent: MassDOT
ID Number: 609531
Project Type: Roadway Reconstruction
Cost: $1,112,484
Funding Source: Statewide Highway Funds
This is a MassDOT-prioritized project and is therefore not directly evaluated using the MPO’s TIP scoring criteria.
This project will make upgrades to promote safety along the roadways surrounding Stratton Elementary School in Arlington through the Safe Routes to Schools program.
Source |
(FFY) 2021 |
2022 |
2023 |
2024 |
2025 |
Total |
Federal Funds |
--- |
--- |
--- |
$889,987 |
--- |
$889,987 |
Non-Federal Funds |
--- |
--- |
--- |
$222,497 |
--- |
$222,497 |
Total Funds |
--- |
--- |
--- |
$1,112,484 |
--- |
$1,112,484 |
Proponent: Ashland
ID Number: 608436
Project Type: Intersection Improvements
Cost: $1,316,339
Funding Source: Regional Target Funds
Category |
Safety |
Sys Pres |
CM/M |
CA/SC |
TE |
EV |
Total |
Score |
12 out of 30 |
10 out of 29 |
5 out of 29 |
2 out of 16 |
1 out of 12 |
8 out of 18 |
38 out of 134 |
The primary purpose of the project is to improve the safety features for the roadway corridors of Cherry Street and Main Street in order to establish a Federal Railroad Administration Quiet Zone surrounding the railroad crossings on those two roadways. This goal will primarily be accomplished through the installation of roadway medians and the enhancement of existing railroad crossing signals and gates. In addition, the project addresses a critical gap in the pedestrian sidewalk network through the construction of new sidewalks. The project’s other goals include improving the existing roadway condition through pavement reconstruction and enhancing stormwater drainage in the project area.
Source |
(FFY) 2021 |
2022 |
2023 |
2024 |
2025 |
Total |
Federal Funds |
--- |
--- |
--- |
$1,053,071 |
--- |
$1,053,071 |
Non-Federal Funds |
--- |
--- |
--- |
$263,268 |
--- |
$263,268 |
Total Funds |
--- |
--- |
--- |
$1,316,339 |
--- |
$1,316,339 |
Proponent: MassDOT
ID Number: 608443
Project Type: Intersection Improvements
Cost: $2,287,523
Funding Source: Regional Target Funds
Category |
Safety |
Sys Pres |
CM/M |
CA/SC |
TE |
EV |
Total |
Score |
17 out of 30 |
4 out of 29 |
9 out of 29 |
4 out of 16 |
1 out of 12 |
1 out of 18 |
36 out of 134 |
The primary purpose of this project is to reduce angled collisions and improve the pavement condition of the intersection on Route 2A at Willow Road and Bruce Street. This goal will primarily be accomplished by reconstructing the skewed intersection and adding a new signal system. In addition, the project will also address safety for pedestrians and bicyclists through the provision of 5-foot wide shoulders and the addition of crosswalks.
Source |
(FFY) 2021 |
2022 |
2023 |
2024 |
2025 |
Total |
Federal Funds |
$1,930,018 |
--- |
--- |
--- |
--- |
$1,930,018 |
Non-Federal Funds |
$357,505 |
--- |
--- |
--- |
--- |
$357,505 |
Total Funds |
$2,287,523 |
--- |
--- |
--- |
--- |
$2,287,523 |
Proponent: Bedford
ID Number: 607738
Project Type: Bicycle and Pedestrian
Cost: $7,331,040
Funding Source: Regional Target Funds
Category |
Safety |
Sys Pres |
CM/M |
CA/SC |
TE |
EV |
Total |
Score |
7 out of 30 |
13 out of 29 |
15 out of 29 |
7 out of 16 |
1 out of 12 |
4 out of 18 |
47 out of 134 |
The Minuteman Bikeway currently ends at Depot Park, in Bedford, near the intersection of South Road and Loomis Street. This project would extend the bikeway by making a 1,665 foot portion of Railroad Avenue accessible to bikes and by constructing 8,800 feet of bikeway on the Reformatory Branch Trail, from Railroad Avenue past Concord Road to Wheeler Drive, near the Bedford/Concord town line. As a part of the Railroad Avenue reconstruction, sidewalks, bike accommodations, new drainage, pavement markings and signs, and defined curb cuts will be constructed.
Source |
(FFY) 2021 |
2022 |
2023 |
2024 |
2025 |
Total |
Federal Funds |
--- |
--- |
$5,864,382 |
--- |
--- |
$5,864,382 |
Non-Federal Funds |
--- |
--- |
$1,466,208 |
--- |
--- |
$1,466,208 |
Total Funds |
--- |
--- |
$7,331,040 |
--- |
--- |
$7,331,040 |
Proponent: Bellingham
ID Number: 608887
Project Type: Complete Streets
Cost: $6,132,594
Funding Source: Regional Target Funds
Category |
Safety |
Sys Pres |
CM/M |
CA/SC |
TE |
EV |
Total |
Score |
12 out of 30 |
12 out of 29 |
12 out of 29 |
5 out of 16 |
0 out of 12 |
4 out of 18 |
45 out of 134 |
The primary purpose of this project is to improve the poor curb reveal pavement condition and the lack of facilities for pedestrians and bicyclists. The project will include full-depth pavement reclamation and the reconstruction of existing sidewalks with 5-foot shoulders to accommodate bicycle travel. In addition, pedestrian signal poles and intersection warning signage will be added to improve pedestrian safety and reduce rear-end collisions on Easy Street.
Source |
(FFY) 2021 |
2022 |
2023 |
2024 |
2025 |
Total |
Federal Funds |
--- |
$4,906,075 |
--- |
--- |
--- |
$4,906,075 |
Non-Federal Funds |
--- |
$1,226,519 |
--- |
--- |
--- |
$1,226,519 |
Total Funds |
--- |
$6,132,594 |
--- |
--- |
--- |
$6,132,594 |
Proponent: MassDOT
ID Number: 608911
Project Type: Bicycle and Pedestrian
Cost: $1,529,472
Funding Source: Statewide Highway Funds
This is a MassDOT-prioritized project and is therefore not directly evaluated using the MPO’s TIP scoring criteria.
Safe Routes to School improvements at Wellington Elementary School
Source |
(FFY) 2021 |
2022 |
2023 |
2024 |
2025 |
Total |
Federal Funds |
$1,223,578 |
--- |
--- |
--- |
--- |
$1,223,578 |
Non-Federal Funds |
$305,894 |
--- |
--- |
--- |
--- |
$305,894 |
Total Funds |
$1,529,472 |
--- |
--- |
--- |
--- |
$1,529,472 |
Proponent: Beverly
ID Number: 608348
Project Type: Complete Streets
Cost: $8,248,361
Funding Source: Regional Target Funds
Category |
Safety |
Sys Pres |
CM/M |
CA/SC |
TE |
EV |
Total |
Score |
13 out of 30 |
14 out of 29 |
16 out of 29 |
9 out of 16 |
4 out of 12 |
10 out of 18 |
66 out of 134 |
The project involves rehabilitation of pavement and sidewalks along the Bridge Street corridor from the Danvers town line to River Street, excluding the Hall Whitaker drawbridge. The project includes cross section improvements to accommodate on-street parking and on-street bicycle accommodations. Existing traffic signal equipment at the intersection of Bridge Street at Livingstone Avenue will be upgraded, and new traffic signals will be installed at the intersection of Bridge Street with Kernwood Avenue and the intersection of Bridge Street with River Street. Under the proposed project, continuous cement concrete sidewalks with vertical granite curb will be provided along both sides of the roadway for the full length of the project. As part of the proposed project, a 7-foot wide parking shoulder will be provided on the eastbound side of the roadway to prevent vehicles from parking on the sidewalk. Additionally, a 5-foot wide bicycle lanes shoulder will be provided along the corridor. Minor realignments will be performed at the intersections of Bridge Street with Cressy Street, County Way/Bates Park Avenue, and Eastern Avenue/Dolloff Avenue.
Source |
(FFY) 2021 |
2022 |
2023 |
2024 |
2025 |
Total |
Federal Funds |
--- |
--- |
$6,598,689 |
--- |
--- |
$6,598,689 |
Non-Federal Funds |
--- |
--- |
$1,649,672 |
--- |
--- |
$1,649,672 |
Total Funds |
--- |
--- |
$8,248,361 |
--- |
--- |
$8,248,361 |
Proponent: MassDOT
ID Number: 606902
Project Type: Bridge
Cost: $6,899,839
Funding Source: Statewide Highway Funds
This is a MassDOT-prioritized project and is therefore not directly evaluated using the MPO’s TIP scoring criteria.
This project will involve the reconstruction of this bridge which is currently rated at 5, 5, and 4.
Source |
(FFY) 2021 |
2022 |
2023 |
2024 |
2025 |
Total |
Federal Funds |
--- |
--- |
$5,519,871 |
--- |
--- |
$5,519,871 |
Non-Federal Funds |
--- |
--- |
1,379,968 |
--- |
--- |
1,379,968 |
Total Funds |
--- |
--- |
$6,899,839 |
--- |
--- |
$6,899,839 |
Proponent: MassDOT
ID Number: 608197
Project Type: Bridge
Cost: $4,678,193
Funding Source: Statewide Highway Funds
This is a MassDOT-prioritized project and is therefore not directly evaluated using the MPO’s TIP scoring criteria.
Superstructure Replacement, B-16-107, Canterbury Street over Amtrak/MBTA tracks
Source |
(FFY) 2021 |
2022 |
2032 |
2024 |
2025 |
Total |
Federal Funds |
--- |
--- |
$3,742,554 |
--- |
--- |
$3,742,554 |
Non-Federal Funds |
--- |
--- |
$935,639 |
--- |
--- |
$935,639 |
Total Funds |
--- |
--- |
$4,678,193 |
--- |
--- |
$4,678,193 |
Proponent: MassDOT
ID Number: 604173
Project Type: Bridge
Cost: $176,318,433
Funding Source: Statewide Highway Funds
This is a MassDOT-prioritized project and is therefore not directly evaluated using the MPO’s TIP scoring criteria.
The North Washington Street Bridge is a historic structure constructed in 1898. The bridge consists of ten approach spans and a swing span, which is not operational. The bridge is structurally deficient and is posted as weight restricted. There have been extensive emergency repairs done to the bridge in the past few years. Currently the two center lanes on the swing span are closed due to steel deterioration. The City of Boston proposes to replace the bridge. The existing granite/concrete bridge piers on the approach spans will be replaced with reinforced concrete V piers and continuous trapezoidal steel box girders. The proposed deck will provide for increased bicycle and pedestrian accommodations between Kearney Square and Rutherford Avenue. This project is funded over five federal fiscal years (FFYs 2017-21). The total estimated cost of the project is $144,066,616. Of that amount, $6,400,000 was funded in FFY 2017 and the remaining $137,666,616 is funded in FFYs 2018-21.
Source |
(FFY) 2021 |
2022 |
2023 |
2024 |
2025 |
Total |
Federal Funds |
$24,311,723 |
$23,060,582 |
--- |
--- |
--- |
$47,372,305 |
Non-Federal Funds |
$6,077,931 |
$5,765,145 |
--- |
--- |
--- |
$11,843,076 |
Total Funds |
$30,389,654 |
$28,825,727 |
--- |
--- |
--- |
$59,215,381 |
Proponent: MassDOT
ID Number: 610537
Project Type: Roadway Reconstruction
Cost: $1,086,421
Funding Source: Statewide Highway Funds
This is a MassDOT-prioritized project and is therefore not directly evaluated using the MPO’s TIP scoring criteria.
This project will make upgrades to promote safety along the roadways surrounding Ellis Elementary School in Boston through the Safe Routes to Schools program..
Source |
(FFY) 2021 |
2022 |
2023 |
2024 |
2025 |
Total |
Federal Funds |
--- |
--- |
--- |
$869,137 |
--- |
$869,137 |
Non-Federal Funds |
--- |
--- |
--- |
$217,284 |
--- |
$217,284 |
Total Funds |
--- |
--- |
--- |
$1,086,421 |
--- |
$1,086,421 |
Proponent: Boston
ID Number: 606453
Project Type: Complete Streets
Cost: $9,192,999
Funding Source: Regional Target Funds
Category |
Safety |
Sys Pres |
CM/M |
CA/SC |
TE |
EV |
Total |
Score |
7 out of 30 |
6 out of 29 |
15 out of 29 |
12 out of 16 |
8 out of 12 |
12 out of 18 |
60 out of 134 |
This roadway improvement project will enhance pedestrian mobility and safety by providing neck downs at intersections. In addition, exclusive bike lanes in both directions will be established along Boylston Street to encourage local and regional bicycle travel. The project also involves an upgrade of the existing geometric layout and old signal equipment to reduce vehicular congestion and increase overall safety.
Source |
(FFY) 2021 |
2022 |
2023 |
2024 |
2025 |
Total |
Federal Funds |
--- |
--- |
$7,354,399 |
--- |
--- |
$7,354,399 |
Non-Federal Funds |
--- |
--- |
$1,775,600 |
--- |
--- |
$1,775,600 |
Total Funds |
--- |
--- |
$9,129,999 |
--- |
--- |
$9,129,999 |
Proponent: MassDOT
ID Number: 610806
Project Type: Roadway Improvements
Cost: $513,216
Funding Source: Statewide Highway Funds
This is a MassDOT-prioritized project and is therefore not directly evaluated using the MPO’s TIP scoring criteria.
This project will make drainage and stormwater upgrades along Boston’s Inner Harbor.
Source |
(FFY) 2021 |
2022 |
2023 |
2024 |
2025 |
Total |
Federal Funds |
--- |
--- |
$410,573 |
--- |
--- |
$410,573 |
Non-Federal Funds |
--- |
--- |
$102,643 |
--- |
--- |
$102,643 |
Total Funds |
--- |
--- |
$513,216 |
--- |
--- |
$513,216 |
Proponent: MassDOT
ID Number: 607759
Project Type: Intersection Improvements
Cost: $3,788,711
Funding Source: Statewide Highway Funds
This is a MassDOT-prioritized project and is therefore not directly evaluated using the MPO’s TIP scoring criteria.
Project Description
The project will make upgrades at the intersection to improve safety. The upgrades will include signs, pavement markings, and traffic signals as identified through a Road Safety Audit process.
Source |
(FFY) 2021 |
2022 |
2023 |
2024 |
2025 |
Total |
Federal Funds |
--- |
$3,180,602 |
--- |
--- |
--- |
$3,180,602 |
Non-Federal Funds |
--- |
$608,109 |
--- |
--- |
--- |
$608,109 |
Total Funds |
--- |
$3,788,711 |
--- |
--- |
--- |
$3,788,711 |
Proponent: Boston
ID Number: 608943
Project Type: Bicycle and Pedestrian
Cost: $5,571,629
Funding Source: Statewide Highway Funds
Category |
Safety |
Sys Pres |
CM/M |
CA/SC |
TE |
EV |
Total |
Score |
11 out of 30 |
4 out of 29 |
9 out of 29 |
10 out of 16 |
7 out of 12 |
1 out of 18 |
42 out of 134 |
This project will provide the final northern link of the Neponset River Greenway with the addition of approximately 0.77 miles of 10-foot paved, shared-use path between Tenean Beach and Morrissey Boulevard. The extension of the greenway will improve accessibility for pedestrian and bicycle transportation to Boston from Readville, Hyde Park, Milton, Mattapan, and Dorchester and will provide ADA-accessible connections to MBTA bus Routes 201 and 202 and the Savin Hill and Fields Corner MBTA stations. This project was evaluated using the MPO’s scoring criteria because it was considered for funding using Regional Target funds. MassDOT funded the project, however.
Source |
(FFY) 2021 |
2022 |
2023 |
2024 |
2025 |
Total |
Federal Funds |
--- |
$4,457,303 |
--- |
--- |
--- |
$4,457,303 |
Non-Federal Funds |
--- |
$1,114,326 |
--- |
--- |
--- |
$1,114,326 |
Total Funds |
--- |
$5,571,629 |
--- |
--- |
--- |
$5,571,629 |
Proponent: Boston
ID Number: 606226
Project Type: Major Infrastructure
Cost: $146,377,974
Funding Source: Regional Target Funds
This project is funded using Regional Target funds, but was not evaluated using the MPO’s TIP scoring criteria.
The reconstruction of Rutherford Avenue from Sullivan Square to the North Washington Street Bridge will make the road a multi-modal urban boulevard corridor. This project will be funded over five years, starting in FFY 2022. The total project cost is estimated to be $146,377,974, and the total funding in the FFYs 2021-25 TIP is $115,640,366. Earmark discretionary funding of $8,578,930 is intended to be used for design of the project. Funding in FFY 2026, to be allocated in the FFYs 2022-26 TIP, will be approximately $30,737,608 in order to make up the entire estimated construction cost.
Source |
(FFY) 2021 |
2022 |
2023 |
2024 |
2025 |
Total |
Federal Funds |
--- |
$8,295,780 |
$27,385,358 |
$21,593,238 |
$35,237,917 |
$92,512,293 |
Non-Federal Funds |
--- |
$2,073,945 |
$6,846,340 |
$5,398,309 |
$8,809,479 |
$23,128,073 |
Total Funds |
--- |
$10,369,725 |
$34,231,698 |
$26,991,547 |
$44,047,396 |
$115,640,366 |
Proponent: MassDOT
ID Number: 606476
Project Type: Major Infrastructure
Cost: $121,677,818
Funding Source: Regional Target and
Statewide Highway Funds
This project is partially funded using Regional Target funds, but was not evaluated using the MPO’s TIP scoring criteria
This project aims to repair the existing deterioration in Sumner Tunnel by reconstructing the roadway pavement, replacing existing jet fans with modern enhancements, and repairing cracking and corrosion on the tunnel’s walls and ceiling. The total cost of this project is $121,677,818, with $22,115,687 in Regional Target funding allocated to the project. The rest of the project is funded using statewide funds.
Source |
(FFY) 2021 |
2022 |
2023 |
2024 |
2025 |
Total |
Federal Funds |
$51,436,655 |
$32,909,759 |
$13,495,840 |
--- |
--- |
$97,842,254 |
Non-Federal Funds |
$12,234,163 |
$8,227,440 |
$3,373,961 |
--- |
--- |
$23,835,564 |
Total Funds |
$63,670,818 |
$41,137,199 |
$16,869,801 |
--- |
--- |
$121,677,818 |
Proponent: MassDOT
ID Number: 608208
Project Type: Interstate Pavement
Cost: $ 23,892,804
Funding Source: Statewide Highway Fund
This is a MassDOT-prioritized project and is therefore not directly evaluated using the MPO’s TIP scoring criteria.
The project is an interstate maintenance resurfacing project on the Southeast Expressway. A preservation treatment or thin-bonded overlay is proposed to extend the pavement service life and improve safety.
Source |
(FFY) 2021 |
2022 |
2023 |
2024 |
2025 |
Total |
Federal Funds |
--- |
$21,503,524 |
--- |
--- |
--- |
$21,503,524 |
Non-Federal Funds |
--- |
$2,389,280 |
--- |
--- |
--- |
$2,389,280 |
Total Funds |
--- |
$23,892,804 |
--- |
--- |
--- |
$23,892,804 |
Proponent: Boston
ID Number: 607888
Project Type: Bicycle and Pedestrian
Cost: $957,509
Funding Source: Statewide Highway Funds
This is a MassDOT-prioritized project and is therefore not directly evaluated using the MPO’s TIP scoring criteria.
This project will construct a new 1,700 foot long multi-use bike/pedestrian pathway from the Muddy River to Maitland Street in Boston. The project will improve access to the Fenway MBTA station and the Yawkey commuter rail station and provide a non-motorized transportation link to key job centers and new mixed-use developments planned for the Fenway area. The Brookline portion of this project was removed from the project scope and will be added to a future Phase II of this project.
Source |
(FFY) 2021 |
2022 |
2023 |
2024 |
2025 |
Total |
Federal Funds |
$766,007 |
--- |
--- |
--- |
--- |
$766,007 |
Non-Federal Funds |
$191,502 |
--- |
--- |
--- |
--- |
$191,502 |
Total Funds |
$957,509 |
--- |
--- |
--- |
--- |
$957,509 |
Proponent: MassDOT
ID Number: 609090
Project Type: Safety Improvements
Cost: $9,568,001
Funding Source: Statewide Highway Funds
This is a MassDOT-prioritized project and is therefore not directly evaluated using the MPO’s TIP scoring criteria.
Highway Lighting System Replacement on Interstate 93, from Neponset Avenue to the Braintree Split
Source |
(FFY) 2021 |
2022 |
2023 |
2024 |
2025 |
Total |
Federal Funds |
--- |
$7,654,401 |
--- |
--- |
--- |
$7,654,401 |
Non-Federal Funds |
--- |
$1,913,600 |
--- |
--- |
--- |
$1,913,600 |
Total Funds |
--- |
$9,568,001 |
--- |
--- |
--- |
$9,568,001 |
Proponent: MassDOT
ID Number: 608498
Project Type: Non-Interstate Pavement
Cost: $7,452,000
Funding Source: Statewide Highway Funds
This is a MassDOT-prioritized project and is therefore not directly evaluated using the MPO’s TIP scoring criteria.
Resurfacing and related work on Route 53
Source |
(FFY) 2021 |
2022 |
2023 |
2024 |
2025 |
Total |
Federal Funds |
--- |
--- |
$5,961,600 |
--- |
--- |
$5,961,600 |
Non-Federal Funds |
--- |
--- |
$1,490,400 |
--- |
--- |
$1,490,400 |
Total Funds |
--- |
--- |
$7,452,000 |
--- |
--- |
$7,452,000 |
Proponent: Cambridge
ID Number: S10786
Project Type: Community Connections
Cost: $160,000
Funding Source: Regional Target Funds
This project received a total score of 22 points when evaluated using the MPO’s Community Connections Program criteria. These criteria are listed in Table A-5.
This project includes the addition of transit signal priority equipment along the Concord Avenue corridor in Cambridge. The goal of the project is to reduce travel times for passengers on MBTA bus routes 72, 74, 75, and 78. This project is funded through the pilot round of the MPO’s Community Connections Program.
Source |
(FFY) 2021 |
2022 |
2023 |
2024 |
2025 |
Total |
Federal Funds |
$128,000 |
--- |
--- |
--- |
--- |
$128,000 |
Non-Federal Funds |
$32,000 |
--- |
--- |
--- |
--- |
$32,000 |
Total Funds |
$160,000 |
--- |
--- |
--- |
--- |
$160,000 |
Proponent: MassDOT
ID Number: 610776
Project Type: Bridge
Cost: $14,418,800
Funding Source: Statewide Highway Funds
This is a MassDOT-prioritized project and is therefore not directly evaluated using the MPO’s TIP scoring criteria.
This project will rehabilitate bridge C-01-031 in Cambridge.
Source |
(FFY) 2021 |
2022 |
2023 |
2024 |
2025 |
Total |
Federal Funds |
--- |
--- |
--- |
--- |
$11,535,040 |
$11,535,040 |
Non-Federal Funds |
--- |
--- |
--- |
--- |
$2,883,760 |
$2,883,760 |
Total Funds |
--- |
--- |
--- |
--- |
$14,418,800 |
$14,418,800 |
Proponent: MBTA
ID Number: 1570
Project Type: Major Infrastructure
Cost: $ 190,000,000
Funding Source: Regional Target Funds
This project is partially funded using Regional Target funds, but was not evaluated using the MPO’s TIP scoring criteria.
The purpose of this project is to improve corridor mobility, boost transit ridership, improve regional air quality, ensure equitable distribution of transit services, and support opportunities for sustainable development. The project will extend the MBTA Green Line from a relocated Lechmere Station in East Cambridge to College Avenue in Medford, with a branch to Union Square in Somerville. FFY 2021 is the sixth and final year of the Boston Region MPO’s funding obligation to the Green Line Extension. The project is expected to be complete by late 2021.
Source |
(FFY) 2021 |
2022 |
2023 |
2024 |
2025 |
Total |
Federal Funds |
$21,676,990 |
--- |
--- |
--- |
--- |
$21,676,990 |
Non-Federal Funds |
$5,419,248 |
--- |
--- |
--- |
--- |
$5,419,248 |
Total Funds |
$27,096,238 |
--- |
--- |
--- |
--- |
$27,096,238 |
Proponent: MassDOT
ID Number: 608482
Project Type: Non-Interstate Pavement
Cost: $8,585,362
Funding Source: Statewide Highway Funds
This is a MassDOT-prioritized project and is therefore not directly evaluated using the MPO’s TIP scoring criteria.
The project consists of resurfacing on Route 28 in Cambridge and Somerville.
Source |
(FFY) 2021 |
2022 |
2023 |
2024 |
2025 |
Total |
Federal Funds |
$6,868,290 |
--- |
--- |
--- |
--- |
$6,868,290 |
Non-Federal Funds |
$1,717,072 |
--- |
--- |
--- |
--- |
$1,717,072 |
Total Funds |
$8,585,362 |
--- |
--- |
--- |
--- |
$8,585,362 |
Proponent: MassDOT
ID Number: 609438
Project Type: Bridge
Cost: $2,714,892
Funding Source: Statewide Highway Funds
This is a MassDOT-prioritized project and is therefore not directly evaluated using the MPO’s TIP scoring criteria.
Bridge replacement, C-02-042, 33V, Revere Court over east branch of the Neponset River
Source |
(FFY) 2021 |
2022 |
2023 |
2024 |
2025 |
Total |
Federal Funds |
--- |
--- |
--- |
$2,171,914 |
--- |
$2,171,914 |
Non-Federal Funds |
--- |
--- |
--- |
$542,978 |
--- |
$542,978 |
Total Funds |
--- |
--- |
--- |
$2,714,892 |
--- |
$2,714,892 |
Proponent: MassDOT
ID Number: 609053
Project Type: Safety Improvements
Cost: $5,238,054
Funding Source: Statewide Highway Funds
This is a MassDOT-prioritized project and is therefore not directly evaluated using the MPO’s TIP scoring criteria.
Highway lighting improvements at Interstate 93 and Interstate 95/Route 128
Source |
(FFY) 2021 |
2022 |
2023 |
2024 |
2025 |
Total |
Federal Funds |
--- |
--- |
$4,190,443 |
--- |
--- |
$4,190,443 |
Non-Federal Funds |
--- |
--- |
$1,047,611 |
--- |
--- |
$1,047,611 |
Total Funds |
--- |
--- |
$5,238,054 |
--- |
--- |
$5,238,054 |
Proponent: MassDOT
ID Number: 608599
Project Type: Roadway Improvements
Cost: $508,879
Funding Source: Statewide Highway Funds
This is a MassDOT-prioritized project and is therefore not directly evaluated using the MPO’s TIP scoring criteria.
The project consists of stormwater drainage improvements along Route 1, Route 1A, and Interstate 95.
Source |
(FFY) 2021 |
2022 |
2023 |
2024 |
2025 |
Total |
Federal Funds |
--- |
$407,103 |
--- |
--- |
--- |
$407,103 |
Non-Federal Funds |
--- |
$101,776 |
--- |
--- |
--- |
$101,776 |
Total Funds |
--- |
$508,879 |
--- |
--- |
--- |
$508,879 |
Proponent: MassDOT
ID Number: 605287
Project Type: Bridge
Cost: $210,617,533
Funding Source: Statewide Highway Funds
This is a MassDOT-prioritized project and is therefore not directly evaluated using the MPO’s TIP scoring criteria.
Route 1 is a vital gateway between Boston and communities to the north. The roadway carries over 65,000 people each day in private vehicles, MBTA buses, and freight trucks. The project will rehabilitate the Tobin Bridge and Chelsea Viaduct, including steel and structural repairs, gutter repairs, and reconstruction of ramps and bridge deck. The Tobin Bridge/Chelsea Curves Rehabilitation Project will keep Route 1 safe for travel which is essential for local and regional mobility. When complete, the project will remove 15% of the structurally deficient bridge deck in the Commonwealth of Massachusetts. This project is funded over four fiscal years (FFYs 2018-21).
Source |
(FFY) 2021 |
2022 |
2023 |
2024 |
2025 |
Total |
Federal Funds |
$23,994,392 |
--- |
--- |
--- |
--- |
$23,994,392 |
Non-Federal Funds |
$5,998,598 |
--- |
--- |
--- |
--- |
$5,998,598 |
Total Funds |
$29,992,990 |
--- |
--- |
--- |
--- |
$29,992,990 |
Proponent: Chelsea
ID Number: 608078
Project Type: Complete Streets
Cost: $10,278,940
Funding Source: Regional Target Funds
Category |
Safety |
Sys Pres |
CM/M |
CA/SC |
TE |
EV |
Total |
Score |
17 out of 30 |
10 out of 29 |
5 out of 29 |
8 out of 16 |
12 out of 12 |
9 out of 18 |
61 out of 134 |
This project will reconstruct of one mile of Broadway. Improvements to the roadway will include surface and subsurface work, including replacement of utilities; construction of a dedicated bike lane along Broadway; and upgrades to the existing sidewalk network, including the installation of ADA compliant ramps at all intersections.
Source |
(FFY) 2021 |
2022 |
2023 |
2024 |
2025 |
Total |
Federal Funds |
--- |
$8,223,152 |
--- |
--- |
--- |
$8,223,152 |
Non-Federal Funds |
--- |
$2,055,788 |
--- |
--- |
--- |
$2,055,788 |
Total Funds |
--- |
$10,278,940 |
--- |
--- |
--- |
$10,278,940 |
Proponent: Chelsea
ID Number: 609532
Project Type: Safety Improvements
Cost: $6,670,001
Funding Source: Statewide Highway Funds
Category |
Safety |
Sys Pres |
CM/M |
CA/SC |
TE |
EV |
Total |
Score |
23 out of 30 |
18 out of 29 |
14 out of 29 |
4 out of 16 |
10 out of 12 |
14 out of 18 |
83 out of 134 |
This project aims to enhance the safety of all users of Broadway in Chelsea while promoting economic activity along the corridor. Improvements to pedestrian and bicycle infrastructure include the widening of sidewalks, installation of tree boxes, and the implementation of dedicated bike or combined bus and bike lanes with protective barrier options. Additionally, the upgrading of signals and pavement markings at each intersection along the corridor will increase safety of pedestrians through higher levels of visual indication while allowing the implementation of transit signal priority for buses and emergency vehicles. This project will upgrade the entire corridor to ADA compliance and allow for more efficient on-boarding and off-boarding of MBTA bus patrons. This project was evaluated using the MPO’s scoring criteria because it was considered for funding using Regional Target funds. MassDOT funded the project, however.
Source |
(FFY) 2021 |
2022 |
2023 |
2024 |
2025 |
Total |
Federal Funds |
--- |
--- |
--- |
--- |
$6,003,001 |
$6,003,001 |
Non-Federal Funds |
--- |
--- |
--- |
--- |
$667,000 |
$667,000 |
Total Funds |
--- |
--- |
--- |
--- |
$6,670,001 |
$6,670,001 |
Proponent: Cohasset
ID Number: 608007
Project Type: Complete Streets
Cost: $8,971,635
Funding Source: Regional Target Funds
Category |
Safety |
Sys Pres |
CM/M |
CA/SC |
TE |
EV |
Total |
Score |
16 out of 30 |
4 out of 29 |
8 out of 29 |
5 out of 16 |
1 out of 12 |
3 out of 18 |
37 out of 134 |
Work on this project includes corridor improvements from the Beechwood Street intersection to the Cohasset/Scituate town line. The Route 3A/Beechwood Street intersection will be upgraded with new traffic signal equipment as well as minor geometric improvements. The Route 3A/Henry Turner Bailey Road intersection will be reviewed for meeting requirements for traffic signals as well as geometric improvements. Pedestrian and bicycle accommodation will be included along the corridor.
Source |
(FFY) 2021 |
2022 |
2023 |
2024 |
2025 |
Total |
Federal Funds |
--- |
--- |
--- |
$7,327,308 |
--- |
$7,327,308 |
Non-Federal Funds |
--- |
--- |
--- |
$1,644,327 |
--- |
$1,644,327 |
Total Funds |
--- |
--- |
--- |
$8,971,635 |
--- |
$8,971,635 |
Proponent: Concord
ID Number: S10788
Project Type: Community Connections
Cost: $100,000
Funding Source: Regional Target Funds
This project received a total score of 20 points when evaluated using the MPO’s Community Connections Program criteria. These criteria are listed in Table A-5.
This project includes the construction of several protected bike racks near the West Concord MBTA Commuter Rail station. These bike shelters will support commuters who ride the Bruce Freeman Rail Trail to the train station. This project is funded through the pilot round of the MPO’s Community Connections Program.
Source |
(FFY) 2021 |
2022 |
2023 |
2024 |
2025 |
Total |
Federal Funds |
$80,000 |
--- |
--- |
--- |
--- |
$80,000 |
Non-Federal Funds |
$20,000 |
--- |
--- |
--- |
--- |
$20,000 |
Total Funds |
$100,000 |
--- |
--- |
--- |
--- |
$100,000 |
Proponent: MassDOT
ID Number: 608495
Project Type: Non-Interstate Pavement
Cost: $3,276,000
Funding Source: Statewide Highway Funds
This is a MassDOT-prioritized project and is therefore not directly evaluated using the MPO’s TIP scoring criteria.
The project consists of resurfacing and related work on Route 2A.
Source |
(FFY) 2021 |
2022 |
2023 |
2024 |
2025 |
Total |
Federal Funds |
--- |
$2,620,800 |
--- |
--- |
--- |
$2,620,800 |
Non-Federal Funds |
--- |
$655,200 |
--- |
--- |
--- |
$655,200 |
Total Funds |
--- |
$3,276,000 |
--- |
--- |
--- |
$3,276,000 |
Proponent: MassDOT
ID Number: 608818
Project Type: Non-Intersection Pavement
Cost: $1,133,382
Funding Source: Statewide Highway Funds
This is a MassDOT-prioritized project and is therefore not directly evaluated using the MPO’s TIP scoring criteria.
The project consists of resurfacing and related work on Route 114.
Source |
(FFY) 2021 |
2022 |
2023 |
2024 |
2025 |
Total |
Federal Funds |
--- |
$906,706 |
--- |
--- |
--- |
$906,706 |
Non-Federal Funds |
--- |
$226,676 |
--- |
--- |
--- |
$226,676 |
Total Funds |
--- |
$1,133,382 |
--- |
--- |
--- |
$1,133,382 |
Proponent: MassDOT
ID Number: 609060
Project Type: Intersection Improvements
Cost: $455,208
Funding Source: Statewide Highway Funds
This is a MassDOT-prioritized project and is therefore not directly evaluated using the MPO’s TIP scoring criteria.
Guide and Traffic Sign Replacement on Interstate 95/Route 128 (Task ‘A’ Interchange)
Source |
(FFY) 2021 |
2022 |
2023 |
2024 |
2025 |
Total |
Federal Funds |
--- |
$409,687 |
--- |
--- |
--- |
$409,687 |
Non-Federal Funds |
--- |
$45,521 |
--- |
--- |
--- |
$45,521 |
Total Funds |
--- |
$455,208 |
--- |
--- |
--- |
$455,208 |
Proponent: MassDOT
ID Number: 610782
Project Type: Bridge
Cost: $5,689,600
Funding Source: Statewide Highway Funds
This is a MassDOT-prioritized project and is therefore not directly evaluated using the MPO’s TIP scoring criteria.
This project will fund maintenance of bridge D-03-009, which carries Andover Street over the Ipswich River between Danvers and Middleton.
Source |
(FFY) 2021 |
2022 |
2023 |
2024 |
2025 |
Total |
Federal Funds |
--- |
--- |
--- |
$4,551,680 |
--- |
$4,551,680 |
Non-Federal Funds |
--- |
--- |
--- |
$1,137,920 |
--- |
$1,137,920 |
Total Funds |
--- |
--- |
--- |
$5,689,600 |
--- |
$5,689,600 |
Proponent: Dedham
ID Number: 607899
Project Type: Complete Streets
Cost: $5,355,932
Funding Source: Regional Target Funds
Category |
Safety |
Sys Pres |
CM/M |
CA/SC |
TE |
EV |
Total |
Score |
5 out of 30 |
8 out of 29 |
5 out of 29 |
5 out of 16 |
7 out of 12 |
5 out of 18 |
35 out of 134 |
Improvements along the Bussey Street corridor will include resetting and setting the curb and reconstructing ADA compliant sidewalks and ramps on both sides of the roadway. Some area of pavement reconstruction may be necessary to obtain the necessary curb reveal. Minor geometric improvements are expected at the intersection with Colburn Street and Clisby Avenue to make them more pedestrian friendly, current conditions include expansive pavement width. Shared bicycle accommodations are planned.
Source |
(FFY) 2021 |
2022 |
2023 |
2024 |
2025 |
Total |
Federal Funds |
--- |
--- |
$4,284,746 |
--- |
--- |
$4,284,746 |
Non-Federal Funds |
--- |
--- |
$1,071,186 |
--- |
--- |
$1,071,186 |
Total Funds |
--- |
--- |
$5,355,932 |
--- |
--- |
$5,355,932 |
Proponent: Dedham
ID Number: 607901
Project Type: Roadway Reconstruction
Cost: $2,706,712
Funding Source: Statewide Highway Funds
This is a MassDOT-prioritized project and is therefore not directly evaluated using the MPO’s TIP scoring criteria.
Improvements along the Elm Street and Rustcraft Road corridor will primarily consist of the installation of new curbing, sidewalks, and ramps on both sides of the corridor. This area will also require drainage improvements to modify stormwater management from sheet flow to catch basins, which is necessary with the installation of new curbs and sidewalks. Minor roadway widening is anticipated to achieve a minimum roadway width to accommodate a five-foot bicycle lane. An off-road area for drop off and pick up at the Dedham Corporate Center Station on the MBTA commuter rail has already been constructed by the Town of Dedham.
Source |
(FFY) 2021 |
2022 |
2023 |
2024 |
2025 |
Total |
Federal Funds |
$2,165,370 |
--- |
--- |
--- |
--- |
$2,165,370 |
Non-Federal Funds |
$541,342 |
--- |
--- |
--- |
--- |
$541,342 |
Total Funds |
$2,706,712 |
--- |
--- |
--- |
--- |
$2,706,712 |
Proponent: MassDOT
ID Number: 608596
Project Type: Intersection Improvements
Cost: $5,695,162
Funding Source: Statewide Highway Funds
This is a MassDOT-prioritized project and is therefore not directly evaluated using the MPO’s TIP scoring criteria.
This bridge preservation project will address the bridge that carries Route 133 (Main Street) over the Essex River in Essex.
Source |
(FFY) 2021 |
2022 |
2023 |
2024 |
2025 |
Total |
Federal Funds |
$4,556,130 |
--- |
--- |
--- |
--- |
$4,556,130 |
Non-Federal Funds |
$1,139,032 |
--- |
--- |
--- |
--- |
$1,139,032 |
Total Funds |
$5,695,162 |
--- |
--- |
--- |
--- |
$5,695,162 |
Proponent: MassDOT
ID Number: 609102
Project Type: Non-Interstate Pavement
Cost: $14,892,926
Funding Source: Statewide Highway Funds
This is a MassDOT-prioritized project and is therefore not directly evaluated using the MPO’s TIP scoring criteria.
Pavement preservation and related work on Route 128
Source |
(FFY) 2021 |
2022 |
2023 |
2024 |
2025 |
Total |
Federal Funds |
$11,914,341 |
--- |
--- |
--- |
--- |
$11,914,341 |
Non-Federal Funds |
$2,978,585 |
--- |
--- |
--- |
--- |
$2,978,585 |
Total Funds |
$14,892,926 |
--- |
--- |
--- |
--- |
$14,892,926 |
Proponent: Everett
ID Number: 607652
Project Type: Complete Streets
Cost: $25,000,000
Funding Source: Regional Target Funds
Category |
Safety |
Sys Pres |
CM/M |
CA/SC |
TE |
EV |
Total |
Score |
14 out of 30 |
15 out of 29 |
15 out of 29 |
10 out of 16 |
12 out of 12 |
9 out of 18 |
75 out of 134 |
The project will reconstruct Ferry Street from the Malden city line (Belmont Street) to Route 16 and Elm Street between Ferry Street and Woodlawn Street. The work will include resurfacing and construction of new sidewalks, wheelchair ramps, and curb extensions. The traffic signals at five locations and the fire station will be upgraded. The signalized intersection at Chelsea Street will be replaced by a roundabout.
Source |
(FFY) 2021 |
2022 |
2023 |
2024 |
2025 |
Total |
Federal Funds |
$13,382,155 |
$6,722,874 |
--- |
--- |
--- |
$20,105,029 |
Non-Federal Funds |
$3,214,252 |
$1,680,719 |
--- |
--- |
--- |
$4,894,971 |
Total Funds |
$16,596,407 |
$8,403,953 |
--- |
--- |
--- |
$25,000,000 |
Proponent: Everett
ID Number: 609257
Project Type: Complete Streets
Cost: $10,921,632
Funding Source: Regional Target Funds
Category |
Safety |
Sys Pres |
CM/M |
CA/SC |
TE |
EV |
Total |
Score |
19 out of 30 |
10 out of 29 |
13 out of 29 |
4 out of 16 |
7 out of 12 |
1 out of 18 |
54 out of 134 |
This Complete Streets project involves the reconstruction of Beacham Street to reduce vehicular collisions and improve bicycle travel. This project also includes the implementation of a shared-use bike path with a buffer along 0.65 miles of the Beacham Street corridor, a major connection between Boston, Somerville, and Cambridge, and Chelsea and East Boston. To promote pedestrian safety, upgrades to traffic signals, pavement markings, and sidewalk conditions will be incorporated to reduce conflict with vehicular traffic and provide an ADA-compliant travel route.
Source |
(FFY) 2021 |
2022 |
2023 |
2024 |
2025 |
Total |
Federal Funds |
--- |
--- |
--- |
--- |
$8,837,306 |
$8,837,306 |
Non-Federal Funds |
--- |
--- |
--- |
--- |
$2,084,326 |
$2,084,326 |
Total Funds |
--- |
--- |
--- |
--- |
$10,921,632 |
$10,921,632 |
Proponent: MassDOT
ID Number: 608480
Project Type: Non-Interstate Pavement
Cost: $8,016,840
Funding Source: Statewide Highway Funds
This is a MassDOT-prioritized project and is therefore not directly evaluated using the MPO’s TIP scoring criteria.
The project consists of resurfacing on Route 1 in Foxborough, Sharon, and Walpole.
Source |
(FFY) 2021 |
2022 |
2023 |
2024 |
2025 |
Total |
Federal Funds |
--- |
$6,413,472 |
--- |
--- |
--- |
$6,413,472 |
Non-Federal Funds |
--- |
$1,603,368 |
--- |
--- |
--- |
$1,603,368 |
Total Funds |
--- |
$8,016,840 |
--- |
--- |
--- |
$8,016,840 |
Proponent: Framingham
ID Number: 608228
Project Type: Complete Streets
Cost: $10,218,923
Funding Source: Regional Target Funds
Category |
Safety |
Sys Pres |
CM/M |
CA/SC |
TE |
EV |
Total |
Score |
19 out of 30 |
16 out of 29 |
6 out of 29 |
0 out of 16 |
10 out of 12 |
13 out of 18 |
60 out of 134 |
The project involves improvements to Union Avenue from Proctor Street to Main Street, with limited work on intersecting local roadways. Specifically, the proposed improvements include full-depth pavement reconstruction, sidewalk reconstruction, traffic signal improvements, streetscape improvements, bicycle accommodation, warning and regulatory signing, and pavement markings. The existing traffic signal at Mt. Wayte Avenue will be reconstructed and new traffic signals will be erected at the intersections of Union Avenue with Lincoln Street and Walnut Street. Streetscape and ornamental lighting improvements will be made from the south end of the project area to the intersection of Union Avenue and Lincoln Street. Minor roadway widening of less than two feet is proposed between Proctor Street and Lexington Street in order to provide a sufficient cross section for travel lanes, bike lanes, and on-street parking. The Town of Framingham is constructing significant stormwater improvements as part of a separate utility project to be completed prior to the roadway improvements.
Source |
(FFY) 2021 |
2022 |
2023 |
2024 |
2025 |
Total |
Federal Funds |
$8,275,139 |
--- |
--- |
--- |
--- |
$8,275,139 |
Non-Federal Funds |
$1,943,784 |
--- |
--- |
--- |
--- |
$1,943,784 |
Total Funds |
$10,218,923 |
--- |
--- |
--- |
--- |
$10,218,923 |
Proponent: Framingham
ID Number: 608889
Project Type: Intersection Improvements
Cost: $2,036,172
Funding Source: Regional Target Funding
Category |
Safety |
Sys Pres |
CM/M |
CA/SC |
TE |
EV |
Total |
Score |
9 out of 30 |
10 out of 29 |
7 out of 29 |
9 out of 16 |
2 out of 12 |
4 out of 18 |
41 out of 134 |
This project will improve vehicular operations and safety by installing traffic signals and geometric improvements at the intersection of Edgell Road and Central Street. The geometric improvements include realigning and widening the roadway to provide a southbound left-turn lane and a northbound right-turn lane along Edgell Road. The project also addresses pedestrian and bicyclist safety through the addition of bike lanes, crosswalks, and a new traffic signal. Sidewalks along both sides of all roadways will be ADA/ABA compliant.
Source |
(FFY) 2021 |
2022 |
2023 |
2024 |
2025 |
Total |
Federal Funds |
--- |
--- |
$1,628,938 |
--- |
--- |
$1,628,938 |
Non-Federal Funds |
--- |
--- |
$407,234 |
--- |
--- |
$407,234 |
Total Funds |
--- |
--- |
$2,036,172 |
--- |
--- |
$2,036,172 |
Proponent: MassDOT
ID Number: 609402
Project Type: Non-Interstate Pavement
Cost: $21,714,852
Funding Source: Statewide Highway Funds
This is a MassDOT-prioritized project and is therefore not directly evaluated using the MPO’s TIP scoring criteria.
Resurfacing and related work on Route 9
Source |
(FFY) 2021 |
2022 |
2023 |
2024 |
2025 |
Total |
Federal Funds |
--- |
--- |
--- |
--- |
$17,371,882 |
$17,371,882 |
Non-Federal Funds |
--- |
--- |
--- |
--- |
$4,342,970 |
$4,342,970 |
Total Funds |
--- |
--- |
--- |
--- |
$21,714,852 |
$21,714,852 |
Proponent: MassDOT
ID Number: 609467
Project Type: Bridge
Cost: $3,377,004
Funding Source: Statewide Highway Funds
This is a MassDOT-prioritized project and is therefore not directly evaluated using the MPO’s TIP scoring criteria.
Bridge replacement, Winthrop Street over Ipswich River, H-03-002 (2R5)
Source |
(FFY) 2021 |
2022 |
2023 |
2024 |
2025 |
Total |
Federal Funds |
--- |
--- |
--- |
$2,701,603 |
--- |
$2,701,603 |
Non-Federal Funds |
--- |
--- |
--- |
$675,401 |
--- |
$675,401 |
Total Funds |
--- |
--- |
--- |
$3,377,004 |
--- |
$3,377,004 |
Proponent: MassDOT
ID Number: 607977
Project Type: Roadway Reconstruction
Cost: $281,640,202
Funding Source: Statewide Highway Funds
This is a MassDOT-prioritized project and is therefore not directly evaluated using the MPO’s TIP scoring criteria.
The project would improve the interchange of Interstate 90 and Interstate 495. A number of alternatives are being developed and evaluated in a feasibility study. This project is funded over five federal fiscal years (FFYs 2022-26) for a total cost of $281,640,202. This project is also being funded with $72,449,932 in non-federal aid.
Source |
(FFY) 2021 |
2022 |
2023 |
2024 |
2025 |
Total |
Federal Funds |
--- |
$24,775,825 |
$44,097,823 |
$24,993,037 |
$34,148,561 |
$128,015,246 |
Non-Federal Funds |
--- |
2,752,870 |
$9,344,203 |
$2,777,004 |
$3,794,285 |
$18,668,362 |
Total Funds |
--- |
$27,528,695 |
$53,442,026 |
27,777,041 |
$37,942,846 |
$146,683,608 |
Proponent: Hingham
ID Number: 605168
Project Type: Complete Streets
Cost: $15,272,850
Funding Source: Regional Target Funds
Category |
Safety |
Sys Pres |
CM/M |
CA/SC |
TE |
EV |
Total |
Score |
10 out of 30 |
16 out of 29 |
17 out of 29 |
10 out of 16 |
0 out of 12 |
2 out of 18 |
55 out of 134 |
The project improves multimodal access between Hingham Center, residential areas, and Hingham Harbor by extending the existing buffered, shared-use bike path from Rockland Street to the Hingham inner harbor. In addition, improvements to reduce vehicular accidents will be incorporated through the establishment of turn lanes and a small roundabout at the intersection of Route 3A and Summer Street.
Source |
(FFY) 2021 |
2022 |
2023 |
2024 |
2025 |
Total |
Federal Funds |
--- |
--- |
--- |
--- |
$12,218,280 |
$12,218,280 |
Non-Federal Funds |
--- |
--- |
--- |
--- |
$3,054,570 |
$3,054,570 |
Total Funds |
--- |
--- |
--- |
--- |
$15,272,850 |
$15,272,850 |
Proponent: Holbrook
ID Number: 606501
Project Type: Complete Streets
Cost: $4,563,878
Funding Source: Regional Target and
Statewide Highway Funds
This project was evaluated by MPO staff in FFY 2015 using a prior version of the TIP scoring criteria. Under those criteria, this project received the following scores: System Preservation, Modernization, and Efficiency (10 out of 36 points); Livability and Economic Benefit (13 out of 29 points); Mobility (7 out of 25 points); Environment and Climate Change (5 out of 25 points); Environmental Justice (0 out of 10 points); and Safety and Security (13 out of 29 points). This project’s total score is 48 points out of a possible 154 points.
The purpose of this project is to rehabilitate a segment of Union Street from Linfield Street to Centre Street and Water Street. The proposed improvements will address poor roadway pavement conditions, deteriorating sidewalks, a lack of curbing, and needed drainage improvements. The project will also address the need for upgraded pavement markings, signage, and guard rails. This project is funded using a combination of MPO Regional Target funds ($3,036,628) and Federal High-Priority Project (HPP) funds ($1,527,250).
Source |
(FFY) 2021 |
2022 |
2023 |
2024 |
2025 |
Total |
Federal Funds |
$3,651,102 |
--- |
--- |
--- |
--- |
$3,651,102 |
Non-Federal Funds |
$912,776 |
--- |
--- |
--- |
--- |
$912,776 |
Total Funds |
$4,563,878 |
--- |
--- |
--- |
--- |
$4,563,878 |
Proponent: MassDOT
ID Number: 607977
Project Type: Roadway Reconstruction
Cost: $281,640,202
Funding Source: Statewide Highway Funds
This is a MassDOT-prioritized project and is therefore not directly evaluated using the MPO’s TIP scoring criteria.
The project would improve the interchange of Interstate 90 and Interstate 495. A number of alternatives are being developed and evaluated in a feasibility study. This project is funded over five federal fiscal years (FFYs 2022-26) for a total cost of $281,640,202.
Source |
(FFY) 2021 |
2022 |
2023 |
2024 |
2025 |
Total |
Federal Funds |
--- |
$24,775,825 |
$44,097,823 |
$24,993,037 |
$34,148,561 |
$128,015,246 |
Non-Federal Funds |
--- |
2,752,870 |
$9,344,203 |
$2,777,004 |
$3,794,285 |
$18,668,362 |
Total Funds |
--- |
$27,528,695 |
$53,442,026 |
27,777,041 |
$37,942,846 |
$146,683,608 |
Proponent: Hull
ID Number: 601607
Project Type: Complete Streets
Cost: $7,984,486
Funding Source: Regional Target Funds
Category |
Safety |
Sys Pres |
CM/M |
CA/SC |
TE |
EV |
Total |
Score |
11 out of 30 |
13 out of 29 |
8 out of 29 |
6 out of 16 |
2 out of 12 |
4 out of 18 |
44 out of 134 |
This project involves the improvement of pavement condition through the reconstruction of Atlantic Avenue from Nantasket Avenue to the Cohasset town line. The addition of a 5.5-foot wide sidewalk will also be included in the roadway reconstruction. Drainage improvements will be incorporated through the installation of new drainage structures, grates, inlets, and pipes and the rebuilding of existing stormwater infrastructure.
Source |
(FFY) 2021 |
2022 |
2023 |
2024 |
2025 |
Total |
Federal Funds |
--- |
$6,387,589 |
--- |
--- |
--- |
$6,387,589 |
Non-Federal Funds |
--- |
$1,596,897 |
--- |
--- |
--- |
$1,596,897 |
Total Funds |
--- |
$7,984,486 |
--- |
--- |
--- |
$7,984,486 |
Proponent: Ipswich
ID Number: 605743
Project Type: Complete Streets
Cost: $3,104,609
Funding Source: Regional Target Funds
Category |
Safety |
Sys Pres |
CM/M |
CA/SC |
TE |
EV |
Total |
Score |
11 out of 30 |
10 out of 29 |
10 out of 29 |
6 out of 16 |
2 out of 12 |
8 out of 18 |
47 out of 134 |
In Ipswich, the project will reconstruct the roadway between Mineral Street and Poplar Street (3,200 feet) to improve the roadway surface. Minor geometric improvements at intersection and pedestrian crossings will be included. Sidewalks and wheelchair ramps will be improved in selected areas for ADA compliance. The drainage system is undersized and will be upgraded.
Source |
(FFY) 2021 |
2022 |
2023 |
2024 |
2025 |
Total |
Federal Funds |
--- |
--- |
--- |
$2,483,687 |
--- |
$2,483,687 |
Non-Federal Funds |
--- |
--- |
--- |
$620,922 |
--- |
$620,922 |
Total Funds |
--- |
--- |
--- |
$3,104,609 |
--- |
$3,104,609 |
Proponent: Littleton
ID Number: 609054
Project Type: Complete Streets
Cost: $4,281,978
Funding Source: Regional Target Funds
Category |
Safety |
Sys Pres |
CM/M |
CA/SC |
TE |
EV |
Total |
Score |
12 out of 30 |
3 out of 29 |
11 out of 29 |
5 out of 16 |
1 out of 12 |
6 out of 18 |
38 out of 134 |
This project involves improvements to address traffic congestion and the safety of pedestrians and bicyclists through the addition of turning lanes and the reduction and consolidation of curb cuts. Full accommodations for vehicular, bicycle, and pedestrian travel and upgraded signage and wayfinding will also be established to improve accessibility for all users who travel to and from the nearby businesses.
Source |
(FFY) 2021 |
2022 |
2023 |
2024 |
2025 |
Total |
Federal Funds |
--- |
--- |
--- |
$3,425,582 |
--- |
$3,425,582 |
Non-Federal Funds |
--- |
--- |
--- |
$856,396 |
--- |
$856,396 |
Total Funds |
--- |
--- |
--- |
$4,281,978 |
--- |
$4,281,978 |
Proponent: Lynn
ID Number: 602077
Project Type: Complete Streets
Cost: $6,484,734
Funding Source: Regional Target Funds
Category |
Safety |
Sys Pres |
CM/M |
CA/SC |
TE |
EV |
Total |
Score |
12 out of 30 |
9 out of 29 |
8 out of 29 |
4 out of 16 |
4 out of 12 |
4 out of 18 |
41 out of 134 |
This roadway and safety improvement project on Route 129 in Lynn includes drainage improvements, curbing, new sidewalks, wheelchair ramps, intersection improvements, pavement markings, signing, landscaping, and other incidental work. The project limits are from Colonial Avenue to about 150 feet south of Floyd Avenue (between Floyd and Cowdrey Road) for a total of 0.72 miles.
Source |
(FFY) 2021 |
2022 |
2023 |
2024 |
2025 |
Total |
Federal Funds |
--- |
$5,187,787 |
--- |
--- |
--- |
$5,187,787 |
Non-Federal Funds |
--- |
$1,296,947 |
--- |
--- |
--- |
$1,296,947 |
Total Funds |
--- |
$6,484,734 |
--- |
--- |
--- |
$6,484,734 |
Proponent: Lynn
ID Number: 609252
Project Type: Complete Streets
Cost: $18,956,000
Funding Source: Regional Target Funds
Category |
Safety |
Sys Pres |
CM/M |
CA/SC |
TE |
EV |
Total |
Score |
19 out of 30 |
17 out of 29 |
9 out of 29 |
8 out of 16 |
10 out of 12 |
3 out of 18 |
66 out of 134 |
This project is focused on making key safety improvements for pedestrian and bicyclists. Existing sidewalks on Essex Street will be reconstructed to ADA/AAB standards and will be complemented by the addition of new on-street bicycle facilities. Pedestrian safety will be improved through the construction of curb bump-outs at intersections to reduce crosswalk length. In addition, operational improvements such as signal updates and pavement markings will be established to enhance safety.
Source |
(FFY) 2021 |
2022 |
2023 |
2024 |
2025 |
Total |
Federal Funds |
--- |
--- |
--- |
$15,564,800 |
--- |
$15,564,800 |
Non-Federal Funds |
--- |
--- |
--- |
$3,391,200 |
--- |
$3,391,200 |
Total Funds |
--- |
--- |
--- |
$18,956,000 |
--- |
$18,956,000 |
Proponent: Lynn
ID Number: 609254
Project Type: Intersection Improvements
Cost: $6,225,577
Funding Source: Statewide Highway Funds
Category |
Safety |
Sys Pres |
CM/M |
CA/SC |
TE |
EV |
Total |
Score |
13 out of 30 |
13 out of 29 |
7 out of 29 |
2 out of 16 |
1 out of 12 |
3 out of 18 |
39 out of 134 |
This project involves multimodal safety and operational improvements at two locations on Broadway. Existing sidewalks will be reconstructed with the addition of on-street bicycle facilities close to connections to adjacent facilities. Operational improvements include traffic signal updates at Broadway’s intersections with Euclid Avenue and Jenness and Warwick Streets. Drainage improvements and pavement reconstruction will also be incorporated to improve access to businesses and schools. This project was evaluated using the MPO’s scoring criteria because it was considered for funding using Regional Target funds. MassDOT funded the project, however.
Source |
(FFY) 2021 |
2022 |
2023 |
2024 |
2025 |
Total |
Federal Funds |
--- |
--- |
--- |
$5,603,019 |
--- |
$5,603,019 |
Non-Federal Funds |
--- |
--- |
--- |
$622,558 |
--- |
$622,558 |
Total Funds |
--- |
--- |
--- |
$6,225,577 |
--- |
$6,225,577 |
Proponent: MassDOT
ID Number: 608817
Project Type: Non-Interstate Pavement
Cost: $2,250,000
Funding Source: Statewide Highway Funds
This is a MassDOT-prioritized project and is therefore not directly evaluated using the MPO’s TIP scoring criteria.
Resurfacing and related work on Route 107
Source |
(FFY) 2021 |
2022 |
2023 |
2024 |
2025 |
Total |
Federal Funds |
$1,800,000 |
--- |
--- |
--- |
--- |
$1,800,000 |
Non-Federal Funds |
$450,000 |
--- |
--- |
--- |
--- |
$450,000 |
Total Funds |
$2,250,000 |
--- |
--- |
--- |
--- |
$2,250,000 |
Proponent: MassDOT
ID Number: 604952
Project Type: Bridge
Cost: $98,962,749
Funding Source: Statewide Highway Funds
This is a MassDOT-prioritized project and is therefore not directly evaluated using the MPO’s TIP scoring criteria.
This project consists of the construction of the Route 107 (Fox Hill Bridge), which spans the Saugus River. The new bridge will serve as the permanent replacement for the proposed temporary drawbridge. The new bridge (a.k.a. Belden G. Bly Bridge) will be a single leaf bascule drawbridge. This project is funded over five years (FFYs 2019-23) for a total cost of $98,962,749.
Source |
(FFY) 2021 |
2022 |
2023 |
2024 |
2025 |
Total |
Federal Funds |
$18,375,830 |
$17,845,657 |
$14,785,206 |
--- |
--- |
$51,006,693 |
Non-Federal Funds |
$4,593,958 |
$4,461,414 |
$3,696,301 |
--- |
--- |
$12,751,673 |
Total Funds |
$22,969,788 |
$22,307,071 |
$18,481,507 |
--- |
--- |
$63,758,366 |
Proponent: MassDOT
ID Number: 607477
Project Type: Non-Interstate Pavement
Cost: $9,004,937
Funding Source: Statewide Highway Funds
This is a MassDOT-prioritized project and is therefore not directly evaluated using the MPO’s TIP scoring criteria.
The project will resurface 2.7 miles of Route 1 in Lynnfield and Peabody from milepoint 58.8 to 61.5.
Source |
(FFY) 2021 |
2022 |
2023 |
2024 |
2025 |
Total |
Federal Funds |
$7,203,950 |
--- |
--- |
--- |
--- |
$7,203,950 |
Non-Federal Funds |
$1,800,987 |
--- |
--- |
--- |
--- |
$1,800,987 |
Total Funds |
$9,004,937 |
--- |
--- |
--- |
--- |
$9,004,937 |
Proponent: Lynnfield, Wakefield
ID Number: 607329
Project Type: Bicycle and Pedestrian
Cost: $11,271,387
Funding Source: Statewide Highway Funds
This is a MassDOT-prioritized project and is therefore not directly evaluated using the MPO’s TIP scoring criteria.
The proposed Wakefield/Lynnfield Rail Trail extends from the Galvin Middle School in Wakefield north to the Lynnfield/Peabody town line, a distance of approximately 4.4 miles. Approximately 1.9 miles of the trail is located within Wakefield and 2.5 miles in Lynnfield. The corridor is the southern section of the former Newburyport Railroad and will connect to Peabody and the regional Border to Boston Trail.
Source |
(FFY) 2021 |
2022 |
2023 |
2024 |
2025 |
Total |
Federal Funds |
--- |
--- |
--- |
$9,017,110 |
--- |
$9,017,110 |
Non-Federal Funds |
--- |
--- |
--- |
$2,254,277 |
--- |
$2,254,277 |
Total Funds |
--- |
--- |
--- |
$11,271,387 |
--- |
$11,271,387 |
Proponent: Marblehead
ID Number: 608146
Project Type: Intersection Improvements
Cost: $565,486
Funding Source: Regional Target Funds
Category |
Safety |
Sys Pres |
CM/M |
CA/SC |
TE |
EV |
Total |
Score |
8 out of 30 |
10 out of 29 |
9 out of 29 |
3 out of 16 |
1 out of 12 |
9 out of 18 |
40 out of 134 |
The intersection improvements will include realignment of Vine Street to form a T intersection; narrowing and realigning Pleasant Street to minimize crossing distance; the installation of new sidewalks and signs; enhanced lighting; modest drainage modifications; ADA/AAB crossing enhancements; and shared bicycle accommodations. The project area is approximately 800 linear feet: 400 linear feet on Pleasant Street (200 feet east and west of the intersection), 150 linear feet on Village Street, 150 linear feet on Vine Street, and 100 linear feet on Cross Street. Drainage and utility adjustments will be made as needed to accommodate the proposed intersection channelization modifications.
Source |
(FFY) 2021 |
2022 |
2023 |
2024 |
2025 |
Total |
Federal Funds |
$452,389 |
--- |
--- |
--- |
--- |
$452,389 |
Non-Federal Funds |
$113,097 |
--- |
--- |
--- |
--- |
$113,097 |
Total Funds |
$565,486 |
--- |
--- |
--- |
--- |
$565,486 |
Proponent: MassDOT
ID Number: 608467
Project Type: Non-Interstate Pavement
Cost: $11,744,328
Funding Source: Statewide Highway Funds
This is a MassDOT-prioritized project and is therefore not directly evaluated using the MPO’s TIP scoring criteria.
The project consists of resurfacing on Route 20 in Sudbury and Marlborough.
Source |
(FFY) 2021 |
2022 |
2023 |
2024 |
2025 |
Total |
Federal Funds |
$9,395,462 |
--- |
--- |
--- |
--- |
$9,395,462 |
Non-Federal Funds |
$2,348,866 |
--- |
--- |
--- |
--- |
$2,348,866 |
Total Funds |
$11,744,328 |
--- |
--- |
--- |
--- |
$11,744,328 |
Proponent: MassDOT
ID Number: 610724
Project Type: Interstate Pavement
Cost: $4,320,011
Funding Source: Statewide Highway Funds
This is a MassDOT-prioritized project and is therefore not directly evaluated using the MPO’s TIP scoring criteria.
This project will support Interstate pavement preservation work in MassDOT Highway District 4.
Source |
(FFY) 2021 |
2022 |
2023 |
2024 |
2025 |
Total |
Federal Funds |
$3,888,010 |
--- |
--- |
--- |
--- |
$3,888,010 |
Non-Federal Funds |
$432,001 |
--- |
--- |
--- |
--- |
$432,001 |
Total Funds |
$4,320,011 |
--- |
--- |
--- |
--- |
$4,320,011 |
Proponent: MassDOT
ID Number: 608637
Project Type: Bridge
Cost: $2,661,282
Funding Source: Statewide Highway Funds
This is a MassDOT-prioritized project and is therefore not directly evaluated using the MPO’s TIP scoring criteria.
The project will replace the bridge that carries Florida Road over the Assabet River in Maynard.
Source |
(FFY) 2021 |
2022 |
2023 |
2024 |
2025 |
Total |
Federal Funds |
$2,129,026 |
--- |
--- |
--- |
--- |
$2,129,026 |
Non-Federal Funds |
$532,256 |
--- |
--- |
--- |
--- |
$532,256 |
Total Funds |
$2,661,282 |
--- |
--- |
--- |
--- |
$2,661,282 |
Proponent: MassDOT
ID Number: 610726
Project Type: Interstate Pavement
Cost: $16,808,413
Funding Source: Statewide Highway Funds
This is a MassDOT-prioritized project and is therefore not directly evaluated using the MPO’s TIP scoring criteria.
This project includes pavement preservation work on Interstate 93 between Medford, Winchester, and Stoneham.
Source |
(FFY) 2021 |
2022 |
2023 |
2024 |
2025 |
Total |
Federal Funds |
--- |
--- |
--- |
--- |
$15,127,572 |
$15,127,572 |
Non-Federal Funds |
--- |
--- |
--- |
--- |
$1,680,841 |
$1,680,841 |
Total Funds |
--- |
--- |
--- |
--- |
$16,808,413 |
$16,808,413 |
Proponent: MassDOT
ID Number: 609530
Project Type: Roadway Reconstruction
Cost: $1,154,817
Funding Source: Statewide Highway Funds
This is a MassDOT-prioritized project and is therefore not directly evaluated using the MPO’s TIP scoring criteria.
This project will make upgrades to promote safety along Holliston Street and Cassidy Lane in Medway through the Safe Routes to Schools program. These roadways are adjacent to Francis J. Burke Memorial Elementary School and Medway Middle School.
Source |
(FFY) 2021 |
2022 |
2023 |
2024 |
2025 |
Total |
Federal Funds |
--- |
--- |
$923,854 |
--- |
--- |
$923,854 |
Non-Federal Funds |
--- |
--- |
$230,963 |
--- |
--- |
$230,963 |
Total Funds |
--- |
--- |
$1,154,817 |
--- |
--- |
$1,154,817 |
Proponent: MassDOT
ID Number: 608522
Project Type: Bridge
Cost: $4,072,275
Funding Source: Statewide Highway Funds
This is a MassDOT-prioritized project and is therefore not directly evaluated using the MPO’s TIP scoring criteria.
The project will replace the bridge that carries Route 62 (Maple Street) over the Ipswich River in Middleton.
Source |
(FFY) 2021 |
2022 |
2023 |
2024 |
2025 |
Total |
Federal Funds |
--- |
--- |
--- |
$3,257,820 |
--- |
$3,257,820 |
Non-Federal Funds |
--- |
--- |
--- |
$814,455 |
--- |
$814,455 |
Total Funds |
--- |
--- |
--- |
$4,072,275 |
--- |
$4,072,275 |
Proponent: Milford
ID Number: 608045
Project Type: Complete Streets
Cost: $3,887,537
Funding Source: Regional Target Funds
Category |
Safety |
Sys Pres |
CM/M |
CA/SC |
TE |
EV |
Total |
Score |
20 out of 30 |
7 out of 29 |
9 out of 29 |
-1 out of 16 |
3 out of 12 |
5 out of 18 |
43 out of 134 |
This project supports enhanced vehicular safety and traffic flow through the implementation of a road diet, additional roadway reconstruction, and enhanced signalization on the Route 16 (East Main Street) corridor from Route 109 (Medway Road) to Beaver Street. In addition, the project also addresses pedestrian and bicyclist safety through the addition of pavement markings for shared-use bike lanes and the construction of new 6-foot sidewalks along both sides of the roadway.
Source |
(FFY) 2021 |
2022 |
2023 |
2024 |
2025 |
Total |
Federal Funds |
--- |
--- |
--- |
--- |
$3,210,030 |
$3,210,030 |
Non-Federal Funds |
--- |
--- |
--- |
--- |
$677,507 |
$677,507 |
Total Funds |
--- |
--- |
--- |
--- |
$3,887,537 |
$3,887,537 |
Proponent: MassDOT
ID Number: 607342
Project Type: Intersection Improvements
Cost: $5,384,060
Funding Source: Statewide Highway Funds
This is a MassDOT-prioritized project and is therefore not directly evaluated using the MPO’s TIP scoring criteria.
This intersection ranked second in the 2008-10 Statewide Top 200 Intersection Crash List. This project addresses the high number and severity of crashes that occur at this intersection.
Source |
(FFY) 2021 |
2022 |
2022 |
2024 |
2025 |
Total |
Federal Funds |
--- |
$4,845,654 |
--- |
--- |
--- |
$4,845,654 |
Non-Federal Funds |
--- |
$538,406 |
--- |
--- |
--- |
$538,406 |
Total Funds |
--- |
$5,384,060 |
--- |
--- |
--- |
$5,384,060 |
Proponent: MassDOT
ID Number: 609396
Project Type: Non-Interstate Pavement
Cost: $6,970,656
Funding Source: Statewide Highway Funds
This is a MassDOT-prioritized project and is therefore not directly evaluated using the MPO’s TIP scoring criteria.
Resurfacing and related work on Route 28
Source |
(FFY) 2021 |
2022 |
2023 |
2024 |
2025 |
Total |
Federal Funds |
--- |
--- |
--- |
$5,576,525 |
--- |
$5,576,525 |
Non-Federal Funds |
--- |
--- |
--- |
$1,394,131 |
--- |
$1,394,131 |
Total Funds |
--- |
--- |
--- |
$6,970,656 |
--- |
$6,970,656 |
Proponent: MassDOT
ID Number: 610680
Project Type: Bicycle and Pedestrian
Cost: $3,848,402
Funding Source: Statewide Highway Funds
This is a MassDOT-prioritized project and is therefore not directly evaluated using the MPO’s TIP scoring criteria.
This project includes a 0.4-mile segment of shared-used path along Route 9 in Natick. The project limits are from Archer Drive to the Cochituate Rail Trail. No roadway crossings are proposed and the shared-use path will provide a bicycle and pedestrian connection between the Cochituate Rail Trail and the robust residential and commercial area that is located in close proximity to the project's western terminus, filling a critical gap in the multimodal network.
Source |
(FFY) 2021 |
2022 |
2022 |
2024 |
2025 |
Total |
Federal Funds |
--- |
-- |
--- |
--- |
$3,078,722 |
$3,078,722 |
Non-Federal Funds |
--- |
-- |
--- |
--- |
$769,680 |
$769,680 |
Total Funds |
--- |
-- |
--- |
--- |
$3,848,402 |
$3,848,402 |
Proponent: MassDOT
ID Number: 608610
Project Type: Bridge
Cost: $2,308,000
Funding Source: Statewide Highway Funds
This is a MassDOT-prioritized project and is therefore not directly evaluated using the MPO’s TIP scoring criteria.
The work consists of cleaning and painting of structural steel on bridge N-12-055 in Newton.
Source |
(FFY) 2021 |
2022 |
2023 |
2024 |
2025 |
Total |
Federal Funds |
$1,846,400 |
--- |
--- |
--- |
--- |
$1,846,400 |
Non-Federal Funds |
$461,600 |
--- |
--- |
--- |
--- |
$461,600 |
Total Funds |
$2,308,000 |
--- |
--- |
--- |
--- |
$2,308,000 |
Proponent: Newton
ID Number: S10784
Project Type: Community Connections
Cost: $300,000
Funding Source: Regional Target Funds
This project received a total score of 53 points when evaluated using the MPO’s Community Connections Program criteria. These criteria are listed in Table A-5.
This project funds a new technology-enabled transportation service that will serve all residents, students and employees in Newton. The system will provide shared, first- and last-mile rides between three MBTA rail lines and the Wells Avenue Business District before expanding citywide. The City will deliver the service using on-demand, dynamically routed microtransit technology. This system will build on Newton’s NewMo microtransit system, operated by Via, which will provide 25,000 rides to Newton seniors in its first year. This project is funded through the pilot round of the MPO’s Community Connections Program.
Source |
(FFY) 2021 |
2022 |
2023 |
2024 |
2025 |
Total |
Federal Funds |
$240,000 |
--- |
--- |
--- |
--- |
$240,000 |
Non-Federal Funds |
$60,000 |
--- |
--- |
--- |
--- |
$60,000 |
Total Funds |
$300,000 |
--- |
--- |
--- |
--- |
$300,000 |
Proponent: MassDOT
ID Number: 608609
Project Type: Bridge
Cost: $2,314,286
Funding Source: Statewide Highway Funds
This is a MassDOT-prioritized project and is therefore not directly evaluated using the MPO’s TIP scoring criteria.
The work consists of cleaning and painting of structural steel on bridges N-12-0056 and W-31-006 in Newton and Westwood.
Source |
(FFY) 2021 |
2022 |
2023 |
2024 |
2025 |
Total |
Federal Funds |
--- |
--- |
$1,851,429 |
--- |
--- |
$1,851,429 |
Non-Federal Funds |
--- |
--- |
$462,857 |
--- |
--- |
$462,857 |
Total Funds |
--- |
--- |
$2,314,286 |
--- |
--- |
$2,314,286 |
Proponent: MassDOT
ID Number: 608866
Project Type: Bridge
Cost: $2,443,896
Funding Source: Statewide Highway Funds
This is a MassDOT-prioritized project and is therefore not directly evaluated using the MPO’s TIP scoring criteria.
Steel superstructure cleaning (full removal) and painting of two bridges: N-12-056 and W-31-006
Source |
(FFY) 2021 |
2022 |
2023 |
2024 |
2025 |
Total |
Federal Funds |
--- |
$1,955,117 |
--- |
--- |
--- |
$1,955,117 |
Non-Federal Funds |
--- |
$488,779 |
--- |
--- |
--- |
$488,779 |
Total Funds |
--- |
$2,443,896 |
--- |
--- |
--- |
$2,443,896 |
Proponent: Newton
ID Number: 610674
Project Type: Bicycle and Pedestrian
Cost: $5,914,556
Funding Source: Statewide Highway Funds
Category |
Safety |
Sys Pres |
CM/M |
CA/SC |
TE |
EV |
Total |
Score |
7 out of 30 |
16 out of 29 |
13 out of 29 |
6 out of 16 |
1 out of 12 |
8 out of 18 |
51 out of 134 |
The project aims to create safe bicycle and pedestrian facilities to improve the City of Newton's connectivity to green space, trails, and other recreation opportunities. The proposed improvements to Route 30 and the adjacent carriageway begin just east of Auburn Street and end at Ash Street. For the segment from Auburn Street to Woodbine Street, the project will narrow the existing median and re-purpose the space on the north side of the roadway to either a shared-use path or separated bicycle and pedestrian facilities. East of Woodbine Street, the existing 22-foot carriageway will be converted to the shared-use path or separated bicycle and pedestrian facilities. The existing cross section of Route 30 will be maintained, but 5-foot shoulders will be striped to allow for on-road bicycling facilities. There will be three mid-block crossings with pedestrian beacons installed at MBTA bus stops and the Blue Heron trail entrance. The intersection at Ash Street will be reconstructed to improve pedestrian and bicycle crossings and address circulation issues at Lyons Field. This project was evaluated using
the MPO’s scoring criteria because it was considered for funding using Regional Target Funds. MassDOT funded the project, however.
Source |
(FFY) 2021 |
2022 |
2023 |
2024 |
2025 |
Total |
Federal Funds |
--- |
--- |
--- |
--- |
$4,731,645 |
$4,731,645 |
Non-Federal Funds |
--- |
--- |
--- |
--- |
$1,182,911 |
$1,182,911 |
Total Funds |
--- |
--- |
--- |
--- |
$5,914,556 |
$5,914,556 |
Proponent: MassDOT
ID Number: 608866
Project Type: Bridge
Cost: $2,443,896
Funding Source: Statewide Highway Funds
This is a MassDOT-prioritized project and is therefore not directly evaluated using the MPO’s TIP scoring criteria.
Steel superstructure cleaning (full removal) and painting of two bridges: N-12-056 and W-31-006
Source |
(FFY) 2021 |
2022 |
2023 |
2024 |
2025 |
Total |
Federal Funds |
--- |
$1,955,117 |
--- |
--- |
--- |
$1,955,117 |
Non-Federal Funds |
--- |
$488,779 |
--- |
--- |
--- |
$488,779 |
Total Funds |
--- |
$2,443,896 |
--- |
--- |
--- |
$2,443,896 |
Proponent: Newton
ID Number: 610674
Project Type: Bicycle and Pedestrian
Cost: $5,914,556
Funding Source: Statewide Highway Funds
Category |
Safety |
Sys Pres |
CM/M |
CA/SC |
TE |
EV |
Total |
Score |
7 out of 30 |
16 out of 29 |
13 out of 29 |
6 out of 16 |
1 out of 12 |
8 out of 18 |
51 out of 134 |
Proponent: Norwood
ID Number: 605857
Project Type: Intersection Improvements
Cost: $9,789,988
Funding Source: Regional Target Funds
Category |
Safety |
Sys Pres |
CM/M |
CA/SC |
TE |
EV |
Total |
Score |
11 out of 30 |
12 out of 29 |
15 out of 29 |
11 out of 16 |
2 out of 12 |
4 out of 18 |
55 out of 134 |
The project aims to create safe bicycle and pedestrian facilities to improve the City of Newton's connectivity to green space, trails, and other recreation opportunities. The proposed improvements to Route 30 and the adjacent carriageway begin just east of Auburn Street and end at Ash Street. For the segment from Auburn Street to Woodbine Street, the project will narrow the existing median and re-purpose the space on the north side of the roadway to either a shared-use path or separated bicycle and pedestrian facilities. East of Woodbine Street, the existing 22-foot carriageway will be converted to the shared-use path or separated bicycle and pedestrian facilities. The existing cross section of Route 30 will be maintained, but 5-foot shoulders will be striped to allow for on-road bicycling facilities. There will be three mid-block crossings with pedestrian beacons installed at MBTA bus stops and the Blue Heron trail entrance. The intersection at Ash Street will be reconstructed to improve pedestrian and bicycle crossings and address circulation issues at Lyons Field. This project was evaluated using
the MPO’s scoring criteria because it was considered for funding using Regional Target Funds. MassDOT funded the project, however.
Source |
(FFY) 2021 |
2022 |
2023 |
2024 |
2025 |
Total |
Federal Funds |
--- |
--- |
--- |
--- |
4731645 |
$7,895,163 |
Non-Federal Funds |
--- |
--- |
--- |
--- |
1182911 |
$1,894,825 |
Total Funds |
--- |
$9,789,988 |
--- |
--- |
5914556 |
$9,789,988 |
Proponent: Norwood
ID Number: 606130
Project Type: Intersection Improvements
Cost: $ 8,270,371
Funding Source: Regional Target Funds
Category |
Safety |
Sys Pres |
CM/M |
CA/SC |
TE |
EV |
Total |
Score |
13 out of 30 |
7 out of 29 |
14 out of 29 |
3 out of 16 |
3 out of 12 |
7 out of 18 |
47 out of 134 |
This project involves intersection improvements at two locations on Route 1A through the installation of traffic and pedestrian signals to support vehicle flow and roadway safety. In addition, Washington Street and Upland Road will be widened to accommodate turning lanes and existing sidewalks will be reconstructed to meet ADA/AAB standards with upgraded pavement markings.
Source |
(FFY) 2021 |
2022 |
2023 |
2024 |
2025 |
Total |
Federal Funds |
--- |
$6,616,297 |
--- |
--- |
--- |
$6,616,297 |
Non-Federal Funds |
--- |
$1,654,074 |
--- |
--- |
--- |
$1,654,074 |
Total Funds |
--- |
$8,270,371 |
--- |
--- |
--- |
$8,270,371 |
Proponent: Peabody
ID Number: 608933
Project Type: Complete Streets
Cost: $10,432,800
Funding Source: Regional Target Funds
Category |
Safety |
Sys Pres |
CM/M |
CA/SC |
TE |
EV |
Total |
Score |
21 out of 30 |
17 out of 29 |
9 out of 29 |
3 out of 16 |
7 out of 12 |
4 out of 18 |
61 out of 134 |
Given the condition of the existing pavement based on a visual inspection, as well as the number of utility trenches that have exhibited signs of differential settlement, the project is currently proposed to reconstruct the pavement via full depth pavement reclamation. The project will also include the reconstruction of cement concrete sidewalks and crossings with curb extensions and new granite curbing, addition of dedicated bicycle accommodations (bike lane and/or sharrows), installation of new signage and pavement markings, streetscape enhancements and amenities, and drainage system improvements corridor-wide. For the reconstructed intersections noted, new signal equipment will be provided at all locations. All signal equipment proposed will be NEMA TS2 Type 1, with countdown pedestrian heads, vibrotactile pedestrian push buttons with audible speech messages, optical emergency vehicles preemption, and video vehicle detection.
Source |
(FFY) 2021 |
2022 |
2023 |
2024 |
2025 |
Total |
Federal Funds |
--- |
--- |
$8,496,240 |
--- |
--- |
$8,496,240 |
Non-Federal Funds |
--- |
--- |
$1,936,560 |
--- |
--- |
$1,936,560 |
Total Funds |
--- |
--- |
$10,432,800 |
--- |
--- |
$10,432,800 |
Proponent: MassDOT
ID Number: 609211
Project Type: Bicycle and Pedestrian
Cost: $3,368,680
Funding Source: Regional Target Funds
Category |
Safety |
Sys Pres |
CM/M |
CA/SC |
TE |
EV |
Total |
Score |
9 out of 30 |
4 out of 29 |
9 out of 29 |
4 out of 16 |
4 out of 12 |
4 out of 18 |
34 out of 134 |
This project will extend the Independence Greenway 1.3 miles east from its present terminus at the North Shore Mall to the intersection of the Warren Street Extension and Endicott Street in central Peabody. When complete, the project will bring the greenway’s total length to 8 miles. This project makes use of an existing rail corridor as it runs parallel to Lowell Street.
Source |
(FFY) 2021 |
2022 |
2023 |
2024 |
2025 |
Total |
Federal Funds |
--- |
--- |
--- |
$2,694,944 |
--- |
$2,694,944 |
Non-Federal Funds |
--- |
--- |
--- |
$673,736 |
--- |
$673,736 |
Total Funds |
--- |
--- |
--- |
$3,368,680 |
--- |
$3,368,680 |
Proponent: Peabody
ID Number: 610544
Project Type: Bicycle and Pedestrian
Cost: $6,803,400
Funding Source: Statewide Highway Funds
Category |
Safety |
Sys Pres |
CM/M |
CA/SC |
TE |
EV |
Total |
Score |
15 out of 30 |
13 out of 29 |
11 out of 29 |
4 out of 16 |
4 out of 12 |
6 out of 18 |
53 out of 134 |
The project includes construction of a new 12-foot wide multi-use paved path along the abandoned railbed between two existing segments of the Independence Greenway in Peabody. The project also includes a connection to the existing Border to Boston trailhead at Lowell Street. The work includes full-depth pavement construction, minor drainage improvements, vegetative privacy screening, new and reset granite curb, new cement concrete sidewalk and hot mix asphalt, signal upgrades at Lowell/Bourbon Street and Route 1 NB/Lowell Street intersection, a new 2-span steel pedestrian bridge, and various curb, walking, and parking improvements to the existing parking lot at 215 Newbury Street.
Source |
(FFY) 2021 |
2022 |
2023 |
2024 |
2025 |
Total |
Federal Funds |
--- |
--- |
--- |
--- |
$5,442,720 |
$5,442,720 |
Non-Federal Funds |
--- |
--- |
--- |
--- |
$1,360,680 |
$1,360,680 |
Total Funds |
--- |
--- |
--- |
--- |
$6,803,400 |
$6,803,400 |
Proponent: MassDOT
ID Number: 608707
Project Type: Complete Streets
Cost: $6,068,190
Funding Source: Regional Target Funds
Category |
Safety |
Sys Pres |
CM/M |
CA/SC |
TE |
EV |
Total |
Score |
10 out of 30 |
16 out of 29 |
7 out of 29 |
4 out of 16 |
2 out of 12 |
1 out of 18 |
40 out of 134 |
This project involves traffic and safety improvements for all users along Sea Street through the reconstruction of sidewalks with ADA-compliant ramps, the provision of bicycle accommodations, and the construction of median islands. Geometric modifications of the roadway and upgraded traffic signal systems will also be established to enhance safety.
Source |
(FFY) 2021 |
2022 |
2023 |
2024 |
2025 |
Total |
Federal Funds |
--- |
--- |
$4,854,552 |
--- |
--- |
$4,854,552 |
Non-Federal Funds |
--- |
--- |
$1,213,638 |
--- |
--- |
$1,213,638 |
Total Funds |
--- |
--- |
$6,068,190 |
--- |
--- |
$6,068,190 |
Proponent: MassDOT
ID Number: 609399
Project Type: Non-Interstate Pavement
Cost: $6,970,656
Funding Source: Statewide Highway Funds
This is a MassDOT-prioritized project and is therefore not directly evaluated using the MPO’s TIP scoring criteria.
This project involves the resurfacing of 13.2 lane miles of Route 28 in Randolph. The project includes two sections of Route 28, from mile marker 105.8 to 107.4 and from mile marker 107.6 to 109.3.
Source |
(FFY) 2021 |
2022 |
2023 |
2024 |
2025 |
Total |
Federal Funds |
--- |
--- |
--- |
$5,576,525 |
--- |
$5,576,525 |
Non-Federal Funds |
--- |
--- |
--- |
$1,394,131 |
--- |
$1,394,131 |
Total Funds |
--- |
--- |
--- |
$6,970,656 |
--- |
$6,970,656 |
Proponent: MassDOT
ID Number: 609396
Project Type: Non-Interstate Pavement
Cost: $6,970,656
Funding Source: Statewide Highway Funds
This is a MassDOT-prioritized project and is therefore not directly evaluated using the MPO’s TIP scoring criteria.
This project involves the resurfacing of 13.2 lane miles of Route 28 in Randolph and Milton. The project includes two sections of Route 28, from mile marker 110.0 to 111.6 and from mile marker 111.7 to 114.0.
Source |
(FFY) 2021 |
2022 |
2023 |
2024 |
2025 |
Total |
Federal Funds |
--- |
--- |
--- |
$5,576,525 |
--- |
$5,576,525 |
Non-Federal Funds |
--- |
--- |
--- |
$1,394,131 |
--- |
$1,394,131 |
Total Funds |
--- |
--- |
--- |
$6,970,656 |
--- |
$6,970,656 |
Proponent: Reading
ID Number: 607305
Project Type: Intersection Improvements
Cost: $1,683,095
Funding Source: Regional Target Funds
Category |
Safety |
Sys Pres |
CM/M |
CA/SC |
TE |
EV |
Total |
Score |
10 out of 30 |
12 out of 29 |
5 out of 29 |
2 out of 16 |
2 out of 12 |
7 out of 18 |
38 out of 134 |
The project will install traffic control signals at this high crash location and interconnect the new signals with the existing signals at Main Street and Summer Street and at Main Street and South Street. The project will also include construction of AAB/ADA compliant sidewalks and wheelchair ramps and geometric improvements.
Source |
(FFY) 2021 |
2022 |
2023 |
2024 |
2025 |
Total |
Federal Funds |
$1,421,518 |
--- |
--- |
--- |
--- |
$1,421,518 |
Non-Federal Funds |
$261,577 |
--- |
--- |
--- |
--- |
$261,577 |
Total Funds |
$1,683,095 |
--- |
--- |
--- |
--- |
$1,683,095 |
Proponent: Regional
ID Number: S10782
Project Type: Community Connections
Cost: $8,000,000
Funding Source: Regional Target Funds
Projects funded through this program are evaluated by the MPO using a set of criteria that differs from that used for other TIP projects. These criteria are listed in Appendix A in Table A-5. Scores for projects funded in FFY 2021 through the Community Connections program are available on those projects’ pages within this chapter.
The Community Connections (CC) Program is the MPO’s funding program for first- and last-mile solutions, community transportation, and other small, nontraditional transportation projects such as updating transit technology and improving bicycle and pedestrian facilities. The CC program is one of the investment programs included in the MPO’s current Long-Range Transportation Plan (LRTP), Destination 2040, and is funded at a level of $2 million per year in Regional Target funds beginning in FFY 2021. Five projects were funded in FFY 2021 through the MPO’s pilot round of this program, the details of which are available in this chapter. Funding in FFYs 2022 through 2025 will be allocated during future TIP cycles.
Source |
(FFY) 2021 |
2022 |
2023 |
2024 |
2025 |
Total |
Federal Funds |
--- |
$1,600,000 |
$1,600,000 |
$1,600,000 |
$1,600,000 |
$6,400,000 |
Non-Federal Funds |
--- |
$400,000 |
$400,000 |
$400,000 |
$400,000 |
$1,600,000 |
Total Funds |
--- |
$2,000,000 |
$2,000,000 |
$2,000,000 |
$2,000,000 |
$8,000,000 |
Proponent: Regional
ID Number: S10783
Project Type: Community Connections
Cost: $5,500,000
Funding Source: Regional Target Funds
Scoring criteria for this program have not yet been developed. Projects will be evaluated by the MPO in future TIP cycles for funding within this investment program.
The MPO’s Transit Modernization Program was established in Destination 2040, the MPO’s current Long-Range Transportation Plan. This program will allocate a portion of the MPO’s Regional Target Highway funds to transit projects that advance the MPO’s goals in the region, including upgrades to stations and facilities and the purchase of vehicles for transit providers. Scoring criteria are being developed for this program during FFY 2020 and specific projects will be funded through this program during a future TIP cycle. The MPO anticipates allocating five percent of its funding, or approximately $5,500,000 annually, to this program beginning in FFY 2025.
Source |
(FFY) 2021 |
2022 |
2023 |
2024 |
2025 |
Total |
Federal Funds |
--- |
--- |
--- |
--- |
$4,400,000 |
$4,400,000 |
Non-Federal Funds |
--- |
--- |
--- |
--- |
$1,100,000 |
$1,100,000 |
Total Funds |
--- |
--- |
--- |
--- |
$5,500,000 |
$5,500,000 |
Proponent: Sharon
ID Number: 608079
Project Type: Bridge
Cost: $6,736,333
Funding Source: Statewide Highway Funds
This is a MassDOT-prioritized project and is therefore not directly evaluated using the MPO’s TIP scoring criteria.
This project will replace the bridge that carrries Maskwonicut Street over the Amtrak and MBTA tracks. The bridge is currently closed due to deterioration.
Source |
(FFY) 2021 |
2022 |
2023 |
2024 |
2025 |
Total |
Federal Funds |
$5,389,066 |
--- |
--- |
--- |
--- |
$5,389,066 |
Non-Federal Funds |
$1,347,267 |
--- |
--- |
--- |
--- |
$1,347,267 |
Total Funds |
$6,736,333 |
--- |
--- |
--- |
--- |
$6,736,333 |
Proponent: Sharon
ID Number: S10787
Project Type: Community Connections
Cost: $42,000
Funding Source: Regional Target Funds
This project received a total score of 14 points when evaluated using the MPO’s Community Connections Program criteria. These criteria are listed in Table A-5.
This project includes funding for the Town of Sharon to develop a partnership with a carpool marketing firm to promote shared rides to Sharon’s MBTA Commuter Rail station. This project is funded through the pilot round of the MPO’s Community Connections Program.
Source |
(FFY) 2021 |
2022 |
2023 |
2024 |
2025 |
Total |
Federal Funds |
$33,600 |
--- |
--- |
--- |
--- |
$33,600 |
Non-Federal Funds |
$8,400 |
--- |
--- |
--- |
--- |
$8,400 |
Total Funds |
$42,000 |
--- |
--- |
--- |
--- |
$42,000 |
Proponent: MassDOT
ID Number: 606528
Project Type: Bridge
Cost: $37,259,600
Funding Source: Statewide Highway Funds
This is a MassDOT-prioritized project and is therefore not directly evaluated using the MPO’s TIP scoring criteria.
This project will rehabilitate the bridge carrying Interstate 93 between Route 28 and Temple Road in Somerville.
Source |
(FFY) 2021 |
2022 |
2023 |
2024 |
2025 |
Total |
Federal Funds |
$29,807,680 |
--- |
--- |
--- |
--- |
$29,807,680 |
Non-Federal Funds |
$7,451,920 |
--- |
--- |
--- |
--- |
$7,451,920 |
Total Funds |
$37,259,600 |
--- |
--- |
--- |
--- |
$37,259,600 |
Proponent: Somerville
ID Number: S10785
Project Type: Community Connections
Cost: $220,000
Funding Source: Regional Target Funds
This project received a total score of 24 points when evaluated using the MPO’s Community Connections Program criteria. These criteria are listed in Table A-5.
This project includes improvements to the traffic signals throughout Davis Square in Somerville, with a specific focus on upgrading the transit signals supporting the operations of the Davis Square MBTA busway. The goal of this project is to improve bus operations in the Square while promoting safety and accessibility in the area for all other users. This project is funded through the pilot round of the MPO's Community Connections Program.
Source |
(FFY) 2021 |
2022 |
2023 |
2024 |
2025 |
Total |
Federal Funds |
$176,000 |
--- |
--- |
--- |
--- |
$176,000 |
Non-Federal Funds |
$44,000 |
--- |
--- |
--- |
--- |
$44,000 |
Total Funds |
$220,000 |
--- |
--- |
--- |
--- |
$220,000 |
Proponent: MassDOT
ID Number: 608562
Project Type: Intersection Improvements
Cost: $5,065,319
Funding Source: Statewide Highway Funds
This is a MassDOT-prioritized project and is therefore not directly evaluated using the MPO’s TIP scoring criteria.
The project includes traffic signal upgrades and safety improvements at the following locations: Mystic Avenue northbound and Route 28 (Fellsway); Route 38 (Mystic Avenue) southbound and Route 28 (McGrath Highway) southbound; Route 38 (Mystic Avenue) southbound and Route 28 (McGrath Highway) northbound; and Route 38 (Mystic Avenue) southbound at Wheatland Street.
Source |
(FFY) 2021 |
2022 |
2023 |
2024 |
2025 |
Total |
Federal Funds |
--- |
--- |
$4,558,787 |
--- |
--- |
$4,558,787 |
Non-Federal Funds |
--- |
--- |
$506,352 |
--- |
--- |
$506,352 |
Total Funds |
--- |
--- |
$5,065,319 |
--- |
--- |
$5,065,319 |
Proponent: MassDOT
ID Number: 610665
Project Type: Intersection Improvements
Cost: $4,205,001
Funding Source: Statewide Highway Funds
This is a MassDOT-prioritized project and is therefore not directly evaluated using the MPO’s TIP scoring criteria.
This project will make intersection improvements at Route 28 (Main Street), North Border Road and Pond Street in Stoneham.
Source |
(FFY) 2021 |
2022 |
2023 |
2024 |
2025 |
Total |
Federal Funds |
--- |
--- |
--- |
--- |
$3,784,501 |
$3,784,501 |
Non-Federal Funds |
--- |
--- |
--- |
--- |
$420,500 |
$420,500 |
Total Funds |
--- |
--- |
--- |
--- |
$4,205,001 |
$4,205,001 |
Proponent: MassDOT
ID Number: 608255
Project Type: Bridge
Cost: $3,630,898
Funding Source: Statewide Highway Funds
This is a MassDOT-prioritized project and is therefore not directly evaluated using the MPO’s TIP scoring criteria.
Bridge S-29-11, which carries Box Mill Road over Elizabeth Brook, is a structurally deficient bridge. The full replacement will include new substructure, steel beams, and concrete deck. One sidewalk will be added to the structure.
Source |
(FFY) 2021 |
2022 |
2023 |
2024 |
2025 |
Total |
Federal Funds |
--- |
--- |
--- |
$2,904,718 |
--- |
$2,904,718 |
Non-Federal Funds |
--- |
--- |
--- |
$726,180 |
--- |
$726,180 |
Total Funds |
--- |
--- |
--- |
$3,630,898 |
--- |
$3,630,898 |
Proponent: MassDOT
ID Number: 610660
Project Type: Bicycle and Pedestrian
Cost: $4,524,001
Funding Source: Statewide Highway Funds
This is a MassDOT-prioritized project and is therefore not directly evaluated using the MPO’s TIP scoring criteria.
This project includes the construction of the Mass Central Rail Trail segment connecting Sudbury and Wayland.
Source |
(FFY) 2021 |
2022 |
2023 |
2024 |
2025 |
Total |
Federal Funds |
--- |
--- |
--- |
--- |
$3,619,201 |
$3,619,201 |
Non-Federal Funds |
--- |
--- |
--- |
--- |
$904,800 |
$904,800 |
Total Funds |
--- |
--- |
--- |
--- |
$4,524,001 |
$4,524,001 |
Proponent: Sudbury
ID Number: 608164
Project Type: Bicycle and Pedestrian
Cost: $ 13,402,143
Funding Source: Regional Target Fund
Category |
Safety |
Sys Pres |
CM/M |
CA/SC |
TE |
EV |
Total |
Score |
7 out of 30 |
3 out of 29 |
16 out of 29 |
9 out of 16 |
1 out of 12 |
4 out of 18 |
40 out of 134 |
The proposed project involves construction of a 4.6 mile trail in Sudbury, from the Concord town line to Station Road. The proposed work includes improvements to two structures and upgrades to several at-grade crossings, including Route 117 (North Road), Pantry Road, and Route 27 (Hudson Road). Related work includes pavement markings, installation of guardrails, and landscaping. Construction of this phase will accompany the completion of Phase 2C of the trail, closing the gap between Powder Mill Road in Concord and the Sudbury town line to create one contiguous path.
Source |
(FFY) 2021 |
2022 |
2023 |
2024 |
2025 |
Total |
Federal Funds |
--- |
$10,721,715 |
--- |
--- |
--- |
$10,721,715 |
Non-Federal Funds |
--- |
$2,680,428 |
--- |
--- |
--- |
$2,680,428 |
Total Funds |
--- |
$13,402,143 |
--- |
--- |
--- |
$13,402,143 |
Proponent: Norwood
ID Number: 605857
Project Type: Intersection Improvements
Cost: $9,789,988
Funding Source: Regional Target Funds
Category |
Safety |
Sys Pres |
CM/M |
CA/SC |
TE |
EV |
Total |
Score |
11 out of 30 |
12 out of 29 |
15 out of 29 |
11 out of 16 |
2 out of 12 |
4 out of 18 |
55 out of 134 |
This project includes traffic signal upgrades and associated geometric improvements at the intersection of Route 1 with University Avenue and Everett Street. Related improvements include constructing an additional travel lane in each direction on Route 1, upgrading of traffic signals, lengthening of left-turn lanes on Route 1, upgrading of pedestrian crossings at each leg of the intersection, and upgrading of bicycle amenities (loop detectors) at the intersection. Rehabilitation of sidewalks, curbing, median structures, lighting, and guard rails are also proposed.
Source |
(FFY) 2021 |
2022 |
2023 |
2024 |
2025 |
Total |
Federal Funds |
--- |
$7,895,163 |
--- |
--- |
--- |
$7,895,163 |
Non-Federal Funds |
--- |
$1,894,825 |
--- |
--- |
--- |
$1,894,825 |
Total Funds |
--- |
$9,789,988 |
--- |
--- |
--- |
$9,789,988 |
Proponent: Norwood
ID Number: 606130
Project Type: Intersection Improvements
Cost: $ 8,270,371
Funding Source: Regional Target Funds
Category |
Safety |
Sys Pres |
CM/M |
CA/SC |
TE |
EV |
Total |
Score |
13 out of 30 |
7 out of 29 |
14 out of 29 |
3 out of 16 |
3 out of 12 |
7 out of 18 |
47 out of 134 |
This project involves intersection improvements at two locations on Route 1A through the installation of traffic and pedestrian signals to support vehicle flow and roadway safety. In addition, Washington Street and Upland Road will be widened to accommodate turning lanes and existing sidewalks will be reconstructed to meet ADA/AAB standards with upgraded pavement markings.
Source |
(FFY) 2021 |
2022 |
2023 |
2024 |
2025 |
Total |
Federal Funds |
--- |
$6,616,297 |
--- |
--- |
--- |
$6,616,297 |
Non-Federal Funds |
--- |
$1,654,074 |
--- |
--- |
--- |
$1,654,074 |
Total Funds |
--- |
$8,270,371 |
--- |
--- |
--- |
$8,270,371 |
Proponent: Peabody
ID Number: 608933
Project Type: Complete Streets
Cost: $10,432,800
Funding Source: Regional Target Funds
Category |
Safety |
Sys Pres |
CM/M |
CA/SC |
TE |
EV |
Total |
Score |
21 out of 30 |
17 out of 29 |
9 out of 29 |
3 out of 16 |
7 out of 12 |
4 out of 18 |
61 out of 134 |
Given the condition of the existing pavement based on a visual inspection, as well as the number of utility trenches that have exhibited signs of differential settlement, the project is currently proposed to reconstruct the pavement via full depth pavement reclamation. The project will also include the reconstruction of cement concrete sidewalks and crossings with curb extensions and new granite curbing, addition of dedicated bicycle accommodations (bike lane and/or sharrows), installation of new signage and pavement markings, streetscape enhancements and amenities, and drainage system improvements corridor-wide. For the reconstructed intersections noted, new signal equipment will be provided at all locations. All signal equipment proposed will be NEMA TS2 Type 1, with countdown pedestrian heads, vibrotactile pedestrian push buttons with audible speech messages, optical emergency vehicles preemption, and video vehicle detection.
Source |
(FFY) 2021 |
2022 |
2023 |
2024 |
2025 |
Total |
Federal Funds |
--- |
--- |
$8,496,240 |
--- |
--- |
$8,496,240 |
Non-Federal Funds |
--- |
--- |
$1,936,560 |
--- |
--- |
$1,936,560 |
Total Funds |
--- |
--- |
$10,432,800 |
--- |
--- |
$10,432,800 |
Proponent: MassDOT
ID Number: 609211
Project Type: Bicycle and Pedestrian
Cost: $3,368,680
Funding Source: Regional Target Funds
Category |
Safety |
Sys Pres |
CM/M |
CA/SC |
TE |
EV |
Total |
Score |
9 out of 30 |
4 out of 29 |
9 out of 29 |
4 out of 16 |
4 out of 12 |
4 out of 18 |
34 out of 134 |
This project will extend the Independence Greenway 1.3 miles east from its present terminus at the North Shore Mall to the intersection of the Warren Street Extension and Endicott Street in central Peabody. When complete, the project will bring the greenway’s total length to 8 miles. This project makes use of an existing rail corridor as it runs parallel to Lowell Street.
Source |
(FFY) 2021 |
2022 |
2023 |
2024 |
2025 |
Total |
Federal Funds |
--- |
--- |
--- |
$2,694,944 |
--- |
$2,694,944 |
Non-Federal Funds |
--- |
--- |
--- |
$673,736 |
--- |
$673,736 |
Total Funds |
--- |
--- |
--- |
$3,368,680 |
--- |
$3,368,680 |
Proponent: Peabody
ID Number: 610544
Project Type: Bicycle and Pedestrian
Cost: $6,803,400
Funding Source: Statewide Highway Funds
Category |
Safety |
Sys Pres |
CM/M |
CA/SC |
TE |
EV |
Total |
Score |
15 out of 30 |
13 out of 29 |
11 out of 29 |
4 out of 16 |
4 out of 12 |
6 out of 18 |
53 out of 134 |
The project includes construction of a new 12-foot wide multi-use paved path along the abandoned railbed between two existing segments of the Independence Greenway in Peabody. The project also includes a connection to the existing Border to Boston trailhead at Lowell Street. The work includes full-depth pavement construction, minor drainage improvements, vegetative privacy screening, new and reset granite curb, new cement concrete sidewalk and hot mix asphalt, signal upgrades at Lowell/Bourbon Street and Route 1 NB/Lowell Street intersection, a new 2-span steel pedestrian bridge, and various curb, walking, and parking improvements to the existing parking lot at 215 Newbury Street.
Source |
(FFY) 2021 |
2022 |
2023 |
2024 |
2025 |
Total |
Federal Funds |
--- |
--- |
--- |
--- |
$5,442,720 |
$5,442,720 |
Non-Federal Funds |
--- |
--- |
--- |
--- |
$1,360,680 |
$1,360,680 |
Total Funds |
--- |
--- |
--- |
--- |
$6,803,400 |
$6,803,400 |
Proponent: MassDOT
ID Number: 608707
Project Type: Complete Streets
Cost: $6,068,190
Funding Source: Regional Target Funds
Category |
Safety |
Sys Pres |
CM/M |
CA/SC |
TE |
EV |
Total |
Score |
10 out of 30 |
16 out of 29 |
7 out of 29 |
4 out of 16 |
2 out of 12 |
1 out of 18 |
40 out of 134 |
This project involves traffic and safety improvements for all users along Sea Street through the reconstruction of sidewalks with ADA-compliant ramps, the provision of bicycle accommodations, and the construction of median islands. Geometric modifications of the roadway and upgraded traffic signal systems will also be established to enhance safety.
Source |
(FFY) 2021 |
2022 |
2023 |
2024 |
2025 |
Total |
Federal Funds |
--- |
--- |
$4,854,552 |
--- |
--- |
$4,854,552 |
Non-Federal Funds |
--- |
--- |
$1,213,638 |
--- |
--- |
$1,213,638 |
Total Funds |
--- |
--- |
$6,068,190 |
--- |
--- |
$6,068,190 |
Proponent: MassDOT
ID Number: 609399
Project Type: Non-Interstate Pavement
Cost: $6,970,656
Funding Source: Statewide Highway Funds
This is a MassDOT-prioritized project and is therefore not directly evaluated using the MPO’s TIP scoring criteria.
This project involves the resurfacing of 13.2 lane miles of Route 28 in Randolph. The project includes two sections of Route 28, from mile marker 105.8 to 107.4 and from mile marker 107.6 to 109.3.
Source |
(FFY) 2021 |
2022 |
2023 |
2024 |
2025 |
Total |
Federal Funds |
--- |
--- |
--- |
$5,576,525 |
--- |
$5,576,525 |
Non-Federal Funds |
--- |
--- |
--- |
$1,394,131 |
--- |
$1,394,131 |
Total Funds |
--- |
--- |
--- |
$6,970,656 |
--- |
$6,970,656 |
Proponent: MassDOT
ID Number: 609396
Project Type: Non-Interstate Pavement
Cost: $6,970,656
Funding Source: Statewide Highway Funds
This is a MassDOT-prioritized project and is therefore not directly evaluated using the MPO’s TIP scoring criteria.
This project involves the resurfacing of 13.2 lane miles of Route 28 in Randolph and Milton. The project includes two sections of Route 28, from mile marker 110.0 to 111.6 and from mile marker 111.7 to 114.0.
Source |
(FFY) 2021 |
2022 |
2023 |
2024 |
2025 |
Total |
Federal Funds |
--- |
--- |
--- |
$5,576,525 |
--- |
$5,576,525 |
Non-Federal Funds |
--- |
--- |
--- |
$1,394,131 |
--- |
$1,394,131 |
Total Funds |
--- |
--- |
--- |
$6,970,656 |
--- |
$6,970,656 |
Proponent: Reading
ID Number: 607305
Project Type: Intersection Improvements
Cost: $1,683,095
Funding Source: Regional Target Funds
Category |
Safety |
Sys Pres |
CM/M |
CA/SC |
TE |
EV |
Total |
Score |
10 out of 30 |
12 out of 29 |
5 out of 29 |
2 out of 16 |
2 out of 12 |
7 out of 18 |
38 out of 134 |
The project will install traffic control signals at this high crash location and interconnect the new signals with the existing signals at Main Street and Summer Street and at Main Street and South Street. The project will also include construction of AAB/ADA compliant sidewalks and wheelchair ramps and geometric improvements.
Source |
(FFY) 2021 |
2022 |
2023 |
2024 |
2025 |
Total |
Federal Funds |
$1,421,518 |
--- |
--- |
--- |
--- |
$1,421,518 |
Non-Federal Funds |
$261,577 |
--- |
--- |
--- |
--- |
$261,577 |
Total Funds |
$1,683,095 |
--- |
--- |
--- |
--- |
$1,683,095 |
Proponent: Regional
ID Number: S10782
Project Type: Community Connections
Cost: $8,000,000
Funding Source: Regional Target Funds
Projects funded through this program are evaluated by the MPO using a set of criteria that differs from that used for other TIP projects. These criteria are listed in Appendix A in Table A-5. Scores for projects funded in FFY 2021 through the Community Connections program are available on those projects’ pages within this chapter.
The Community Connections (CC) Program is the MPO’s funding program for first- and last-mile solutions, community transportation, and other small, nontraditional transportation projects such as updating transit technology and improving bicycle and pedestrian facilities. The CC program is one of the investment programs included in the MPO’s current Long-Range Transportation Plan (LRTP), Destination 2040, and is funded at a level of $2 million per year in Regional Target funds beginning in FFY 2021. Five projects were funded in FFY 2021 through the MPO’s pilot round of this program, the details of which are available in this chapter. Funding in FFYs 2022 through 2025 will be allocated during future TIP cycles.
Source |
(FFY) 2021 |
2022 |
2023 |
2024 |
2025 |
Total |
Federal Funds |
--- |
$1,600,000 |
$1,600,000 |
$1,600,000 |
$1,600,000 |
$6,400,000 |
Non-Federal Funds |
--- |
$400,000 |
$400,000 |
$400,000 |
$400,000 |
$1,600,000 |
Total Funds |
--- |
$2,000,000 |
$2,000,000 |
$2,000,000 |
$2,000,000 |
$8,000,000 |
Proponent: Regional
ID Number: S10783
Project Type: Community Connections
Cost: $5,500,000
Funding Source: Regional Target Funds
Scoring criteria for this program have not yet been developed. Projects will be evaluated by the MPO in future TIP cycles for funding within this investment program.
The MPO’s Transit Modernization Program was established in Destination 2040, the MPO’s current Long-Range Transportation Plan. This program will allocate a portion of the MPO’s Regional Target Highway funds to transit projects that advance the MPO’s goals in the region, including upgrades to stations and facilities and the purchase of vehicles for transit providers. Scoring criteria are being developed for this program during FFY 2020 and specific projects will be funded through this program during a future TIP cycle. The MPO anticipates allocating five percent of its funding, or approximately $5,500,000 annually, to this program beginning in FFY 2025.
Source |
(FFY) 2021 |
2022 |
2023 |
2024 |
2025 |
Total |
Federal Funds |
--- |
--- |
--- |
--- |
$4,400,000 |
$4,400,000 |
Non-Federal Funds |
--- |
--- |
--- |
--- |
$1,100,000 |
$1,100,000 |
Total Funds |
--- |
--- |
--- |
--- |
$5,500,000 |
$5,500,000 |
Proponent: Sharon
ID Number: 608079
Project Type: Bridge
Cost: $6,736,333
Funding Source: Statewide Highway Funds
This is a MassDOT-prioritized project and is therefore not directly evaluated using the MPO’s TIP scoring criteria.
This project will replace the bridge that carrries Maskwonicut Street over the Amtrak and MBTA tracks. The bridge is currently closed due to deterioration.
Source |
(FFY) 2021 |
2022 |
2023 |
2024 |
2025 |
Total |
Federal Funds |
$5,389,066 |
--- |
--- |
--- |
--- |
$5,389,066 |
Non-Federal Funds |
$1,347,267 |
--- |
--- |
--- |
--- |
$1,347,267 |
Total Funds |
$6,736,333 |
--- |
--- |
--- |
--- |
$6,736,333 |
Proponent: Sharon
ID Number: S10787
Project Type: Community Connections
Cost: $42,000
Funding Source: Regional Target Funds
This project received a total score of 14 points when evaluated using the MPO’s Community Connections Program criteria. These criteria are listed in Table A-5.
This project includes funding for the Town of Sharon to develop a partnership with a carpool marketing firm to promote shared rides to Sharon’s MBTA Commuter Rail station. This project is funded through the pilot round of the MPO’s Community Connections Program.
Source |
(FFY) 2021 |
2022 |
2023 |
2024 |
2025 |
Total |
Federal Funds |
$33,600 |
--- |
--- |
--- |
--- |
$33,600 |
Non-Federal Funds |
$8,400 |
--- |
--- |
--- |
--- |
$8,400 |
Total Funds |
$42,000 |
--- |
--- |
--- |
--- |
$42,000 |
Proponent: MassDOT
ID Number: 606528
Project Type: Bridge
Cost: $37,259,600
Funding Source: Statewide Highway Funds
This is a MassDOT-prioritized project and is therefore not directly evaluated using the MPO’s TIP scoring criteria.
This project will rehabilitate the bridge carrying Interstate 93 between Route 28 and Temple Road in Somerville.
Source |
(FFY) 2021 |
2022 |
2023 |
2024 |
2025 |
Total |
Federal Funds |
$29,807,680 |
--- |
--- |
--- |
--- |
$29,807,680 |
Non-Federal Funds |
$7,451,920 |
--- |
--- |
--- |
--- |
$7,451,920 |
Total Funds |
$37,259,600 |
--- |
--- |
--- |
--- |
$37,259,600 |
Proponent: Somerville
ID Number: S10785
Project Type: Community Connections
Cost: $220,000
Funding Source: Regional Target Funds
This project received a total score of 24 points when evaluated using the MPO’s Community Connections Program criteria. These criteria are listed in Table A-5.
This project includes improvements to the traffic signals throughout Davis Square in Somerville, with a specific focus on upgrading the transit signals supporting the operations of the Davis Square MBTA busway. The goal of this project is to improve bus operations in the Square while promoting safety and accessibility in the area for all other users. This project is funded through the pilot round of the MPO's Community Connections Program.
Source |
(FFY) 2021 |
2022 |
2023 |
2024 |
2025 |
Total |
Federal Funds |
$176,000 |
--- |
--- |
--- |
--- |
$176,000 |
Non-Federal Funds |
$44,000 |
--- |
--- |
--- |
--- |
$44,000 |
Total Funds |
$220,000 |
--- |
--- |
--- |
--- |
$220,000 |
Proponent: MassDOT
ID Number: 608562
Project Type: Intersection Improvements
Cost: $5,065,319
Funding Source: Statewide Highway Funds
This is a MassDOT-prioritized project and is therefore not directly evaluated using the MPO’s TIP scoring criteria.
The project includes traffic signal upgrades and safety improvements at the following locations: Mystic Avenue northbound and Route 28 (Fellsway); Route 38 (Mystic Avenue) southbound and Route 28 (McGrath Highway) southbound; Route 38 (Mystic Avenue) southbound and Route 28 (McGrath Highway) northbound; and Route 38 (Mystic Avenue) southbound at Wheatland Street.
Source |
(FFY) 2021 |
2022 |
2023 |
2024 |
2025 |
Total |
Federal Funds |
--- |
--- |
$4,558,787 |
--- |
--- |
$4,558,787 |
Non-Federal Funds |
--- |
--- |
$506,352 |
--- |
--- |
$506,352 |
Total Funds |
--- |
--- |
$5,065,319 |
--- |
--- |
$5,065,319 |
Proponent: MassDOT
ID Number: 610665
Project Type: Intersection Improvements
Cost: $4,205,001
Funding Source: Statewide Highway Funds
This is a MassDOT-prioritized project and is therefore not directly evaluated using the MPO’s TIP scoring criteria.
This project will make intersection improvements at Route 28 (Main Street), North Border Road and Pond Street in Stoneham.
Source |
(FFY) 2021 |
2022 |
2023 |
2024 |
2025 |
Total |
Federal Funds |
--- |
--- |
--- |
--- |
$3,784,501 |
$3,784,501 |
Non-Federal Funds |
--- |
--- |
--- |
--- |
$420,500 |
$420,500 |
Total Funds |
--- |
--- |
--- |
--- |
$4,205,001 |
$4,205,001 |
Proponent: MassDOT
ID Number: 608255
Project Type: Bridge
Cost: $3,630,898
Funding Source: Statewide Highway Funds
This is a MassDOT-prioritized project and is therefore not directly evaluated using the MPO’s TIP scoring criteria.
Bridge S-29-11, which carries Box Mill Road over Elizabeth Brook, is a structurally deficient bridge. The full replacement will include new substructure, steel beams, and concrete deck. One sidewalk will be added to the structure.
Source |
(FFY) 2021 |
2022 |
2023 |
2024 |
2025 |
Total |
Federal Funds |
--- |
--- |
--- |
$2,904,718 |
--- |
$2,904,718 |
Non-Federal Funds |
--- |
--- |
--- |
$726,180 |
--- |
$726,180 |
Total Funds |
--- |
--- |
--- |
$3,630,898 |
--- |
$3,630,898 |
Proponent: MassDOT
ID Number: 610660
Project Type: Bicycle and Pedestrian
Cost: $4,524,001
Funding Source: Statewide Highway Funds
This is a MassDOT-prioritized project and is therefore not directly evaluated using the MPO’s TIP scoring criteria.
This project includes the construction of the Mass Central Rail Trail segment connecting Sudbury and Wayland.
Source |
(FFY) 2021 |
2022 |
2023 |
2024 |
2025 |
Total |
Federal Funds |
--- |
--- |
--- |
--- |
$3,619,201 |
$3,619,201 |
Non-Federal Funds |
--- |
--- |
--- |
--- |
$904,800 |
$904,800 |
Total Funds |
--- |
--- |
--- |
--- |
$4,524,001 |
$4,524,001 |
Proponent: Sudbury
ID Number: 608164
Project Type: Bicycle and Pedestrian
Cost: $ 13,402,143
Funding Source: Regional Target Fund
Category |
Safety |
Sys Pres |
CM/M |
CA/SC |
TE |
EV |
Total |
Score |
7 out of 30 |
3 out of 29 |
16 out of 29 |
9 out of 16 |
1 out of 12 |
4 out of 18 |
40 out of 134 |
The proposed project involves construction of a 4.6 mile trail in Sudbury, from the Concord town line to Station Road. The proposed work includes improvements to two structures and upgrades to several at-grade crossings, including Route 117 (North Road), Pantry Road, and Route 27 (Hudson Road). Related work includes pavement markings, installation of guardrails, and landscaping. Construction of this phase will accompany the completion of Phase 2C of the trail, closing the gap between Powder Mill Road in Concord and the Sudbury town line to create one contiguous path.
Source |
(FFY) 2021 |
2022 |
2023 |
2024 |
2025 |
Total |
Federal Funds |
--- |
$10,721,715 |
--- |
--- |
--- |
$10,721,715 |
Non-Federal Funds |
--- |
$2,680,428 |
--- |
--- |
--- |
$2,680,428 |
Total Funds |
--- |
$13,402,143 |
--- |
--- |
--- |
$13,402,143 |
Proponent: Swampscott
ID Number: 607761
Project Type: Intersection Improvements
Cost: $1,337,074
Funding Source: Statewide Highway Funds
This is a MassDOT-prioritized project and is therefore not directly evaluated using the MPO’s TIP scoring criteria.
The project will make safety upgrades to the intersection of Route 1A (Paradise Road) at Swampscott Mall. The upgrades will include signs, pavement markings, and traffic signals as identified through a Road Safety Audit process.
Source |
(FFY) 2021 |
2022 |
2023 |
2024 |
2025 |
Total |
Federal Funds |
$1,203,367 |
--- |
--- |
--- |
--- |
$1,203,367 |
Non-Federal Funds |
$133,707 |
--- |
--- |
--- |
--- |
$133,707 |
Total Funds |
$1,337,074 |
--- |
--- |
--- |
--- |
$1,337,074 |
Proponent: Watertown
ID Number: 607777
Project Type: Complete Streets
Cost: $28,340,090
Funding Source: Regional Target Funds
Category |
Safety |
Sys Pres |
CM/M |
CA/SC |
TE |
EV |
Total |
Score |
18 out of 30 |
14 out of 29 |
18 out of 29 |
12 out of 16 |
3 out of 12 |
10 out of 18 |
75 out of 134 |
The project will reconstruct approximately 9,300 feet of Mount Auburn Street, from the Cambridge city line to the intersection with Summer Street, just east of Watertown Square. The project involves revisions to the roadway geometry, including a roadway diet to reduce the number of lanes; safety improvements; multi-modal accommodations, including shared or exclusive bike lanes; improvements to the existing traffic signal equipment; and improved ADA amenities at intersections.
Source |
(FFY) 2021 |
2022 |
2023 |
2024 |
2025 |
Total |
Federal Funds |
--- |
$8,638,838 |
$14,233,234 |
--- |
--- |
$22,872,072 |
Non-Federal Funds |
--- |
$1,909,710 |
$3,558,308 |
--- |
--- |
$5,468,018 |
Total Funds |
--- |
$10,548,548 |
$17,791,542 |
--- |
--- |
$28,340,090 |
Proponent: MassDOT
ID Number: 609066
Project Type: Bicycle and Pedestrian
Cost: $2,875,342
Funding Source: Statewide Highway Funds
Category |
Safety |
Sys Pres |
CM/M |
CA/SC |
TE |
EV |
Total |
Score |
6 out of 30 |
3 out of 29 |
9 out of 29 |
4 out of 16 |
2 out of 12 |
0 out of 18 |
24 out of 134 |
This project would create a multi-use trail connection, from Recreation Road to Upper Charles River Greenway including reconstruction of pedestrian bridge N-12-078=W-29-062. This project was evaluated using the MPO’s scoring criteria because it was considered for funding using Regional Target funds. MassDOT funded the project, however.
Source |
(FFY) 2021 |
2022 |
2023 |
2024 |
2025 |
Total |
Federal Funds |
--- |
$2,300,274 |
--- |
--- |
--- |
$2,300,274 |
Non-Federal Funds |
--- |
$575,068 |
--- |
--- |
--- |
$575,068 |
Total Funds |
--- |
$2,875,342 |
--- |
--- |
--- |
$2,875,342 |
Proponent: MassDOT
ID Number: 607327
Project Type: Bridge
Cost: $10,759,996
Funding Source: Statewide Highway Funds
This is a MassDOT-prioritized project and is therefore not directly evaluated using the MPO’s TIP scoring criteria.
This project will replace the bridge that carries Route 38 (Main Street) over the B&M Railroad in Wilmington.
Source |
(FFY) 2021 |
2022 |
2023 |
2024 |
2025 |
Total |
Federal Funds |
--- |
$8,607,997 |
--- |
--- |
--- |
$8,607,997 |
Non-Federal Funds |
--- |
$2,151,999 |
--- |
--- |
--- |
$2,151,999 |
Total Funds |
--- |
$10,759,996 |
--- |
--- |
--- |
$10,759,996 |
Proponent: MassDOT
ID Number: 608703
Project Type: Bridge
Cost: $17,133,432
Funding Source: Statewide Highway Funds
This is a MassDOT-prioritized project and is therefore not directly evaluated using the MPO’s TIP scoring criteria.
Bridge replacement, W-38-029 (2KV), Route 129 (Lowell Street) over Interstate 93.
Source |
(FFY) 2021 |
2022 |
2023 |
2024 |
2025 |
Total |
Federal Funds |
--- |
--- |
--- |
--- |
$13,706,746 |
$13,706,746 |
Non-Federal Funds |
--- |
--- |
--- |
--- |
$3,426,686 |
$3,426,686 |
Total Funds |
--- |
--- |
--- |
--- |
$17,133,432 |
$17,133,432 |
Proponent: MassDOT
ID Number: 608929
Project Type: Bridge
Cost: $5,181,488
Funding Source: Statewide Highway Funds
This is a MassDOT-prioritized project and is therefore not directly evaluated using the MPO’s TIP scoring criteria.
Bridge replacement, W-38-003, Butters Row over MBTA
Source |
(FFY) 2021 |
2022 |
2023 |
2024 |
2025 |
Total |
Federal Funds |
--- |
$4,145,190 |
--- |
--- |
--- |
$4,145,190 |
Non-Federal Funds |
--- |
$1,036,298 |
--- |
--- |
--- |
$1,036,298 |
Total Funds |
--- |
$5,181,488 |
--- |
--- |
--- |
$5,181,488 |
Proponent: Wilmington
ID Number: 609253
Project Type: Intersection Improvements
Cost: $5,063,392
Funding Source: Regional Target Funds
Category |
Safety |
Sys Pres |
CM/M |
CA/SC |
TE |
EV |
Total |
Score |
13 out of 30 |
12 out of 29 |
16 out of 29 |
9 out of 16 |
1 out of 12 |
2 out of 18 |
53 out of 134 |
This project involves traffic safety and efficiency improvements at the intersection of Lowell Street (Route 129) and Woburn Street. The improvements include geometric modification of the roadway along the eastbound approach of Lowell Street to improve intersection visibility. The construction of new pedestrian signals and crosswalks for all approaches will address current pedestrian safety issues in the intersection. In addition, bicycle lanes will be constructed on both roadways within the project limits.
Source |
(FFY) 2021 |
2022 |
2023 |
2024 |
2025 |
Total |
Federal Funds |
--- |
--- |
--- |
$4,217,053 |
--- |
$4,217,053 |
Non-Federal Funds |
--- |
--- |
--- |
$846,339 |
--- |
$846,339 |
Total Funds |
--- |
--- |
--- |
$5,063,392 |
--- |
$5,063,392 |
Proponent: Wilmington
ID Number: 608051
Project Type: Complete Streets
Cost: $19,599,506
Funding Source: Regional Target Funds
Category |
Safety |
Sys Pres |
CM/M |
CA/SC |
TE |
EV |
Total |
Score |
15 out of 30 |
12 out of 29 |
13 out of 29 |
10 out of 16 |
1 out of 12 |
8 out of 18 |
59 out of 134 |
This project includes the addition of 5-foot bicycle lanes along both sides of the roadway along the Route 38 corridor. Sidewalks will also be provided along both sides of the roadway between Route 62 and Route 129. In addition, improved traffic signals and the reconstruction of turn lanes will enhance pedestrian safety and improve vehicular flow.
Source |
(FFY) 2021 |
2022 |
2023 |
2024 |
2025 |
Total |
Federal Funds |
--- |
--- |
--- |
$15,779,605 |
--- |
$15,779,605 |
Non-Federal Funds |
--- |
--- |
--- |
$3,819,901 |
--- |
$3,819,901 |
Total Funds |
--- |
--- |
--- |
$19,599,506 |
--- |
$19,599,506 |
Proponent: Winthrop
ID Number: 607244
Project Type: Complete Streets
Cost: $6,323,116
Funding Source: Regional Target Funds
Category |
Safety |
Sys Pres |
CM/M |
CA/SC |
TE |
EV |
Total |
Score |
11 out of 30 |
14 out of 29 |
12 out of 29 |
8 out of 16 |
4 out of 12 |
5 out of 18 |
54 out of 134 |
This project will include pavement reconstruction and reclamation, sidewalk reconstruction and intersection improvements at key locations along the corridor. Improvements to the bicycle and pedestrian conditions will be implemented.
Source |
(FFY) 2021 |
2022 |
2023 |
2024 |
2025 |
Total |
Federal Funds |
--- |
--- |
$5,058,493 |
--- |
--- |
$5,058,493 |
Non-Federal Funds |
--- |
--- |
$1,264,623 |
--- |
--- |
$1,264,623 |
Total Funds |
--- |
--- |
$6,323,116 |
--- |
--- |
$6,323,116 |
Proponent: Woburn
ID Number: 604996
Project Type: Major Infrastructure
Cost: $18,280,891
Funding Source: Regional Target Funds
Category |
Safety |
Sys Pres |
CM/M |
CA/SC |
TE |
EV |
Total |
Score |
9 out of 30 |
1 out of 29 |
21 out of 29 |
12 out of 16 |
0 out of 12 |
12 out of 18 |
55 out of 134 |
This project involves operational and roadway improvements for New Boston Street over the MBTA commuter rail line. The improvements include the reconstruction of approximately 1,850 feet (0.35 miles) of New Boston Street, the construction of a new 3-span bridge crossing the New Hampshire Main Line, pavement reconstruction, and drainage upgrades.
Source |
(FFY) 2021 |
2022 |
2023 |
2024 |
2025 |
Total |
Federal Funds |
$14,624,713 |
--- |
--- |
--- |
--- |
$14,624,713 |
Non-Federal Funds |
$3,656,178 |
--- |
--- |
--- |
--- |
$3,656,178 |
Total Funds |
$18,280,891 |
--- |
--- |
--- |
--- |
$18,280,891 |
Proponent: Woburn
ID Number: 610622
Project Type: Complete Streets
Cost: $16,680,800
Funding Source: Regional Target Funds
Category |
Safety |
Sys Pres |
CM/M |
CA/SC |
TE |
EV |
Total |
Score |
22 out of 30 |
15 out of 29 |
16 out of 29 |
10 out of 16 |
4 out of 12 |
8 out of 18 |
75 out of 134 |
The primary goals for this project are to improve safety for drivers, pedestrians, and bicyclists while improving congestion within the Woburn Common area. The project consists of safety and operational improvements and includes the reconfiguration of the Woburn Common rotary to a more traditional configuration. The project will include roadway reconstruction, roadway realignment, sidewalk reconstruction, and the addition of bicycle lanes. One new signal will be added and two existing signals will be replaced. The project will be consistent with Woburn’s adopted complete streets policy.
Source |
(FFY) 2021 |
2022 |
2023 |
2024 |
2025 |
Total |
Federal Funds |
--- |
--- |
--- |
--- |
$13,644,640 |
$13,644,640 |
Non-Federal Funds |
--- |
--- |
--- |
--- |
$3,036,160 |
$3,036,160 |
Total Funds |
--- |
--- |
--- |
--- |
$16,680,800 |
$16,680,800 |
Proponent: Woburn
ID Number: 608067
Project Type: Intersection Improvements
Cost: $1,670,400
Funding Source: Statewide Highway Funds
Category |
Safety |
Sys Pres |
CM/M |
CA/SC |
TE |
EV |
Total |
Score |
9 out of 30 |
11 out of 29 |
19 out of 29 |
7 out of 16 |
2 out of 12 |
4 out of 18 |
52 out of 134 |
The intersection of U.S. Route 3 (Cambridge Street) at South Bedford Street and Bedford Road has been identified as a high-crash location in the Boston region. The existing geometry and traffic operations can often present challenges for motorists, pedestrians, and cyclists. This project will reconstruct the intersection and all traffic signal equipment. Geometry enhancements will be made to accommodate exclusive turn lanes for all approaches to the intersection. The project will include reconstruction of the sidewalk along the east side of Cambridge Street and both sides of the Bedford Road westbound approach, and new sidewalk will be constructed on the south side of South Bedford Street. Bicycle accommodations consisting of 5-foot wide bicycle lanes (with 2-foot wide buffers where feasible) will be provided, as will ADA-compliant MBTA bus stops on Cambridge Street..
Source |
(FFY) 2021 |
2022 |
2023 |
2024 |
2025 |
Total |
Federal Funds |
--- |
--- |
--- |
--- |
$1,336,320 |
$1,336,320 |
Non-Federal Funds |
--- |
--- |
--- |
--- |
$334,080 |
$334,080 |
Total Funds |
--- |
--- |
--- |
--- |
$1,670,400 |
$1,670,400 |
Proponent: MassDOT
ID Number: 603739
Project Type: Intersection Improvements
Cost: $16,786,952
Funding Source: Regional Target Funds
Category |
Safety |
Sys Pres |
CM/M |
CA/SC |
TE |
EV |
Total |
Score |
23 out of 30 |
11 out of 29 |
12 out of 29 |
9 out of 16 |
0 out of 12 |
0 out of 18 |
55 out of 134 |
This project consists of the construction of ramps at the interchange of Route 1A and I-495 to accommodate increased volumes resulting from development at the interchange. The design may proceed by developers and, depending on cost and scale of development proposals, MassDOT may incorporate ramp construction into a highway project. Future mitigation packages for developers may involve a median island to meet MassDOT’s and the Town of Wrentham’s long-range plan for interchange.
Source |
(FFY) 2021 |
2022 |
2023 |
2024 |
2025 |
Total |
Federal Funds |
--- |
--- |
--- |
$13,679,562 |
--- |
$13,679,562 |
Non-Federal Funds |
--- |
--- |
--- |
$3,107,390 |
--- |
$3,107,390 |
Total Funds |
--- |
--- |
--- |
$16,786,952 |
--- |
$16,786,952 |
Performance-based planning and programming (PBPP) applies data and performance management principles to inform decision-making. For the Boston Region Metropolitan Planning Organization (MPO), these decisions focus on achieving desired outcomes for the Boston region’s multimodal transportation system. The purpose of PBPP is to ensure that transportation investment decisions—both for long-term planning and short-term funding—are oriented toward meeting established goals. PBPP principles are credited with improving project and program delivery and providing greater transparency and accountability to the public, among other benefits.
Performance-based planning and programming activities include the following:
The MPO’s PBPP process is shaped by both federal transportation performance management requirements and the MPO’s goals and objectives, which are established as part of the MPO’s Long-Range Transportation Plan (LRTP). This chapter discusses how these two frameworks shape the MPO’s PBPP process; describes the MPO’s current set of performance measures and targets; and explains how the MPO anticipates the projects included in this Transportation Improvement Program (TIP) will help achieve performance targets.
The Moving Ahead for Progress in the 21st Century Act (MAP-21) directed states, MPOs, and public transportation providers to carry out a performance and outcome-based surface transportation program, and these requirements have been continued under the current federal transportation funding law, the Fixing America’s Surface Transportation (FAST) Act. MAP-21 identified seven national goals for the nation’s highway system:
Table 4-1 shows the relationship between these national goal areas and the MPO’s goal areas. The MPO’s goals and related objectives, as approved by the MPO in the LRTP, Destination 2040, are described in more detail in Chapter 1 of this document.
Table 4-1
National and Boston Region MPO Goal Areas
National Goal Area |
Boston Region MPO Goal Area(s) |
Safety |
Safety |
Infrastructure Condition |
System Preservation and Modernization |
System Reliability |
Capacity Management and Mobility |
Congestion Reduction |
Capacity Management and Mobility |
Environmental Sustainability |
Clean Air and Sustainable Communities |
Freight Movement/Economic Vitality |
Capacity Management and Mobility, Economic Vitality |
Reduced Project Delivery Delays |
Not Applicable |
Not Applicable |
Transportation Equity |
Source: Boston Region MPO
MAP-21 and the FAST Act’s federal PBPP mandate is also designed to help the nation’s public transportation systems provide high-quality service to all users, including people with disabilities, seniors, and individuals who depend on public transportation.
The US Department of Transportation (USDOT), in consultation with states, MPOs, and other stakeholders, has established measures in performance areas relevant to the aforementioned national goals through a series of federal rulemakings. Table 4-2 lists federally required performance measures for the transit system and Table 4-3 lists federally required performance measures for the highway system.
Table 4-2
Federally Required Transit Performance Measures
National Goal Area |
Transit Performance Area or Asset Category |
Performance Measures |
Relevant MPO Goal Area |
Safety |
Fatalities |
Total number of reportable fatalities and rate per total vehicle revenue-miles by mode |
Safety |
Safety |
Injuries |
Total number of reportable injuries and rate per total vehicle revenue-miles by mode |
Safety |
Safety |
Safety Events |
Total number of reportable events and rate per total vehicle revenue-miles by mode |
Safety |
Safety |
System Reliability |
Mean distance between major mechanical failures by mode |
Safety |
Infrastructure Condition |
Equipment |
Percent of vehicles that have met or exceeded their Useful Life Benchmark (ULB) |
System Preservation and Modernization |
Infrastructure Condition |
Rolling Stock |
Percent of revenue vehicles within a particular asset class that have met or exceeded their ULB |
System Preservation and Modernization |
Infrastructure Condition |
Infrastructure |
Percent of track segments with performance restrictions |
System Preservation and Modernization |
Infrastructure Condition |
Facilities |
Percent of facilities within an asset class rated below 3.0 on the Federal Transit Administration’s Transit Economic Requirements Model scale |
System Preservation and Modernization |
Sources: National Public Transportation Safety Plan (January 2017), the Public Transportation Agency Safety Plan Rule (Title 49 Code of Federal Regulations [CFR] Part 673), and the Transit Asset Management Rule (49 CFR Part 625).
Table 4-3
Federally Required Roadway Performance Measures
National Goal Area |
Highway |
Performance Measures |
Relevant MPO Goal Area |
Safety |
Injuries and Fatalities |
• Number of fatalities |
Safety |
Infrastructure Condition |
Pavement Condition |
• Percent of pavements on the Interstate System in good condition |
System Preservation and Modernization |
Infrastructure Condition |
Bridge Condition |
• Percent of NHS bridges by deck area classified as in good condition |
System Preservation and Modernization |
System Reliability |
Performance of the National Highway System |
• Percent of the person-miles traveled on the Interstate System that are reliable |
Capacity Management/ Mobility |
System Reliability, Freight Movement and Economic Vitality |
Freight Movement on the Interstate System |
• Truck Travel Time Reliability Index (for truck travel on Interstate highways) |
Capacity Management/ Mobility, Economic Vitality |
Congestion Reduction |
Congestion Mitigation and Air Quality (CMAQ) |
• Annual hours of peak hour excessive delay per capita (for travel on NHS roadways) |
Capacity Management/ Mobility |
Environmental Sustainability |
Congestion Mitigation and Air Quality |
• Total emissions reduction for applicable pollutants and precursors for CMAQ-funded projects in designated nonattainment and maintenance areas1 |
Clean Air/Sustainable Communities |
Note: As of the Federal Highway Administration’s 2019 CMAQ Program performance requirements applicability determination, the Boston Region MPO area contains an area designated as in maintenance for carbon monoxide, so the MPO is currently required to comply with this performance measure requirement.
Sources: Highway Safety Improvement Program Rule (23 CFR 924), and National Performance Management Measures Rule (23 CFR 490).
These performance measures and relevant performance targets are discussed in more detail later in this chapter.
The MPO’s PBPP process must respond to the federal performance management requirements established in MAP-21 and the FAST Act, but it can also address other areas that pertain to its 3C responsibilities or relate to the MPO’s goals and objectives. For example, MAP-21 and the FAST Act do not specify transportation equity performance measures for states and MPOs to monitor. However, the MPO has established a transportation equity goal to ensure that all people receive comparable benefits from, and are not disproportionately burdened by, MPO investments, regardless of race, color, national origin, age, income, ability, or sex.
The MPO’s transportation equity goal and its associated objectives are rooted in several federal regulations and presidential executive orders, including Title VI of the Civil Rights Act of 1964, Executive Order 12898 (addressing environmental justice), the Americans with Disabilities Act (ADA), and other USDOT orders. (For more information on these laws and orders, see Appendix E.) To comply with these regulations, the MPO systematically addresses the concerns of populations that these regulations protect—referred to here as transportation equity populations—throughout the planning process, including when selecting projects through the TIP process. Regular equity performance monitoring enables the MPO to better understand how transportation equity populations in the region may be affected by transportation investment decisions, so that it can decide whether and how to adjust its investment approach. More details about transportation equity monitoring for projects in the FFYs 2021−25 TIP are included in Chapter 6.
To build a comprehensive PBPP practice, the MPO can also choose to monitor or set targets for additional performance measures, which are not federally required, that apply to its goal areas. For example, while the federally required reliability measures discussed in Table 4-3 apply to the MPO’s Capacity Management and Mobility goal, the MPO may wish to examine measures that account for non-NHS roadways or other travel modes. Over the coming years, the MPO will examine whether and how to incorporate other performance measures and practices into its PBPP process.
States, MPOs, and public transportation providers integrate federally required performance measures—and other measures, as desired—into their respective PBPP processes, which involve three key phases focused on (1) planning, (2) investing, and (3) monitoring and evaluating.
In the planning phase, agencies set goals and objectives for the transportation system, identify performance measures, and set performance targets that will guide their decision-making. They identify and acquire data and conduct analyses necessary to support these processes. They also outline the frameworks they will use in key planning documents.
The Commonwealth of Massachusetts creates performance-based plans, such as the Strategic Highway Safety Plan (SHSP) for improving roadway safety and the Transportation Asset Management Plan (TAMP) for improving infrastructure condition, particularly for NHS roads and bridges. Similarly, regional transit authorities (RTAs)—including the Massachusetts Bay Transportation Authority (MBTA), MetroWest Regional Transit Authority (MWRTA), and Cape Ann Transportation Authority (CATA)—create Transit Asset Management (TAM) plans and Public Transportation Agency Safety Plans (PTASPs) that describe the data and processes these agencies will use to address transit state of good repair and safety needs. MassDOT is responsible for setting performance targets for the federally required roadway performance measures described in Table 4-3, while transit agencies must set targets for the measures described in Table 4-2.
Boston Region MPO’s activities in the planning phase include creating a goals-and-objectives framework in its LRTP and other performance-based plans—such as Congestion Mitigation and Air Quality Improvement (CMAQ) Program Performance Plans—as necessary. MPOs integrate elements of state and transit agency performance plans into MPO planning processes. MPOs also establish targets for federally required performance measures. To establish these targets, the Boston Region MPO may elect to support performance targets set by MassDOT or public transit providers (depending on the measure), or it may set separate targets for the MPO’s planning area. MassDOT and the transit agencies will update their performance targets based on defined cycles, which vary for each measure. More information about the update cycles for these measures is included in Section 4.3 of this chapter.
In the investing phase, agencies use the PBPP framework established in the planning phase to create strategies for investing transportation funding. When updating the LRTP, the MPO establishes investment programs and funding guidelines to help direct Regional Target funds to priority performance areas (see Chapter 2 for details). When updating the TIP, the MPO selects projects that it will fund through these programs. MPO members rely on several sets of information when making these decisions:
Meanwhile, MassDOT, the MBTA, CATA, and MWRTA follow their processes to select projects and programs for inclusion in the MassDOT Capital Investment Plan (CIP). The federally funded investments they include in the CIP are also documented in the MPO’s TIP and in the State Transportation Improvement Program (STIP).
Once the MPO board allocates its Regional Target dollars to specific investments and considers capital programs submitted by MassDOT, MBTA, and the region’s RTAs, it documents the full set of investments for the Boston region in the TIP. The TIP describes links between these short-term capital investment priorities and performance measures and targets, and discusses, to the extent practicable, how the MPO anticipates these investments will help the MPO achieve its targets. States must provide similar information in their STIPs.
After making plans and investments, agencies take stock of their progress by reviewing and reporting on their outputs and performance outcomes. Activities in the monitoring and evaluating phase include tracking trends, collecting data to understand the results of investment decisions, and comparing targets to actual performance. For example, the MPO can use information from the TIP about expected performance outcomes of its investments and information about past and current performance, which is collected for the LRTP, to determine if its investments are making progress towards its goals, objectives, and performance targets. The MPO may also conduct TIP Before-and-After studies to learn more about the actual outcomes of TIP projects. These evaluation methods allow the MPO to make necessary trade-offs or adjustments in the future.
MPOs report on information on measures, targets, and performance progress in their respective regions in their LRTPs. The Boston Region MPO also describes performance on transportation metrics through its Congestion Management Process (CMP) and tools such as the MPO’s Performance Dashboard. MassDOT reports performance targets and progress to the Federal Highway Administration (FHWA) through an online reporting tool, through the STIP and other required reports, and on the MassDOT Performance Management Tracker website. Public transit providers report their targets and performance progress information to the Federal Transit Administration (FTA), including through the National Transit Database.
To support the activities discussed above, federal transportation agencies require states, public transit operators, and MPOs to coordinate with one another and to share information and data to ensure consistency across processes. In Massachusetts, these coordination responsibilities are outlined in the 2019 Performance-Based Planning and Programming Agreement between MassDOT, Massachusetts MPOs, transportation planning organizations, the MBTA, and RTAs operating in Massachusetts.
Staff from Massachusetts MPOs, MassDOT staff, and other stakeholders coordinate on PBPP implementation through the Transportation Program Managers Group, including through its subcommittee on performance measures. For performance measures that states and MPOs track at the Boston Urbanized Area level, coordination responsibilities are documented in the 2018 Boston Urbanized Area Memorandum of Understanding.4-1
This section discusses investments in the federal fiscal years (FFYs) 2021−25 TIP and how they may relate to elements of the MPO’s PBPP framework, including the MPO’s goals and performance measures and targets. For each goal area, existing performance targets are identified and information on relevant trends, performance measures, TIP investments, and related planning activities are provided. These descriptions generally focus on investments of the MPO’s Regional Target funds, although they may also describe MassDOT or transit agency-funded investments, where applicable. Please note that information on the Transportation Equity goal area is included in Chapter 6 and a summary of the MPO investments is included in Chapter 3.
One of the MPO’s goals is that transportation by all modes will be safe. The MPO has committed to investing in projects and programs that aim to reduce the number and severity of crashes for all modes, and to reducing serious injuries and fatalities occurring on the transportation system. Similarly, the Massachusetts SHSP includes a long-term goal to move “towards zero deaths” by eliminating fatalities and serious injuries on the Commonwealth’s roadways.4-2 In future years, the MPO will work more closely with the MBTA, CATA, and MWRTA to make safety-oriented investments and implement related initiatives as identified in their PTASPs.
The Commonwealth of Massachusetts and the Boston Region MPO track traffic incidents, fatalities, and injuries involving motor vehicles using information from the Massachusetts Crash Data System and the National Highway Traffic Safety Administration’s (NHTSA’s) Fatality Analysis and Reporting System (FARS). These data inform the targets MassDOT and the MPO must set each calendar year (CY) for five federally required roadway safety performance measures, which are also listed in Table 4-3:
These measures pertain to fatalities and serious injuries from traffic incidents and apply to all public roads. Values for these measures are expressed as five-year rolling annual averages. States and MPOs update targets for these measures annually. When establishing targets for these measures, all of the MPOs in Massachusetts can elect to support statewide targets set by MassDOT for the Commonwealth or set separate targets for the MPO region. MassDOT set its current set of roadway safety performance targets to reflect a 2016–20 rolling annual average, as required by FHWA. When setting these targets, the following was considered:
Figures 4-1 to 4-5 show statewide level trends for each performance measure along with the Commonwealth’s prior year (CY 2018, CY 2019) and current (CY 2020) performance targets. In January 2020, the Boston Region MPO elected to support the Commonwealth’s CY 2020 roadway safety performance targets. For context, the figures also show Boston region-specific values for each measure, including projected values for future years.
Figure 4-1 shows historic and projected values for the number of fatalities resulting from motor vehicle crashes, while Figure 4-2 shows the fatality rate per 100 million VMT. Though there was an anomalous increase in fatalities in CY 2016, overall, actual fatalities and fatality rates have declined slightly for Massachusetts and for the Boston region specifically, based on recent five-year rolling annual averages. Meanwhile, VMT has been gradually increasing for both the Boston region and Massachusetts as a whole, which also supports historic and projected decreases in the fatality rate.
Figure 4-1
Fatalities from Motor Vehicle Crashes
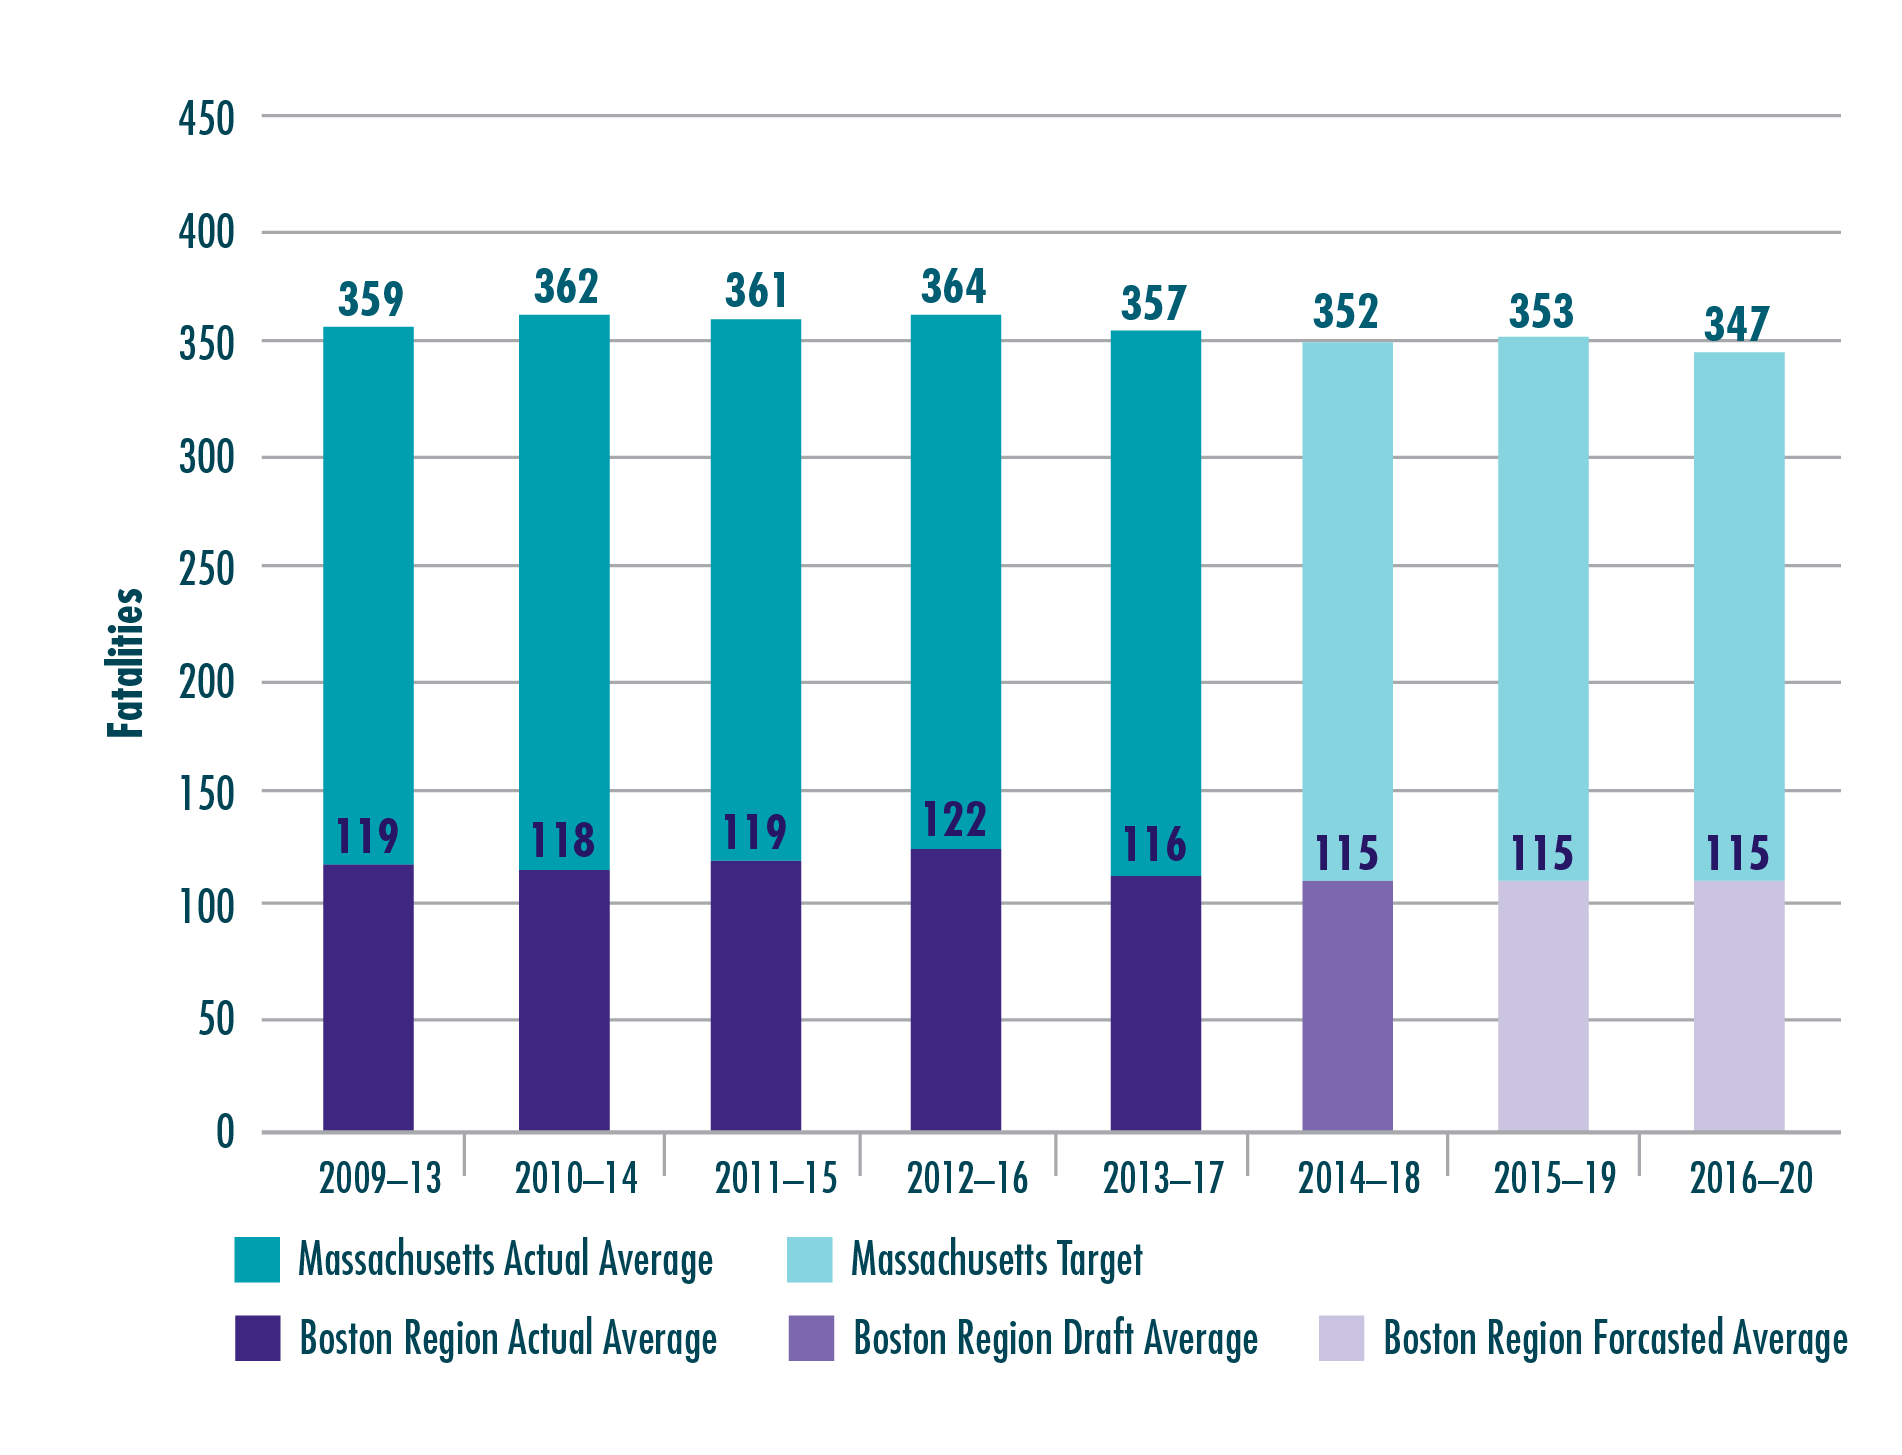
Notes: Values reflect five-year rolling annual averages and have been rounded to the nearest integer. MPO staff developed projections for the Boston region using a linear trend line based on actual fatality values for CYs 2009 through 2017 and a draft estimate of 98 fatalities for CY 2018. The draft 2014–18 and the forecasted 2015–19 and 2016–20 average numbers of fatalities in the Boston region are smaller than the historic averages shown in the chart; however, some of these differences do not appear at the integer level.
Sources: National Highway Traffic Safety Administration Fatality Analysis and Reporting System, Massachusetts Department of Transportation, Boston Region MPO staff.
Figure 4-2
Fatality Rate per 100 Million Vehicle-Miles Traveled
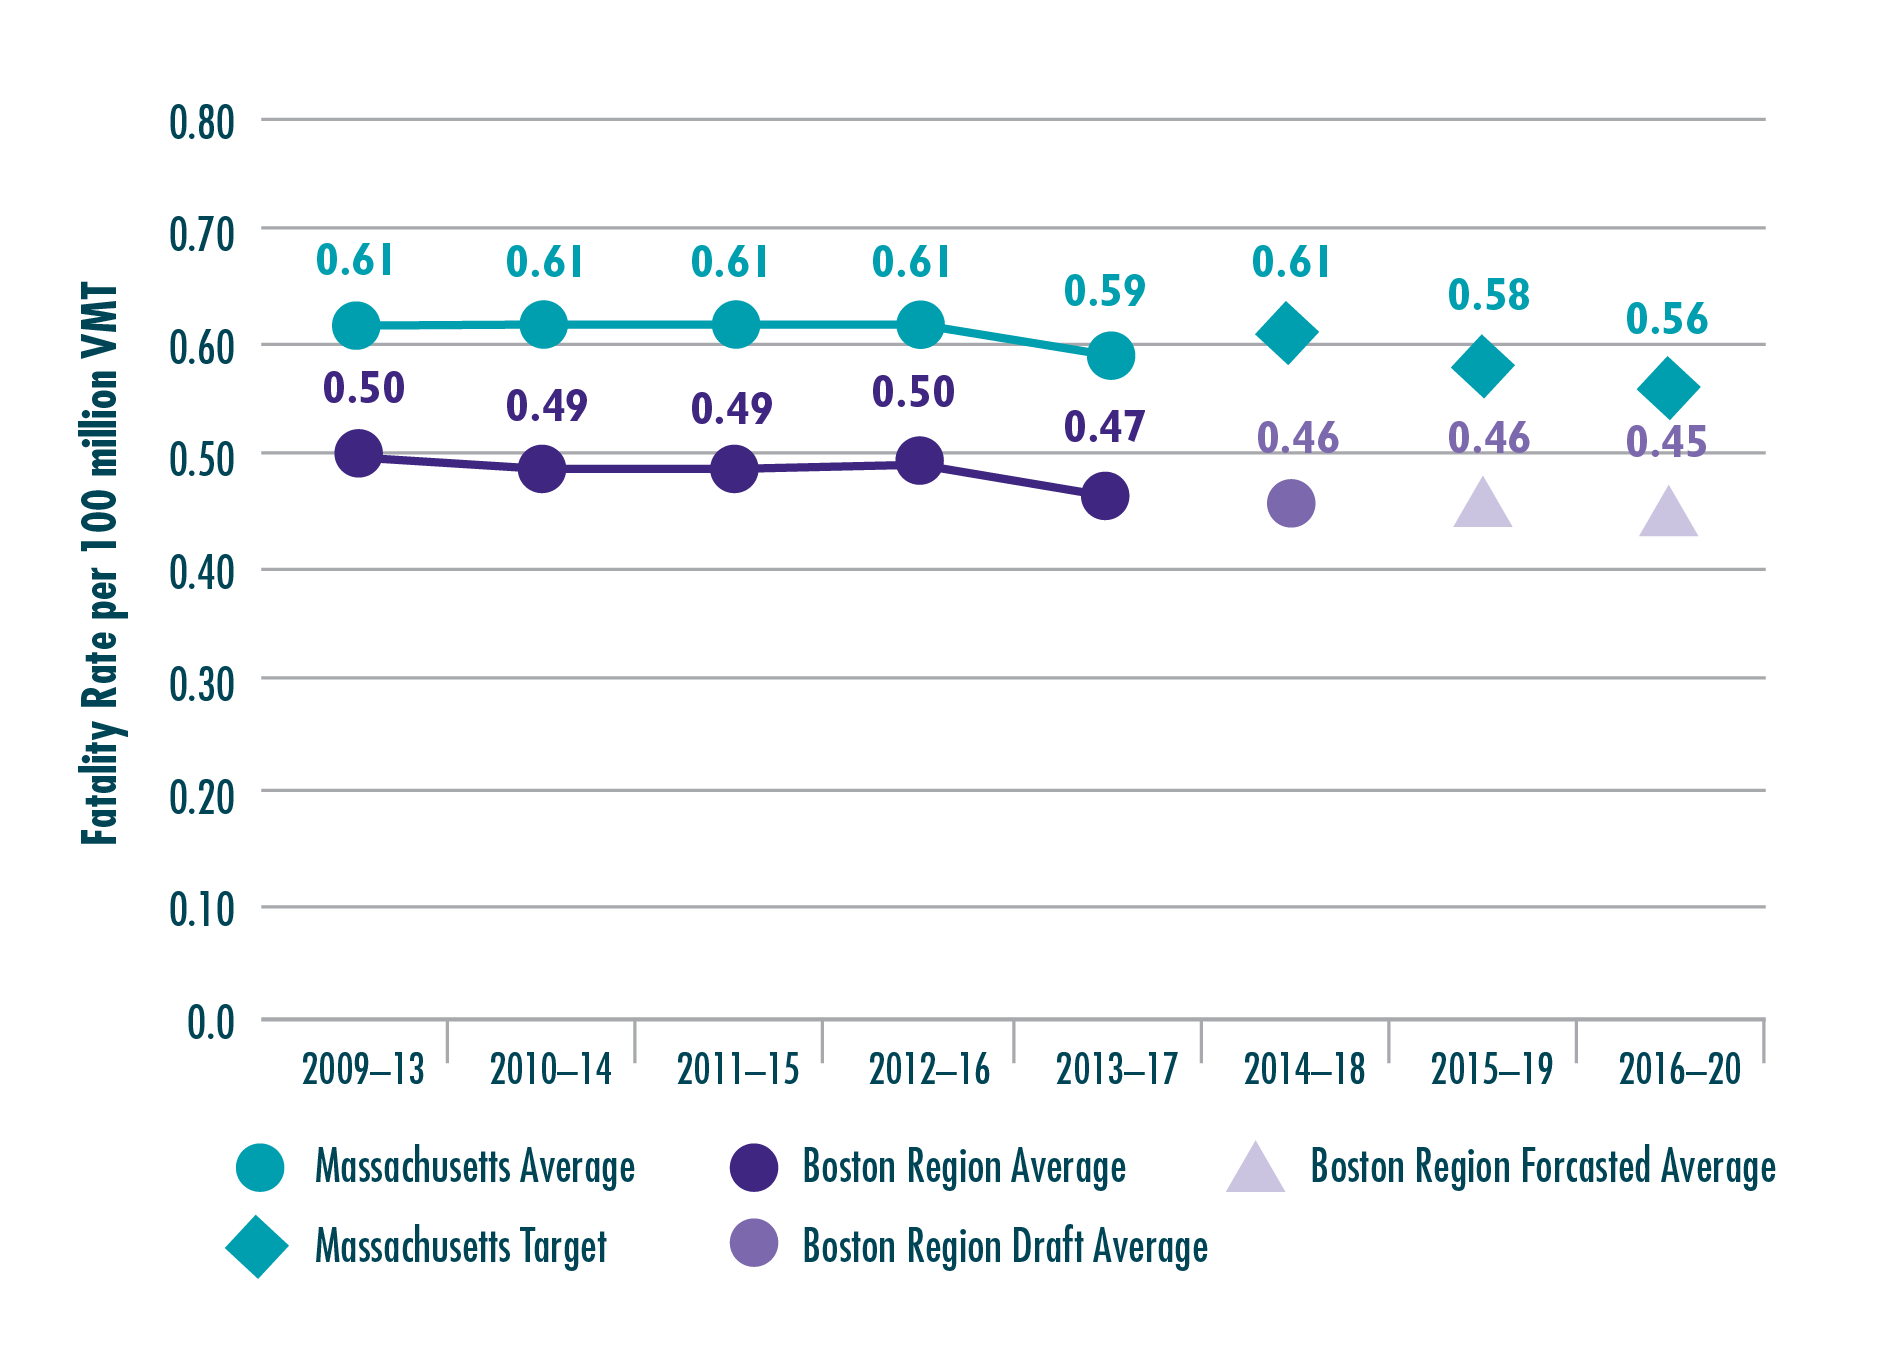
Notes: Values reflect five-year rolling annual averages and have been rounded to the hundredths decimal place. MPO staff developed projections for the Boston region using a linear trend line based on actual fatality values and VMT values for CYs 2009 through 2017, a draft estimate of 98 fatalities for CY 2018, and an estimate of CY 2018 VMT from MassDOT (approximately 24.9 billion VMT).
Sources: National Highway Traffic Safety Administration Fatality Analysis and Reporting System, Massachusetts Department of Transportation, Boston Region MPO staff.
Figure 4-3 shows historic and projected values for the number of serious injuries resulting from motor vehicle crashes, and Figure 4-4 shows the serious injury rate per 100 million VMT. For both the Boston region and Massachusetts as a whole, serious injuries and serious injury rates have been decreasing over time and are projected to continue to decrease.
Figure 4-3
Serious Injuries from Motor Vehicle Crashes
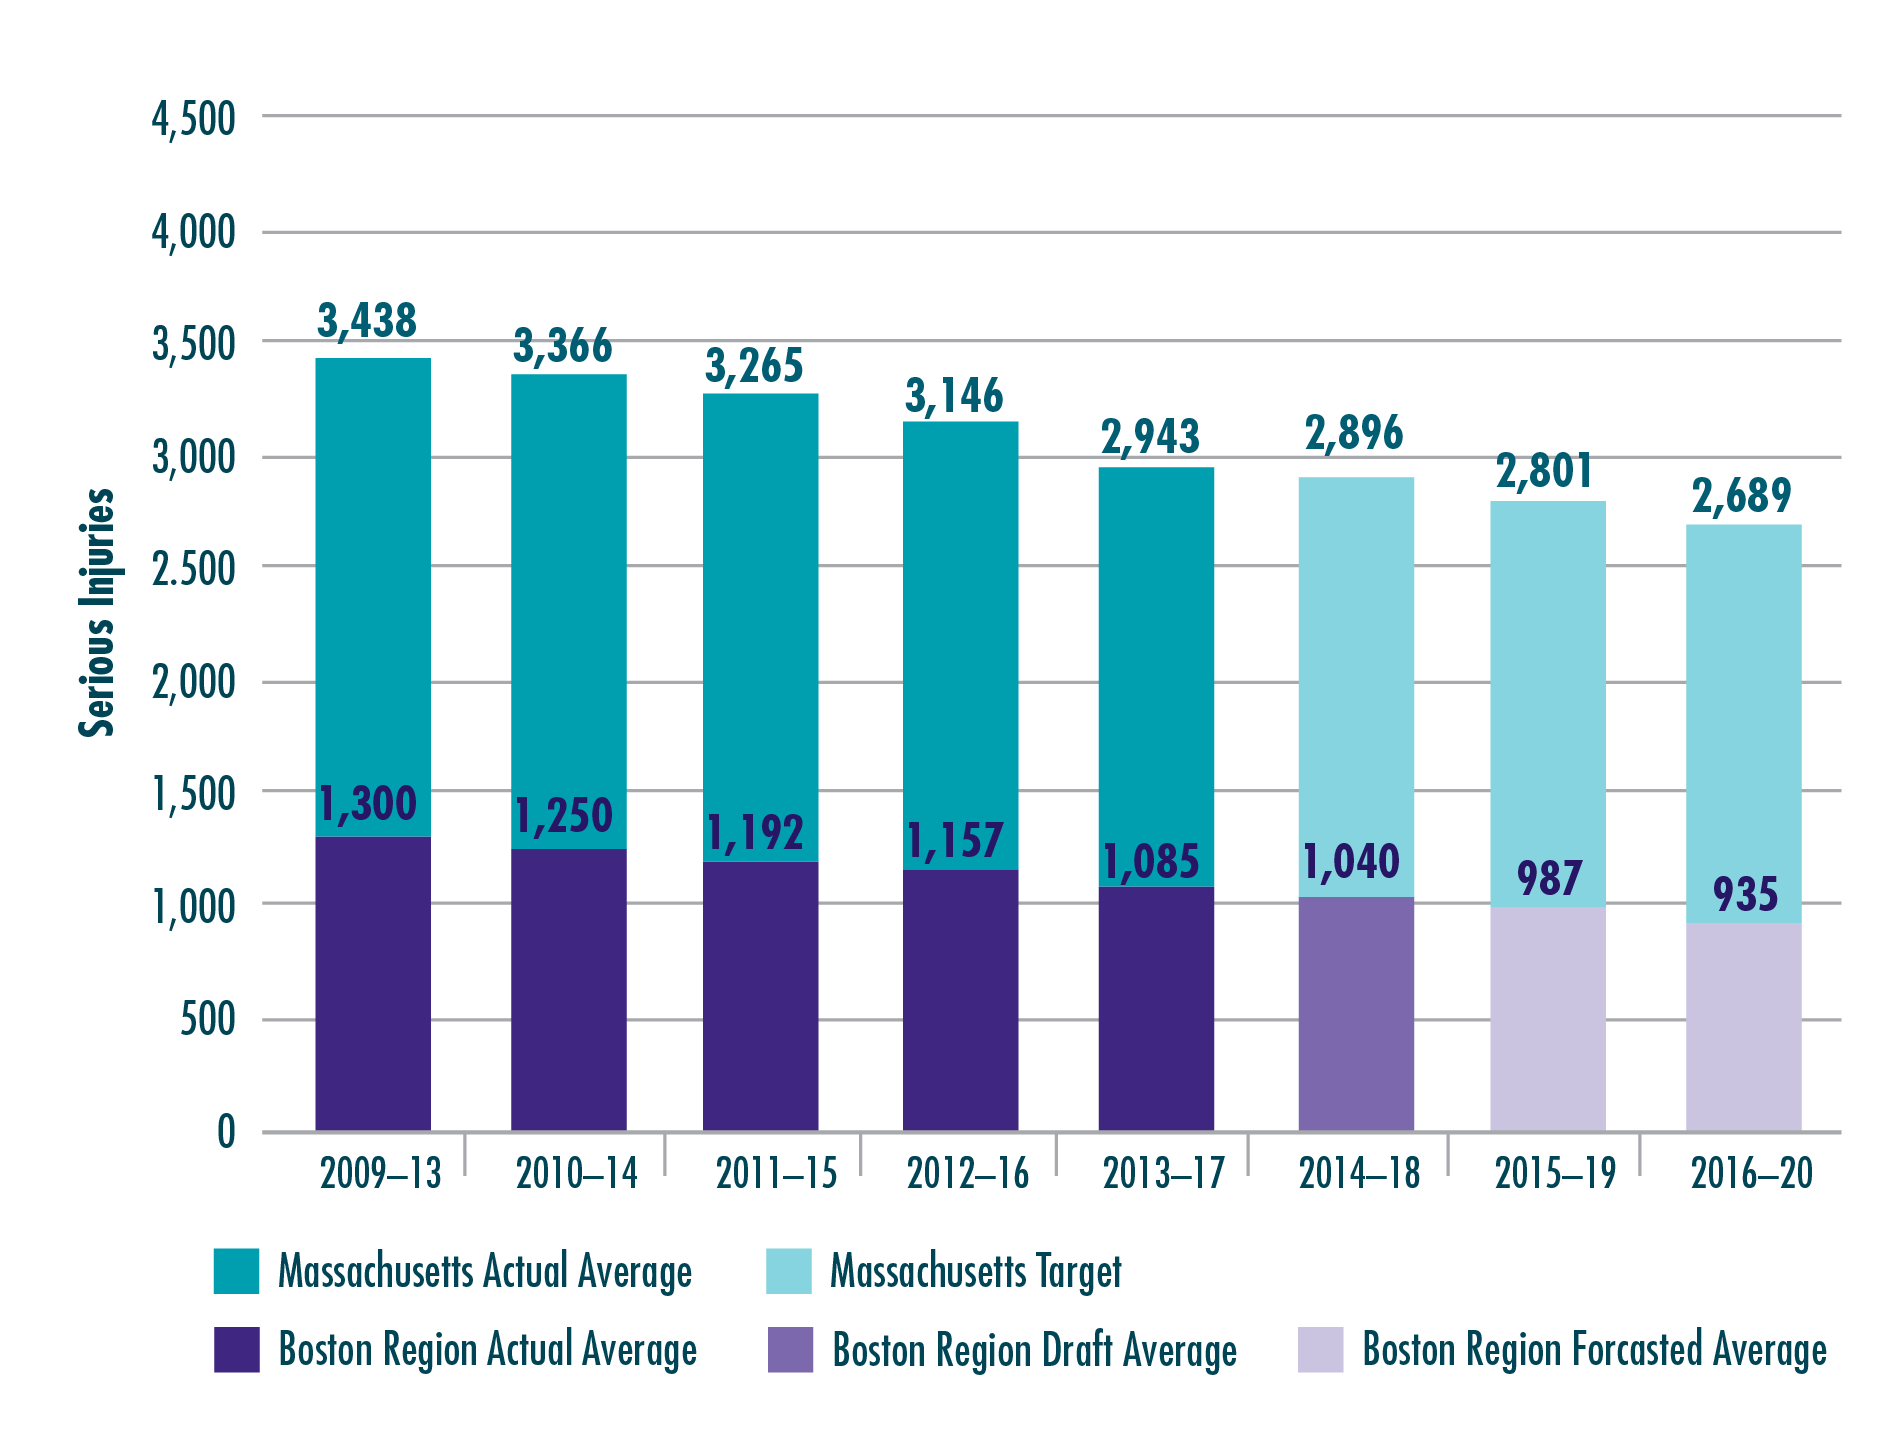
Notes: Values reflect five-year rolling annual averages and have been rounded to the nearest integer. MPO staff developed projections for the Boston region using a linear trend line based on actual serious injury values for CYs 2009 through 2017 and a draft estimate of 938 serious injuries for CY 2018.
Sources: Massachusetts Crash Data System, Massachusetts Department of Transportation, Boston Region MPO staff.
Figure 4-4
Serious Injury Rate per 100 Million Vehicle-Miles Traveled
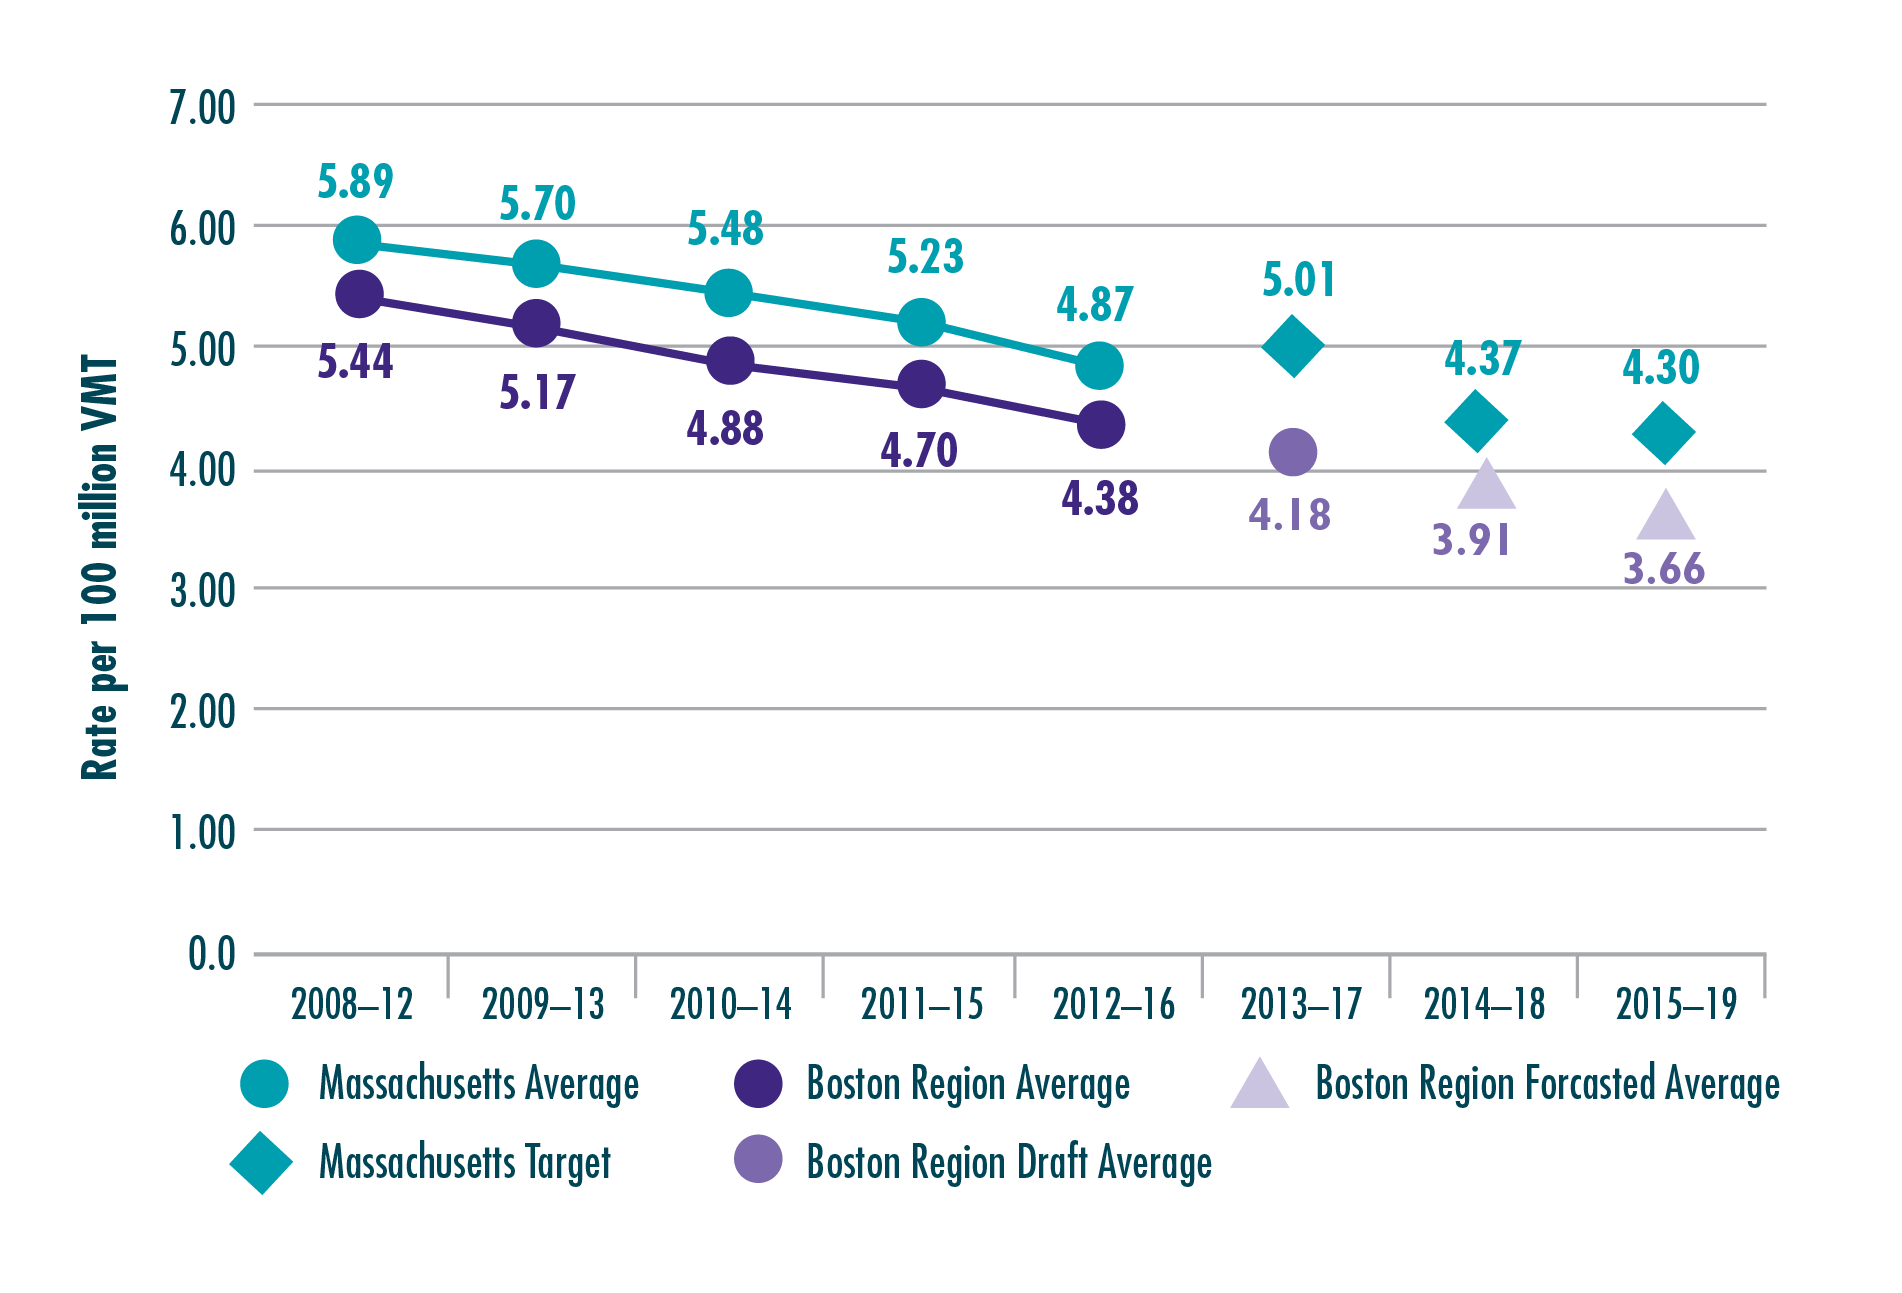
Notes: Values reflect five-year rolling annual averages and have been rounded to the hundredths decimal place. MPO staff developed projections for the Boston region using a linear trend line based on actual serious injury values and VMT values for CYs 2009 through 2017, a draft estimate of 938 serious injuries for CY 2018, and an estimate of CY 2018 VMT from MassDOT (approximately 24.9 billion VMT).
Sources: Massachusetts Crash Data System, Massachusetts Department of Transportation, Boston Region MPO staff.
Figure 4-5 shows historic and projected values for the number of fatalities and serious injuries experienced by people traveling by nonmotorized means for the Boston region and Massachusetts as a whole. This category reflects bicyclist and pedestrian fatalities and serious injuries, as well as those experienced by others traveling by nonmotorized modes (such as skateboarders). Massachusetts has recently experienced a drop in nonmotorized fatalities and serious injuries, which MassDOT accounted for when developing a CY 2020 target for this measure. However, historic trends suggest that nonmotorized fatalities and serious injuries may increase somewhat in the Boston region in future years; this possibility will need to be addressed through coordinated planning, investment, and strategy implementation between the Massachusetts Department of Transportation (MassDOT), the Boston Region MPO, the region’s municipalities, and other stakeholders.
Figure 4-5
Nonmotorized Fatalities and Serious Injuries
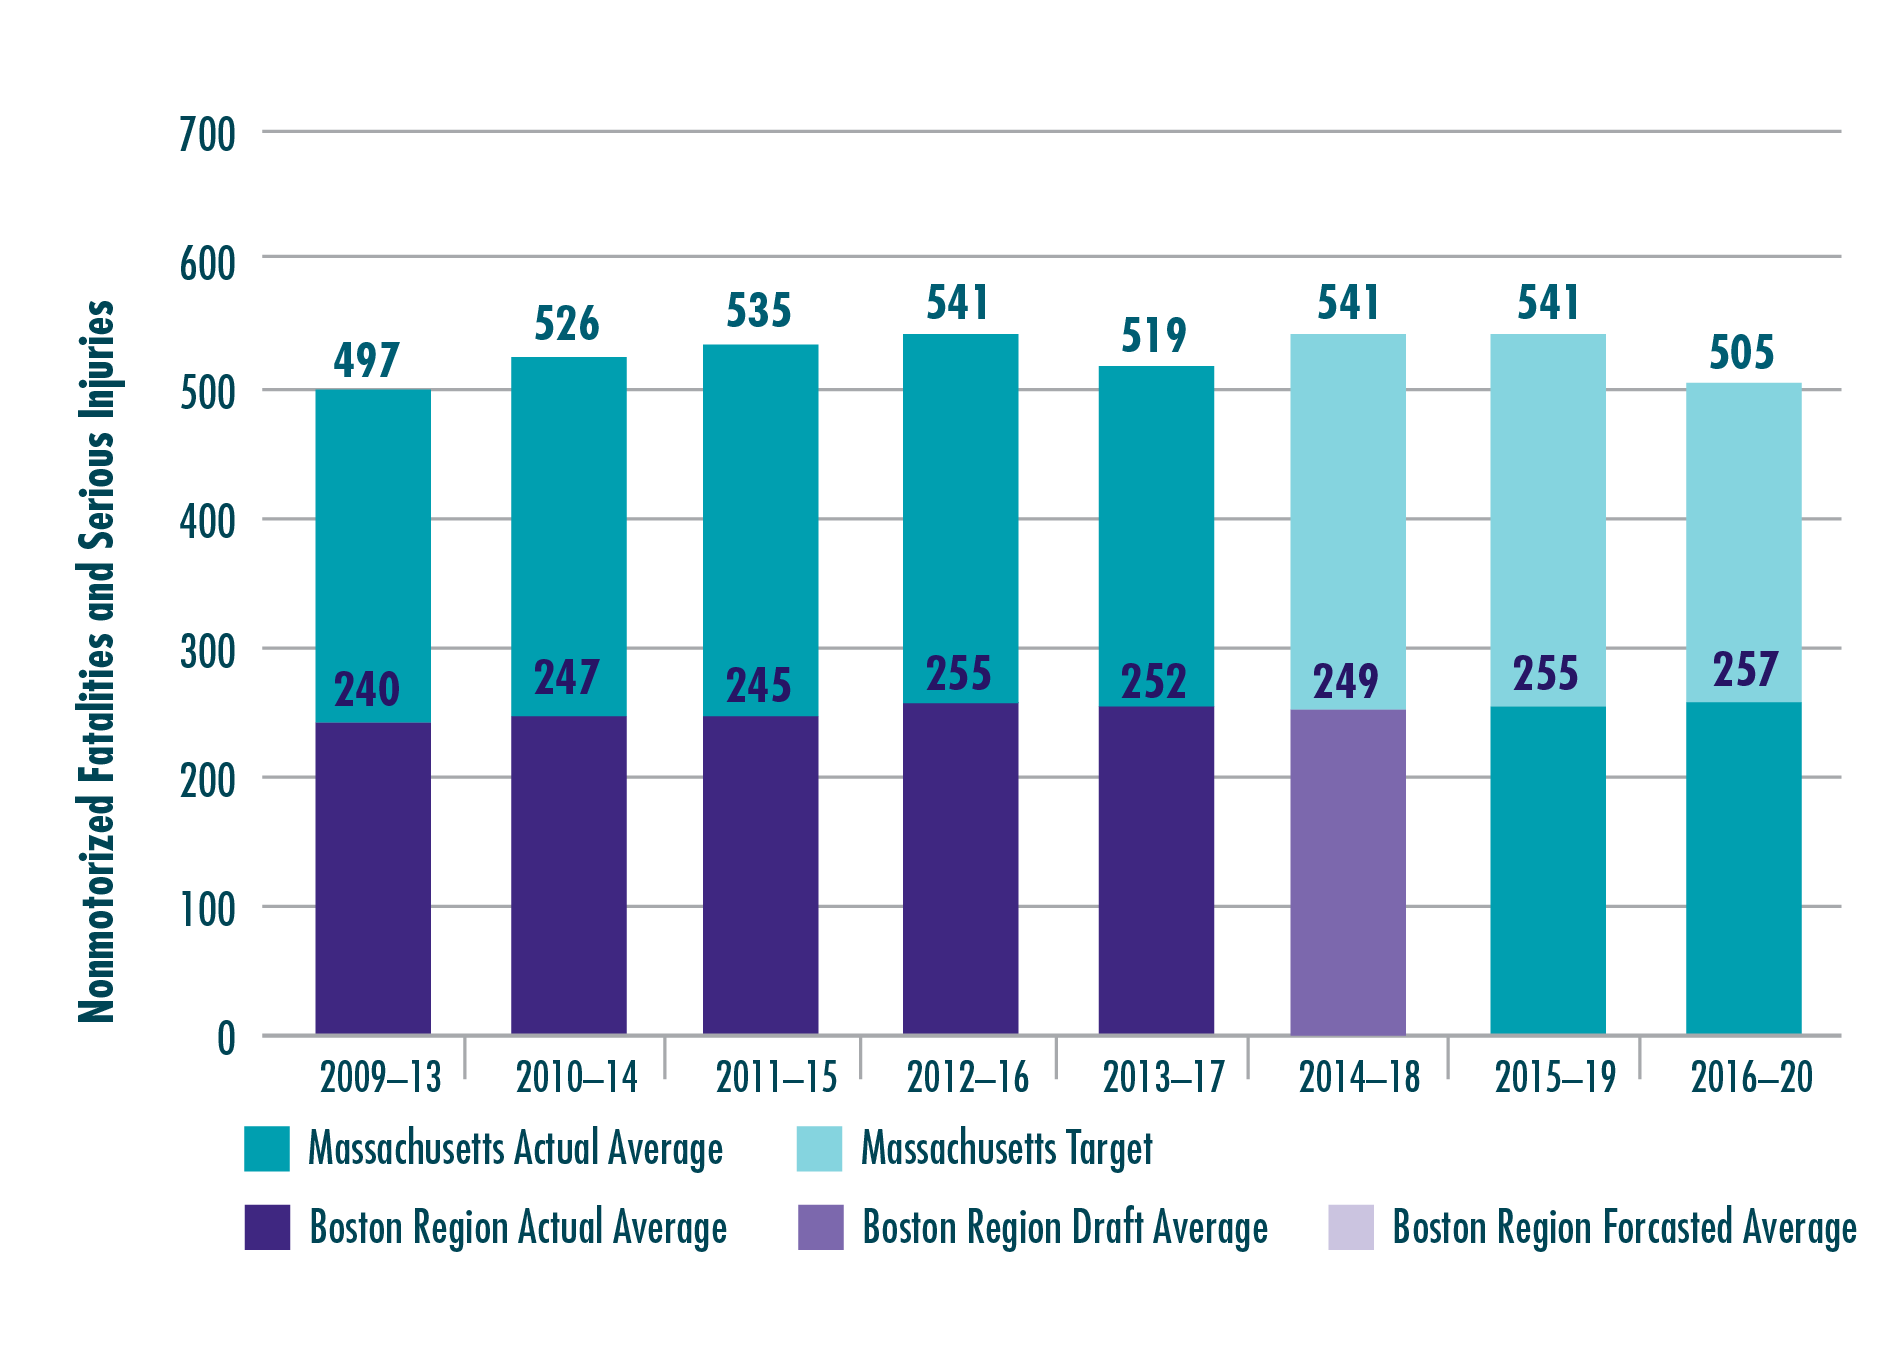
Notes: Values reflect five-year rolling annual averages and have been rounded to the nearest integer. MPO staff developed projections for the Boston region using a linear trend line based on actual nonmotorized fatality and serious injury values for CYs 2009 through 2017, and draft estimates of 38 nonmotorized fatalities and 191 nonmotorized serious injuries for CY 2018.
Sources: National Highway Traffic Safety Administration Fatality Analysis and Reporting System, Massachusetts Crash Data System, Massachusetts Department of Transportation, Boston Region MPO staff.
Table 4-4 lists the Commonwealth’s 2013–17 rolling average values for the fatality and serious injury performance measures and summarizes CY 2018, CY 2019, and CY 2020 targets for the federally required roadway safety performance measures. As previously mentioned, the Boston Region MPO elected to support the Commonwealth’s CY 2020 roadway safety performance targets in January 2020.
Table 4-4
Massachusetts Roadway Safety Performance Trends and Targets
Highway Safety Performance |
2017 Safety |
2018 Safety Target (Expected |
2019 Safety Target (Expected |
2020 Safety Target (Expected |
Number of fatalities |
357 |
352 |
353 |
347 |
Rate of fatalities per 100 million vehicle-miles traveled |
0.59 |
0.61 |
0.58 |
0.56 |
Number of serious injuries |
2,943 |
2,896 |
2801 |
2,689 |
Rate of serious injuries per 100 million vehicle-miles traveled |
4.87 |
5.01 |
4.37 |
4.30 |
Number of nonmotorized fatalities and nonmotorized serious injuries |
518 |
541 |
541 |
505 |
Note: MassDOT defines serious injuries as suspected serious injuries, which are defined in the Model Minimum Uniform Crash Criteria 4th Edition and identified through incident reporting by police and vehicle operators using the Commonwealth of Massachusetts Motor Vehicle Crash Operator Report. The Commonwealth set its 2018 targets in 2017, its 2019 targets in 2018, and its 2020 targets in 2019. All values have been rounded to the hundredths place.
Sources: National Highway Traffic Safety Administration Fatality Analysis Reporting System, Massachusetts Crash Data System, and MassDOT.
By electing to support the Commonwealth’s roadway safety targets, the MPO agreed to plan and program projects so that they contribute to achieving those targets. Anticipating the ability of transportation projects to reduce fatalities and serious injuries from motor vehicle crashes is a challenge, as crashes may be a consequence of many factors other than infrastructure condition, such as driver behavior—including seatbelt use and driver distraction or intoxication—and weather conditions. When investing its Regional Target funds, the MPO aims to identify projects likely to have maximum safety benefits by using its TIP project selection criteria, which account for crash activity within the project area and the types of safety countermeasures included in the proposed project. (For more detail on these criteria, see Appendix A). When conducting project evaluations, the MPO considers crash rates within the vicinity of projects and the Equivalent
Property Damage Only (EPDO) value associated with those crashes. The EPDO index assesses the severity of crashes by assigning weighted values to crashes involving fatalities, injuries, and property damage.
All the roadway projects included in the MPO’s Intersection Improvement, Complete Streets, Major Infrastructure, and Bicycle Network and Pedestrian Connections programs include safety countermeasures or features that the MPO expects will improve safety for motorists, bicyclists, and pedestrians. The MPO’s roadway investments in its Intersection Improvement, Complete Streets, and Major Infrastructure programs are expected to support safety improvements on roadways supporting multiple travel modes, while its Bicycle Network and Pedestrian Connections projects will support safety for those traveling by nonmotorized means by providing pedestrian signals and separated facilities for bicyclists and pedestrians.
The MPO also examines whether projects would improve safety at MassDOT-identified Highway Safety Improvement Program (HSIP) crash cluster locations. MassDOT identified crash clusters using a procedure for processing, standardizing, matching, and aggregating crash locations and data.4-4 MassDOT’s HSIP clusters are those that ranked in the top five percent of crash clusters within each regional planning agency area based on EPDO values. MassDOT created a set of HSIP clusters that include all crashes involving motor vehicles, as well as sets of clusters that reflect motor vehicle crashes that involved bicyclists or pedestrians. Projects in locations with HSIP clusters are eligible for funding through MassDOT’s HSIP program.
Table 4-5 shows values for MPO staff-identified metrics that relate to how FFYs 2021 Regional Target-funded roadway projects may address safety performance; similar tables for other MPO goal areas appear throughout this chapter.
Table 4-5 shows that many of these roadway projects are located in areas that overlap with HSIP clusters and several are located in places that overlap HSIP bicycle or pedestrian clusters or where fatal or serious injury crashes have occurred between CY 2014 and 2016. The MPO expects that this combination of safety countermeasures and improvements focused in priority locations will help the MPO and the Commonwealth progress towards reducing fatalities and serious injuries on the roadway network.
Table 4-5
Regional Target Projects: Roadway Safety Performance Metrics
Metric |
Value |
Regional Target projects that address all-mode HSIP clusters* |
13 projects |
All-mode HSIP cluster locations addressed by Regional Target projects* |
20 locations |
Regional Target projects that address HSIP Pedestrian clusters† |
5 projects |
HSIP pedestrian cluster locations addressed by Regional Target projects† |
10 locations |
Regional Target projects that address HSIP bicycle clusters† |
2 projects |
HSIP bicycle cluster locations addressed by Regional Target projects† |
2 locations |
Project areas where fatal crashes have occurred‡ |
3 areas |
Project areas where crashes involving injuries have occurred‡ |
39 areas |
Project areas where crashes involving pedestrians have occurred‡ |
23 areas |
Project areas where crashes involving bicyclists have occurred‡ |
15 areas |
Note: The group of projects reflected in this table does not include the Green Line Extension, Community Connections investments, or Transit Modernization investments.
* All-mode HSIP clusters are based on crash data from 2014 to 2016.
† HSIP bicycle clusters and HSIP pedestrian clusters are based on data from 2007 to 2016.
‡ Analyses of crashes in locations with projects funded by Regional Targets are based on crash data from 2014 to 2016.
Sources: Massachusetts Crash Data System, MassDOT, and the Boston Region MPO.
Projects selected under the Community Connections Program did not address safety issues. Projects in the MPO’s Transit Modernization Program have not been selected. Funding for this program will be available in FFY 2025.
The projects in the FFYs 2021–25 TIP programmed by MassDOT, summarized in Chapter 3, will also support safety and are expected to reduce fatalities and serious injuries on the region’s roadways. The Reliability and Modernization programs included in MassDOT’s CIP are geared toward maintaining and upgrading infrastructure, which will help make travel safer on the region’s roadways. MassDOT’s Intersection Improvements, Roadway Improvements, Roadway Reconstruction, and Safety Improvements programs most directly address safety considerations, although its Bridge and Pavement Improvement programs may also support safety by supporting asset maintenance and state of good repair. Moreover, MassDOT’s Bicycle and Pedestrian projects may reduce nonmotorized fatalities and injuries by improving separated facilities for bicyclists and pedestrians.
Under FTA’s Public Transportation Agency Safety Plan Rule, transit agencies are responsible for developing PTASPs, after which they must review and update the plans annually. These plans will include targets for transit safety performance measures that are defined in the National Public Transportation Safety Plan. These measures, also listed in Table 4-2, include the following:
Once transit agencies develop their safety plans and performance targets, they must share them with state departments of transportation (DOTs) and MPOs, which will set targets for their states and MPO regions, respectively. Future TIPs prepared by the Boston Region MPO will include information on transit safety performance targets and their relationship to TIP investments. In the near-term future, the MBTA, CATA, and MWRTA’s FFYs 2021–25 reliability and modernization investments are likely to help improve safety by bringing vehicles, facilities, and track systems into a state of good repair, which in turn will enhance safety for transit customers and employees and members of the public. The System Preservation and Modernization Performance section discusses these transit state-of-good-repair investments in more detail.
Going forward, the MPO will work with its planning partners and other stakeholders to better understand and measure safety performance and to invest in projects that will reduce roadway fatalities and serious injuries as much as possible. Future activities include the following:
One of the MPO’s goals is to maintain and modernize the transportation system and plan for its resiliency. System preservation and modernization policies for the Boston region apply to bridges, pavement, sidewalks, and transit system assets. They address existing maintenance and state-of-good-repair needs, necessary updates to infrastructure to meet customer needs, and preparations for existing or future extreme conditions such as sea level rise and flooding.
The MPO’s Regional Target projects support asset condition improvements, which complement MassDOT’s and transit agencies’ more extensive state-of-good-repair and modernization projects. MassDOT uses information from its internal asset management systems to guide decisions about asset maintenance and modernization and considers investment priorities from its TAMP.4-5 The TAMP is a federally required risk-based asset management plan that includes asset inventories, condition assessments, and investment strategies to improve the condition and performance of the NHS, particularly its bridges and pavements. Similarly, transit agencies that receive FTA funding must produce Transit Asset Management (TAM) plans that describe transit system assets and condition and the tools and investment strategies these agencies will use to improve them.4-6
To meet federal performance monitoring requirements, states and MPOs must track and set performance targets for the condition of bridges on the National Highway System (NHS), a network that includes the Interstate Highway System and other roadways of importance to the nation’s economy, defense, and mobility. As noted in Table 4-3, FHWA bridge condition performance measures include:
These performance measures classify NHS bridge condition as good or poor based on the condition ratings of three bridge components: the deck, the superstructure, and the substructure.4-7 The lowest rating of the three components determines the overall bridge condition.4-8 The measures express the share of NHS bridges in a certain condition by deck area, divided by the total deck area of NHS bridges in the applicable geographic area (calculated for state or MPO region).
Table 4-6 shows performance baselines for NHS bridge condition in Massachusetts and the Boston region. As of 2017, Massachusetts had 2,246 NHS bridges, which MassDOT analyzed to understand their current condition with respect to the federal bridge condition performance measures. In 2018, the Boston Region MPO performed a similar analysis on the 859 NHS bridges in the region. According to these baseline values, the Boston region has a larger share of NHS bridge deck area considered to be in good condition and a slightly smaller share of NHS bridge deck area considered to be in poor condition, compared to Massachusetts overall.
Table 4-6
National Highway System Bridge Condition Baselines
Geographic Area |
Total NHS Bridges |
Total NHS Bridge Deck Area (square feet) |
Percent of NHS Bridges in Good Condition |
Percent of NHS Bridges in PoorCondition |
Massachusetts* |
2,246 |
29,457,351 |
15.2% |
12.4% |
Boston Region† |
859 |
14,131,094 |
19.2% |
11.8% |
* Massachusetts baseline data is based on a MassDOT analysis conducted in 2018.
† Boston region comparison data is based on a Boston Region MPO analysis conducted in 2018.
Sources: MassDOT and Boston Region MPO.
USDOT has established 10 percent as a threshold for NHS bridge deck area that is in poor condition, and DOTs for states that exceed that threshold must direct a defined minimum amount of National Highway Performance Program (NHPP) funding toward improving NHS bridges. Because more than 10 percent of Massachusetts NHS bridge deck area is in poor condition, MassDOT programs at least this minimum amount.
States must set performance targets for these NHS bridge and pavement condition measures at two-year and four-year intervals. Table 4-7 shows MassDOT’s current NHS bridge performance targets, which it established in 2018. The two-year target reflects conditions as of the end of CY 2019, and the four-year target reflects conditions as of the end of CY 2021. These targets reflect MassDOT’s anticipated NHS bridge condition based on historic trends, as well as planned bridge investments. As shown in the table, MassDOT expects there will be a small increase in the share of NHS bridge deck area in good condition by the end of CY 2021, while it expects that the share of NHS bridge deck area in poor condition in CY 2021 will be slightly lower than the baseline.
Table 4-7
National Highway System Bridge Condition Targets for Massachusetts
Federally Required Bridge Condition Performance Measure |
2018 Measure Value (Baseline) |
Two-Year Target |
Four-Year Target |
Percent of NHS Bridges [by deck area] that are in good condition |
15.2% |
15.0% |
16.0% |
Percent of NHS Bridges [by deck area] that are in poor condition |
12.4% |
13.0% |
12.0% |
Note: Projects have not yet been selected for the MPO's Transit Modernization Program." (remove the "Community Transportation/Parking/Clean Air
Source: MassDOT.
MPOs are required to set four-year bridge performance targets by either electing to support state targets or setting separate quantitative targets for the region. The Boston Region MPO elected to support MassDOT’s four-year targets for these measures in November 2018.
As with NHS bridges, USDOT’s performance management framework requires states and MPOs to monitor and set targets for the condition of pavement on NHS roadways. Applicable federal performance measures, which are also listed in Table 4-3, include the following:
The Interstate performance measures classify Interstate pavements as in good or poor condition based on the pavements’ International Roughness Index (IRI) value and one or more pavement distress metrics (cracking and/or rutting and faulting) depending on the pavement type (asphalt, jointed concrete, or continuous concrete). FHWA sets thresholds for each metric that determine whether the metric value is good, fair, or poor, along with thresholds that determine whether the pavement segment as a whole is considered to be in good or poor condition. Non-Interstate NHS pavements are subject to the same thresholds for IRI values. As of 2020, states are required to collect both IRI data and values for complementary distress metrics for non-Interstate NHS pavements, which will be incorporated into future performance monitoring.
MassDOT tracks the condition of roadways in Massachusetts, including NHS network, through its Pavement Management Program. In 2018, MassDOT established performance targets for these NHS pavement condition performance measures, which are shown along with baseline data in Table 4-8. As with the NHS bridge condition performance targets, the two-year target reflects conditions as of the end of CY 2019, and the four-year target reflects conditions as of the end of CY 2021. While MassDOT has collected IRI data in past years, these federally required performance measures also require other types of distress data that have not previously been required as part of pavement monitoring programs.4-9 MassDOT notes that setting targets for these pavement condition measures is challenging given the lack of complete historic data. MassDOT’s approach when setting targets was to use past pavement indicators to identify trends and to set conservative targets.
Table 4-8
National Highway System Pavement Condition Targets for Massachusetts
Federally Required Pavement Condition Performance Measure |
2017 Measure Value (Baseline) |
Two-Year Target |
Four-Year Target |
Percent of Interstate Highway System pavements that are in good condition* |
74.2% |
70.0% |
70.0% |
Percent of Interstate Highway System pavements that are in poor condition* |
0.1% |
4.0% |
4.0% |
Percent of non-Interstate NHS pavements that are in good condition |
32.9% |
30.0% |
30.0% |
Percent of non-Interstate NHS pavements that are in poor condition |
31.4% |
30.0% |
30.0% |
* For the first federal performance monitoring period (CY 2018–21), the Federal Highway Administration has only required states to report four-year targets for pavement condition on the Interstate Highway System. MassDOT has developed both two-year and four-year targets for internal consistency.
Source: MassDOT.
As with NHS bridge condition performance measures, MPOs are required to set four-year Interstate pavement condition and non-Interstate NHS pavement condition performance targets by either supporting state targets or setting separate quantitative targets for the region. The Boston Region MPO elected to support MassDOT’s four-year targets for these NHS pavement condition measures in November 2018.
When prioritizing capital investments for the TIP, the MPO uses its project evaluation criteria to assess how well each project funded with Regional Target dollars may help maintain or modernize the MPO’s roadway infrastructure. The MPO’s policy has been to not use Regional Target funds for projects that only resurface pavement. However, the MPO does fund roadway reconstruction projects that include pavement improvements in addition to other design elements. The MPO uses IRI information and data provided by project proponents to identify substandard pavement and awards points to projects that will improve these pavements.4-10
Similarly, the MassDOT Bridge Program remains the region’s primary funding source for replacement or rehabilitation of substandard bridges, but the MPO’s Regional Target investments also contribute modestly to bridge improvements. The MPO awards points to candidate TIP projects that include improvements for substandard bridges. Projects funded with Regional Target dollars also improve traffic signal equipment or sidewalk infrastructure; enable improved emergency response; or improve the resiliency of the transportation system to extreme weather conditions. Projects that improve emergency response are identified using the MPO’s TIP project selection criteria; MPO staff awards points to projects that improve evacuation or diversion routes or that improve access routes to or near emergency support locations. Similarly, MPO staff uses TIP project selection criteria to identify projects that improve the ability to respond to extreme conditions. Staff awards points in this category to projects that improve a facility’s ability to function in instances of flooding; protect a facility from sea level rise; strengthen infrastructure against seismic activity; address critical transportation infrastructure; protect freight network elements; or implement hazard mitigation or climate adaptation plans.
Table 4-9 displays metrics that describe how the MPO’s FFYs 2021–25 Regional Target projects are expected to improve infrastructure on the region’s roadways. MPO staff developed estimated values for these metrics using available data from MassDOT’s Bridge Inventory and Road Inventory files; project proponent information such as functional design reports; the MPO’s All-Hazards Planning Application; results from TIP project evaluations; and other sources. The MPO expects that these FFYs 2021–25 investments will help make progress towards statewide NHS bridge and pavement condition targets and will also help improve the overall condition of the region’s roadways and bridges and address resiliency needs.
Table 4-9
Regional Target Projects: Roadway System Preservation and Modernization Performance Metrics
Metric |
Value |
Bridge structures improved |
7 structures |
NHS bridge structures improved |
4 structures |
New bridge structures to be constructed |
4 structures |
Lane miles of substandard pavement improved* |
70 lane miles |
Lane miles of substandard NHS pavement improved* |
43 lane miles |
Miles of substandard sidewalk improved |
39 miles |
Projects that improve emergency response |
25 projects |
Projects that improve the ability to respond to extreme conditions |
10 projects |
Note: The group of projects reflected in this table does not include the Green Line Extension or Transit Modernization investments. No Community Connections projects include system preservation elements.
* Substandard pavement designations are based on data provided by MassDOT and project proponents and on MPO assessments conducted for TIP evaluations. The estimated lane miles of substandard NHS pavement improved is based on the pavement condition assessment for the project and the MPO’s assessment of the portion of the project on the NHS.
Source: MassDOT and Boston Region MPO.
Many of MassDOT’s FFYs 2021–25 TIP investments address bridge and pavement condition. MassDOT’s Bridge programs include 18 projects that will improve or replace bridge structures, nine of which are NHS bridge structures. MassDOT’s Interstate Pavement program will improve pavement on Interstate 93 in Boston, Milton, Quincy, Medford, Winchester, and Stoneham while its non-Interstate pavement program includes 13 projects that will improve pavements on MassDOT-owned NHS roadways in 27 Boston region municipalities. These projects are expected to help MassDOT make progress toward its NHS bridge and pavement performance targets. Projects in MassDOT’s other Reliability and Modernization programs—including its Intersection Improvements, Roadway Improvements, Roadway Reconstruction, and Safety Improvements programs—include elements that will improve pavement and roadway infrastructure condition in the Boston region.
The Boston region includes three transit agencies that regularly receive FTA funds to provide service—the MBTA, CATA and MWRTA. These agencies are responsible for meeting planning and performance-monitoring requirements under FTA’s TAM rule, which is focused on achieving and maintaining a state of good repair for the nation’s transit systems. Each year, they must submit progress reports and updated performance targets for federally required TAM performance measures, which relate to transit rolling stock, nonrevenue service vehicles, facilities, and rail fixed guideway infrastructure. Transit agencies develop these performance targets based on their most recent asset inventories and condition assessments, along with their capital investment and procurement expectations, which are informed by their TAM plans. MBTA, MWRTA, and CATA share their asset inventory and condition data and their performance targets with the Boston Region MPO, so that the MPO can monitor and set TAM targets for the Boston region. The MPO revisits its targets in these performance areas each year when updating its TIP.
The following subsections discuss the MPO’s current performance targets (adopted in February 2020) for each of the TAM performance measures, which are listed in Table 4-2. These performance targets reflect MBTA, CATA, and MWRTA state fiscal year (SFY) 2020 TAM performance targets (for July 2019 through June 2020). MPO staff has aggregated some information for asset subgroups. These tables highlight whether transit agencies expect to see performance for specific asset subgroups get better or worse compared to the SFY 2019 baseline (June 30, 2019).
FTA’s TAM performance measure for evaluating whether rolling stock (vehicles that carry passengers) and equipment vehicles (service support, maintenance, and other nonrevenue vehicles) are in a state of good repair is the percent of vehicles that meet or exceed their useful life benchmark (ULB). This performance measure uses vehicle age as a proxy for state of good repair (which may not necessarily reflect condition or performance), with the goal being to bring this value as close to zero as possible. FTA defines ULB as “the expected lifecycle of a capital asset for a particular transit provider’s operating environment, or the acceptable period of use in service for a particular transit provider’s operating environment.”4-11 For example, FTA’s default ULB value for a bus is 14 years.4-12 The MBTA has used FTA default ULBs for heavy and light rail vehicles, vintage trolleys, commuter rail coaches and locomotives, and ferry boats, while it uses MBTA-defined ULBs, which are based on agency-specific usage and experience, for its equipment vehicles, buses, and paratransit automobiles, minivans, and vans. CATA and MWRTA have selected ULBs from other sources.4-13
Table 4-10 describes SFY 2019 baselines and the MPO’s SFY 2020 targets for rolling stock. As shown below, the MBTA, CATA, and MWRTA are improving performance for a variety of rolling stock vehicle classes. Transit agencies can make improvements on this measure by expanding their rolling stock fleets or replacing vehicles within those fleets.
Table 4-10
Targets for the Useful Life of Transit Rolling Stock
|
|
|
SFY 2019 Baseline |
SFY 2020 Targets |
||||
|---|---|---|---|---|---|---|---|
| Agency |
Asset Type |
Number of Vehicles |
Number of Vehicles |
Percent of Vehicles |
Expected Number of Vehicles |
Expected Number of Vehicles |
Target Percent of Vehicles |
MBTA |
Buses |
1,023 |
407 |
40% |
1,053 |
312 |
30% |
MBTA |
Light Rail Vehicles |
196 |
86 |
44% |
220 |
86 |
39% |
MBTA |
Vintage Trolleys* |
6 |
6 |
100% |
6 |
6 |
100% |
MBTA |
Heavy Rail Vehicles |
416 |
240 |
58% |
458 |
240 |
52% |
MBTA |
Commuter Rail Locomotives |
94 |
25 |
27% |
94 |
25 |
27% |
MBTA |
Commuter Rail Coaches |
428 |
55 |
13% |
428 |
55 |
13% |
MBTA |
Ferry Boats |
4 |
0 |
0% |
4 |
0 |
0% |
MBTA |
Paratransit Vehicles† |
785 |
241 |
31% |
785 |
15 |
2% |
CATA |
Buses |
8 |
0 |
0% |
8 |
2 |
25% |
CATA |
Cutaway Vehicles‡ |
23 |
0 |
0% |
23 |
0 |
0% |
CATA |
Trolleys (simulated)§ |
2 |
2 |
100% |
2 |
2 |
100% |
MWRTA |
Automobiles** |
8 |
8 |
100% |
8 |
8 |
100% |
MWRTA |
Cutaway vehicles‡ ** |
95 |
25 |
26% |
95 |
24 |
25% |
Note: The information provided indicates the number and percentage of vehicles that are, or are expected to, equal or exceed the useful life benchmark.
* MBTA vintage trolleys are used on the Ashmont–Mattapan High Speed Line.
† The MBTA THE RIDE paratransit vehicles data and targets reflect automobiles, vans, and minivans.
‡ The National Transit Database defines a cutaway vehicle as a vehicle in which a bus body is mounted on a van or light-duty truck chassis, which may be reinforced or extended. CATA uses nine of these vehicles to provide fixed route services, and 14 of these vehicles to provide demand response service.
Source: MBTA.
§ Simulated trolleys, also known as trolley-replica buses, have rubber tires and internal combustion engines, as opposed to steel-wheeled trolley vehicles or rubber-tire trolley buses that draw power from overhead wires.
** MWRTA uses cutaway vehicles to provide fixed route and demand response service and uses autos to provide demand response service.
The MBTA’s planned SFY 2020 investments in revenue vehicles include incorporating new Orange Line cars (heavy rail), Red Line cars (heavy rail), Green Line vehicles (light rail), and buses into its vehicle fleets and overhauling buses and commuter rail vehicles. CATA will receive FTA Section 5310 funds, which are administered by MassDOT, in FFY 2020, to purchase two fixed-route replacement vehicles.
Table 4-11 shows SFY 2019 baselines and the MPO’s SFY 2020 targets for transit equipment vehicles. MPO staff has aggregated targets for nonrevenue vehicle subtypes for each of the three transit agencies, although MBTA commuter rail and transit system vehicle fleets are listed separately. Similar to transit rolling stock, transit agencies can make improvements on these measures by expanding their fleets or replacing vehicles within those fleets.
Table 4-11
Targets for the Useful Life of Transit Equipment
|
|
|
SFY 2019 Baseline |
SFY 2020 Targets |
||||
|---|---|---|---|---|---|---|---|
| Agency |
Asset Type |
Number of Vehicles |
Number of Vehicles |
Percent of Vehicles |
Expected Number of Vehicles |
Expected Number of Vehicles |
Target Percent of Vehicles |
MBTA |
Transit Equipment |
961 |
264 |
27% |
931 |
278 |
30% |
MBTA |
Commuter Rail Equipment* |
303 |
59 |
19% |
303 |
63 |
21% |
CATA |
All Equipment |
3 |
0 |
0% |
3 |
0 |
0% |
MWRTA |
All Equipment† |
12 |
8 |
67% |
12 |
7 |
58% |
Note: The information provided indicates the number and percentage of vehicles that are, or are expected to, equal or exceed the useful life benchmark.
* MBTA Commuter Rail equipment only includes assets owned by the MBTA.
† MWRTA nonrevenue, or equipment, vehicles include both trucks and autos.
Source: MBTA.
FTA assesses the condition for passenger stations, parking facilities, and administrative and maintenance facilities to determine if they are in a state of good repair by using the FTA Transit Economic Requirements Model (TERM) scale, which generates a composite score based on assessments of facility components. Facilities with scores below three are considered to be in marginal or poor condition (though this score is not a measure of facility safety or operational performance). The goal is to bring the share of facilities that meet this criterion to zero. Infrastructure projects focused on individual systems may improve performance gradually, while more extensive facility improvement projects may have a more dramatic effect on a facility’s TERM scale score.
Table 4-12 shows SFY 2019 measures and the MPO’s SFY 2020 targets for MBTA, CATA, and MWRTA facilities.
Table 4-12
Targets for Transit Facility Condition
|
|
|
SFY 2019 Baseline |
SFY 2020 Targets |
||||
|---|---|---|---|---|---|---|---|
| Agency |
Asset Type |
Number of Facilities |
Number of Facilities in Marginal or Poor Condition |
Percent of Facilities |
Expected Number of Facilities |
Expected Number of Facilities in Marginal or Poor Condition |
Target Percent of Facilities in Marginal or Poor Condition |
MBTA |
Transit: Passenger/ Parking Facilities |
162 |
22 |
14% |
162 |
18 |
11% |
MBTA |
Transit: Administrative/Maintenance Facilities |
156 |
106 |
68% |
156 |
105 |
67% |
MBTA |
Commuter Rail: Passenger/ Parking Facilities |
224 |
8 |
4% |
224 |
6 |
3% |
MBTA |
Commuter Rail: Administrative/Maintenance Facilities |
162 |
36 |
22% |
162 |
35 |
22% |
CATA |
Administrative/Maintenance Facilities |
1 |
0 |
0% |
1 |
0 |
0% |
MWRTA |
Administrative/Maintenance Facilities |
1 |
0 |
0% |
1 |
0 |
0% |
Note: The information provided indicates the number and percentage of facilities that are, and are expected to be, in marginal or poor condition based on assessments using FTA’s TERM scale.
Source: MBTA.
The MBTA’s SFY 2020 facility improvement activities include wayfinding and station brightening at State, Haymarket, North, and Park Street Stations; upgrades at Wellington Station, Oak Grove Station, Central Station, Harvard Station, the Harvard Square Busway, and Cabot Yards; improvements to the Quincy Adams and Braintree Station parking garages and an MBTA data center; elevator improvements at various stations, and ongoing commuter rail station transformation and revitalization, among other activities.
Table 4-13 describes SFY 2019 baselines and SFY 2020 targets for infrastructure condition, specifically rail fixed guideway condition. The MBTA is the only transit agency in the Boston region with this asset type. The performance measure that applies to these assets is the percentage of track that is subject to performance or speed restrictions. The MBTA samples the share of track segments with speed restrictions throughout the year. These performance restrictions reflect the condition of track, signal, and other supporting systems, which the MBTA can improve through maintenance, upgrades, and replacement and renewal projects. Again, the goal is to bring the share of MBTA track systems subject to performance restrictions to zero.
Table 4-13
Targets for MBTA Fixed Guideway Infrastructure Condition
|
|
SFY 2019 Baseline |
SFY 2020 Targets |
||||
|---|---|---|---|---|---|---|
| Asset Type |
Number of Miles |
Number of Miles with Performance Restrictions |
Percent of Miles with Performance Restrictions |
Expected Number of Miles |
Expected Number of Miles with Performance Restrictions |
Target Percent of Miles with Performance Restrictions |
MBTA Transit Fixed Guideway* |
130.23 |
10.23 |
8% |
130.23 |
8.23 |
6% |
MBTA Commuter Rail Fixed Guideway |
663.84 |
5.19 |
1% |
663.84 |
5.00 |
1% |
Note: For this performance measure, the term “miles” refers to “directional route miles,” which represents the miles managed and maintained by the MBTA with respect to each direction of travel (for example, northbound and southbound) and excludes nonrevenue tracks such as yards, turnarounds, and storage tracks. The baseline and target percentages represent the annual average number of miles meeting this criterion over the 12-month reporting period.
* The MBTA’s Transit Fixed Guideway information reflects light rail and heavy rail fixed guideway networks.
Source: MBTA.
The MBTA’s SFY 2020 investments in this area include Green Line track and intersection and infrastructure upgrades, and commuter rail positive train control upgrades, among other activities.
Many different types of transit investments may affect the TAM vehicle, facility, or fixed guideway performance measures described in the previous section, because these investments may either improve or replace assets already included in transit agency inventories, or because they may expand those inventories. These investments may improve assets gradually over time by upgrading specific asset subsystems, or they may generate more dramatic changes in performance by overhauling or replacing assets.
The FFYs 2021–25 TIP includes a variety of transit infrastructure improvement initiatives, funded both by the MPO’s Regional Targets and dollars that the MBTA, MWRTA, and CATA program in coordination with MassDOT. Because of the timing of these investments, they are not expected to affect the MPO’s current (SFY 2020) TAM performance targets; however, they are expected to help improve performance on the TAM measures in general.
During FFYs 2021 to 2025, the MBTA will be investing in vehicles to replace or expand its fleets through its Revenue Vehicles and Bus Programs. In addition to funding vehicle upgrades and overhauls, the MBTA will make the following procurements:
Also, the Green Line Extension project, which the MPO helped support with its Regional Target funds, includes investments in vehicles to support the new service. Additional details about these investments are included in Chapter 3.
Meanwhile, CATA plans to purchase buses and simulated trolleys and MWRTA plans to purchase vans to replace vehicles that have reached the end of their useful life. Collectively, these investments will help improve the condition of the fleets and make progress with respect to the TAM rolling stock and equipment performance measures.
During FFYs 2021 to 2025, the MBTA will invest in several of its transit stations and parking facilities through its Stations and Facilities Program. These investments will improve specific subsystems or components or make more extensive repairs or upgrades to bring the facilities into a state of good repair and address ADA accessibility and other needs. Chapter 3 describes these investments in more detail. This set of investments includes the construction of a new commuter rail station in Chelsea (and the decommissioning of the existing station); improvements to Forest Hills Station, Newton Highlands Station, Lynn Station and its parking garage, and stations along the Mattapan High Speed Line; reconstruction of Green Line surface stations; and design work to improve Green and Orange Line stations and commuter rail stations in Newton. The MBTA will also be installing new redundant elevators and replacing existing elevators at various stations, making modifications to the Hingham Ferry Dock, and making infrastructure improvements at the MBTA’s Codman Yard facility, in part to accommodate new Red Line vehicles. The MBTA will also make improvements to commuter rail stations in Worcester and South Attleboro, which are outside of the Boston region but are part of the MBTA system. In addition, the Green Line Extension project will include investment in new stations as part of the expansion of service. Over time, these investments will improve the condition of MBTA facilities and also enhance accessibility and the customer experience.
While MWRTA and CATA’s facilities are currently in a state of good repair, these agencies will continue to maintain and upgrade them during FFYs 2021 to 2025. CATA plans to repave its parking lot. MWRTA plans to improve its Blandin Hub facility and enhance the facility’s ability to maintain and manage vehicles. MWRTA will also fund improvements and enhancements for the operations center at the commuter rail station in Framingham, which it manages and maintains under contract with the MBTA.
The MBTA’s investments in track signals and systems through its Signals and System Upgrade Program during FFYs 2021 to 2025 will, over time, help reduce the need for performance restrictions on fixed guideways. These investments include Green Line and Framingham/Worcester Line track upgrades, improvements to track infrastructure at Alewife Station, upgrades and improvements to Red Line, Orange Line, and Green Line signals, and specific signal upgrades at Alewife and North Stations. Chapter 3 describes these investments in more detail.
The MBTA will be funding other improvements that will enhance the performance of fixed guideway systems, including the implementation of automatic train control systems for the commuter rail network, improvements to infrastructure along the Mattapan High Speed Line, and power infrastructure upgrades at various locations. The installation of new track and systems as part of the Green Line Extension project will also affect fixed guideway infrastructure performance measures in the future.
Other planned MBTA investments during FFYs 2021 to 2025 include those in its Bridge and Tunnel Program, which include bridge and tunnel repair and rehabilitation and replacement of several bridges. The MBTA will also be replacing its radio system to support MBTA police communication. Chapter 3 provides more information on these projects. Meanwhile, CATA will invest in shop equipment, software, and other capital maintenance items, and MWRTA will invest in bus support equipment and information technology infrastructure.
Additional refinements may be made to MBTA, CATA, and MWRTA programming after MassDOT’s CIP is finalized in summer 2020. Also, CATA and MWRTA coordinate with MassDOT’s Rail and Transit Division to maintain vehicle condition in a state of good repair through competitive grant applications, including to the Commonwealth’s Community Transit Grant Program. The Rail and Transit Division awards funding, including FTA 5310 funds, through this program on an annual basis; award announcements are typically made in the third quarter of the calendar year. Vehicle purchases and other investments supported by this program may improve transit condition in the Boston region.
The MPO will continue to work with MassDOT, the MBTA, MWRTA, and CATA, on the following activities to improve the links between transportation investments and system preservation and modernization:
The MPO’s capacity management and mobility goal focuses on using existing facility capacity more efficiently and increasing transportation options. The MPO’s objectives in this area encompass a variety of modes and aspects of mobility, including access to and the accessibility of different transportation modes, connectivity between modes and systems, and support for reliable travel and congestion mitigation. Much of the Boston region is densely developed, which creates challenges to addressing these access, reliability, and congestion mitigation needs.
Several different planning processes come together to address capacity management and mobility performance, issues, and needs. Through its CMP, the MPO does extensive analysis of congestion and mobility constraints in the region, and it also produces periodic CMAQ Performance Plans that describe other congestion-oriented measures and targets. The MPO combines this work with ongoing system-level analyses that support its long-range planning, which are documented in its Long-Range Transportation Plan Needs Assessment. MassDOT conducts its own analyses of mobility performance and needs, which it documents in modal plans such as its Freight Plan, Bicycle Plan, and Pedestrian Plan, its own CMAQ Performance Plan, and its MassDOT Performance Management Tracker tool. Meanwhile, the MBTA tracks and analyzes mobility metrics and uses these to support planning processes, such as Focus40, its current long-term investment plan. The exchange and integration of these plans help agencies in the Boston region coordinate to improve mobility across modes.
The MPO examines a variety of different metrics to understand congestion and mobility issues, several of which are discussed below.
Table 4-3 highlights several federally required performance measures pertaining to the NHS system, including infrastructure condition and travel reliability. FHWA requires states and MPOs to monitor and set targets for two performance measures that pertain to all travelers on NHS roadways:
These measures capture (1) whether travel times on an NHS segment are consistent (reliability); and (2) the extent to which NHS users’ travel may be affected by those conditions (percent of person miles). Several component metrics make up this measure:
States or MPOs identify the person-miles of travel for each NHS segment and divide the total person-miles on the relevant NHS network that are reliable by the total person-miles on the relevant NHS network. To support this analysis, FHWA provides travel-time and traffic-volume data as part of the National Performance Management Research Data Set (NPMRDS), in which travel-time data are reported by traffic messaging channel (TMC) segments.
States are required to set two-year and four-year targets for these measures. In 2018, MassDOT calculated baselines and established targets for these measures for the Massachusetts Interstate and non-Interstate NHS networks. When establishing baseline values, MassDOT only examined NPMRDS travel-time data from CY 2017 because the NPMRDS from prior years was assembled using different data collection methods and has some different features. Because historic data were limited, MassDOT considered FHWA guidance and recommendations for establishing initial targets with this limited historic data, and set its initial targets equal to CY 2017 baseline values.4-15
Table 4-14 shows MassDOT’s CY 2017 baselines and two-year and four-year targets for these measures. The Boston Region MPO, like all MPOs, was required to establish four-year targets for these measures by either supporting state targets or setting its own quantitative targets for the Boston region. In 2018, the MPO board voted to support the state’s four-year targets. Table 4-14 also shows CY 2017 baselines for the Boston region’s Interstate and non-Interstate NHS networks as a basis for comparison. As the table shows, the Boston region’s share of reliable person-miles traveled on its Interstate and non-Interstate NHS networks is lower than those values for Massachusetts as a whole.
Table 4-14
Targets for Travel Time Reliability
Network |
Measure |
Cumulative Traffic |
2017 Measure |
Two-Year Target |
Four-Year Target |
Massachusetts—Interstate Highway System |
Percent of person-miles on the |
1,150 |
68.0% |
68.0% |
68.0% |
Massachusetts—Non-Interstate NHS System |
Percent of person-miles on the |
5,257 |
80.0% |
80.0% |
80.0% |
Boston Region—Interstate Highway System |
Percent of person-miles on the |
354 |
47.2% |
n/a |
n/a |
Boston Region—Non-Interstate NHS System |
Percent of person-miles on the |
1,799 |
69.0% |
n/a |
n/a |
Note: The two-year target reflects conditions as of the end of CY 2019, and the four-year target reflects conditions as of the end of CY 2021.
Sources: National Performance Management Research Data Set, Cambridge Systematics, MassDOT, and the Boston Region MPO.
FHWA requires states and MPOs to track truck travel reliability on the Interstate system to better understand the performance of the nation’s freight system. The applicable measure in this case is the Truck Travel Time Reliability Index (TTTR). Like the LOTTR, this measure compares longer (95th percentile) truck travel times to average (50th percentile) truck travel times. The greater the difference between these two travel times on an Interstate segment, the less reliable truck travel on that segment is considered to be. For each Interstate segment, states and MPOs calculate TTTR values for different day-and-time periods and weight the segment length by the maximum applicable TTTR value.4-16 They then sum these weighted segment lengths for all Interstate segments and divide that total value by the length of the full Interstate network for the applicable geographic area. Like segment-specific TTTR values, the greater this aggregate value is, the more unreliable the network is with respect to truck travel.
In 2018, MassDOT calculated baseline TTTR Index values and established performance targets using CY 2017 truck travel-time data included in the NPMRDS. As with the all-vehicle travel time reliability targets, MassDOT set its two-year and four-year targets equal to the CY 2017 baseline. Table 4-15 displays these values. MPOs are required to set four-year targets for this measure, and the Boston Region MPO board voted to support MassDOT’s four-year TTTR Index target in 2018. Table 4-15 also includes the Boston region’s CY 2017 baseline index value. As the table shows, the Boston region’s TTTR baseline value is higher than the one for Massachusetts, indicating that truck travel on the region’s Interstate network is generally less reliable than on Massachusetts’s Interstates as a whole.
Table 4-15
Targets for Truck Travel Time Reliability
Network |
Measure |
Cumulative Traffic |
2017 Measure |
Two-Year Target |
Four-Year Target |
Massachusetts—Interstate Highway System |
Truck Travel Time Reliability Index |
1,150 |
1.85 |
1.85 |
1.85 |
Boston Region—Interstate Highway System |
Truck Travel Time Reliability Index |
354 |
2.55 |
n/a |
n/a |
Note: The two-year target reflects conditions as of the end of CY 2019, and the four-year target reflects conditions as of the end of CY 2021.
Sources: National Performance Management Research Data Set, Cambridge Systematics, MassDOT, and the Boston Region MPO.
MassDOT and the Boston Region MPO also examine mobility using measures they must monitor to meet CMAQ requirements. These measures are designed to help FHWA, states, and MPOs better understand the impacts of CMAQ investments, which are intended to contribute to air quality improvements and provide congestion relief. CMAQ performance measures related to traffic congestion apply to UZAs that contain geographic areas designated as nonattainment areas because they do not meet US Environmental Protection Agency (EPA) standards for criteria air pollutants and precursors from mobile sources.4-17 The measures also apply to geographic areas, designated as maintenance areas, that have a history of being in nonattainment and are thus required to maintain air quality monitoring and standard conformity processes.
States must be involved in setting targets for CMAQ traffic performance measures if (1) they have mainline highways on the NHS that cross part of a UZA with a population of more than one million; and (2) that UZA contains part of a nonattainment or maintenance area for relevant criteria pollutants. Similarly, MPOs must participate in target setting for the traffic congestion measures if (1) the region contains mainline highways on the NHS that cross part of a UZA with a population of more than one million; and (2) the part of the MPO area that overlaps the UZA contains part of a nonattainment or maintenance area for relevant criteria pollutants. Massachusetts and the Boston Region MPO each meet these respective criteria and, therefore, must be involved in monitoring and setting targets for traffic congestion performance measures for the Boston UZA, which encompasses several MPO areas in eastern Massachusetts, New Hampshire, and Rhode Island. Agencies in each UZA that are responsible for these traffic congestion measures set two-year and four-year targets.
The first of these CMAQ traffic congestion measures is annual hours of peak hour excessive delay (PHED) per capita, which estimates the excessive delay experienced by a UZA’s population from travel on the NHS during peak periods. States and MPOs calculate this measure using several component metrics:
The PHED per capita measure is calculated at the Boston UZA level by multiplying the hours of excessive delay during peak periods by the number of travelers during peak periods, and then dividing that total by the UZA population.
To understand baseline performance and set targets for this measure, MassDOT and the New Hampshire Department of Transportation (NH DOT) worked with analysts at Cambridge Systematics and, using 2017 NPMRDS data, calculated annual hours of PHED per capita for travel on the NHS in their respective portions of the Boston UZA.4-20 In 2018, the agencies in the Boston UZA that are subject to CMAQ performance monitoring requirements—MassDOT, NH DOT, the Boston Region MPO, and the Northern Middlesex Council of Governments (NMCOG)—established two-year and four-year targets that maintain this 2017 baseline value for the annual hours of PHED per capita measure, as shown in Table 4-16.
Table 4-16
Targets for Annual Hours of Peak Hour Excessive Delay Per Capita in the Boston Urbanized Area
Geographic Area |
Massachusetts and New |
Boston UZA Population (MA and NH only)* |
2017 Measure Value (Baseline) |
Two-Year Target |
Four-Year Target |
Boston Urbanized Area |
80,053,183 |
4,371,476 |
18.30 |
18.30 |
18.30 |
* Cambridge Systematics aggregated 2012-16 American Community Survey population estimates from the US Census Bureau at the block group level to estimate the population for the portion of the UZA in Massachusetts and New Hampshire, and then inflated this estimate for 2017 by applying information on expected population growth in the Boston Metropolitan Statistical Area between 2016 and 2017.
† The two-year target reflects conditions as of the end of CY 2019, and the four-year target reflects conditions as of the end of CY 2021.
Sources: National Performance Management Research Data Set, US Census Bureau, FHWA, MassDOT, NH DOT, and Cambridge Systematics.
States and MPOs that meet applicability criteria for CMAQ performance requirements must also monitor and set targets for the share of non-single-occupant-vehicle (non-SOV) travel in their respective states or regions. This measure is calculated at the UZA level. The percent of non-SOV travel performance measure describes the extent to which people are using alternatives to single-occupancy vehicles to travel and, thus, helping to reduce traffic congestion and air pollution from mobile sources.
Collectively, MassDOT, NH DOT, the Boston Region MPO, and NMCOG used American Community Survey (ACS) data from the US Census Bureau to estimate the percent of workers age 16 and older who commuted to work using an option other than driving alone. These ACS five-year period estimates are rolling annual averages. Figure 4-6 shows how the percentage of workers using non-SOV commuting options in the Boston UZA has increased between 2012 (2008–12 ACS estimate) and 2016 (2012-16 ACS estimate). MassDOT calculated a linear trend line using these values for the Boston UZA and used that trend line to project expected values as of the end of CY 2019 (the expected 2015–19 ACS estimate) and CY 2021 (the expected 2017–21 ACS estimate). The agencies established these projected values as the Boston UZA targets for the percent of non-SOV travel. As Figure 4-6 shows, the share of non-SOV travel in the Boston region has been increasing steadily over time.
Figure 4-6
Historic Values and Performance Targets for the Percent of Non-SOV Travel in the Boston Urbanized Area
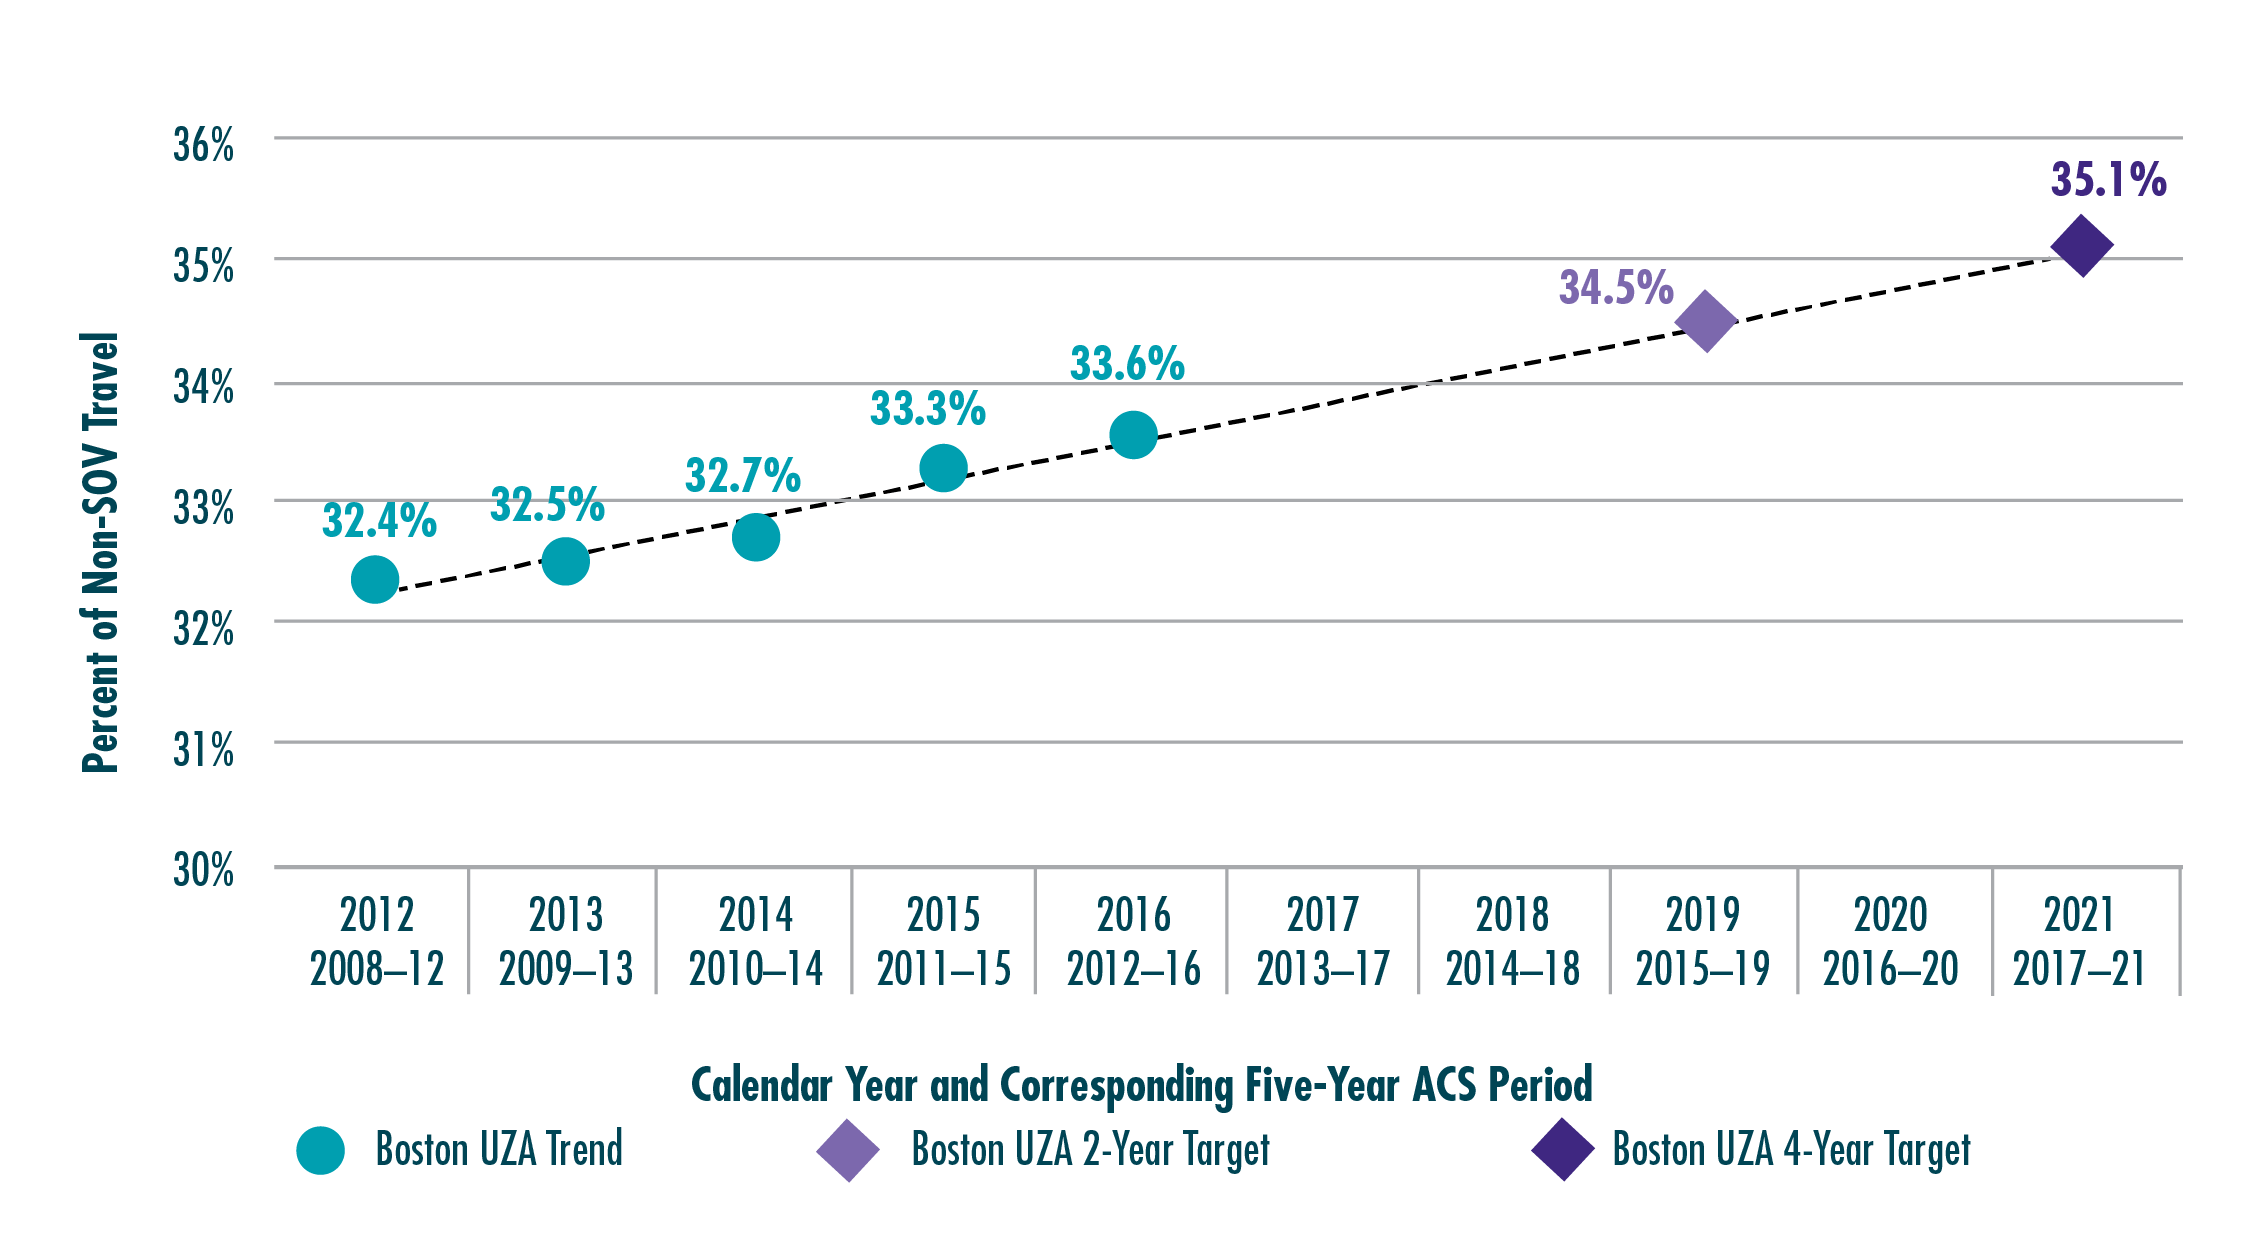
Note: The two-year target reflects conditions as of the end of CY 2019, and the four-year target reflects conditions as of the end of CY 2021.
Sources: US Census Bureau, 2012-16 American Community Survey Five-Year Estimates; the Massachusetts Department of Transportation; and the New Hampshire Department of Transportation.
Table 4-17 lists the recent baseline and performance target for this measure. It also includes a baseline value for non-SOV travel that is specific to the Boston region, which is a larger percentage than for the Boston UZA.
Table 4-17
Targets for Percent of Non-SOV Travel in the Boston Urbanized Area
Geographic Area |
2012-16 Measure Value (Baseline) |
Two-Year Target |
Four-Year Target |
Boston UZA |
33.6% |
34.5% |
35.1% |
Boston region (97 municipalities) |
38.4% |
n/a |
n/a |
Note: The two-year target reflects conditions as of the end of CY 2019, and the four-year target reflects conditions as of the end of CY 2021.
Sources: MassDOT, NH DOT, and the US Census American Community Survey.
The MPO seeks to make investments that help manage capacity on the transportation network and improve mobility for travelers in a variety of ways, including the following:
When prioritizing projects for funding with Regional Target dollars, the MPO uses evaluation criteria to assess how well each project expands transportation options (and mode choice) by enhancing bicycle and pedestrian accommodations and connections to transit, and how well each project helps reduce congestion and delay for passenger vehicles (including transit vehicles) and trucks. For more information on the MPO’s capacity management and mobility-oriented TIP criteria, see Appendix A. During the FFYs 2021–25 TIP development process, MPO staff also gathered information about the relationship between TIP projects and the NHS, including unreliable segments on the NHS, based on 2017 NPMRDS data and federal travel-time-reliability performance thresholds.
By electing to support the Commonwealth’s targets for federally required reliability measures and agreeing to the UZA targets for the federally required annual hours of PHED per capita and non-SOV travel measures, the MPO agrees to plan and program projects so that they contribute to achieving those targets. It can be challenging to anticipate how transportation projects may affect these performance measures, as they track outcomes that are not only affected by transportation investments but also traveler choices and demand, among other factors. The MPO developed estimates for MPO staff-identified project-related metrics to see how its Regional Target roadway projects could improve the transportation system in ways that contribute to more reliable, less congested travel on the NHS or that encourage more non-SOV travel:
Table 4-18 summarizes these estimates for Regional Target roadway projects. MPO staff developed estimated values for these metrics using available data from functional design reports and other materials provided by project proponents; results from MPO TIP evaluations; 2017 NPMRDS data; and other sources. These estimates aggregate changes in vehicle hours of delay using project-level information on vehicle volumes and changes in delay times at intersections from project improvements.
Table 4-18
Regional Target Projects: Roadway Capacity Management and Mobility Performance Metrics
Metric |
Value |
Projects that overlap unreliable NHS segments and that will improve roadway signalization or geometry* |
7 projects |
Projects that overlap any NHS segments and that will improve roadway signalization or geometry* |
16 projects |
Net reduction in vehicle hours of delay per day† |
9,700 hours reduced per day |
Net reduction in vehicle hours of delay per day for projects that overlap the NHS† |
6,100 hours reduced per day |
Miles of new sidewalks added |
16 miles |
Lane miles of new bicycle accommodations and shared-use paths |
58 lane miles |
Projects that improve intermodal connections or access to transit |
27 projects |
Note: The group of projects reflected in this table does not include the Green Line Extension or Community Connections and Transit Modernization investments.
* The MPO identified reliable and unreliable segments on the NHS using the 2017 National Performance Management Research Data Set federal travel time reliability performance thresholds.
† This aggregate estimate for reduced daily vehicle delay also excludes two Major Infrastructure roadway projects that were included in the air quality modeling results in Destination 2040: Project 604996–Bridge Replacement on New Boston Street in Woburn and Project 606226–Reconstruction of Rutherford Avenue in Boston. This aggregate estimate is based on projected future conditions for project locations and has been rounded to the nearest hundred.
Source: Boston Region MPO.
In addition to contributing to several metrics mentioned above, FFYs 2021–25 projects in the MPO’s Community Connections Program will expand or enhance non-SOV options, such as by providing new shuttles, expanding amenities, or addressing transit signal operations.
Other Regional Target investments not mentioned in Table 4-18 will also support the availability of non-SOV options. By contributing to the Green Line Extension project, the MPO supports the expansion of light-rail service to more areas within the Boston region. Funding is also available for the MPO’s new Transit Modernization Program beginning in FFY 2025. These projects have not yet been selected but could enhance transit service and encourage people to take transit instead of traveling alone in their cars, which may in turn make roadways less congested and more reliable.
MassDOT, MBTA, and RTA projects, described in Chapter 3, also address capacity management and mobility in the Boston region and may also support improvements on federally required reliability, congestion, and non-SOV travel performance measures. In particular, MassDOT’s Bicycle and Pedestrian projects expand the region’s bicycle and pedestrian networks, which support non-SOV travel. Its Intersection Improvements program includes six projects, which may address delay and congestion. One of its Roadway Reconstruction projects addresses a freight bottleneck identified in the MassDOT’s Freight Plan, the Interstate 90/Interstate 495 interchange in Hopkinton and Westborough, which will likely improve truck travel time reliability. Meanwhile, MBTA and RTA investments enhance the region’s transit system and make it an attractive alternative to SOV travel.
The MPO will continue to work with MassDOT, the MBTA, the region’s RTAs and other transit service providers, and other stakeholders in the region to improve capacity management and mobility performance. These activities may include the following:
The MPO aims to support clean air and sustainable communities in the Boston region by creating an environmentally friendly transportation system, which it pursues by investing in projects that reduce greenhouse gases (GHGs) and other pollutants generated by the transportation sector, and minimize negative environmental impacts from the system.
The MPO recognizes that GHG emissions contribute to climate change. If climate change trends continue as projected, the conditions in the Boston region will include a rise in sea level coupled with storm-induced flooding, and warmer temperatures that would affect the region’s infrastructure, economy, human health, and natural resources. The Commonwealth of Massachusetts is responding to this challenge by taking action to reduce the GHGs produced in the state, including those generated by the transportation sector. To that end, Massachusetts passed its Global Warming Solutions Act (GWSA), which requires reductions of GHGs by 2020, and further reductions by 2050, relative to 1990 baseline conditions. To meet GWSA requirements, the MPO works with MassDOT and other stakeholders to anticipate the GHG impacts of projects included in the TIP, specifically by examining additions or reductions in carbon dioxide (CO2). More details on the MPO’s GHG tracking and evaluation processes are included in Appendix B.
Transportation projects may also help reduce other air pollutants and precursors and support reductions in CO2, volatile organic compounds (VOCs), nitrogen oxides (NOx) and carbon monoxide (CO) by improving traffic flow and bicycle and pedestrian travel. The Boston Region MPO contains a maintenance area for CO in Waltham and also is required to track VOCs and NOx to meet EPA requirements. (More detailed information about the MPO’s air quality status and related requirements is available in Chapter 5). The MPO tracks the air quality benefits of transportation projects to identify projects that may be eligible for CMAQ funds. FHWA also requires the Boston Region MPO to produce a CMAQ Performance Plan. This plan includes performance targets for the annual PHED per capita and share of non-SOV travel measures described in the previous section and targets for the amount of applicable emissions the MPO expects will be reduced because of CMAQ-funded projects in the region. As part of its CMAQ Performance Plan, the MPO must note how it expects its CMAQ-funded projects to support improvements in these performance measures, which reinforces the connection between planning, investments, and expected performance outcomes.
The federally required CMAQ emissions reduction measure, identified in Table 4-3, is the total emissions reduction for applicable pollutants and precursors for CMAQ-funded projects in designated nonattainment and maintenance areas. FHWA requires states and MPOs subject to these CMAQ performance management requirements to establish a baseline for this measure by identifying emissions reductions associated with any CMAQ-funded projects programmed in air quality nonattainment or maintenance areas between FFY 2014 and FFY 2017. These states and MPOs were also required to set two-year and four-year targets for the emissions reductions expected from CMAQ-funded projects programmed in nonattainment or maintenance areas.
In the Boston Region MPO’s case, this CMAQ emissions performance measure would capture the anticipated carbon monoxide emissions reductions from any CMAQ-funded projects that the MPO has programmed specifically in the carbon monoxide maintenance area in Waltham.4-21 Table 4-19 shows the Boston Region MPO’s baseline and target values for this measure. Neither the MPO nor MassDOT programmed any CMAQ-funded projects in Waltham during FFYs 2014 to 2017, and at the time of target setting the MPO’s TIP did not reflect any CMAQ-funded projects programmed in Waltham from FFY 2018 to 2021. The FFYs 2021–25 TIP does not include any CMAQ-funded projects in Waltham.
Table 4-19
Targets for Emissions Reduction from CMAQ Projects in the Boston Region
Performance Measure |
FFYs 2014–17 Measure Value (Baseline) |
Two-Year Target |
Four-Year Target |
Daily kilograms of carbon monoxide emissions reduction from CMAQ projects in Boston region nonattainment or maintenance areas |
0 |
0 |
0 |
Source: Boston Region MPO.
The MPO uses evaluation criteria to assess the projected transportation-related emissions of each project that is a candidate for Regional Target funding, both for CO2 and other air quality pollutants and precursors, among other environmental considerations. Transportation projects can support reductions in CO2, VOCs, NOx, and CO by improving traffic flow and bicycle and pedestrian travel or by providing or enhancing non-SOV travel alternatives, such as transit.
Table 4-20 displays the CO2 and other emissions reductions the MPO expects from projects it has programmed using its Regional Target funds. MPO staff estimates emissions for projects using MassDOT’s air quality analysis worksheets for each project type and the Environmental Protection Agency’s MOtor Vehicle Emission Simulator (MOVES) emission factors.
Table 4-20
Regional Target Projects: Clean Air and Sustainable Communities Performance Metrics
Metric |
Value |
Annual kilograms of CO2 reduced |
9,078,800 kilograms |
Annual kilograms of other emissions (VOCs, NOx, and CO) reduced |
15,900 kilograms |
Note: The group of projects reflected in this table does not include the Green Line Extension or Community Connections and Transit Modernization investments. These aggregate emissions estimates exclude two Major Infrastructure roadway projects that were included in the air quality modeling results for Destination 2040: Project 604996–Bridge Replacement on New Boston Street in Woburn and Project 606226–Reconstruction of Rutherford Avenue in Boston. These aggregate estimates are based on projected future conditions for project locations and have been rounded to the nearest hundred.
Source: Boston Region MPO
While not reflected in Table 4-20, the Green Line Extension will provide a non-SOV travel alternative, which can help reduce CO2 and other transportation related emissions. This TIP also includes funding for the MPO’s Transit Modernization Program beginning in FFY 2025. While projects have not been selected for this program yet, in general, modern transit assets may help reduce emissions by encouraging non-SOV travel or by changing the amount or type of energy these assets use. Projects funded through the MPO’s Community Connections Program may also support emissions reductions by enhancing options for, and thereby encouraging, transit, bicycle, or pedestrian travel.
MassDOT, MBTA, and RTA projects and programs also support improvements to air quality and the environment. Appendix B provides more detailed information and assessments of the GHG impacts of MassDOT, MBTA, CATA, and MWRTA projects and programs. MassDOT maintains an independent statewide CMAQ Performance Plan and tracks the relationship between its projects and its CMAQ emissions reduction performance targets.
The GWSA and FHWA’s CMAQ performance management requirements create frameworks that reinforce coordination between the MPO, MassDOT, and the region’s transit providers as they make investments to support clean air and sustainable communities. Future performance activities in this area may include the following:
The MPO seeks to ensure that the Boston region’s transportation network provides a strong foundation for economic vitality. Transportation investments can support economic vitality in a variety of ways, such as by supporting freight movement, improving connections to key freight and economic development sites, and supporting compact development. The MPO’s approach to addressing freight needs is guided in large part by MassDOT’s Freight Plan, which identifies key freight facilities and needs, strategies to improve freight movement, and priority projects.
The Metropolitan Area Planning Council’s (MAPC) regional land use plan also identifies economic vitality goals and strategies that influence MPO investments. For example, a strategy in MAPC’s current regional land use plan, MetroFuture, is to coordinate transportation investments to guide economic growth in the region.4-22 MAPC worked with its state-level partners at the Executive Office of Housing and Economic Development (EOHED) and the Executive Office of Energy and Environmental Affairs (EOEEA), as well as municipalities, to identify locations throughout the region appropriate for building housing stock and siting employers. These agencies identified the infrastructure improvements required to support the outcomes planned for these local, regional, and state-level priority development areas, and this work helps MAPC, the MPO, and state agencies to respond with their investments and technical assistance.
States and MPOs track the federally required truck travel time reliability measure for the Interstate Highway System, listed in Table 4-3, by using the Truck Travel Time Reliability Index. This measure has the most direct implications for the MPO’s Capacity Management and Mobility goal; however, this measure is also relevant to the Boston region’s economic vitality. For more details about this measure and associated targets, see the Capacity Management and Mobility Performance section of this chapter. The MPO has not yet established other performance measures specific to freight or economic vitality, such as measures that could be used to track the coordination of land use development and transportation investments.
When evaluating TIP projects using its TIP criteria, the MPO assesses how well each project may advance MetroFuture’s land use planning objectives. This evaluation takes into account how a project serves areas identified for economic development by state, regional, and local planning as well as areas with a relatively high density of existing development. These assessments are based on MAPC-provided information on targeted development sites and project relationships to areas of concentrated development, along with project data from functional design reports and other sources. Table 4-21 provides some highlights of how Regional Target-funded projects in this TIP address economic vitality.
Table 4-21
Regional Target Projects: Economic Vitality Performance Metrics
Metric |
Value |
Projects that improve access to |
19 projects |
Projects that serve areas of |
36 projects |
Note: The group of projects reflected in this table does not include the Green Line Extension, Community Connection and Transit Modernization investments, or Project 606476–Sumner Tunnel Improvements in Boston.
Source: Boston Region MPO.
MAPC’s regional land use plan and economic vitality initiatives, USDOT’s freight directives, and MassDOT’s freight planning will all influence strategies that the MPO uses to monitor economic vitality performance going forward. The MPO’s ongoing freight planning work will also play an important role in this process. Future activities may include the following:
Figure 4-7 highlights some of the ways that the MPO’s FFYs 2021–25 Regional Target-funded projects support improved performance in the MPO’s various goal areas.
Figure 4-7
FFYs 2021–25 TIP Target Program: Projects by the Numbers
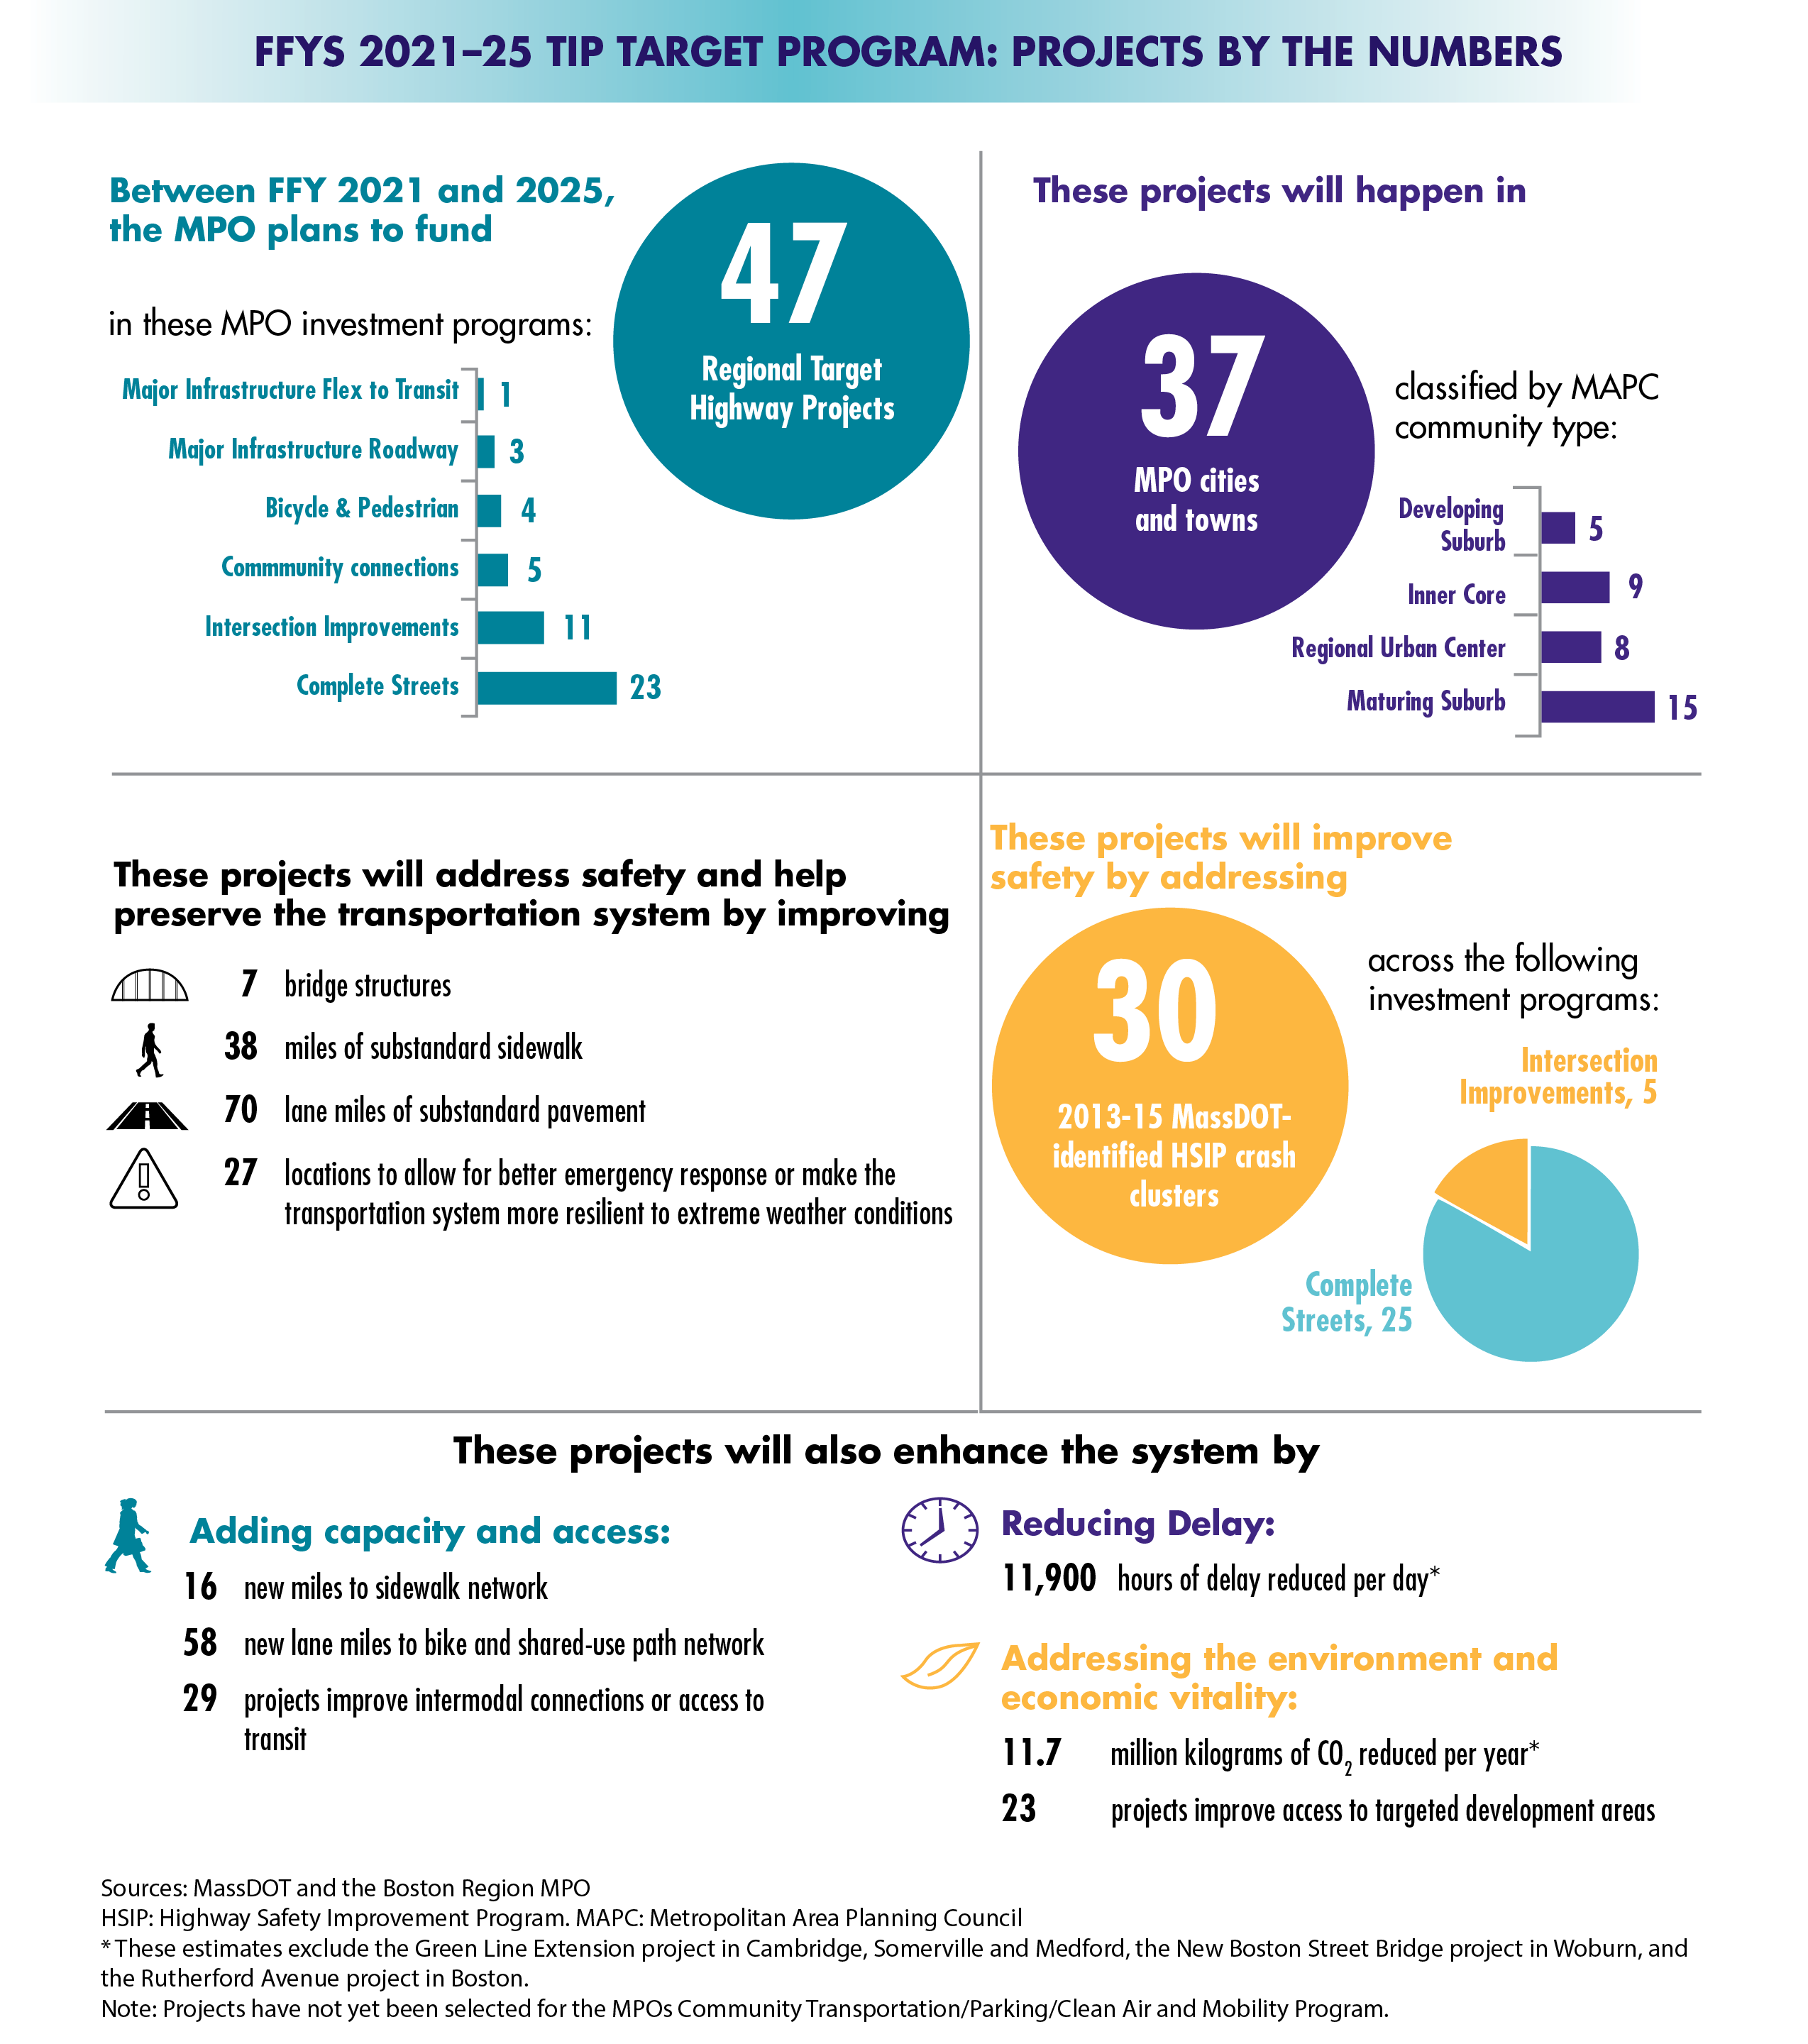
The three key phases in the MPO’s PBPP process—planning, investing, and monitoring and evaluating—were discussed earlier in this chapter. Within this framework, the MPO’s TIP relates primarily to the first two phases, focusing on the relationship between the goals and objectives and performance requirements in the MPO’s planning framework and ways the MPO will invest its capital dollars in upcoming federal fiscal years. Other MPO activities relate more directly to the monitoring and evaluation phase of PBPP:
The Commonwealth and the region’s transit agencies also have reporting and evaluation responsibilities. MassDOT and the Commonwealth’s Executive Office of Public Safety and Security reports roadway safety target information annually to FHWA and NHTSA. MassDOT reports other statewide performance targets and related information to FHWA on a biennial basis via FHWA’s Performance Management Form. The MBTA, MWRTA, and CATA must report their TAM targets to the National Transit Database, and in future years these agencies will need to create and regularly submit PTASPs that discuss their targets for transit safety performance measures. These reports generally include information about the progress that has been made with respect to performance measures and targets as compared to previous reports.
Going forward, the MPO will put the results of these reports and evaluations to use in its future planning and investment activities. These activities may include identifying new ways to bring information about performance into the MPO’s LRTP and TIP development processes, such as by updating project selection criteria or providing information through other means. This work would help the MPO develop scenarios to explore how various transportation investments made through the LRTP would support various goals and performance areas. Over time, the MPO expects that these actions will help ensure that the MPO’s investments are helping to meet its vision and goals for the region’s transportation system.
4-1 Urbanized Areas (UZAs) are defined by the US Census Bureau to represent the urban cores of metropolitan areas. The Boston Urbanized Area includes the 97 municipalities in the Boston Region MPO and includes portions of neighboring MPOs in eastern Massachusetts, New Hampshire, and Rhode Island.
4-2 Massachusetts Strategic Highway Safety Plan, 2018, pg. I, available at https://www.mass.gov/files/documents/2019/01/18/ dot_SHSP_2018.pdf
4-3 As of April 15, 2019, states are required to define serious injuries using the definition of “Suspected Serious Injury (A),” as detailed in the Model Minimum Uniform Crash Criteria 4th Edition. MassDOT implemented this change in its statewide crash data system as of January 1, 2019.
4-4 For more information, see MassDOT’s 2016 Top Crash Location Report, December 2018,
https://www.mass.gov/files/documents/2019/03/01/dot-2016TopCrashLocationsRpt.pdf
4-5 See MassDOT’s Transportation Asset Management Plan published September 2019 and available at https://www.mass.gov/doc/2019-transportation-asset-management-plan/download.
4-6 The MBTA’s, CATA’s, and MWRTA’s 2018 TAM Plans are available on the March 21, 2019, page of the MPO meeting calendar (https://www.ctps.org/calendar/day/2019-03-21).
4-7 National Bridge Inventory data is used to rate these components on a scale of zero (worst) to nine (best). The FHWA has classified these bridge ratings into good (seven, eight, or nine on the scale), fair (five or six), or poor (four or less).
4-8 Culverts are assigned an overall condition rating.
4-9 MassDOT continues to measure pavement quality and to set statewide short-term and long-term targets in the MassDOT Performance Management Tracker using the Pavement Serviceability Index (PSI), which is a different index than IRI.
4-10 According to the MPO’s TIP criteria, pavement is considered to be in good condition if its IRI rating is 190 or less, in fair condition if its IRI rating is 190 to 320, and in poor condition if its IRI rating is greater than 320. These thresholds differ from the IRI thresholds that FHWA has set for NHS pavement performance monitoring (good if IRI is 95 or less, fair if IRI is 95 to 170, and poor if IRI is greater than 170).
4-11 FTA. Performance Management. January 8, 2020. Available at www.transit.dot.gov/PerformanceManagement.
4-12 FTA. Default Useful Life Benchmark Cheat Sheet. October 26, 2016. www.transit.dot.gov/TAM/ULBcheatsheet.
4-13 CATA used useful life criteria as defined in FTA Circular 5010.1E (Award Management Requirements) for ULB values. MWRTA used useful life criteria as defined in MassDOT’s Fully Accessible Vehicle Guide and in FTA Circular 5010.1E for ULB values.
4-14 States and MPOs must calculate LOTTR values for four time periods: weekdays from 6:00 AM to 10:00 AM, weekdays from 10:00 AM to 4:00 PM, weekdays from 4:00 PM to 8:00 PM, and weekend days from 6:00 AM to 8:00 PM.
4-15 FHWA, “Frequently Asked Questions: Target Setting,” https://www.fhwa.dot.gov/tpm/faq.cfm#targ, accessed September 14, 2018.
4-16 States and MPOs must calculate TTTR Index Values for five time periods: weekdays from 6:00 AM to 10:00 AM, weekdays from 10:00 AM to 4:00 PM, weekdays from 4:00 PM to 8:00 PM, weekend days from 6:00 AM to 8:00 PM, and all days from 8:00 PM to 6:00 AM.
4-17 A precursor is a chemical compound that reacts with other chemical compounds in the presence of solar radiation to form pollutants.
4-18 FHWA requires state DOTs and MPOs to use 60 percent of the posted speed limit for the segment or 20 miles per hour, whichever is greater.
4-19 FHWA requires states and MPOs to use the period from 6:00 AM to 10:00 AM to represent the morning peak period, but it allows these agencies to choose either 3:00 PM to 7:00 PM or 4:00 PM to 8:00 PM to represent the evening peak period. MassDOT and NH DOT selected the period from 3:00 PM to 7:00 PM to represent the evening peak period for the Boston UZA.
4-20 Rhode Island was not included in the calculation of this measure because it does not include any portion of the Boston UZA’s NHS network. See FHWA’s Applicability Determination: CMAQ Traffic Congestion and CMAQ On-Road Mobile Source Emissions Measures (23 CFR 490.707 and 490.807), and Change Log: Applicability Determination for CMAQ Measures,” May 22, 2018.
4-21 FHWA regularly assesses the CMAQ performance management requirements that apply to states and MPOs. FHWA conducted its most recent assessment in August 2017, at which time the MPO was only subject to emissions performance management requirements for its carbon monoxide maintenance area in Waltham.
4-22 For more information about MetroFuture, visit www.mapc.org/get-involved/metrofuture-our-regional-plan/. MAPC is currently working on an update to this plan, MetroCommon 2050.
This chapter documents the Transportation Improvement Program (TIP) air quality conformity determination for the 1997 Ozone National Ambient Air Quality Standards (NAAQS) and carbon monoxide (CO) NAAQS in the Boston Region Metropolitan Planning Organization (MPO) area. It covers the applicable conformity requirements according to the latest regulations, regional designation status, legal considerations, and federal guidance.
The 1990 Clean Air Act Amendments (CAAA) require MPOs within nonattainment and maintenance areas to perform air quality conformity determinations prior to the approval of Long-Range Transportation Plans (LRTPs) and TIPs, and at such other times as required by regulation. CAAA Section 176(c) (Title 42, United States Code [USC], Section 7506 [c]) requires that federally funded or approved highway and transit activities are consistent with (“conform to”) the purpose of the State Implementation Plan (SIP). Conformity to the purpose of the SIP means that Federal Highway Administration (FHWA) and Federal Transit Administration (FTA) funding and approvals are awarded to highway and transit activities that
The United States Environmental Protection Agency’s (EPA) transportation conformity rules establish the criteria and procedures for determining whether metropolitan transportation plans, TIPs, and federally supported highway and transit projects conform to the SIP (Title 40, Code of Federal Regulations [CFR], Parts 51.390 and 93).
A nonattainment area is one that the EPA has designated as not meeting certain air quality standards. A maintenance area is a nonattainment area that now meets the standards and has been redesignated as maintaining the standard. A conformity determination is a demonstration that plans, programs, and projects are consistent with the SIP for attaining the air quality standards. The CAAA requirement to perform a conformity determination ensures that federal approval and funding go to transportation activities that are consistent with air quality goals.
The Commonwealth of Massachusetts was previously classified as a nonattainment area for ozone and was divided into two nonattainment areas. The Eastern Massachusetts ozone nonattainment area included Barnstable, Bristol, Dukes, Essex, Middlesex, Nantucket, Norfolk, Plymouth, Suffolk, and Worcester counties. The Western Massachusetts ozone nonattainment area included Berkshire, Franklin, Hampden, and Hampshire counties. With these classifications, the 1990 CAAA required the Commonwealth to reduce its emissions of volatile organic compounds (VOCs) and nitrogen oxides (NOx), the two major precursors to ozone formation, to achieve attainment of the ozone standard.
The 1970 Clean Air Act defined a one-hour NAAQS for ground-level ozone. The 1990 CAAA further classified degrees of nonattainment of the one-hour standard based on the severity of the monitored levels of the pollutant. The Commonwealth of Massachusetts was classified as being in serious nonattainment of the one-hour ozone standard and was required to achieve attainment by 1999. The attainment date was later extended, first to 2003 and a second time to 2007.
In 1997, the EPA proposed a new eight-hour ozone standard that replaced the one-hour standard, effective June 15, 2005. Scientific research had shown that ozone could affect human health at lower levels and over longer exposure times than one hour. The new standard was challenged in court and, after a lengthy legal battle, the courts upheld it. The new standard was finalized in June 2004. The new eight-hour standard is 0.08 parts per million (ppm) averaged over eight hours, and this level is not to be exceeded more than once per year. With this new standard, nonattainment areas were again further classified based on the severity of the eight-hour values. Massachusetts was classified as being in moderate nonattainment for the eight-hour standard and again was separated into two nonattainment areas—Eastern Massachusetts and Western Massachusetts.
In March 2008, the EPA published revisions to the eight-hour ozone NAAQS, establishing a level of 0.075 ppm (Volume 73, Federal Register [FR], page 16438; March 27, 2008). In 2009, EPA announced it would reconsider this standard because it fell outside of the range recommended by the Clean Air Scientific Advisory Committee. However, EPA did not take final action on the reconsideration, keeping the standard as 0.075 ppm.
After reviewing data from Massachusetts monitoring stations, EPA sent a letter on December 16, 2011, proposing that only Dukes County be designated as nonattainment for the new proposed 0.075 ppm ozone standard. The Commonwealth of Massachusetts concurred with these findings.
On May 21, 2012, the final rule (77 FR 30088) was published in the Federal Register. This rule defined the 2008 NAAQS as 0.075 ppm, the standard that was promulgated in March 2008. A second rule (77 FR 30160) published on May 21, 2012, revoked the 1997 ozone NAAQS effective one year after the July 20, 2012, effective date of the 2008 NAAQS.
Also, on May 21, 2012, the Federal Register published the air quality designation areas for the 2008 NAAQS. Dukes County was the only area in Massachusetts designated as a nonattainment area. All other Massachusetts counties were designated as attainment/unclassified for the 2008 standard.
On March 6, 2015, EPA published the final rulemaking, “Implementation of the 2008 National Ambient Air Quality Standards (NAAQS) for Ozone: State Implementation Plan Requirements; Final Rule” (80 FR 12264), effective April 6, 2015. This rulemaking confirmed the removal of transportation conformity to the 1997 Ozone NAAQS.
However, on February 16, 2018, the United States Court of Appeals for the District of Columbia Circuit in South Coast Air Quality Mgmt. District v. EPA (“South Coast II,” 882 F.3d 1138) held that transportation conformity determinations must be made in areas that were designated either as nonattainment or maintenance areas for the 1997 ozone NAAQS and attainment for the 2008 ozone NAAQS when the 1997 ozone NAAQS was revoked.
On November 29, 2018, EPA issued Transportation Conformity Guidance for the South Coast II Court Decision (EPA-420-B-18-050, November 2018), which addressed how transportation conformity determinations could be made in these areas. According to the guidance, both Eastern and Western Massachusetts, along with several other areas across the country, were defined as orphan nonattainment areas—areas that were designated as nonattainment areas for the 1997 ozone NAAQS at the time of its revocation (80 FR 12264, March 6, 2015) and as attainment areas for the 2008 ozone NAAQS in EPA’s original designation rule for this NAAQS (77 FR 30160, May 21, 2012). As of February 16, 2019, conformity determinations are required in these areas.
The federal guidance in effect since February 2019 applies to the entire state of Massachusetts. As such, a transportation conformity determination was required for the Boston Region MPO’s FFY 2021–25 TIP to prove adherence to the 1997 ozone NAAQS.
The transportation conformity regulation in 40 CFR § 93.109 sets forth the criteria and procedures for determining conformity. The conformity criteria for TIPs and LRTPs include a demonstration of fiscal constraint (§ 93.108), a basis on the latest planning assumptions (§ 93.110), use of the latest emissions model (§ 93.111), consultation (§ 93.112), provision for the timely implementation of transportation control measures (TCMs) (§ 93.113[b] and [c]), and consistency with an emissions budget and/or interim emissions tests (§ 93.118 and/or § 93.119).
Transportation conformity for TIPs and LRTPs for the 1997 ozone NAAQS can be demonstrated without a regional emissions analysis, per 40 CFR § 93.109(c). This provision states that the regional emissions analysis requirement applies one year after the effective date of EPA’s nonattainment designation for a NAAQS and until the effective date of revocation of such NAAQS for an area. The 1997 ozone NAAQS revocation was effective on April 6, 2015, and the court for South Coast II upheld the revocation. As no regional emission analysis is required for this conformity determination, there is no requirement to use the latest emissions model, budget, or interim emissions tests.
Therefore, transportation conformity for the 1997 ozone NAAQS for the Boston Region MPO’s FFY 2021–25 TIP can be demonstrated by showing that the remaining requirements in 40 CFR § 93.109 have been met. The following requirements regarding the use of the latest planning assumptions, consultation, timely implementation of TCMs, and fiscal constraint are defined in Section 2.4 of that guidance and are addressed in the following sections.
The requirement to use the latest planning assumptions in 40 CFR § 93.110 generally applies to regional emissions analyses. In the areas subject to the 1997 ozone NAAQS, the use of latest planning assumptions requirement applies to assumptions about TCMs in an approved SIP. (See the section titled Timely Implementation of Transportation Control Measures below).
The consultation requirements in 40 CFR § 93.112 for interagency consultation and public consultation were addressed. Interagency consultation was conducted with FHWA, FTA, EPA Region 1, the Massachusetts Department of Environmental Protection (DEP), and the other Massachusetts MPOs. The most recent conformity consultation meeting, held on March 4, 2020, focused on understanding the latest conformity-related court rulings and resulting federal guidance. Ongoing consultation is conducted in accordance with the following items:
Public consultation was conducted consistent with planning rule requirements in 23 CFR § 450. Title 23 CFR § 450.324 and 310 CMR 60.03(6)(h) requires that the development of the TIP, LRTP, and related certification documents provide an adequate opportunity for public review and comment. Section 450.316(b) also establishes the outline for MPO public participation programs. The Boston Region MPO's Public Participation Plan was formally adopted in October 2014 and is available at https://www.ctps.org/public_involvement. The Public Participation Plan ensures that the public will have access to the TIP and LRTP and all supporting documentation, provides for public notification of the availability of the TIP and LRTP and the public's right to review the document and comment thereon, and provides a 21-day public review and comment period prior to the adoption of the TIP and LRTP and related certification documents.
The public comment period for this conformity determination commenced on May 1, 2020. During the 21-day public comment period, any comments received will be incorporated into this TIP. This process will allow sufficient opportunity for public comment and for the MPO board to review the draft document. The public comment period will close on May 21, 2020, and the Boston Region MPO is expected to endorse this air quality conformity determination on May 28, 2020. These procedures comply with the associated federal requirements.
TCMs were submitted to EPA as SIP revisions in 1979 and 1982, and as part of the Central Artery/Tunnel (CA/T) project. The TCMs in the 1979 and 1982 submissions were accomplished through construction of ongoing projects or implementation of ongoing programs.
The TCMs submitted as part of the mitigation for the CA/T project have been documented in the LRTP as recommended or completed projects, except for the Fairmount Line Improvement Project and the Green Line Extension.
The Massachusetts Department of Transportation (MassDOT) works with the DEP to implement TCMs documented in the SIP. The Boston Region MPO will continue to include relevant projects in the LRTP and TIP, including those projects implemented to provide equal or better emissions outcomes when the primary TCMs do not meet deadlines, until the process for completing all active TCMs has concluded. When the process has been completed, the MPO will amend the LRTP and future TIPs and their conformity determinations to document any changes (including any interim projects or programs).
The status of the TCMs has been updated in the SIP Transit Commitments Status Report, which MassDOT submitted to DEP in August 2019. Highlights from the report are presented below. For a detailed description of the status of these projects, please visit the MassDOT website at https://www.mass.gov/files/documents/2018/08/02/SIP18ComStatReport.pdf
The Four Corners and Newmarket Stations on the Fairmount commuter rail line opened for service on July 1, 2013. All change orders have been paid and the project is officially closed out. The Talbot Avenue Station opened in November 2012.
The Blue Hill Avenue Station was redesigned and the 100 percent design plans were submitted to MassDOT in March 2016. In October 2016, MassDOT updated the public on the design plans and the next steps toward implementing the project. The project team advanced the project with the understanding that continued coordination with the community was paramount. Construction began in spring 2017, and the station opened in February 2019.
Given the delays in final completion of the project, MassDOT and the Massachusetts Bay Transportation Authority (MBTA) prepared a Petition to Delay and an Interim Emission Offset Plan to be implemented for the duration of the delay of the Fairmount Line Improvement Project. Both the petition and the offset plan were submitted to DEP in July 2011. MassDOT estimated the amount of emission reduction that would be expected from the implementation of the new Fairmount Line stations. With input from Fairmount Line stakeholders, MassDOT proposed offset measures that would meet emission reduction targets while the project remained under construction. The measures include providing shuttle bus service in Boston connecting Andrew Square to Boston Medical Center and increasing service on MBTA bus Route 31, which serves the Boston neighborhoods of Dorchester and Mattapan. These measures were implemented on January 2, 2012, and are currently in place.
Funding Source: The Commonwealth
The Green Line Extension project is a 4.7 mile light rail line, which will extend the current Green Line service from a relocated Lechmere Station in East Cambridge to a terminus at College Avenue in Medford, with a spur to Union Square in Somerville. This project is moving forward with a new cost estimate of $2.289 billion. Funding is in place, including a combined $1.99 billion in federal and state funds and pledged contributions totaling approximately $296 million from the Cities of Cambridge and Somerville ($75 million), the Boston Region MPO ($157.1 million), and MassDOT ($64.3 million through Special Obligation Bonds).
In early 2017, the MBTA initiated a procurement process for a design-build entity to design and construct the project. In November 2017, approval was received to execute a design-build contract with Green Line Extension contractors. The notice to proceed under the contract was issued in December 2017. The FTA obligated an initial portion ($100 million) of the Capital Investment Grant funds for the project in December 2017, under the 2015 Full Funding Grant Agreement. Additional funds have since followed. The contract with Green Line Extension contractors is in the amount of $954 million.
The primary goals of the project are to improve corridor mobility, boost transit ridership, improve regional air quality, ensure equitable distribution of transit services, and support opportunities for sustainable development in Cambridge, Somerville, and Medford. In addition to the light rail service on two new branches extending from Lechmere Station to Union Square Station and College Avenue Station, the project includes the construction of a vehicle maintenance facility and a multiuse path.
By filing an Expanded Environmental Notification Form, procuring multiple design consultants, and publishing both Draft and Final Environmental Impact Reports, MassDOT met the first four interim milestones associated with the Green Line Extension project. Since those filings, MassDOT has committed substantial resources to the Green Line Extension project, a top transportation priority of the Commonwealth and the largest expansion of the MBTA rapid transit system in decades. The project then transitioned from the planning and environmental review phases to the design, engineering, and construction phases, and the tasks associated with programming federal funding began.
The timeline for overall project completion, however, has been substantially delayed. In the 2011 SIP Status Report, MassDOT reported that the Green Line Extension project would not meet the legal deadline for completion by December 31, 2014. The delay triggered the requirement to provide interim emission reduction offset projects and measures for the period of the delay (beginning January 1, 2015). Working with the Central Transportation Planning Staff, MassDOT and the MBTA calculated the value for reductions of non-methane hydrocarbons, CO, and NOx that would be equal to or greater than the reductions projected to result from the operation of the Green Line Extension during the period of the delay, as specified in the SIP regulation.
In June 2012, MassDOT released a list of potential mitigation ideas received from the public that could be used as offset measures. In the summer and fall of 2012, MassDOT elicited public comments on these potential measures. Then the MBTA created an internal working group to determine a final portfolio of interim mitigation measures to implement by December 31, 2014, the legal deadline for the implementation of the Green Line Extension.
This work resulted in a recommendation to implement the following three interim mitigation measures, which collectively would meet the emissions reduction target for the project:
The Petition to Delay was submitted to the DEP on July 22, 2014, and expanded further on the analysis and determination of the interim offset measures. In a letter dated July 16, 2015, the DEP conditionally approved MassDOT's request to delay the Green Line Extension project and the implementation of the above interim mitigation measures. Both the 2014 Petition to Delay and the July 2015 Conditional Approval are available on MassDOT's website. Interim offset measures will remain in place for as long as is necessary.
Funding Source: The Commonwealth, FTA via the Full Funding Grant Agreement, the Boston Region MPO, the City of Cambridge, and the City of Somerville
Former MassDOT Secretary Richard Davey approved construction of the permitted Russia Wharf Ferry Terminal in South Boston and a $460,000 ferry-service startup subsidy in October 2012. The 2005 facility plans and specifications were revised to meet the latest MassDOT Highway Division standards. The bid package was issued in the fall of 2013. A contractor was selected and the notice to proceed was issued in April 2014. Pre-construction activities progressed, but contractual issues associated with the project design led MassDOT to decide to rebid the contract.
There is no regularly scheduled passenger water transportation service in this area, nor are there any plans to provide such a service. The City of Boston, however, is undertaking design and engineering work to address the Old Northern Avenue Bridge and will consider ferry vessel clearance. The City received a grant in 2012 to purchase two ferry vessels for use in Boston’s inner harbor, and these vessels could serve the Russia Wharf Ferry Terminal. The Massachusetts Convention Center Authority (MCCA) is working with the City of Boston, MassDOT, and other agencies to develop a business plan for potential ferry service from Lovejoy Wharf to the South Boston waterfront, as recommended in the 2015 South Boston Waterfront Sustainable Transportation Plan. This business plan will include current and future demand projections for ferry ridership, the number and size of ferries needed to satisfy the demand, and the cost for this service. Once the business plan is completed, the MCCA could take over the City of Boston’s grant to help with future costs.
Funding Source: The Commonwealth
Transportation conformity requirements in 40 CFR § 93.108 state that TIPs and LRTPs must be fiscally constrained so as to be consistent with the United States Department of Transportation’s metropolitan planning regulations (23 CFR part 450). The Boston Region MPO’s FFYs 2021–25 TIP is consistent with the required fiscal constraints, as demonstrated in Chapter 3.
In addition to ozone, the requirement to perform a conformity determination for CO for several cities in the Boston region has expired. On April 1, 1996, the EPA classified the cities of Boston, Cambridge, Chelsea, Everett, Malden, Medford, Quincy, Revere, and Somerville as in attainment (in compliance) for CO emissions. Subsequently, a CO maintenance plan was set up through the Massachusetts SIP to ensure that emission levels did not increase. While the maintenance plan was in effect, past TIPs and LRTPs included an air quality conformity analysis for these communities. As of April 1, 2016, however, the 20-year maintenance period for this CO maintenance area expired and transportation conformity is no longer required for this pollutant in these communities. This ruling is documented in a letter from the EPA dated May 12, 2016.
On April 22, 2002, the City of Waltham was redesignated as being in attainment for CO emissions with an EPA-approved limited-maintenance plan. In areas that have approved limited-maintenance plans, federal actions requiring conformity determinations under the EPA’s transportation conformity rule are considered to satisfy the budget test (as budgets are not treated as being constraining in these areas for the length of the initial maintenance period). Any requirements for future project-level conformity determinations for projects located within this community will continue to use a hot-spot analysis to ensure that any new transportation projects in this area do not cause or contribute to violations of the NAAQS for CO.
In summary and based on the entire process described above, the Boston Region MPO has prepared this conformity determination for the 1997 Ozone NAAQS in accordance with EPA’s and the Commonwealth of Massachusetts’ latest conformity regulations and guidance. This conformity determination process demonstrates that the FFY 2021–25 TIP meets the Clean Air Act and Transportation Conformity Rule requirements for the 1997 Ozone NAAQS, and has been prepared following all the guidelines and requirements of these rules during this period.
Therefore, the implementation of the Boston Region MPO’s FFY 2021–25 TIP is consistent with the air quality goals of, and in conformity with, the Massachusetts SIP.
To comply with federal nondiscrimination and environmental justice mandates, the Federal Highway Administration (FHWA) and the Federal Transit Administration (FTA) require that metropolitan planning organizations (MPOs) monitor how their federally funded investments, in the aggregate, may affect populations protected by those mandates. This monitoring helps ensure that these populations are not disproportionately burdened by or receive disproportionately fewer benefits from MPO investments than the population as a whole. This chapter provides the results of analyses conducted for projects programmed in the federal fiscal years (FFYs) 2021–25 Transportation Improvement Program (TIP).
The Boston Region MPO’s transportation equity (TE) goal is to ensure that all people receive comparable benefits from, and are not disproportionately burdened by, MPO investments, regardless of race, color, national origin, age, income, ability, or sex. The MPO aims to ensure that all residents fairly share in the benefits and burdens of its transportation planning investments, have opportunities to participate in the transportation planning process, and have a voice in the selection of transportation investments in their communities. The MPO’s practices to achieve this goal are shaped by various federal nondiscrimination and environmental justice laws, regulations, and directives, including Title VI of the Civil Rights Act of 1964; the Americans with Disabilities Act of 1990; Executive Order 13166—Improving Access to Services for Persons with Limited English Proficiency; and Executive Order 12898—Federal Actions to Address Environmental Justice in Minority Populations and Low-income Populations. More information on these mandates can be found in Appendix E.
The MPO systematically integrates the transportation needs and interests of specific traditionally underserved populations—which for planning purposes are identified as TE populations—into its planning process and strives to address their concerns through the selection of transportation projects and other efforts. TE populations include people who identify as minority, have limited English proficiency (LEP), are 75 years of age or older, or have a disability; or who are members of low-income or transit-dependent households. 6-1 These populations include those protected by federal laws and regulations—such as the minority population and people with disabilities—as well as those not protected by federal laws or regulations but of interest to the MPO from an equity standpoint because they have specific transportation needs (such as members of transit-dependent households). 6-2
The results of analyses reported in this section assess the impacts of Regional Target-funded projects programmed in the FFYs 2021–25 TIP, in the aggregate, on TE populations.6-3 New to this TIP are analyses based on new metrics for evaluating transportation emissions and trends for several metrics that were assessed in past TIPs.
Most of the MPO’s FFYs 2021–25 Regional Target funds have been invested in highway projects, except for funds that have been flexed to the Transit Program to support the Massachusetts Bay Transit Authority’s (MBTA) Green Line Extension project and most of the funds allocated to the MPO’s Community Connections investment program. In addition, the MPO established a new investment program, Transit Modernization, in the 2019 Long-Range Transportation Plan (LRTP), Destination 2040. This program will fund transit maintenance and modernization projects identified through coordination with the Massachusetts Department of Transportation (MassDOT), the MBTA, the MetroWest Regional Transit Authority (MWRTA), and the Cape Ann Transit Authority (CATA). While funds have been allocated in the TIP for this program, projects have not yet been identified. This is also the case for the funding allocated in the outer four years of the Community Connections Program (FFYs 2022–25).
These analyses do not reflect the impacts of other highway projects in the region that are funded by MassDOT or transit projects funded by public transit agencies, including the MBTA, MWRTA, and CATA. As a result, these analyses do not fully capture the number of people served, the shares of funding directed to TE populations, or the impacts of investments on TE populations in the region. As required by FTA Title VI guidance, the MPO completes a full analysis of all federally funded transit investments in the Boston region in a given federal fiscal year once that information is available in the following federal fiscal year. The MPO documents these analyses in its Triennial Title VI Report and Annual Title VI Report, as required.
Table 6-1 shows the total number of people or households that each TE population in the Boston region represents, as well as their share of the Boston region’s total population or households.
Table 6-1
Transportation Equity Populations in the Boston Region
| Transportation Equity Category* | Transportation Equity Population | Boston Region Total Population | Share of Total Boston Region Population |
| Minority Population | 870,459 | 3,087,796 | 28.2% |
| People with Limited English Proficiency | 308,770 | 2,915,559 | 10.6% |
| Elderly (age 75 or older) | 206,578 | 3,087,796 | 6.7% |
| People with Disabilities | 306,776 | 3,056,697 | 10.0% |
| Low-income Households | 393,192 | 1,216,550 | 32.3% |
| Transit-dependent Households | 196,460 | 1,216,550 | 16.1% |
Note: For the minority population, people with LEP, elderly population, and people with disabilities categories, the amounts in the “Transportation Equity Population” and “Boston Region Total Population” columns reflect numbers of people. For the low-income and transit-dependent household categories, the amounts in these columns reflect numbers of households.
* Footnote 2 in this chapter describes the methods MPO staff uses to tabulate transportation equity populations.
Sources: The 2010 US Census and the 2010–14 American Community Survey.
During project evaluations, the MPO identifies projects that would benefit TE populations and gives points to projects that are likely to serve those populations. A project is considered to serve people who live within one-half mile of the project’s limits. A project receives points if the share of the TE population served meets or exceeds the population's share of the region’s total population, or threshold, as shown in Table 6-1. The number of points awarded to each qualifying project is based on the total number of people or households in the TE population. Appendix A shows the scores for projects evaluated during the FFYs 2021–25 TIP development cycle.
While the TIP project criteria are designed to evaluate individual projects, the MPO also analyzes how the TE populations are served by all Regional Target-funded projects in the aggregate. Table 6-2 shows the size of the TE populations that would be served by these projects and the share of the total number of people or households that would be served by them (based on proximity to the project, as defined above). The results show that the share of each TE population that would be served by the Regional Target projects approaches or exceeds the share that each group comprises of the total population of the Boston region. This preliminary metric suggests that the MPO is likely not underserving the TE populations in the region, although this analysis does not assess impacts on TE populations.
Table 6-2
Transportation Equity Populations within
One-Half Mile of Regional Target-Funded Projects
| TE Categorya | TE Population in Project Area | Total Population in Project Area | Share of TE Population in Project Area | Share of Boston Region Total Population |
| Minority Population | 189,261 | 602,961 | 31.4% | 28.2% |
| People with Limited English Proficiency | 79,471 | 571,240 | 13.9% | 10.6% |
| Elderly (age 75 or older) | 42,590 | 602,963 | 7.1% | 6.7% |
| People with Disabilities | 56,668 | 598,214 | 9.5% | 10.0% |
| Low-income Households | 84,835 | 242,221 | 35.0% | 32.2% |
| Transit-dependent Households | 56,636 | 242,222 | 23.4% | 16.1% |
Note: For the minority population, people with LEP, elderly population, and people with disabilities categories, the numbers in the “TE Population in Project Area” and “Share of TE Population in Project Area” columns reflect numbers of people. For the low-income and transit-dependent household categories, the numbers in these columns reflect the number of households. This information does not include figures for the Transit Modernization Program, as those projects have not yet been identified, or those projects that have not yet been identified in the four outer years of the Community Connections Program.
* Footnote 2 in this chapter describes the methods MPO staff uses to tabulate TE populations.
Sources: 2010 US Census, 2010–14 American Community Survey, and the Boston Region MPO.
Figure 6-1 shows the percent of TE populations served (out of the entire population served) by Regional Target projects in the FFYs 2018–22, 2019–23, 2020–24, and 2021–25 TIPs. Since FFYs 2018–22, there has not been a significant change in numbers served for most of the TE populations. The percent of the elderly population in the project areas has increased by a couple of percentage points, while the percent of the other TE populations in the project areas have decreased slightly. In light of this trend, the MPO could consider opportunities for ensuring the Regional Target program serves a greater share of these populations. (See Section 6.3 for further discussion about the MPO’s next steps.)
Figure 6-1
Transportation Equity Populations within One-Half Mile of the Regional Target Projects in the FFYs 2018–22, 2019–23, 2020–24, and 2021–25 TIPs
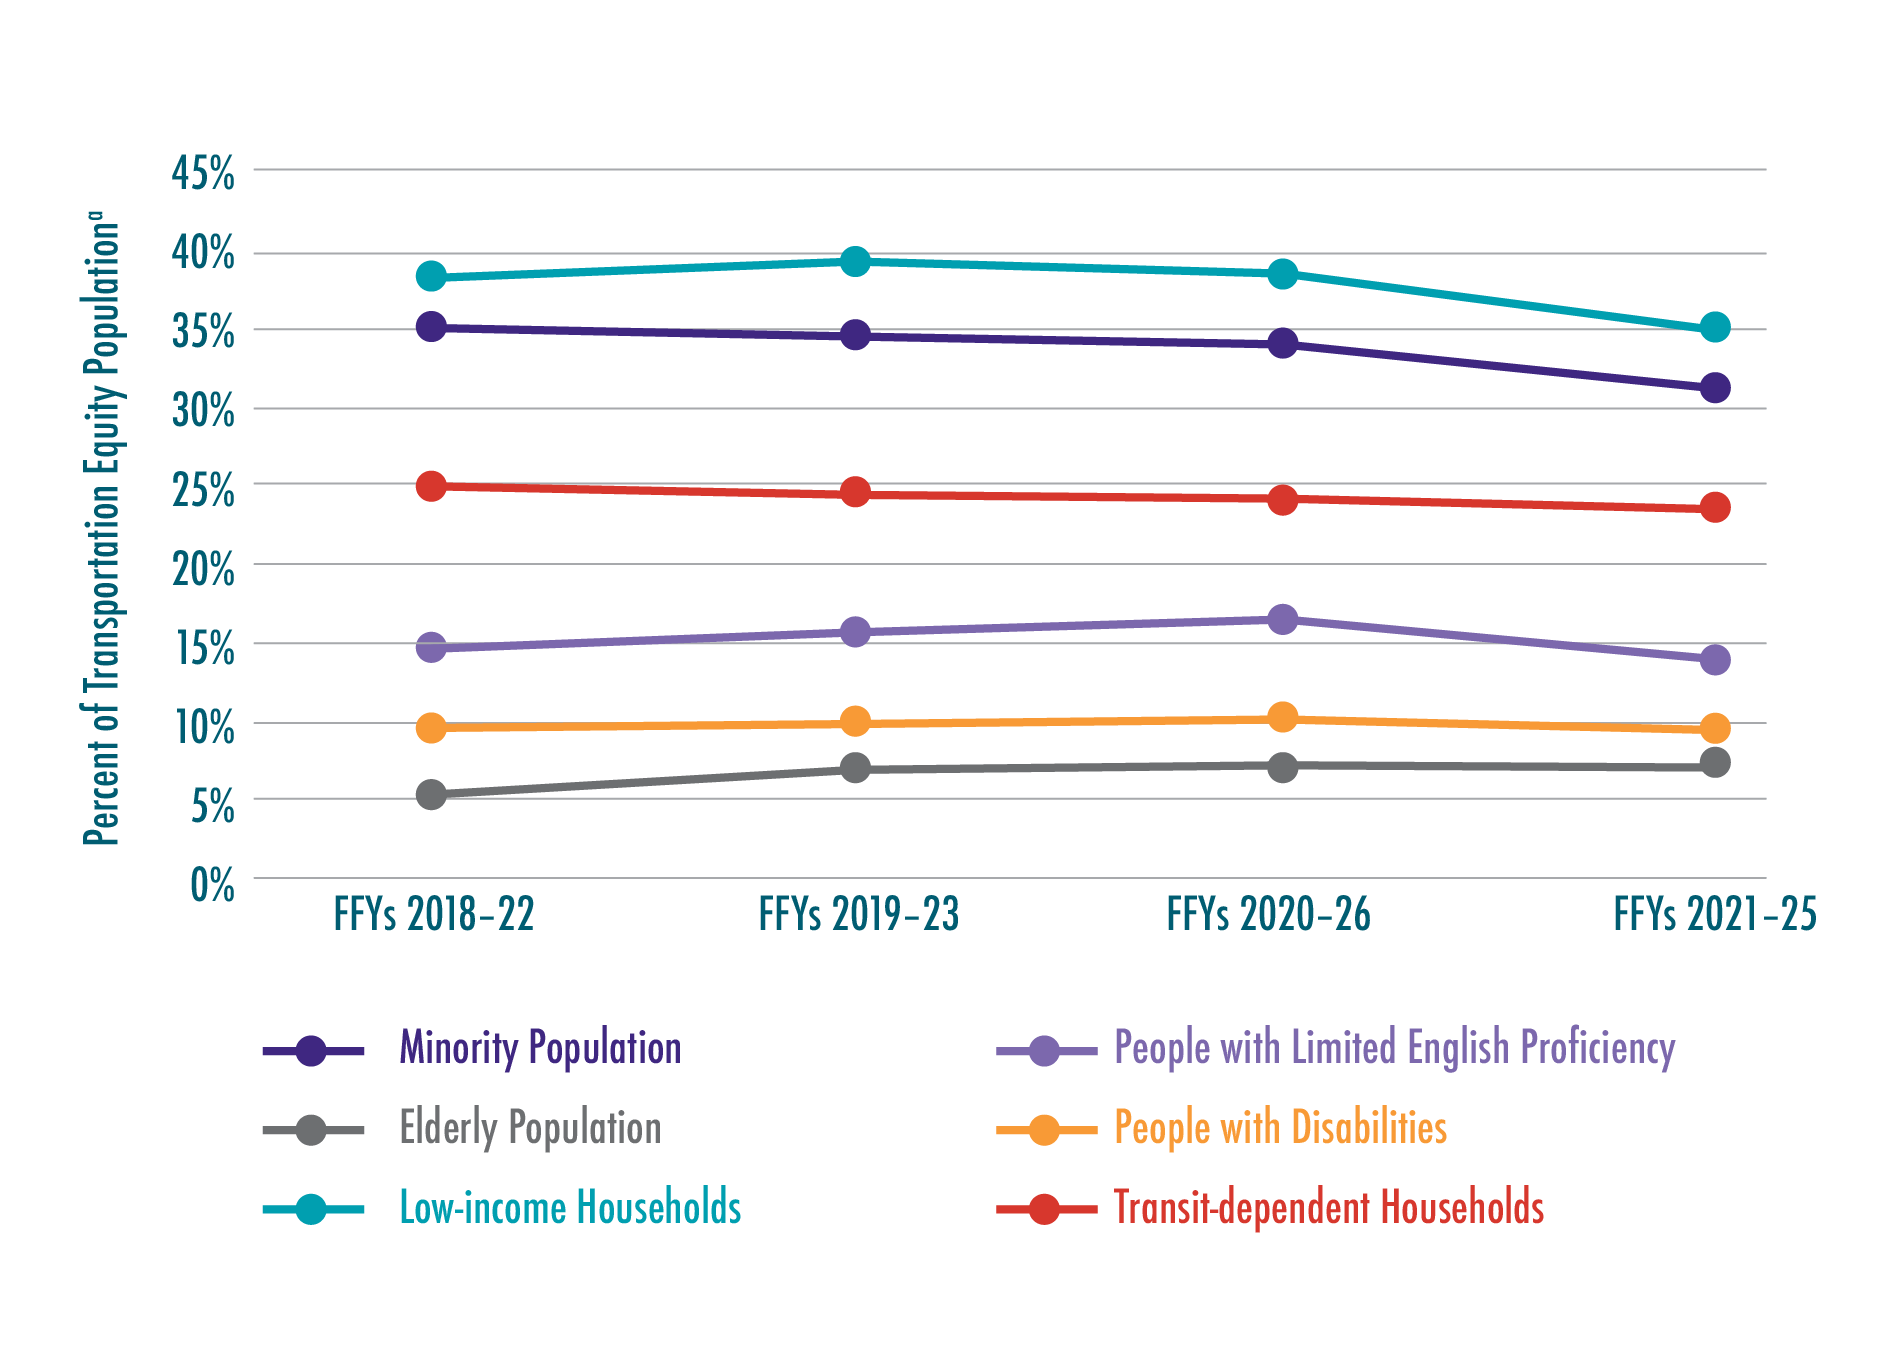
Note: For the minority population, people with LEP, elderly population, and people with disabilities categories, the numbers reflect numbers of people. For the low-income and transit-dependent household categories, the amounts reflect the number of households. This analysis examines populations located within one-half mile of Regional Target projects programmed in the FFYs 2018–22, 2019–23, 2020–24, and 2021–25 TIPs. For the FFYs 2021–25 TIP, it does not include figures for the Transit Modernization Program, as those projects have not yet been identified, or those projects that have not yet been identified in the outer years of the Community Connections Program. For information about the data for the FFYs 2018–22, 2019–23, and 2020–24 TIPs, see the respective documents. Footnote 2 in this chapter describes the methods MPO staff uses to tabulate TE populations.
Sources: 2010 U S Census, 2010–14 American Community Survey, and the Boston Region MPO.
Table 6-3 shows the number of households or people in each TE population served by the projects funded with Regional Target dollars for each MPO investment program. The share of people or households served varies across investment programs. The share of people or households served by the Complete Streets investment program exceeds the regional share for every TE population. The Bicycle Network and Pedestrian Connections Program does not serve the region’s minority population, people with LEP, and transit dependent households as well, but it serves a higher share of the elderly population and people with disabilities than the regional averages. The same is the case for the Intersection Improvements Program except that the percent of people with disabilities served is below the regional average. The Major Infrastructure Program serves all TE populations well except the elderly population. Finally, the Community Connections Program serves the same share of the elderly population as the regional average but a lower share for all of the other TE populations.
As noted in the table, the number of projects within each MPO investment program varies. The number of projects in an investment program affects the extent to which the overall program is able to serve TE populations. For example, there are only five projects each in the Bicycle Network and Pedestrian Connections Program and the Major Infrastructure Program, which is in part due to the number of projects in these investment categories that municipalities and other entities submitted to the MPO for funding.
Table 6-3
Transportation Equity Populations Served by Regional Target Projects, by Investment Program
| MPO Investment Program | Number of Projects | Minority Population | People with Limited English Proficiency | Elderly (age 75 or older) Population | People with Disabilities | Low-income Households | Transit-dependent Households | ||||||
| Population | Share | Population | Share | Population | Share | Population | Share | Population | Share | Population | Share | ||
| Bicycle Network and Pedestrian Connections | 5 | 2,803 | 11.1% | 1,029 | 4.3% | 3,168 | 12.6% | 3,065 | 12.3% | 3,418 | 31.5% | 932 | 8.6% |
| Complete Streets | 24 | 102,601 | 37.9% | 45,621 | 17.9% | 20,667 | 7.6% | 28,913 | 10.8% | 46,216 | 43.6% | 28,255 | 26.6% |
| Intersection Improvements | 9 | 2,357 | 14.7% | 686 | 4.5% | 1895 | 11.8% | 1,453 | 9.4% | 1,826 | 28.0% | 457 | 7.0% |
| Major Infrastructure* | 4 | 44,573 | 33.6% | 21,393 | 17.0% | 6,249 | 4.7% | 12,090 | 9.2% | 19,856 | 33.8% | 19,013 | 32.3% |
| Community Connections | 5 | 36,927 | 23.3% | 10,742 | 7.1% | 10,611 | 6.7% | 11,147 | 7.1% | 13,519 | 22.5% | 7,979 | 13.3% |
| Total | 47 | 189,261 | 31.4% | 79,471 | 13.9% | 42,590 | 7.1% | 56,668 | 9.5% | 84,835 | 35.0% | 56,636 | 23.4% |
| Regionwide Average+ | 28.2% | 10.6% | 6.7% | 10.0% | 32.3% | 16.1% | |||||||
Note: For the minority population, people with LEP, elderly population, and people with disabilities, the numbers in the “Population” columns for each transportation equity population reflect numbers of people. For low-income and transit-dependent households the numbers in these columns reflect the number of households. This analysis examined populations located within one-half mile of Regional Target-funded projects in the FFYs 2021–25 TIP. It does not include figures for the Transit Modernization Program, as those projects have not yet been identified, or those projects that have not yet been identified in the outer years of the Community Connections Program.
*These figures include federal highway improvement dollars flexed to transit to support the Green Line Extension.
+ Footnote 2 in this chapter describes the methods MPO staff uses to tabulate transportation equity populations.
Sources: 2010 U S Census; 2010–14 American Community Survey; Boston Region MPO.
Table 6-4 shows projected emission reductions of carbon monoxide, volatile organic compounds, and nitrogen oxides that would result from the implementation of Regional Target-funded projects for TE populations and their respective general populations. Reductions are reported in kilograms per person or household and are aggregate figures. The reductions benefiting the elderly population and the low-income and transit-dependent households are greater than their respective general populations. This indicates that those TE populations are projected to receive a proportionate share of the emission reduction benefits. The minority population, people with LEP, and people with disabilities are projected to experience less emission reduction benefits per person than their respective general populations. This indicates that they would benefit disproportionately less from the implementation of Regional Target-funded projects. This is the first year that the MPO has conducted this analysis; in future TIPs the analysis will include an examination of the change in emission reductions over time in order to develop a more complete picture of the air quality impacts of the MPO’s Regional Target program. Because some TE populations receive less reduction in CO emissions than their respective general populations, additional work will be done to investigate strategies for addressing these impacts.
Table 6-4
Reduction in Carbon Monoxide, Volatile Organic Compounds, and Nitrogen Oxide Emissions per 1,000 People or Households
| Population Categories* | Emissions Reduction per 1,000 People or Households (kilograms) |
| Minority Population | -22.8 |
| Nonminority Population | -28.5 |
| People with Limited English Proficiency | -18.0 |
| People Fluent in English | -29.7 |
| Elderly Population (age 75 or older) | -36.0 |
| People under the age of 75 | -26.0 |
| People with Disabilities | -25.5 |
| People without Disabilities | -27.1 |
| Low-income Households | -68.6 |
| Non-low-income Households | -65.9 |
| Transit-dependent Households | -76.6 |
| Non-transit-dependent Households | -64.1 |
Note: This analysis examines populations located within one-half mile of Regional Target-funded projects in the FFYs 2021–25 TIP. It does not include the following projects or investment programs:
* Footnote 2 in this chapter describes the methods MPO staff uses to tabulate transportation equity populations.
Source: Boston Region MPO’s Congestion Mitigation and Air Quality (CMAQ) analyses.
The results of the analyses reported in this section show how Regional Target funds were distributed to TE populations based on the share of those populations served by the set of Regional Target projects in the aggregate. (The population expected to be served are those that live within one-half mile of the projects.)
The MPO has programmed approximately $537 million in Regional Target funding in the FFYs 2021–25 TIP. Table 6-5 shows how this funding is allocated to TE populations and their respective general populations. Some TE populations would receive less funding when compared to general populations, including the minority population, people with LEP, and low-income and transit-dependent households. The elderly population and people with disabilities would receive more funding than their respective general populations. These differences do not necessarily indicate differences in service or access to these transportation improvements. Further analysis would be necessary to identify specific benefits and burdens that may result from the Regional Target program.
Table 6-5
Funding Per Person or Household for Transportation Equity Populations
| Population Categories* | Funding Per Capita or Household |
| Minority Population | $695 |
| Nonminority Population | $981 |
| People with Limited English Proficiency | $770 |
| People Fluent in English | $968 |
| Elderly Population (age 75 or older) | $955 |
| People under the age of 75 | $887 |
| People with Disabilities | $911 |
| People without Disabilities | $894 |
| Low-income Households | $2,033 |
| Non-low-income Households | $2,319 |
| Transit-dependent Households | $1,872 |
| Non-transit-dependent Households | $2,325 |
Note: For the minority population, people with LEP, elderly population, and people with disabilities, and their respective general populations, the numbers in the “Funding Per Capita or Household” column reflect funding per person. For the low-income and transit-dependent household categories, the numbers in this column reflect the funding per household. This analysis examines populations located within one-half mile of Regional Target projects in the FFYs 2021–25 TIP. Because individual projects have not been identified under the Transit Modernization Program and for the outer four years of the Community Connections Program, the funding for these programs has been assigned to the entire population in the Boston region.
* Footnote 2 in this chapter describes the methods MPO staff uses to tabulate TE populations.
Sources: 2010 U S Census; 2010–14 American Community Survey; Boston Region MPO.
Figure 6-2 shows the data in Table 6-5 for the FFYs 2019–23, 2020–24, and 2021–25 TIPs. It shows the per capita or per household funding for TE populations as a percent of the funding for their respective general populations. (For example, a result of 90 percent would indicate that for every $100 that goes toward investments that serve the general population, $90 would go toward investments that serve the TE population. This calculation is based on the share of the population living within a half-mile of each project, assuming that that population would be served by the project.) Between the FFYs 2019–23 and 2021–25 TIPs, this percentage has increased for all of the TE populations. In the FFYs 2021–25 TIP, the funding for the elderly population and people with disabilities exceeds 100 percent. This indicates that these two populations would receive more funding per capita than their respective general populations. With regards to the distribution of MPO Regional Target funds overall, TE populations have been receiving more funding over the past three years, though four out of the six TE populations will receive disproportionately less funding. The MPO could consider increasing funding for projects that serve these TE populations in order to provide a more proportionate distribution of funding.
Figure 6-2
Proportion of Funding Per Capita Allocated to Projects Serving Transportation Equity Populations: FFYs 2019–23, 2020–24, and 2021–25 TIPs
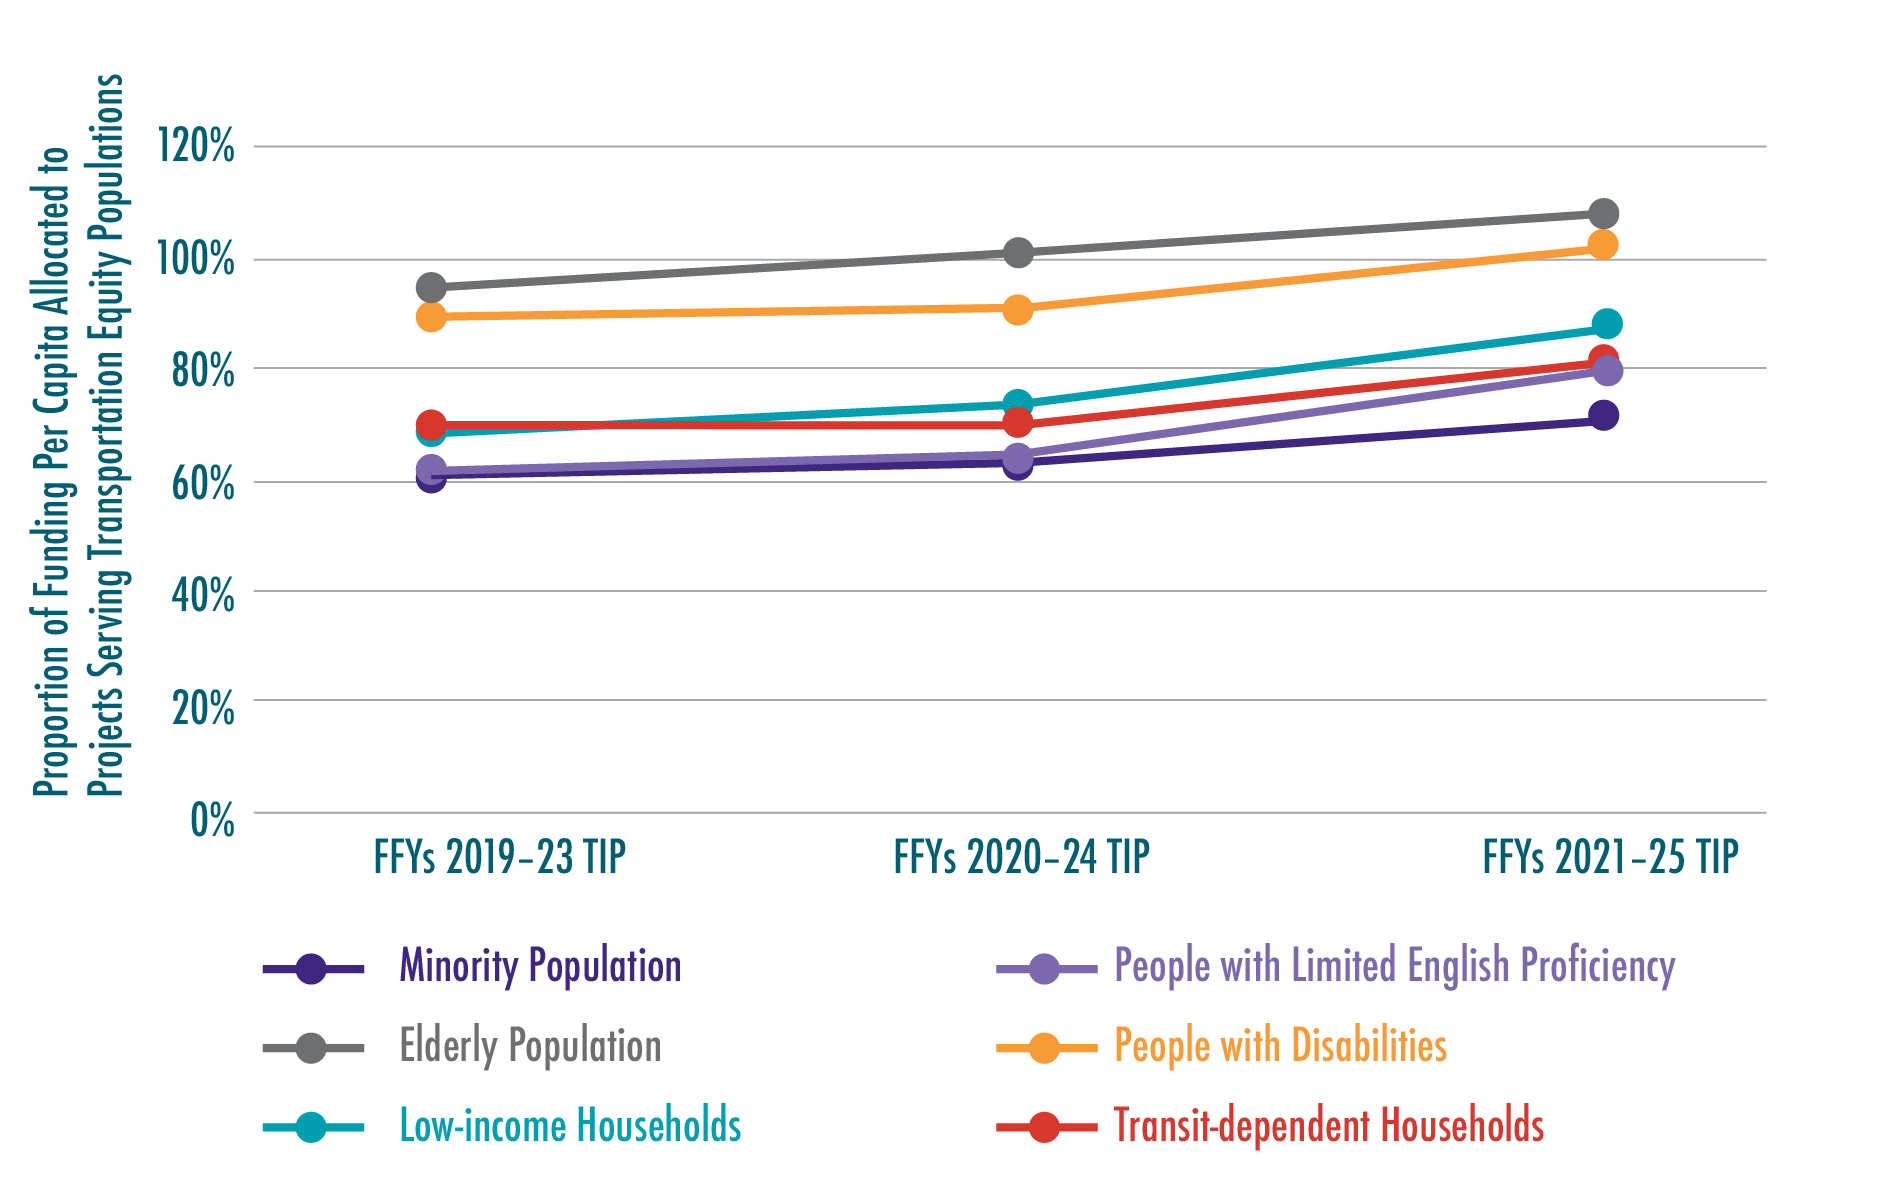
Note: This analysis examined populations located within one-half mile of Regional Target projects in the FFYs 2019–23, 2020–24, 2021–25 TIPs. For the FFYs 2021–25 TIP, because individual projects have not been identified under the Transit Modernization Program and the outer four years of the Community Connections Program, the funding for these programs has been assigned to the entire population in the Boston region. For information about the data for the FFYs 2019–23 and 2020–24 TIPs, see the respective documents.
a Footnote 2 in this chapter describes the methods MPO staff uses to tabulate TE populations.
Sources: 2010 U S Census; 2010–14 American Community Survey; Boston Region MPO.
The analyses discussed in this chapter are basic approaches to understanding whether TE populations might benefit from projects programmed in the TIP, based on the assumption that projects provide benefits to the people who live nearby the improvements. This is not always the case, however. Recognizing these limitations, the MPO introduced a new air quality analysis that attempts to assess projected air quality impacts to TE populations that are likely to result from the MPO’s Regional Target projects. The MPO will continue to build on this approach in future TIPs. In addition, MPO staff is revising the equity-related TIP project selection criteria to allow for better identification of the potential benefits and burdens each project may confer. These criteria will be applied in the FFYs 2022–26 TIP.
The MPO will also continue to explore more sophisticated methods of identifying the specific benefits and burdens of the entire Regional Target program on TE populations. MPO staff has developed a similar analysis for the MPO’s LRTP; continued refinement of the analysis will be ongoing in FFY 2020. Staff has also developed a draft Disparate Impact and Disproportionate Burden Policy that allows the MPO to identify potential future disparate impacts and disproportionate burdens that may result from the LRTP program of projects on minority populations and low-income populations. This work will inform the development of the MPO’s benefits and burdens analysis for the TIP. MPO staff hopes to link the TIP benefits and burdens analysis with the LRTP’s analysis and the new equity-related TIP project selection criteria in order to achieve a better understanding of whether the MPO’s project selection process is enabling the MPO to meet its equity goals. Staff anticipates continuing to track the results of these analyses over time and enhancing them each year.
6-1 People who identify as minorities are those who identify as Hispanic or Latino/a/x and/or a race other than “white.”
6-2 MPO staff identifies transportation equity populations using US Census and American Community Survey (ACS) data. Staff tabulates LEP status for the population age five and older, and tabulates disability status for the noninstitutionalized population. The low-income threshold for the Boston region that was in place during the development of the FFYs 2021–25 TIP was set using the region’s median household income, which is $75,654 according to the 2010–14 ACS data. The Boston region’s low-income threshold is 60 percent of this value, which is $45,392. (When the TIP project selection criteria revisions are complete in FFY 2020, this threshold will be revised to 200 percent of the poverty level based on family size.)
6-3 Regional Target funds are those funds provided to MPOs that may be programmed for projects at the discretion of each MPO. The Boston Region MPO typically has about $100 million each year in Regional Target funds.