Chapter 2—Land Use in the Boston Region MPO Area
The Boston Region MPO area is a mature area, with a dense urban core where the majority of jobs and population are located. This region is composed of 101 cities and towns, each with their own land-use regulatory authority. 1 These municipalities are connected with a diverse network of local roads, highways, rail lines, bus routes, and rapid transit services.
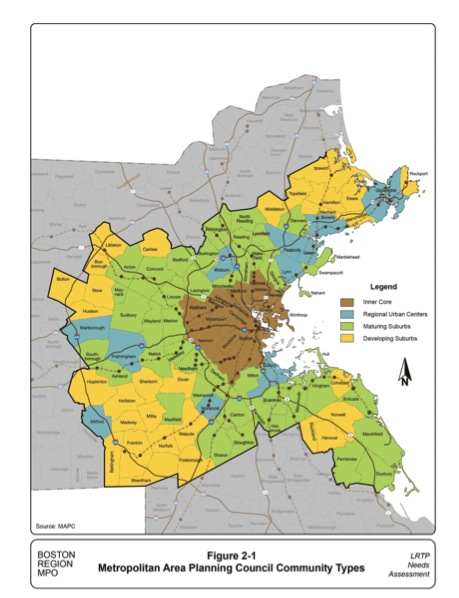
In order to understand how regional trends will affect the region’s diverse communities over the coming decades, the Metropolitan Area Planning Council (MAPC) has identified four basic community types (shown in Figure 2-1)—the Inner Core, Regional Urban Centers, Maturing Suburbs, and Developing Suburbs. While each city and town is unique, communities within each community type share important characteristics that will influence their development in coming decades. The criteria used to define community types include land use and housing patterns, recent growth trends, and projected development patterns.
The Inner Core consists of the high-density cities of Boston, Cambridge, Somerville, Revere, Everett, and Chelsea, as well as more residential “streetcar suburbs,” such as Arlington and Brookline. The Inner Core is essentially “built out,” with little vacant developable land. Virtually all recent development has occurred through infill and reuse of previously developed land. Multifamily housing is a significant component of the housing stock, as are rental and subsidized housing. Most employment is concentrated in downtown Boston and portions of Cambridge. There are 16 cities and towns in the Inner Core (within Route 128) that are classified as streetcar suburbs, which are built around village-scale commercial districts.
This group includes urban centers that are located outside of the Inner Core. These communities are characterized by an urban-scale downtown core with multiple blocks of multistory, mixed-use buildings; moderately dense residential neighborhoods surrounding this core; and (in some cases) lower-density, single-family residential development surrounding the moderately dense neighborhoods. Some of these communities are “built out,” while others still have vacant developable land around their peripheries. Rental housing and multifamily structures compose a significant component of the housing stock. Many of these communities have growing immigrant populations, such as Framingham and Lynn. Twenty-one regional urban centers are located mostly outside of Route 128.
These municipalities are moderate-density residential communities that have a dwindling supply of vacant developable land. Less than 25 percent of their land is still developable. Less than 20 percent of their land area is devoted to commercial and industrial uses, although some of these towns are significant job centers. More than half of their housing units are owner-occupied single-family homes.
There are 50 towns classified as maturing suburbs, most of them located along Route 128.
These are less-developed towns that have large expanses of vacant developable land. Some of these towns have a locally significant stock of rental units in larger complexes and in modestly sized multifamily structures. Many of these towns have a well-defined, mixed-use town center. Others have town centers with historical and civic significance but no commercial or neighborhood function. The extent of economic development varies, but generally is quite limited. There are 77 towns classified as developing suburbs, most of them located along I-495 and on the North and South Shores. Some have strong town centers and moderate-density neighborhoods, while others are more rural.
Many cities and towns in the developing suburbs are planning ahead by identifying and prioritizing areas for growth and preservation. Priority Development Areas (PDAs) have features that include:
Priority Preservation Areas’ (PPA) features include:
Transit-oriented development has been a large part of Boston’s growth since the days of the earliest horse-drawn railways. In fact, we live in a uniquely transit-oriented region, where 25 percent of housing units and 37 percent of employment are within a half mile of a rapid transit or commuter rail station. The Metro Boston area is experiencing a new wave of growth near transit service, with hundreds of residential and commercial developments under way and more on the horizon. Cities and towns are creating plans for developing areas near transit stations, and are updating their zoning to unlock development potential. The MBTA is accepting proposals for major developments on prime MBTA-owned parcels; state agencies are using transit proximity as a criterion for prioritizing infrastructure or housing resources; and the development community is finding a strong market for residential and commercial space near MBTA stations and stops.
The Boston Region MPO area has long been home to a changing population, economy, and landscape, and the coming decades will be no exception. The forces of an aging population, growing diversity, economic restructuring and changing household preferences will intersect to create a region in 2040 that is markedly different from the one that exists today. The outcomes of certain key questions will determine those differences:
It is possible to plan for these outcomes by using the MPO’s regional travel demand model. The model can help us anticipate a range of feasible outcomes and assess what different scenarios might mean for housing demand, economic growth, school enrollment, and land use. Moreover, it is possible to influence the future through choices made at the local, regional, and state levels.
Since the future cannot be predicted, identifying a range of possible future scenarios may prove more useful than a single forecast. Each scenario will reallocate growth based on the transportation investments being examined, assuming that land-use policies do not change. Furthermore, the Boston Region MPO and MAPC recently adopted an integrated land-use transportation model that enables the MPO to assess how its investment decisions can help shape the region’s land use. When the land-use model is linked to the travel demand model, we can predict real estate development and allocate total regional jobs by industry and households by type throughout the region based on changes to transportation accessibility and land-use policies. Here, “accessibility” refers to the ability to reach desired goods, services, activities, and other destinations. Land-use policies consist of zoning requirements, water or sewer limitations, and environmental restrictions. This model can demonstrate how increased transportation capacity may relocate growth, and how transportation congestion or unreliability may deter growth. Each detailed land-use scenario described in this report reflects a set of assumptions about the region’s future transportation network.
Except as otherwise noted, all of the land-use scenarios use the same assumptions about the region’s total population, household, and employment growth over the coming decades. Regional control totals (the upper limit of population and employment) for Metro Boston were developed by MAPC in 2014, following its multiyear collaboration with the Massachusetts Department of Transportation (MassDOT), the Executive Office of Housing and Economic Development (EOHED), the Central Transportation Planning Staff (CTPS), the University of Massachusetts Donahue Institute, neighboring regional planning agencies, and numerous experts and stakeholders. That process examined two distinct growth scenarios in Metro Boston: The “Status Quo” scenario assumes a continuation of existing rates of births, deaths, migration, and housing occupancy. The “Stronger Region” scenario explores how changing trends could result in higher population growth, greater housing demand, a substantially larger workforce, and more robust employment growth.
Which land-use scenario that is more likely to occur depends upon future decisions. Individual households will make their own choices about where to live, but they will do so in a context influenced by public-sector actions and investments. Policies for promoting housing construction will facilitate higher in-migration rates, which characterize the Stronger Region scenario. Conversely, continued widespread opposition to new housing likely will result in less production and higher costs, thereby maintaining the Status Quo prototype. In other words, decisions made by the region’s cities and towns help determine how the future unfolds. If those communities were to plan for a shared vision of the future, they could make it more possible for that vision to be achieved.
Of the two land-use scenarios, Stronger Region is more consistent with the housing, land-use, and workforce development goals of MAPC’s MetroFuture, the MPO region’s land-use plan, which already has been adopted by the EOHED as the basis for the Commonwealth’s multifamily housing production goal. As a result, Stronger Region is the MPO’s recommended scenario for regional transportation planning, and serves as the basis for all of the land-use scenarios unless otherwise noted.
Despite the differences among various scenarios, they all reflect large-scale, long-term land-use trends in the region. The aging population, growing diversity, a restructured economy, and changing household preference (household size and location) determine the broad outlines of the region’s changes over the coming decades. The following sections describe these trends.
Slow growth is in store if the region’s population keeps declining.
The Status Quo scenario projects that the region’s population will grow an average of 2.1 percent in each of the next three decades, one-third more slowly during the last decade. The loss of population to other states is a major contributor to slow growth. Historically, more people move out of the Metro Boston region to other states or to other parts of Massachusetts than the reverse; we estimate that this “net domestic out-migration” averaged about 10,000 people per year between 2000 and 2010. Births and international immigration were sufficient to keep the state growing during that same period, but both factors likely would diminish in coming years.
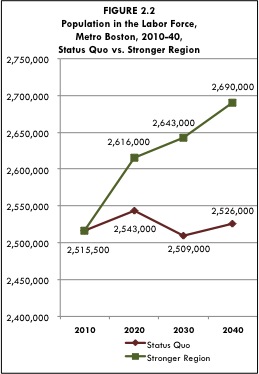
Over the coming decades, the “baby boomers” born between 1945 and 1964 will be reaching retirement age, depleting the supply of our region’s most critical asset: a skilled, well-educated workforce. By 2030, nearly one million workers now older than 40 years—or currently, 39 percent of all workers in the region—will have left the labor force. The current population of young adults is barely sufficient to fill the positions vacated by retiring baby boomers, much less provide the workforce needed for robust economic growth. If the region stems the loss of population to other states and achieves a small net inflow, as the Stronger Region Scenario anticipates, the labor force could grow by 175,000 over the next 30 years, an increase of almost 7 percent, as shown in Figure 2.2. 2
New housing demand will outpace population growth because of declining household size.
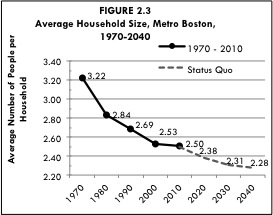
Despite relatively slow population growth under the Status Quo scenario, the region will see substantial demand for new housing units. With more single-person households (especially seniors), more divorced households, and fewer children per family, the average household size likely would decline by 10 percent by 2040 under either of the land-use scenarios, as shown in Figure 2.3. In other words, a given number of people will form 10 percent more households and require 10 percent more housing units than today. Under either scenario, declining household size alone will result in approximately 86,000 additional households over the next 10 years, which accounts for more than two-thirds of Status Quo housing demand over that same period. This phenomenon will cause a number of suburban communities to experience population declines even as new housing units are constructed.
A “senior sell-off” may provide most of the single-family homes needed by younger families.
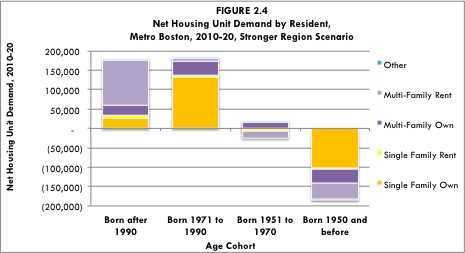
While the aging of the baby-boomer generation will cause the number of seniors in the region to swell considerably, over time the same generation will need fewer homes—especially single-family homes—than it does today as its members downsize, move elsewhere, or die. The Stronger Region scenario anticipates that all Eastern Massachusetts residents born before 1971 will put 112,000 single-family homes back on the market by 2020, enough to supply about 66 percent of the demand from younger residents. For householders born between 1951 and 1970, there will be a small net demand for condominiums in the next decade, but that will free up even more single-family homes in subsequent decades. Meanwhile, the younger-than 40-year-old households critical to growing the labor force overwhelmingly prefer apartments and condominiums, but far fewer of these units will be freed up by older residents. These patterns will continue into the future, and as a result, nearly two-thirds of housing demand would be for multifamily housing in the Stronger Region scenario, as shown in Figure 2.4.
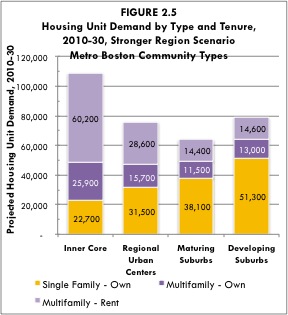
Current trends show that many urban municipalities—both the Inner Core and outlying regional urban centers—experience a large influx of young people but lose them to suburban communities as those residents form families. However, these trends are changing. When compared to the 1990s, in the last 10 years, more young people have been moving to urban communities and fewer of them have moved out once they turn 30. An increasingly diverse population attracted by the job proximity, transit access, vibrancy, and cultural assets of urban areas likely will drive continued population growth. Urban communities are projected to attract 52 percent (Status Quo) to 56 percent (Stronger Region) of new housing production, as shown in Figure 2.5. This same chart also indicates that multifamily housing will be needed across the region, including a 25-to-35 percent increase in housing production in suburban communities.
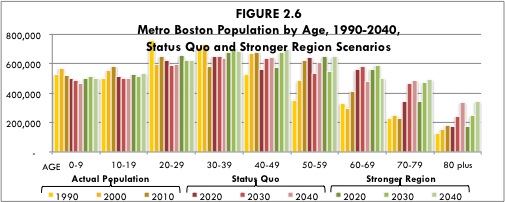
As shown in Figure 2.6, the region’s school-age population peaked in 2000, when the baby boomers were in their prime child-rearing years (age 30 to 55). Now, there are fewer adults in that age range so the number of births (and subsequent school-age children) has begun to decline. The population aged 5 to 14 is now 6 percent smaller than it was at the 2000 peak, and it is projected to fall another 8 to 9 percent by 2020 and decline more slowly thereafter under the Status Quo scenario. If the region attracts and retains more young adults under the Stronger Region scenario, the school-age population may rebound slightly, but will remain 6 percent smaller in 2040 than it was in 2010.
Over the next three decades, the region’s economy likely will be characterized by continued economic restructuring and constrained growth.
Forecasts based on national economic projections predict rapid growth for the MPO region and the state, but the lack of workers likely would be a major drag on growth. National projections prepared by the US Bureau of Labor Statistics suggest that Massachusetts jobs could increase from 8 to 17 percent between 2010 and 2020. However, a massive wave of baby-boomer retirement, combined with net out-migration to other states, will make it difficult, if not impossible, to provide enough labor to fill all of the jobs. In fact, even the Stronger Region scenario projects labor force growth of just 7 percent over a 30-year period. A statewide analysis indicates that the problem may be worse for other regions of Massachusetts than for Metro Boston, where the labor force may decline substantially over the coming decades. After accounting for a return to normal unemployment rates by 2020 and for reduced in-migration from other Massachusetts regions experiencing labor-force declines, MAPC projects that jobs in the Metro Boston region may increase to 184,000 from 2010 to 2040, an increase of 8 percent.
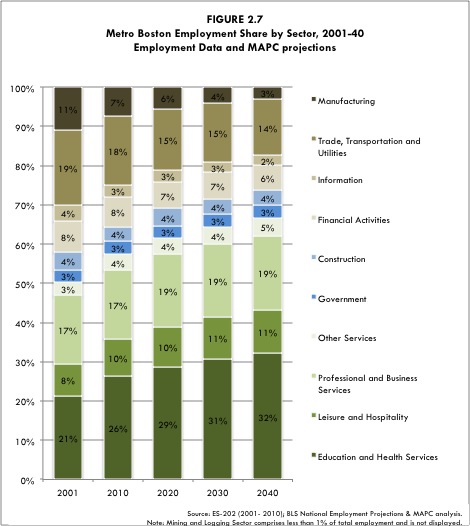
Given the relatively slow pace of overall job growth in the coming decades, the growth and decline of certain sectors may have more impact on the region’s economy than the absolute change in the number of jobs. Based on historical trends and national projections by sector, MAPC forecasts that certain sectors probably would grow rapidly while others would experience continued declines. Specifically, the education and health sector likely would grow by 33 percent in Metro Boston, gaining almost 200,000 jobs and expanding to compose nearly one-third of the region’s jobs by 2040. Professional and business services and the leisure and hospitality sectors also probably would grow at above-average rates, together gaining 120,000 jobs. Meanwhile, the share of jobs in financial activities and information is expected to decrease slightly, while manufacturing and the trade, transportation, and utilities sector are projected to decline substantially and compose a substantially smaller share of the state’s employment in 2040. This reflects long-term trends in production and commerce, with more overseas manufacturing, more online purchasing, and fewer labor-intensive retail operations.
1 Throughout this chapter, the term “Boston Region MPO area” refers to the 101 municipalities in the Boston Region MPO area, and the term “Metro Boston” refers to the 164 municipalities in the Boston Region MPO’s travel demand model set.
2 Unless otherwise stated, all of the information in each figure was produced by MAPC and/or the University of Massachusetts Donahue Institute.