Chapter 1—Introduction
The Boston Region Metropolitan Planning Organization (MPO) develops a new long-range transportation plan (LRTP) every four years, as mandated by federal requirements and reaffirmed in the most recent federal transportation reauthorization legislation, Moving Ahead for Progress in the 21st Century (MAP-21). The MPO developed a new LRTP, Charting Progress to 2040 which was adopted in July 2015. The LRTP establishes a vision for the Boston region’s future transportation system, establishes goals and objectives to achieve the vision, and identifies transportation projects and programs that support the visions and goals.
The MPO’s Needs Assessment—a database of existing transportation, population and employment conditions, and analysis and projections of future conditions that indicate prospective transportation demand—is a critical tool for planning the region’s future. This Needs Assessment includes information about various components of the transportation system, their existing condition, how they are used, and their projected future use.
As part of developing Charting Progress to 2040, the MPO integrated performance-based planning and programming (PBPP) into its practices (required by MAP-21) in order to achieve and document progress toward the MPO’s goals. PBPP refers to transportation agencies’ application of performance management in their planning and programming processes to achieve desired outcomes for the multimodal transportation system.
For MPOs, PBPP is a comprehensive planning practice that reflects the MPO’s continuing, cooperative, and comprehensive (3C) metropolitan transportation planning process. It involves undertaking a range of activities and producing a variety of products in coordination and consultation with all applicable agencies, organizations and stakeholders, including the public. The PBPP is fully integrated into the MPO’s 3C process, which includes developing:
The MPO is developing performance measures—metrics used to monitor and report on a transportation characteristic—particularly to assess progress toward MPO goals. Through its PBPP practice, the MPO is working to base its transportation investment decisions—both long-term planning and short-term programming—on their ability to meet the MPO’s established goals.
A critical first step in developing the long-range transportation plan and the MPO’s PBPP practiceis to gather, organize, and analyze available sources of data about the existing transportation system. This is a vital component of the LRTP because the region’s transportation system must be inventoried before decisions can be made about how to address problems within the constraints of future funding. This process allows the MPO to understand the many needs that must be addressed for all transportation modes regarding population and employment in the region.
The Needs Assessment guided the MPO’s decision making about how to address the region’s needs through the LRTP, and will guide future decision making about which projects to fund in the TIP, and which studies to conduct through the UPWP.
Clearly, the region has extensive needs for maintaining and modernizing all modes of its transportation system. Authorities estimate that the cost of meeting all identified needs will exceed anticipated financial resources between now and 2040. Therefore, it is important to prioritize the region’s needs in order to guide investment decisions.
The information included in the Needs Assessment will be used to establish a baseline for the MPO’s performance measurement process, then to track it over time to determine if the transportation system it is moving toward its goals and objectives.
Unlike the Needs Assessment for the previous LRTP, Paths to a Sustainable Region, the updated Needs Assessment developed for the new LRTP, Charting Progress to 2040, is a Web-based document—that is, embedded in the textual components, are links to other detailed MPO information, which is displayed in tabular and map formats. This embedded information is not present in a printed document. Instead, the viewer may access it online and/or download it. Any interested party may use this information to understand the region’s transportation conditions and needs, or to help with their own transportation planning. Displaying information in this way makes the Needs Assessment a true regional data resource.
Below is a description of the content in the Needs Assessment document:
The Needs Assessment organizes the identified needs according to the MPO’s goal themes, which are derived from the Boston Region MPO’s vision for the region’s transportation future. The vision states:
The Boston Region Metropolitan Planning Organization envisions a modern transportation system that is safe, uses new technologies, provides equitable access, excellent mobility, and varied transportation options—in support of a sustainable, healthy, livable, and economically vibrant region.
The MPO’s goal themes are:
Concerns for each travel mode—highway, transit, freight, bicycle, and pedestrian—are identified within each goal, as applicable.
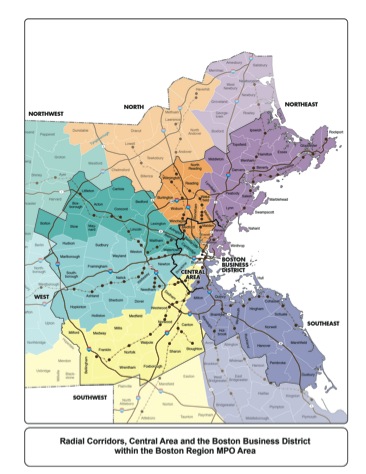
The Boston Region MPO encompasses 101 municipalities from Ipswich to Duxbury and Boston to Marlborough. For transportation planning purposes, the MPO maintains a travel demand model, which includes the 101 municipalities plus an additional 63 municipalities around the MPO—164 municipalities in total. While the Needs Assessment addresses only the needs of the municipalities in the Boston Region MPO, it does take into consideration conditions and travel activity in other portions of the region. For the purposes of the Needs Assessment, the 164 municipalities were divided into six radial corridors as shown in Figure 1.1. The map also may be found at (ftp://ctps.org/pub/LRTP/MPO-RadialCorr-CA-BBD.pdf). The municipalities in the Boston Region are shown in the darker colors, while municipalities within the model area but outside of the MPO are shown in the lighter shade of that color. A list of the municipalities in the Boston Region MPO along with the associated radial corridor may be found at http://www.ctps.org/datacatalog_share/content/municipality-corridor-table-long-range-transportation-plan.
FIGURE 1.1
Radial Corridors, the Central Area, and the Boston Business District
within the Boston Region MPO Area
The six radial corridors were established around major highway and rail facilities with an orientation into and out of the Boston business district. The corridors, and some of the major facilities around which they were established, are listed as follows.
Radial
Central Area
The Central Area includes the City of Boston (excluding the neighborhoods of Hyde Park, Roslindale, West Roxbury, and Mattapan), Brookline, Cambridge, Somerville, Medford, Malden, Everett, Revere, Chelsea, and Winthrop. This area is the hub of the radial corridors and the central and major activity center of the region. The Central Area was delineated based on proximity to the Boston Business District and the ratio of employment to population (greater than or equal to 1:1). The Boston neighborhoods of Hyde Park, Roslindale, West Roxbury, and Mattapan are farther from the Boston Business District and have a lower employment-to-population ratio than the other Boston neighborhoods. In addition to being a major destination and origin for radial travel in the region, the Central Area has important circumferential travel patterns. The Central Area is shown in Figure 1.1, which also may be found at (ftp://ctps.org/pub/LRTP/MPO-RadialCorr-CA-BBD.pdf).
Boston Business District
The Boston Business District is the heart of the Central Area. Its boundaries are the Charles River to the north, Massachusetts Avenue to Interstate 93 on the west and south, and the South Boston Seaport District bounded by Broadway to Haul Road, New Cypher Street, D Street, and Summer Street to the Marine Industrial Site. The Boston Business District is shown in Figure 1.1, which also may be found at (ftp://ctps.org/pub/LRTP/MPO-RadialCorr-CA-BBD.pdf).
MPO staff studied each individual corridor, the Central Area, and the Boston Business District to understand current travel patterns and trends, projected future travel demand, and transportation conditions; and staff combined this information in order to study the entire region. Information about the transportation system helps the Boston Region MPO evaluate its performance relative to its goals regarding safety, system preservation, capacity management and mobility, greenhouse gases and air pollutants, transportation equity, and economic vitality. Staff used information from previous and ongoing transportation planning work—including the Paths to a Sustainable Region LRTP, the MBTA’s Program for Mass Transportation, the MPO’s Congestion Management Process (CMP), transportation equity outreach, MPO studies, and special studies—to update the Needs Assessment.
The MPO’s travel demand model, updated with data from the most current (2011) Massachusetts Household Travel Survey, and demographic projections also were used in the Needs Assessment. Existing and projected socioeconomic information (population, housing, and employment data) and the existing and proposed transportation network were important factors in determining transportation needs. In the modeling process, the adopted LRTP used a base year of 2012 and a future year of 2040 for the transportation network and socioeconomic data. A detailed description of the modeling process may be found at http://www.ctps.org/Drupal/travel_modeling_101.
Information used in the updated, 2015 Needs Assessment is documented on the MPO’s website. It may be found by accessing the LRTP Needs Assessment webpage http://www.bostonmpo.org/Drupal/charting_2040_needs or through the Data Catalog webpage http://www.ctps.org/datacatalog_share/ under the long-range transportation plan category. Staff also have created specific applications that provide information used in developing the Needs Assessment. These applications also may be found on the MPO’s website, and include:
The sections below cite the type of information, along with their links available in the web-based Needs Assessment. Information on the website includes a description of the information (metadata), the data, and if applicable, an analysis of the displayed data that is used to determine and prioritize the needs of the region’s transportation system. Most of the information is in the form of a table or map and may be viewed for the entire region or individual corridors.
The transportation system in the MPO region is a collection of roads, bridges, transit services, freight lines, bicycle routes, pedestrian facilities, and ferry routes. It is maintained and operated by a number of different agencies, including but not limited, to the Massachusetts Department of Transportation (MassDOT), the Massachusetts Bay Transportation Authority (MBTA), the Massachusetts Port Authority, the Department of Conservation and Recreation, and local entities.
Information about the existing major transportation facilities and services included in the Web-based Needs Assessment is as follows:
The Boston Region MPO area has long been home to a changing population, economy, and landscape, and the coming decades will be no exception. The forces of an aging population, growing diversity, economic restructuring and changing household preferences will intersect to create a region that in 2040 could be markedly different from the one that exists today. The Metropolitan Area Planning Council (MAPC) develops socioeconomic forecasts for use by the Boston Region MPO in developing the LRTP. The Needs Assessment includes information about existing land use in the region, and where possible, that which is projected to occur between now and 2040, as follows:
To understand the MPO’s transportation needs, it is important to know the region’s travel patterns. Information about highway, transit, freight, bicycle, and pedestrian travel modes included in the LRTP Needs Assessment application was derived from the MPO’s regional travel demand model, which uses base year (2012) conditions and projects future (2040) travel patterns.
The Express-Highway Performance Dashboard and Arterial Performance Dashboard display 2012 peak-period congestion for expressways and arterials in the Boston Region MPO area in both map and table format. The congestion performance measures in the dashboards represent three factors related to congestion: duration, intensity, and travel time reliability. Each dashboard consists of regional overview maps, route-specific data, and downloadable accessible tables. The roadway data that are represented in both dashboards were collected in 2012 by INRIX and processed by MPO staff.
The MPO Livable Communities Data browser is a resource for exploring data associated with livability throughout the Boston region. The information is presented in both maps and tables. The database provides access to data, by municipality, related to demographics, available transportation options, and existing transportation patterns to facilitate a better understanding of the current state of livability and conditions necessary for supporting livability.
The All-Hazards Planning application shows the region’s transportation network in relation to natural hazard zones in map format. This tool works in conjunction with the MPO’s database of Transportation Improvement Program (TIP) projects and is used to determine if proposed projects are located in areas prone to flooding or at risk of seawater inundation from hurricane storm surges, or, in the long term, sea level rise. Transportation facilities in such hazard zones might benefit from flood protection measures, such as enhanced drainage systems, or adaptations for sea level rise.
This tool may be used to browse, in tabular form, the MPO’s database of modeled VMT, vehicle hours traveled (VHT), and emissions data for the 101 cities and towns in the Boston Region MPO. The data is for the 2009 base year.
MPO staff develops and maintains a varied collection of data crucial to regional planning and policy decisions. The information listed below is included as part of the LRTP Needs Assessment. This data is available for download. Tabular data is available in either Excel or PDF form, depending upon the particular dataset.