A major component in LRTP development is the Recommended Plan. The Recommended Plan cites the major, regionally significant projects and investment programs that have been selected for funding for the life of the LRTP. This chapter explains what transportation infrastructure the MPO expects to fund during the next 25 years. It particularly focuses on those projects and programs that will be funded with MPO discretionary funds. The chapter begins with an overview of key elements that form the backdrop for these decisions and goes on to explain the project and program selection process. It then describes the projects and programs that comprise the Recommended Plan. Finally, this chapter describes the travel demand model results and offers an interpretation of the Recommended Plan’s projects and programs.
The ultimate purpose of transportation is to serve human activity; therefore, the MPO defines its challenge for this LRTP as:
How can we maintain the transportation network to meet existing needs, adapt and modernize it for future demand, while simultaneously working within the reality of constrained fiscal resources?
The MPO recognizes the diversity of transportation needs throughout the Boston region. Matters of system preservation, safety, capacity management and mobility, the environment, economic vitality, and transportation equity all need to be addressed to balance diverse needs and reach the region’s goals. The Recommended Plan demonstrates the MPO’s method for reaching this balance—to provide adequate funding for regionally significant major infrastructure and capacity-adding projects as well as investment programs. A major infrastructure project is one that costs more than $20 million. An expansion project is one that adds capacity to the existing system through adding a travel lane, constructing an interchange, building an extension of a commuter rail or rapid transit line, or procuring additional (not replacing) public transportation vehicles. Other investment programs allow for smaller-scale projects that would be funded through the Transportation Improvement Program. This Recommended Plan is the MPO’s response to the challenge above, including the issue of diversity.
The Recommended Plan addresses the following issues:
Chapter 2, Process for Developing Charting Progress to 2040, describes the MPO’s process for selecting the recommended projects and programs included in this LRTP in more detail. The steps are summarized below:
To develop the Recommended Plan, MPO staff needed to identify the region’s top-priority highway and transit projects as candidates for funding. To arrive there, staff first had to comprise a draft list of major infrastructure projects and other investment programs for modeling. MPO staff used the information listed above, including results of the initial scenario planning, to create a balanced list that fits within the fiscal constraints of the LRTP.
Developing the draft list of major infrastructure projects and other investment programs involved balancing two conflicting MPO policies:
The MPO intends to ensure that the projects and programs funded in Charting Progress to 2040 advance its goals. To address this, the MPO considered two alternatives: 1) program the projects included in Paths to a Sustainable Region, the previous LRTP, and 2) use the O&M approach for programming lower-cost projects as analyzed as part of the Charting Progress to 2040 development process.
This alternative programmed all of the unfunded major infrastructure projects from Paths to a Sustainable Region in the five-year time bands established for Charting Progress to 2040 (2016–2020, 2021–2025, 2026–2030, 2031–2035, and 2036–2040). Funding was available for all of the projects, although not in the same time bands because of reductions in available revenue. These major infrastructure projects, however, accounted for 68 percent of the total funding available for the 25-year period. This would not allow many smaller projects that do not add capacity or cost less than $20 million (the projects that do not need to be listed in the LRTP) to be funded over the next 25 years.
The O&M alternative targeted funding to lower-cost improvements such as intersection and complete street projects and a limited amount of major infrastructure projects. As shown in the scenario planning process (see Appendix A), this alternative was more effective in addressing the MPO’s goals and would provide greater opportunities to ensure geographic equity (money can be distributed throughout the region, as opposed to being concentrated in a few specific projects).
To develop the staff recommendation for major infrastructure projects under the O&M alternative, staff applied the MPO’s goals and objectives as criteria in a qualitative evaluation of the major infrastructure and capacity-adding highway projects. This was done for projects included in the Universe of Projects and Programs list that were sufficiently well defined to allow for analysis. Many of the major infrastructure projects in Paths to a Sustainable Region had been determined previously to address MPO priorities similar to the goals in Charting Progress to 2040; the projects that had rated highly in Paths to a Sustainable Region continue to rate highly in the Charting Progress to 2040 project-evaluation process. In addition, many projects were identified in the Charting Progress to 2040 Needs Assessment. For these reasons, staff included some of the Paths to a Sustainable Region major infrastructure projects in their recommendation for this LRTP. Some projects needed to be eliminated because of reduced available revenues in Charting Progress to 2040.
Respecting the MPO’s policy to maintain its commitments in the TIP, the staff recommendation continued to include those projects that were programmed in the FFYs 2015–18 TIP and others that rated well. Staff then updated information about project readiness and costs of the highly rated projects. Once the major infrastructure projects were selected for Charting Progress to 2040 (considering their updated readiness and costs), the remaining funding was used to implement the MPO’s new policy of giving priority to the O&M program projects. Staff recommended implementing programming for O&M programs beginning in the FFYs 2021–26 time band and proposed funding in each program through the remaining time bands.
Staff developed the O&M alternative using the following assumptions for the various investment programs:
The first three programs include the types of projects that typically are funded in the TIP. The fourth, the Community Transportation, Parking, and Clean Air and Mobility Program, is a revival and expansion of the MPO’s Clean Air and Mobility program (which had been in hiatus for several years because of lack of funding); it was established based on input from public outreach and information from the Needs Assessment.
The MPO reviewed and discussed the two alternatives and ultimately adopted the O&M scenario as the basis for recommending projects and programs in the draft LRTP. After further discussion, the MPO voted to adjust the last two time bands of the LRTP (2031–2035 and 2036–2040) continuing to fund the four O&M programs but leaving the major infrastructure program unallocated at this time. This was because of a number of factors:
Ultimately, the final selection of projects was based on the informed judgment of MPO members after they reviewed information obtained through the LRTP development process, including:
A list of the major infrastructure projects and O&M programs is shown in Table 5.1; they are described in the next section.
TABLE 5.1
Major Infrastructure Projects in the Recommended Plan
| Project Name |
Current Cost |
|---|---|
Middlesex Turnpike Improvements, From Crosby Drive North to Manning Road, Phase III (Bedford and Billerica) |
$26,935,000 |
Reconstruction of Rutherford Avenue, from City Square to Sullivan Square (Boston) |
$109,967,000 |
Intersection Improvements at Route 126 and Route 135/MBTA and CSX Railroad (Framingham) |
$115,000,000 |
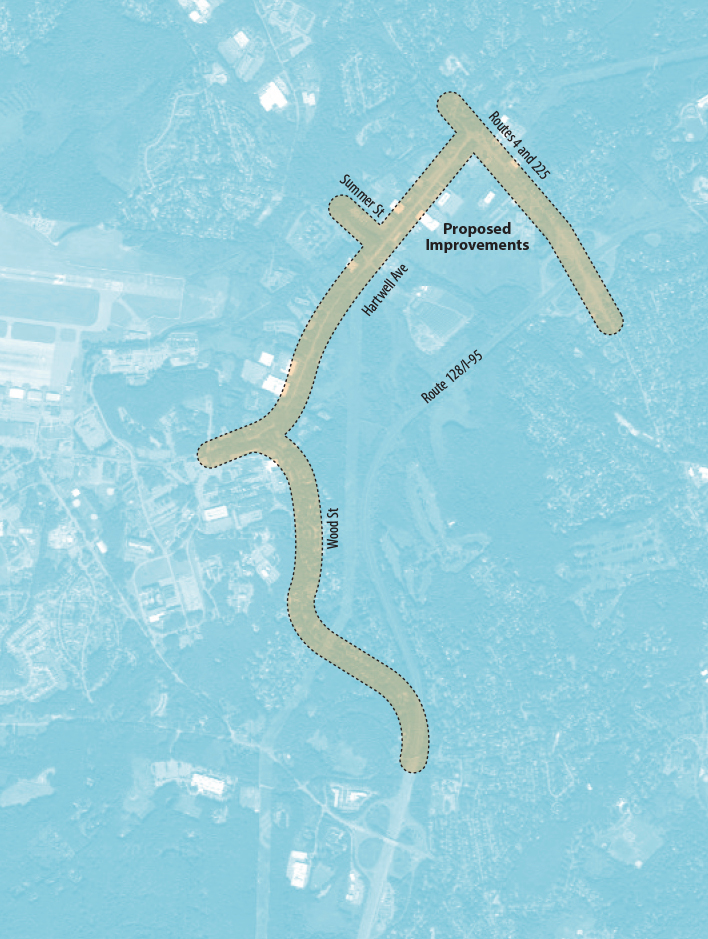
Route 4/225 (Bedford Street) and Hartwell Avenue (Lexington) |
$23,221,000 |
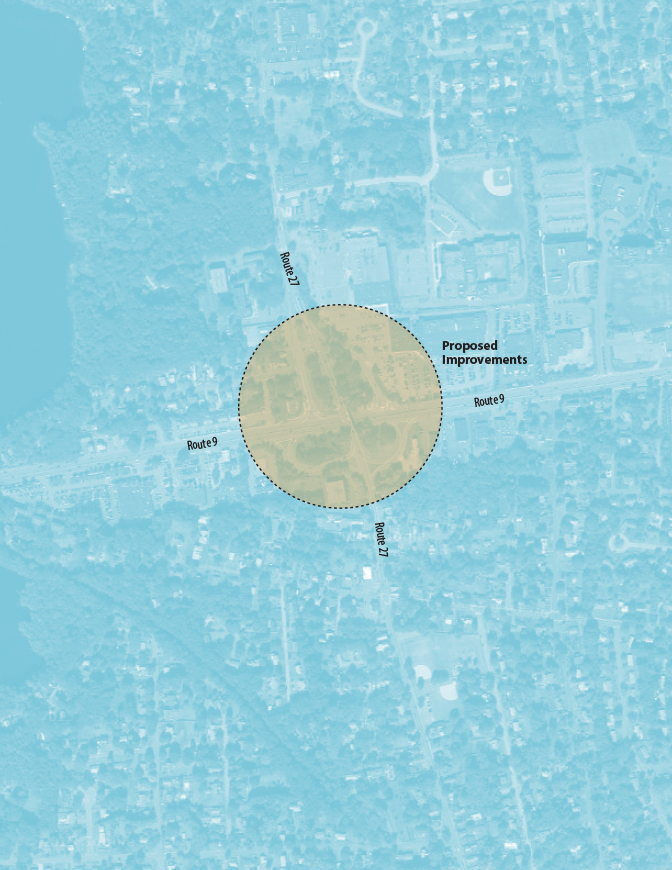
Bridge Replacement, Route 27 (North Main St.) over Route 9 (Worcester St.) and Interchange Improvements (Natick) |
$25,793,000 |
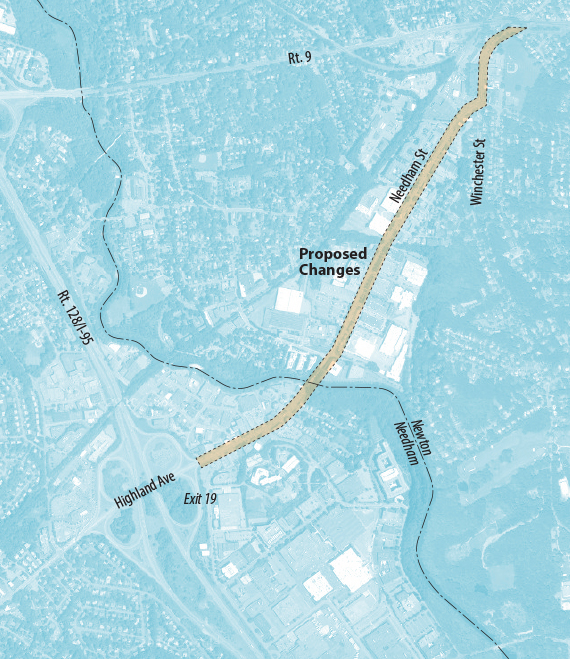
Reconstruction of Highland Avenue, Needham Street and Charles River Bridge, from Webster Street to Route 9 (Newton and Needham) |
$14,298,000 |
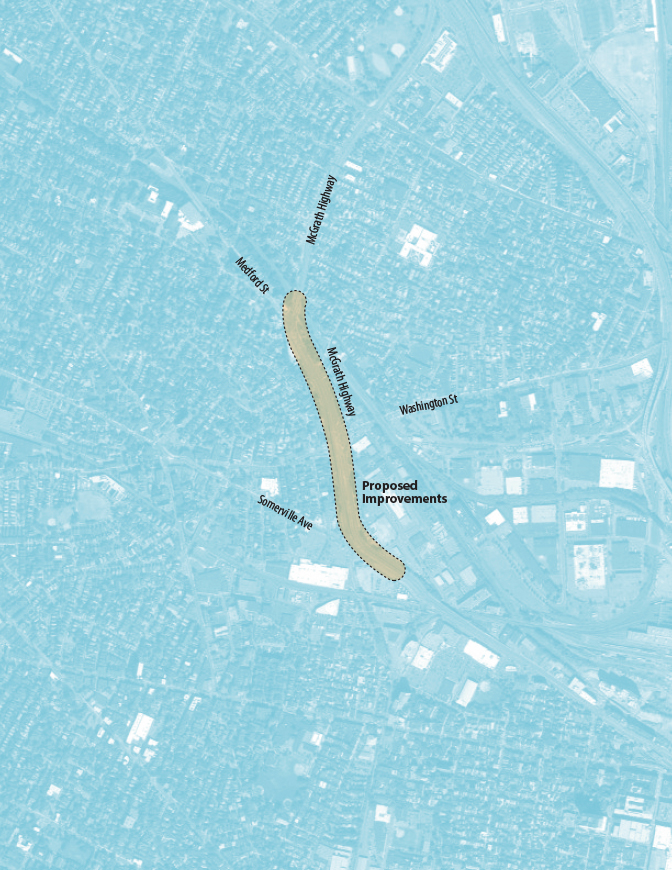
McGrath Boulevard Project (Somerville) |
$56,600,000 |
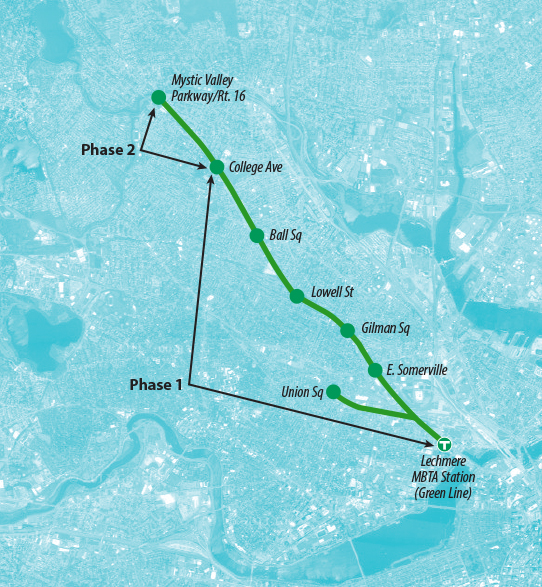
Green Line Extension Project (Phase 2), College Avenue to Mystic Valley Parkway/Route 16 (Somerville and Medford) |
$190,000,000 |
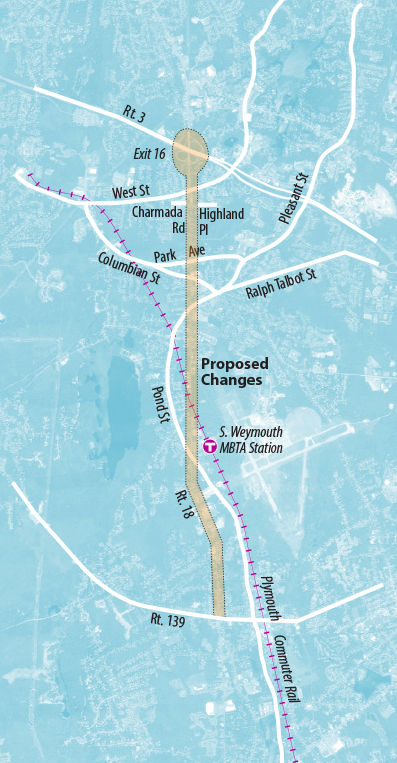
Reconstruction and Widening on Route 18 (Main Street) From Highland Place to Route 139 (Weymouth and Abington) |
$58,822,000 |
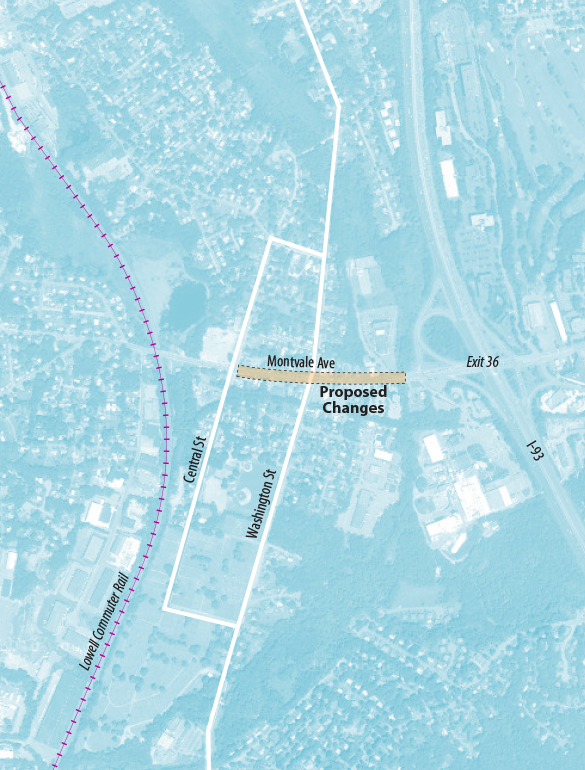
Reconstruction of Montvale Avenue, from I-93 Interchange to Central Street (Woburn) |
$4,225,000 |
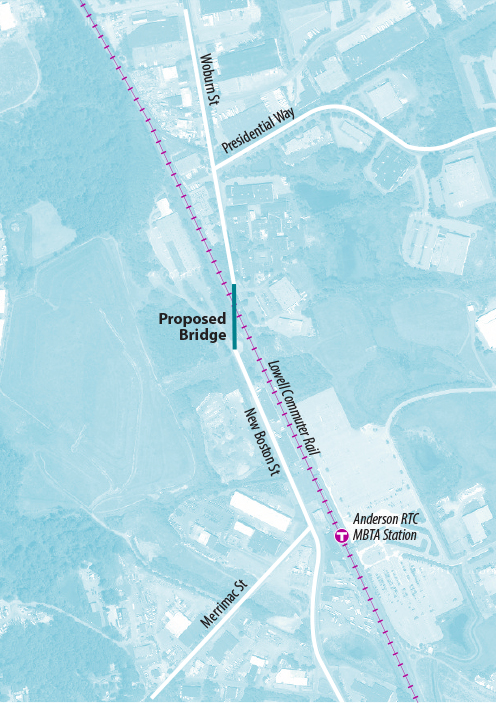
Bridge Replacement, New Boston Street over MBTA (Woburn) |
$9,707,000 |
This LRTP includes funding to meet the needs and address the issues discussed in the Background section above, including maintenance and expansion of the transportation system. Funding for much of the roadway maintenance in the Boston Region MPO area is provided through statewide resurfacing, maintenance, and infrastructure programs. Maintenance of the bridges is provided through the statewide bridge program and the Accelerated Bridge Program.
In the Boston region, the highway network’s major infrastructure and capacity expansion projects, and other maintenance and rehabilitation projects not included in the statewide programs are funded through the Boston Region MPO’s share of the discretionary capital program. The selection of projects and programs using these funds was described in the Project Selection section above.
In this LRTP, for the transit network, the MPO has allocated all of the MBTA’s future transit capital funding to system infrastructure maintenance, accessibility improvements, and system enhancements. It also demonstrates the MPO’s commitment to State Implementation Plan projects by programming and funding them.
The following ongoing no-build major infrastructure and expansion projects are funded in this LRTP:
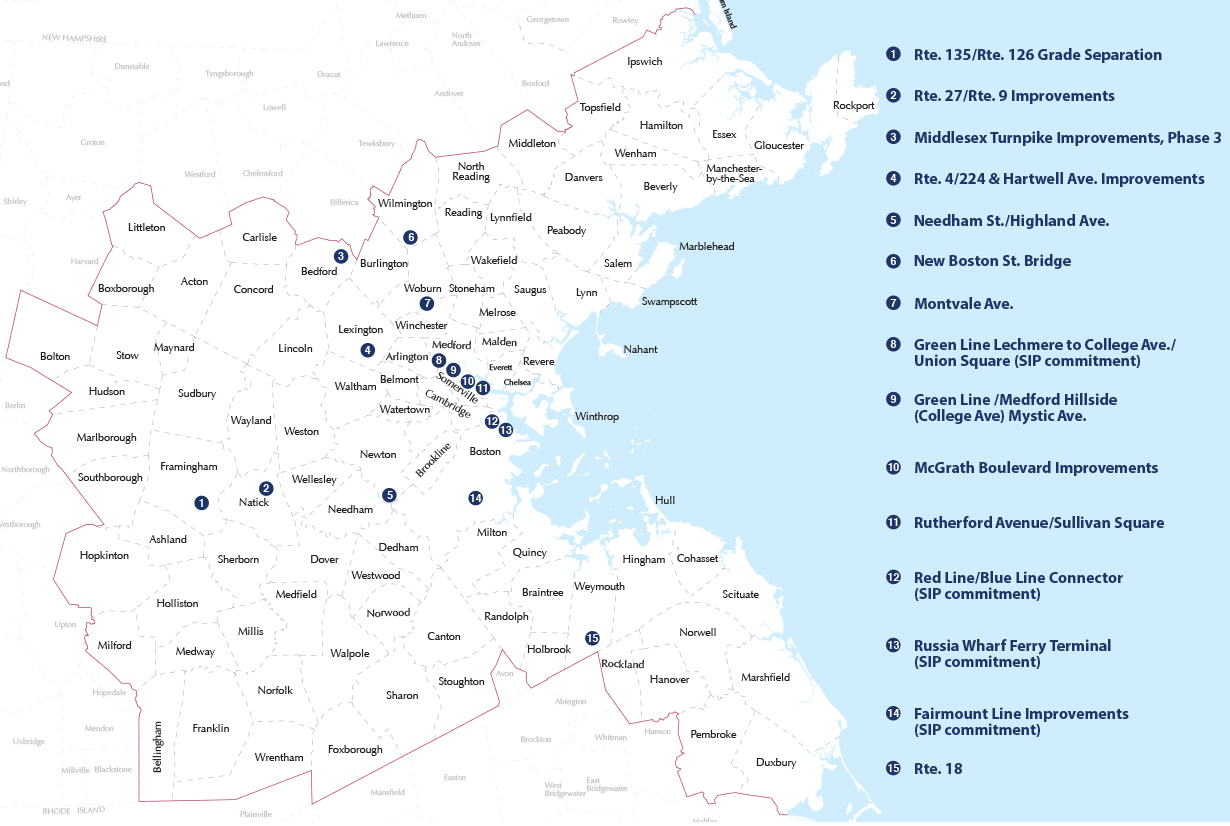
After accounting for the costs of these ongoing projects, the remaining funds are available for major infrastructure and capacity expansion or set aside for low-cost, non-capacity-adding projects that advance the MPO’s visions and policies. Table 5.1 listed the projects funded under the major infrastructure program and their current costs. Figure 5.1 shows the locations of these projects. As shown in Table 5.1, the Recommended Plan allocates the majority of highway funding for highway projects. However, it also provides for flexing $190 million in highway funding to one transit project.
FIGURE 5.1
Major Infrastructure Projects in the Recommended Plan
All public transportation funds are used for improvements to the regional public transportation system. Based on this distinction, the major infrastructure projects total approximately $805 million, 28 percent, of the MPO’s discretionary funds. The MPO also included funding for approximately $1.5 billion, 54 percent, in roadway modernization projects and programs, and $63 million, 2 percent, for a community transportation, parking, and clean air and mobility program. Table 5.2 shows the total amount of funding dedicated to major infrastructure projects and O&M programs in this LRTP. In the last two time bands of the LRTP, $446.7 million, 16 percent, has been left unallocated.
TABLE 5.2
Funding Dedicated to Programs in the LRTP
| Program |
Dedicated Funding |
|---|---|
MPO Discretionary Capital Program: Major Infrastructure Projects |
$615,363,800 |
MPO Discretionary Capital Program: Highway Funds Flexed to Transit |
$190,000,000 |
MPO Discretionary Capital Program: Complete Street Program |
$936,262,700 |
MPO Discretionary Capital Program: Intersection Improvement Program |
$443,639,500 |
MPO Discretionary Capital Program: Bicycle/Pedestrian Program |
$158,442,700 |
MPO Discretionary Capital Program: Community Transportation/ Parking/Clean Air and Mobility Program |
$63,377,100 |
MPO Discretionary Capital Program: Unassigned Funds |
$446,707,600 |
Total Highway Funding |
$2,853,793,400 |
Transit Expansion Projects Funded in the Boston Region MPO by the Commonwealth |
$1,555,250,000 |
Transit Funding |
$1,555,250,000 |
Table 5.3 lists the highway projects funded under the major infrastructure program, as well as other investment programs established for O&M projects, their costs, and the period in which they are projected to be programmed. The list also includes the Green Line Extension from College Avenue to Mystic Valley Parkway/Route 16 transit project, which is using highway funds flexed to transit.
Pursuant to federal guidance for allowing for inflation, costs associated with each highway project are based on the current estimated cost plus four percent per year through the year of construction. (Figure 5.1 shows the location of each project.) Table 5.4 lists bridges that cost more than $20 million and currently are scheduled to be advertised. The next section of this chapter first provides a detailed description, current cost, and map for each major infrastructure highway project in the Recommended Plan; it also provides a detailed description of the other investment programs.
TABLE 5.3
Major Infrastructure Projects Programmed with Highway Funding in the Recommended Plan with Costs
Project Name |
Current Cost |
Investment Category |
FFY 2016–2020 |
FFY 2021–2025 |
FFY 2026–2030 |
FFY 2031–2035 |
FFY 2036–2040 |
MPO |
Non-MPO Funding |
|
Route 128 Additional Lanes (Needham & Wellesley) |
$57,768,183 |
MI |
$57,768,183 |
|
|
|
|
$57,768,183 |
|
|
Middlesex Turnpike Improvements from Crosby Dr North to Manning Rd, Phase III (Bedford & Billerica) |
$26,935,171 |
MI |
$28,296,348 |
|
|
|
|
$28,296,348 |
$1,000,000 |
|
Reconstruction of Rutherford Ave, from City Sq to Sullivan Sq (Boston) |
$109,967,000 |
MI |
$7,000,000 |
$106,268,126 |
|
|
|
$113,268,126 |
$15,377,710 |
|
Intersection Improvements at Rte 126 & Rte 135/MBTA & CSX Railroad (Framingham) |
$115,000,000 |
MI |
|
|
$184,118,700 |
|
|
$184,118,700 |
|
|
Route 4/225 (Bedford St) and Hartwell Ave (Lexington) |
$23,221,000 |
MI |
|
$30,557,000 |
|
|
|
$30,557,000 |
|
|
Bridge Replacement, Rte 27 (North Main St) over Rte 9 (Worcester St) and Interchange Improvements (Natick) |
$25,793,370 |
MI |
|
$33,942,300 |
|
|
|
$33,942,300 |
|
|
Reconstruction of Highland Ave, Needham St & Charles River Bridge, from Webster St to Rte 9 (Newton & Needham) |
$14,297,606 |
MI |
$15,464,292 |
|
|
|
|
$15,464,292 |
|
|
McGrath Boulevard Project (Somerville) |
$56,563,000 |
MI |
|
|
$90,559,000 |
|
|
$90,559,000 |
|
|
Green Line Extension Project (Phase 2), College Ave to Mystic Valley Parkway/Rte 16 (Somerville to Medford) |
$190,000,000 |
MI |
$158,000,000 |
$32,000,000 |
|
|
|
$190,000,000 |
|
|
Reconstruction & Widening on Rte 18 (Main St) from Highland Pl to Rte 139* (Weymouth & Abington) |
$58,822,115 |
MI |
$45,281,758 |
|
|
|
|
$45,281,758 |
$14,771,760 |
|
Reconstruction of Montvale Ave, from I-93 Interchange to Central St (Woburn) |
$4,225,256 |
MI |
$4,752,838 |
|
|
|
|
$4,752,838 |
|
|
Bridge Replacement, New Boston St over MBTA (Woburn) |
$9,706,549 |
MI |
$11,355,289 |
|
|
|
|
$11,355,289 |
|
|
Complete Street Program (Regionwide) |
|
CS |
|
$152,018,630 |
$177,609,859 |
$321,301,910 |
$268,037,266 |
$918,967,664 |
|
|
Bicycle/Pedestrian Program (Regionwide) |
|
B/P |
|
$26,210,109 |
$30,622,389 |
$55,396,881 |
$46,213,322 |
$158,442,701 |
|
|
Intersection Improvement Program (Regionwide) |
|
INT |
|
$73,388,304 |
$85,742,690 |
$155,111,267 |
$129,397,301 |
$443,639,562 |
|
|
Community Transportation/Parking/Clean Air Mobility Program (Regionwide) |
|
CT/PK/CA |
|
$10,484,043 |
$12,248,956 |
$22,158,752 |
$18,485,329 |
$63,377,080 |
|
|
Total Available Regional Highway Target Funds |
|
|
$441,648,080 |
$464,868,512 |
$580,901,594 |
$657,770,110 |
$708,605,218 |
$2,853,793,514 |
$31,149,470 |
|
Total Programmed Regional Highway Target Funds |
|
|
$345,213,746* |
$464,868,512 |
$580,901,594 |
$553,968,810 |
$462,133,218 |
$2,407,085,880* |
|
|
Regional Highway Target Funds Available |
|
|
$96,434,334 |
$0 |
$0 |
$103,801,300 |
$246,472,000 |
$446,707,634 |
|
|
* Includes funding from projects not listed in LRTP but included in the 2016-2019 TIP
MI - Major Infrastructure Program
CS - Complete Streets Program
B/P - Bicycle/Pedestrian Program - Assabet River Rail Trail will be funded under this program
INT - Intersection Improvement Program
CT/PK/CA - Community Transportation/Parking/Clean Air and Mobility Program
TABLE 5.3 (Cont.)
Major Infrastructure Projects Programmed with Highway Funding in the Recommended Plan with Costs
Project Name |
Current Cost |
Investment Category |
FFY 2016–2020 |
FFY 2021–2025 |
FFY 2026–2030 |
FFY 2031–2035 |
FFY 2036–2040 |
MPO |
Major Infrastructure |
|
|
$327,918,708 |
$202,767,426 |
$274,677,700 |
$0 |
$0 |
$805,363,835 |
Complete Street |
|
|
$17,295,037 |
$152,018,630 |
$177,609,859 |
$321,301,910 |
$268,037,266 |
$936,262,701 |
Bicycle and Pedestrian |
|
|
$0 |
$26,210,109 |
$30,622,389 |
$55,396,881 |
$46,213,322 |
$158,442,701 |
Intersection Improvement Program |
|
|
$0 |
$73,388,304 |
$85,742,690 |
$155,111,267 |
$129,397,301 |
$443,639,562 |
Community Transportation |
|
|
$0 |
$10,484,043 |
$12,248,956 |
$22,158,752 |
$18,485,329 |
$63,377,080 |
Unallocated Funds |
|
|
$96,434,334 |
$0 |
$0 |
$103,801,300 |
$246,472,000 |
$446,707,634 |
Total |
|
|
$441,648,079 |
$464,868,512 |
$580,901,594 |
$657,770,110 |
$708,605,218 |
$2,853,793,514 |
|
|
|
|
|
|
|
|
|
% Major Infrastructure |
|
|
74% |
44% |
47% |
0% |
0% |
28% |
% Complete Street |
|
|
4% |
33% |
31% |
49% |
38% |
33% |
% Bicycle and Pedestrian |
|
|
0% |
5% |
5% |
8% |
6% |
6% |
% Intersection Improvement |
|
|
0% |
16% |
15% |
24% |
18% |
16% |
% Community Transportation |
|
|
0% |
2% |
2% |
3% |
3% |
2% |
% Unallocated Funds |
|
|
22% |
0% |
0% |
16% |
35% |
15% |
% Total |
|
|
100% |
100% |
100% |
100% |
100% |
100% |
TABLE 5.4
Highway Bridges with Estimated Costs of More than $20 Million
Municipality |
Project |
FFY |
FFY 2021–2025 |
FFY 2026–2030 |
FFY 2031–2035 |
FFY 2036–2040 |
Hanover and Norwell |
Superstructure Replacement Route 3 over Route 123 (Webster Street) and Route 3 over Route 123 (High Street) |
$41,955,600 |
|
|
|
|
Boston |
North Washington Street over the Charles River |
$117,208,000 |
|
|
|
|
Lynn and Saugus |
Route 107 over the Saugus River |
$45,000,000 |
|
|
|
|
Total Statewide Bridge Program |
|
$204,163,600 |
|
|
|
|
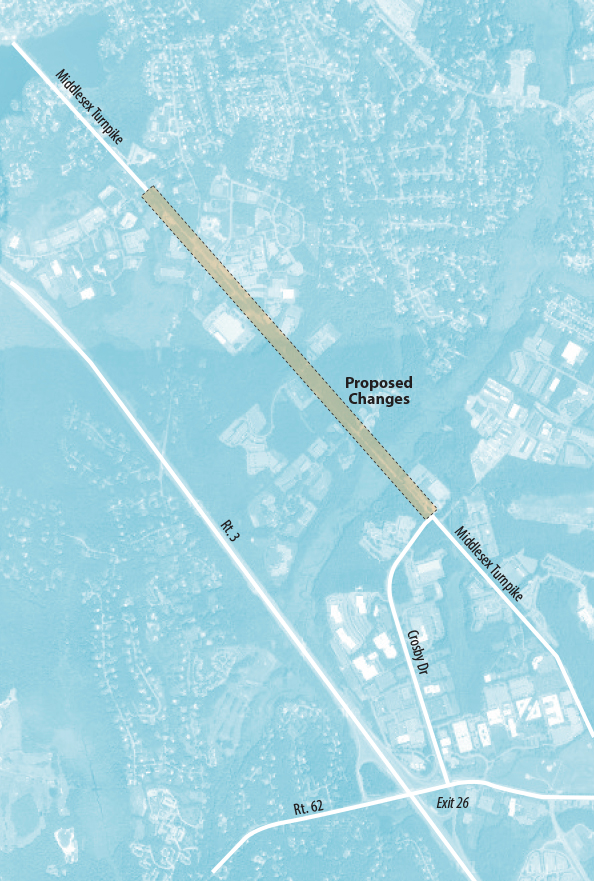
The proposed improvements will widen Middlesex Turnpike from 800 feet north of Plank Street to 900 feet north of Manning Road. This will provide two lanes in each direction, making it a four-lane highway with a median. There will be left-turn lanes at key intersections. The improvements span approximately 1.5 miles and include reconstructing the bridge over the Shawsheen River. The roadway’s cross-section width will increase to 70 feet, and the total right-of-way will be 85 feet wide. Each direction will consist of a 14-foot outside travel lane, a 13-foot inside travel lane, and a 16-foot median. The median will be reconfigured at key intersections and driveways as a 4-foot median with a 12-foot protected left-turn lane. On the east side of the 70-foot travel way is a 7-foot grass strip, and on the west side are a 3-foot grass strip and a 4-foot concrete sidewalk.
A draft environmental impact report (DEIR) for earlier phases of this project, completed in 1995, contained a roadway segment capacity analysis. This analysis showed that the Middlesex Turnpike operated at level of service (LOS) E in the AM and PM peak hours; and, at six out of seven intersections along this roadway, the critical movement in the AM and PM peak hours operated at LOS F. In terms of delay, Congestion Management Process (CMP) monitoring conducted in 2002 found that the average travel speed is less than 70 percent of the posted speed along four segments in both the northbound and southbound directions, in both the AM and PM peak periods. MassDOT traffic counts as recent as 2007 show average weekday traffic ranging between 15,000 and 25,000 vehicles between Billerica and Burlington.
The MBTA and the Lowell Regional Transit Authority (LRTA) provide bus service in this corridor that connects with the downtown areas of Boston and Lowell.
This project will add three miles of new bicycle lanes and rebuilt sidewalks.
There are no high-crash locations within the study area for the years 2010 to 2012, according to MassDOT’s list of the top-200 high-crash intersections.
Three lane-miles of substandard pavement and one substandard bridge will be replaced as part of this project.
The project consists of a corridor that spans two communities, Bedford and Billerica. The area in Bedford is zoned for industrial park, industrial, general business, and residential uses. The area in Billerica is zoned for industrial uses.
This phase of the reconstruction of the Middlesex Turnpike is in Bedford and Billerica, immediately north of an MPO-designated priority development area in Burlington. This project will improve access to the priority development area from US Route 3.
This project is not within an environmental justice (EJ) area.
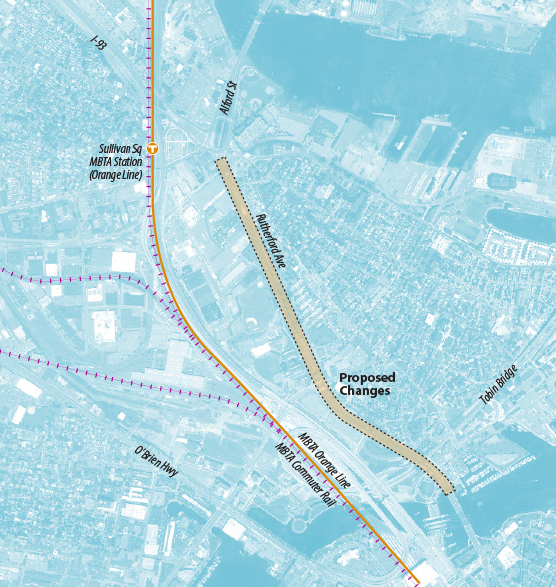
The Rutherford Avenue project seeks to transform the corridor’s highway-like design into a multimodal urban boulevard. The Rutherford Avenue corridor in the Charlestown neighborhood of Boston extends about 1.5 miles from the North Washington Street Bridge to the Sullivan Square MBTA Orange Line station. The existing corridor consists of 8 to 10 lanes that facilitate high-speed automobile travel. Although this roadway layout served high volumes of traffic during construction of the Central Artery/Tunnel project, it now acts as a barrier to the neighborhood. The existing roadway creates significant challenges and safety issues for pedestrians and bicyclists seeking to reach various destinations, including Bunker Hill Community College, Paul Revere Park, the Hood Business Park employment area, and MBTA rapid transit stations.
The proposed roadway design includes mobility improvements for all modes through widened sidewalks, shortened crossings, on-street parking lanes, bicycle lanes, and exclusive bus lanes to improve bus operations at the Sullivan Square Station. The project provides improvements around Sullivan Square by reconfiguring the roadways into an urban grid system of streets to regularize traffic movements. The at-grade urban boulevard will eliminate the underpasses at Sullivan Square and Austin Street, add a 12 to 16-foot-wide landscaped median, and reduce the roadway to two lanes in each direction, with turn lanes at intersections.
The designation of exclusive bus lanes at Sullivan Square Station also will improve operations for 12 MBTA bus routes served by almost 900 trips each day. The safety and convenience of street crossings for pedestrians accessing MBTA services will be improved.
By transforming the highway-like roadway into a multimodal urban boulevard, the project will improve pedestrian and bicycle safety, and access to the Community College and Sullivan Square MBTA stations on the Orange Line. The livability elements consist of adding 10-foot sidewalks, creating a 20 to 40-foot linear park or buffer, installing ten traffic signals and crosswalks, shortening crossings, planting 900 trees, and possibly adding a 5-foot wide bike lane in the southbound direction.
There is one Highway Safety Improvement Program crash cluster in the project area. The project area is also identified as a high-crash location for trucks.
Nine lane-miles of substandard pavement will be replaced and three substandard bridges eliminated as part of this project.
The plans for reconfiguring the Sullivan Square roadway network also provide an opportunity to create land parcels for transit-oriented-development that will be well suited and well located for commercial and residential redevelopment by the private sector. Many of the parcels in the Sullivan Square area are publicly owned, by either the MBTA or the City of Boston, which creates the potential for public-private partnerships.
This project is not in an EJ area, but it is within a half-mile of an EJ area in the neighboring city of Somerville.
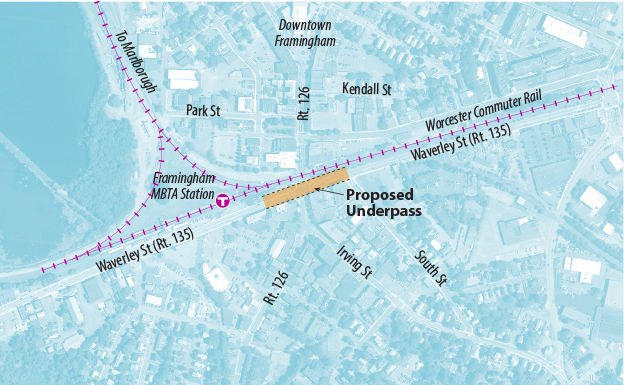
This alternative would provide a grade separated crossing at the intersection of Route 135 and Route 126. Route 135 would be depressed under Route 126, with Route 126 approximately maintaining its existing alignment. The depressed section of Route 135 would extend from approximately 500 feet west of Route 126 to approximately 480 feet east of Route 126. The westerly limit of the depressed section would begin immediately east of a potential Hollis Court Extension. The easterly limit of the depressed section would be approximately 125 feet west of the existing at-grade crossing of the Framingham secondary track.
Within the proposed Route 135 cross-section would be an underpass that would include two 11-foot travel lanes with 4-foot shoulders. Retaining walls would be constructed on both sides of the underpass. The remaining space within the project cross-section would be used for at-grade features including ramps connecting Route 135 with Route 126, and sidewalks.
The available cross-section would be constrained by existing buildings on both sides of the road west of the Route 126 intersection, including two buildings on the south side and the historic train station on the north side. The proposed cross-section, west of the intersection, would include a 30-foot pavement section with two three-foot thick retaining walls and two 10-foot wide at-grade sidewalks on Route 135.
East of the intersection, three buildings on the south side of Route 135 directly abut the sidewalk. On the north side, two small buildings sit between Route 135 and the Boston mainline tracks. The existing distance between the buildings is approximately 66 feet. In order to make a partial connection between Route 135 and Route 126, ramps will be provided on Route 135 east of the intersection. These would consist of a one-way, one-lane ramp eastbound from Route 126 to Route 135 and a one-way one-lane ramp westbound from Route 135 to Route 126.
Side streets beyond the immediate vicinity of the intersection would be used to provide connections from eastbound Route 135 to Route 126 and from Route 126 to westbound Route 135. This would include the extension of Hollis Court, probably requiring new signals at the Route 126/Hollis Court and Route 135/Hollis Court Extension intersections.
This project will allow traffic on Route 135 to bypass the intersection with Route 126. According to MassDOT 2005 traffic volume data, average daily traffic (ADT) at this location is 19,700 vehicles on Route 126 and 15,700 vehicles on Route 135. The Route 126/Route 135 intersection functions at LOS F in the AM and PM peak periods.
The Framingham commuter rail station is located near the project site; and key Metrowest bus Routes 2, 3, and 7 now terminate at the station. Pedestrian and bicycle access to the station via Route 126 from the south will be improved since most of Route 135 traffic would now be below-grade.
Project area sidewalks will be reconstructed and north-south travel by non-motorized modes will be facilitated.
This project area includes one of the top-200 Massachusetts crash locations, a situation that has existed for a number of years.
This project will rebuild one-half mile of roadway in its existing configuration.
This project is entirely within an MPO-designated priority development area and is expected to be a catalyst for redevelopment of the downtown Framingham central business district.
This project is located in Framingham’s central business district, which, according to the Executive Office of Environmental Affairs and the Metropolitan Area Planning Council’s build-out analysis, is subject to absolute development constraints, but also is a designated redevelopment district. According to the Route 126 Corridor Study, the construction of this project would help facilitate redevelopment by making the downtown area more attractive and providing redevelopment sites through the partial taking of business sites as necessary for the roadway work.
As currently envisioned, the project includes many streetscape amenities and will facilitate downtown redevelopment, including possible facade improvements near the town common. The project also eliminates a significant congestion point in downtown Framingham.
This project is entirely within an EJ area.
The proposed project would greatly enhance mobility and safety for vehicular, bicycle, and pedestrian traffic in the project area. The preferred alternative includes reconstruction of Hartwell Avenue and Bedford Street to provide:
MassDOT traffic counts in 2005 found average weekday traffic of:
The CMP has found that the average travel speed is less than 70 percent of the posted speed during the AM peak period and less than 60 percent in the PM peak. The section of Route 4/225 south of Hartwell Avenue already has four lanes. One or two additional lanes will be added to the other roadway sections.
The MBTA provides bus service in this corridor connecting with the Red Line at Alewife station.
This project will add four miles of new bicycle lanes and sidewalks.
There are two Highway Safety Improvement Program crash clusters in the project area.
Five lane-miles of substandard pavement will be replaced as part of this project.
This project serves an existing area of concentrated development. There is potential for further development in this area, which would be facilitated by this project.
This project is not within an EJ area.
This project will reconstruct the Route 27 overpass that spans Route 9 and the associated cloverleaf-style ramps. While the basic configuration of the interchange will not change, reconstruction of all elements to current roadway design standards will address serious safety deficiencies and reduce traffic delay by providing new turning lanes.
MassDOT traffic counts in 2008 found average weekday traffic on Route 27 to be about 27,000 vehicles near the Route 9 overpass. Historic traffic growth at this location has been about 0.3 percent per year. Congestion is apparent in the existing conditions because of lengthy peak-period queues; one PM queue in a turning lane exceeds 1000 feet.
Four bus routes of Metrowest Regional Transit Authority (MWRTA) operate in the study area.
This project will add one mile of new bicycle lanes and one mile of new or rebuilt sidewalks.
This project is located at one of the top-200 Massachusetts crash locations between 2010 and 2012.
One lane-mile of substandard pavement and one substandard bridge will be replaced as part of this project.
The project serves an existing area of concentrated development. Few land-use-related benefits are projected.
This project is not within an EJ area.
This project will maintain Needham Street with a three-lane cross-section from the Needham Street/Winchester Street/Dedham Street intersection in Newton to the bridge over the Charles River at the Needham town line. The roadway will be rehabilitated and widened to include bicycle lanes, new sidewalks, reconfigured intersections, and updated traffic signals. The Highland Avenue portion of the project will improve the roadway’s geometry from the Highland Avenue/Webster Street intersection in Needham to the Newton town line. Work will include upgrades and installation of traffic signals at five intersections. The project also will include reconstructing and widening the bridge over the Charles River to accommodate four travel lanes.
CMP monitoring in 2001–02 indicated that the average travel speed on both Needham Street and Highland Avenue was 15 miles per hour (mph) or less (LOS E/F) along multiple segments of this corridor northbound and southbound during the AM and PM peak periods. Counts performed as part of MassDOT’s Highland Avenue Corridor Improvements Functional Design Report (FDR) in 2002, showed that average daily traffic (ADT) on Highland Avenue east of First Street (just east of I-95 and between the two other count locations) was 36,700 vehicles; counts as recent as 2008 have found similar traffic volumes.
Two MBTA bus routes with 86 weekday trips travel through the project area.
Roadway rehabilitation will include bicycle accommodation, six miles of new sidewalks, reconfigured intersections, and updated traffic signals to facilitate non-motorized travel options.
There are three Highway Safety Improvement Program crash clusters in the project area, which also is identified as a high crash location for trucks.
Nine lane-miles of substandard pavement will be replaced and one substandard bridge rehabilitated as part of this project.
The project area in Newton along Needham Street is zoned as residential from Route 9 north, and as mixed-use and multi-unit residential from Route 9 south to the Needham town line. The project area in Needham is zoned as industrial from east of I-95 to the Newton town line and as residential west of I-95.
According to both the Highland Avenue Corridor Improvements FDR and the proposed Stop & Shop supermarket draft environmental impact report, this project would help facilitate redevelopment along this corridor.
This project is not within an EJ area.
The proposed improvements will remove the existing McCarthy Viaduct and replace it with an at-grade boulevard approximately 0.7 miles long, from the Gilman Street Bridge in the north to Squires Bridge in the south. The project will provide pedestrian and bicycle accommodation along the length of the reconstructed corridor, and result in more conventional intersection configurations at Washington Street and Somerville Avenue, which currently travel under or next to the viaduct. Removing the viaduct will physically reconnect the neighborhoods of Somerville with more direct vehicle, pedestrian, bicycle, and transit networks.
The elevated viaduct currently serves vehicles driving through Somerville to points north and south, but physically divides the Somerville neighborhoods directly to the east and west. The existing surface roadway network below the viaduct includes a series of unconventional intersections that cause confusion and present some safety concerns. The proposed McGrath Boulevard will create conventional intersections that provide clear direction and safer operation for all modes of transportation along the corridor.
MBTA Routes 80 (Arlington Center to Lechmere) and 88 (Clarendon Hill to Lechmere) provide bus service in this corridor, with connections to the MBTA Green Line at Lechmere Station, and will have direct access to the Green Line Extension in the future, connecting the corridor to Boston, Cambridge, and Medford. Removing the viaduct will provide additional connectivity for existing bus routes along and across the proposed McGrath Boulevard.
New sidewalks and bicycle facilities will be provided for the length of the proposed McGrath Boulevard, creating safe and comfortable accommodation for users. Removing the viaduct will dramatically improve connections across McGrath Boulevard in the east/west direction, encouraging travel at a neighborhood scale. Mobility between communities on either side of the existing viaduct—including Union Square, Inner Belt, Gilman Square, and East Somerville—will improve vastly. The proposed bicycle and pedestrian facilities along McGrath Boulevard will connect with the extended Community Path, creating access to a more regional bicycle transportation network. The proposed facilities also will provide direct intermodal connections to existing bus routes and the new Green Line Station.
There are two Highway Safety Improvement Program crash clusters in the project area, as well as a bicycle and a pedestrian crash cluster.
Three lane-miles of substandard pavement, 1.5 miles of substandard sidewalk, and a substandard bridge will be improved as part of this project. Eliminating the McCarthy viaduct also will serve to reduce long-term maintenance costs.
The project provides access to the Inner Belt/Brickbottom, Union Square, and Boynton Yards Priority Development Areas in Somerville, which are designated for mixed-use commercial and residential development. Redeveloping these three areas in Somerville should add 3,000 new housing units and an additional 6.5-million square feet of commercial development.
This project is in an EJ area; and will improve transit, pedestrian, and bicycle access within the project corridor.
This project will widen Route 18 to two continuous lanes in each direction (with four-foot shoulders) between Highland Place/Charmada Road (south of Middle/West Street) in Weymouth and Route 139 in Abington. Sidewalks will be constructed and the Route 18 bridge over the MBTA Plymouth commuter rail line will be reconstructed and widened.
Intersection improvements—including additional left- and right-turn lanes and some roadway widening between intersections on Route 18 from Route 3 to Route 139, and the Middle/West Street intersection. Park Avenue, Columbian Road, and Pond and Pleasant Streets—will be constructed as separate projects.
According to Highway Division traffic counts, the average daily traffic volumes on Route 18 along this stretch of roadway are as follows:
Weymouth:
Abington:
Intersection analyses were performed as part of the South Weymouth Access Study in August 2000. Existing LOS during the PM peak period were as follows:
Weymouth:
Abington:
According to 2002 CMP monitoring performed by CTPS, the average AM and PM speed on Route 18 northbound and southbound is less than 15 mph for three segments of the roadway in the project area. The average travel speed on Route 18 is less than 70 percent of posted speed along 25 segments northbound and southbound in the AM and PM peak periods.
Six signalized intersections in the project area are among the top-25 most delayed intersections (monitored as part of the CMP roadway network) for the South Shore Coalition MAPC subregion in the PM peak period.
Route 18 provides access to the South Weymouth commuter rail station on the Plymouth Line. The South Shore Tri-Town Development Corporation, responsible for redeveloping the South Weymouth Naval Air Station, is proposing an expanded, multimodal station in conjunction with the existing South Weymouth commuter rail station. Route 18 is currently served by one MBTA bus route.
The project will provide eight miles of new sidewalks and on-road bicycle accommodation to enhance pedestrian and bicyclist access along the corridor.
This project area includes six of the top-200 Massachusetts crash locations between 2010 and 2012. Four high-crash locations for trucks also are located in the project area.
Eight lane-miles of substandard pavement and one substandard bridge will be replaced as part of this project.
Zoning along the Route 18 corridor in Weymouth includes residential, highway transition, medical services (South Shore Hospital and other related medical facilities), limited business, and general business. Zoning along Route 18 in Abington is industrial or highway commercial.
This project is a component of the development plan for the former South Weymouth Naval Air Station, which involves redeveloping the 1,450-acre site, consistent with the re-use plan formula. The South Shore Tri-Town Development Corporation foresees corporate office park, entertainment, and recreation use for the site, with more than 60 percent open space (recreational and conservation).
This project is not within an EJ area.
This is an arterial and intersection improvement project along Montvale Avenue from Central Street to east of Washington Street in the City of Woburn. It includes the following improvements:
The proposed project area serves as a critical connection between I-93, I-95, and the surrounding Woburn area. According to counts collected by MassDOT in 2008, ADT along Montvale Avenue east of Washington Street was 29,100 vehicles. Under 2007 traffic conditions, the intersection at Montvale Avenue and Washington Street operated at LOS C in the AM and PM peak periods, while the Montvale Avenue and Central Street intersection operated at LOS A in the AM and LOS B in the PM peak period. Although the LOS is acceptable, the proposed improvements will better utilize lanes and increase coordination between intersections to accommodate increasing traffic volumes.
The project will enhance the operations of MBTA bus Routes 354 and 355 served by 38 weekday trips.
The project will reconstruct one-half mile of sidewalk, which will improve pedestrian and bicycle access to nearby schools and activities.
This project is located at one of the top-200 Massachusetts crash locations between 2010 and 2012.
One lane-mile of substandard pavement will be replaced as part of this project.
The proposed widening of Montvale Avenue will have minor impacts on adjacent land use. The project area contains a mix of land use, but primarily is zoned for commercial and some residential. Maximum parking requirements and transportation demand management (TDM) requirements for all new developments are imposed. The project will improve pedestrian and disability access by widening the existing four-foot-wide sidewalks to five or six feet, and adding wheelchair ramps.
This project is not in an EJ area.
A bridge on New Boston Street at the northern end of Woburn Industrial Park will be constructed. New Boston Street then will cross the MBTA’s Lowell Line and connect with Woburn Street in Wilmington. This connection existed until approximately 30 years ago when the bridge was destroyed by fire and not reconstructed. Also included is the reconstruction of approximately 1,850 feet of New Boston Street.
No traffic studies have been performed to date; however, re-opening this bridge would provide a second means of access to the growing Industri-Plex area for residents of Wilmington and communities to the north, as well as for emergency vehicles from the North Woburn fire station.
The Anderson Regional Transportation Center (RTC) is located just south of the proposed New Boston Street Bridge. The new bridge would provide an additional automobile access point for park-and-ride and transit services offered at the RTC.
Non-motorized modes will be major beneficiaries of this project. The new network link will eliminate the need to use very circuitous alternate routes for many local and regional trips.
There is no recent crash history at the project location. Safety benefits may be realized at other locations that will have less traffic.
An existing stretch of New Boston Street will be rebuilt as part of this project.
This project is entirely within an MPO-designated priority development area.
The majority of the land in the New Boston Street area in Woburn is zoned for industrial use; existing development in the area is primarily commercial/industrial. With the opening of the Anderson RTC and I-93 Interchange 37C serving the Industri-Plex developments, the city of Woburn anticipates more office and retail development in the project area over the next few years. Just north of the proposed project in Wilmington, the land is zoned industrial and includes Southeast Wilmington Industrial Park. Further north on Woburn Street in Wilmington, the land is zoned residential up to Route 129.
This project is not within an EJ area.
This project—whose purpose is to improve corridor mobility, boost transit ridership, improve regional air quality, ensure equitable distribution of transit services, and support opportunities for sustainable development—will extend the MBTA Green Line in two separate phases. Phase I will extend the Green Line from a relocated Lechmere Station in East Cambridge to College Avenue in Medford, with a branch to Union Square in Somerville. Phase II will further extend the Green Line from College Avenue to Mystic Valley Parkway (Route 16) at the Somerville/Medford municipal boundary.
Lechmere Station to College Avenue with a branch to Union Square (State Implementation Plan commitment). This phase of the project is part of the no-build network but is included here to provide a full description of the project. It is funded with a combination of Commonwealth funds and Federal Transit funds.
New Green Line stations are currently proposed for:
Details of the station designs—including the relationship of stations to pedestrian, bicycle, and bus networks around them—are being developed more fully. The MBTA is engaging the public in creating the look and feel of the stations and their surroundings.
The Green Line Extension will also require construction of a new light rail vehicle storage and maintenance facility. MassDOT has identified a location known as “Option L” in the Inner Belt area of Somerville as its preferred location for the vehicle support facility. The MBTA is currently working on the program and design of the maintenance facility and its associated vehicle storage areas. The MBTA must acquire certain parcels of private property in order to construct the vehicle facility at the Option L location.
College Avenue to Mystic Valley Parkway (Route 16)
This project is not part of the State Implementation Plan commitment. Boston Region MPO members think that this is an important project and voted to include this phase in the recommended LRTP by flexing highway funding to this transit project. Design has not yet begun for this project. The terminus would be a station at Mystic Valley Parkway (Route 16).
In addition to the major investment program discussed in the previous section, the MPO programmed four other types of investment programs in the recommended LRTP:
Projects included as part of these programs can be programmed in the TIP directly without first being listed in the LRTP because they do not add capacity to the transportation network. They would need to be listed in the LRTP only if they cost more than $20 million.
The first three programs include types of projects that are regularly programmed in the TIP. The fourth program—Community Transportation/Parking/Clean Air and Mobility—is a revival and expansion of the MPO’s Clean Air and Mobility program (which had been in hiatus for several years because of lack of funding). This new iteration of the program is part of this LRTP in response to public input received during the LRTP development stage.
Each of these programs is discussed below, along with how they will address the MPO’s goals and objectives.
This program will fund intersection projects that modernize existing signals or add signals to improve safety and mobility. Improvements also could consist of the addition of turning lanes, shortened crossing distances for pedestrians, and striping and lighting for bicyclists. Improvements to sidewalks and curb cuts also will enhance accessibility for pedestrians. Updated signal operations will reduce delay and improve bus transit reliability.
Examples of intersection projects that are programmed in the MPO’s 2016–20 TIP include:
An average cost of $2.8 million per intersection project was established based on similar projects the MPO has funded in the past, as well as those that are included in the Universe of Projects developed for this LRTP (see Appendix B) and awaiting potential funding in future TIPs.
Intersection projects can reduce congestion, which would improve mobility and reduce emissions. Improvements can include bicycle and pedestrian elements to improve mobility for bicyclists, and mobility and accessibility for pedestrians.
Intersection projects can improve safety at high crash locations for motorists, trucks, pedestrian, and bicyclists. Improvements can consist of upgraded geometry, shortened crossing distances, and enhanced signage and lighting.
Intersection projects can improve pavement condition and modernize signal equipment.
Intersection projects can reduce congestion by improving signal timings, which will improve mobility and access to centers of economic activity. Improvements can include pedestrian and bicycle elements that will improve mobility for bicyclists, and mobility and accessibility for pedestrians in centers of economic activity.
Improvements to intersections can enhance transit services and provide better and more bicycle and pedestrian connections.
Intersection projects can reduce emissions because of enhanced operations for all vehicles, and through mode shift, accompanied by improvements in transit reliability, and bicycle and pedestrian infrastructure.
The Complete Streets program modernizes roadways to improve safety and mobility for all users. Improvements can consist of continuous sidewalks and bicycle lanes, cycle tracks, and other bicycle facilities, as well as updated signals at intersections along a corridor. Improvements could also address other roadway infrastructure in the corridor, such as bridges, drainage, pavement, and roadway geometry. They will reduce delay and improve bus transit reliability. Expanded transportation options and better access to transit will improve mobility for all and encourage mode shift.
Examples of Complete Streets projects that are programmed in the MPO’s 2016–20 TIP include:
An average cost of six million dollars per mile of Complete Streets improvements was established based on similar projects that the MPO has funded in the past as well as projects that are included in the Universe of Projects in this LRTP (see Appendix B) and awaiting potential funding in future TIPs.
Complete Streets projects can increase transportation options by adding new sidewalks and bicycle facilities. They also can improve mobility for transit services.
Complete Streets projects can modernize the roadway network to provide safe conditions for all modes of travel along the corridor. Improvements could consist of lane reconfiguration, traffic signal and access improvements for motorists, new sidewalks, curb ramps, improved roadway crossings for pedestrians, and continuous bicycle facilities to reduce conflicts between bicyclists and motor vehicles.
Complete Streets projects can address pavement condition, upgrade sidewalk and bicycle accommodations, and improve bridges and culverts (including adaptations to transportation infrastructure that is vulnerable to climate change and other hazards).
Complete Streets projects can increase transportation options and access to places of employment and centers of economic activity by adding new sidewalks and bicycle facilities and generally improving operations.
Complete Streets projects in EJ areas can provide better access to transit, generally improved operations, and improved pedestrian and bicycle infrastructure.
Complete Streets projects with bicycle and pedestrian infrastructure improvements can help to reduce VMT through improved operations and mode shift.
This program will expand bicycle and pedestrian networks to improve safe access to transit, school, employment centers, and shopping destinations. Bicycle and pedestrian connection projects could include constructing new, off-road bicycle or multi-use paths, improving bicycle and pedestrian crossings, or building new sidewalks. Improvements can also consist of traffic calming, sidewalk network expansion, and upgrades similar to those in a Complete Streets Program, or enhanced signage and lighting.
An example of a bicycle project that is programmed in the MPO’s LRTP is the Assabet River Rail Trail in Stow and Hudson to be funded through this program.
Project costs for sample bicycle and pedestrian projects were examined using evaluated TIP projects, the MPO’s Bicycle Network Evaluation, and bicycle travel information from the 2011 Massachusetts Household Survey to develop an average cost of $2 million per mile.
Projects in the Bicycle Network and Pedestrian Connection Program can increase transportation options, provide access to transit or other activity centers, and support last-mile connections.
Projects in this program can create a safe pedestrian and bicycle corridor that connects activity centers while avoiding high crash locations on the roadway system. They can include safety improvements to facilitate pedestrian access to transit or other activity centers.
Projects in EJ areas in this program can provide better access to transit and improved pedestrian and bicycle infrastructure.
Bicycle and pedestrian infrastructure improvements can help to reduce VMT through mode shift.
This program includes a combination of the following types of projects:
Projects in this program can increase transit ridership by expanding automobile and bicycle parking at commuter rail and rapid transit stations. The program will also provide funding for starting up new, locally developed transit services and supporting last-mile connections.
The program can provide funding for starting up new, locally developed transit services and support last-mile connections to places of employment and areas of economic activity.
The program can provide funding for starting up new, locally developed transit services that include transit vehicles and coordination of service to transportation equity populations in suburban areas.
Bicycle and pedestrian infrastructure improvements, locally developed transit services and first mile/last mile connections can help to reduce VMT through mode shift.
Table 5.5 and 5.6 lists transit projects funded under the capacity expansion program, their costs for the period of construction, and their projected completion dates. (Figure 5.1 shows the locations of projects.) The projects in Table 5.5 are projects that are included as part of the no-build and are being funded by the Commonwealth.
TABLE 5.5
Transit Expansion Projects in the Recommended Plan with Costs
Project |
FFY |
FFY |
FFY 2026–2030 |
FFY 2031–2035 |
FFY 2036–2040 |
Non-MPO Transit Funds |
MPO Highway Funds |
Green Line Extension from Lechmere Station to College Avenue/Union Square (Cambridge and Somerville) |
$1,399,987,000 |
$128,763,000 |
|
|
|
$1,528,750,000 |
|
Fairmount Line Improvements Project (Boston)(highway funding flexed to transit) |
$26,500,000 |
|
|
|
|
$26,500,000 |
|
TABLE 5.6
Transit Expansion Projects in the Recommended Plan with Costs
Project |
FFY |
FFY |
FFY 2026–2030 |
FFY 2031–2035 |
FFY 2036–2040 |
Non-MPO Transit Funds |
MPO |
Green Line Extension from College Avenue to Mystic Valley Parkway (Somerville and Medford |
$158,000,000 |
$32,000,000 |
|
|
|
|
$190,000,000 |
The MBTA’s Capital Investment Program (CIP) is a guide to the MBTA’s planned capital spending in future fiscal years (FYs). The document describes the MBTA’s infrastructure and the capital needs for maintaining the system, outlines ongoing and programmed capital projects, and details planned projects to expand the transportation network.
The MBTA recently released a one-year CIP for FY 2016. Unlike the prior CIP, this is not a five-year plan. The MBTA will develop and release a five-year CIP for FYs 2017–2021 that complies with the requirements of Chapter 161A of the General Laws of the Commonwealth by January 2016. The 2016 one-year plan, the first to be issued as part of the Baker-Polito Administration, reflects a commitment to sustainable mobility and the strategic and prudent expenditure of available capital resources. It provides a transition as the MBTA continues to categorize and define its needs over the next five years, and also updates the criteria used in evaluating and prioritizing investments in the regional transit system.
Projects in the CIP are selected through a prioritization process that strives to balance capital needs across the entire range of MBTA transit services. Given the MBTA’s vast array of infrastructure and the need for prudent expansion, the number of capital needs identified each year usually exceeds the MBTA’s capacity to provide capital funds. Therefore, the MBTA engages in an annual prioritization and selection process to select the needs with the highest priority for funding and inclusion in the CIP.
One of the highest priorities for the MBTA is the pursuit of a “State of Good Repair” (SGR). To measure the need for capital expenditures devoted to maintaining and replacing existing infrastructure, transit systems often use the SGR standard, wherein all capital assets are functioning at their ideal capacity within their design life. While few transit systems are likely to achieve this ideal, the standard does identify a level of ongoing capital needs that must be addressed over the long-term in order for the existing infrastructure to continue to provide reliable service.
To assist in this, the MBTA employs an SGR database to help guide its capital decisions. Based on an inventory of all existing MBTA capital assets, the model allows the MBTA to track the capital investment needs for its existing infrastructure and to develop scenarios for capital investment to maintain the system in a state of good repair.
Prioritization of projects to be included in the CIP is based on the following criteria, as defined in the MBTA’s enabling legislation: the impact of the project on the effectiveness of the Commonwealth’s transportation system, service quality, the environment, health, and safety; the state of repair of the MBTA infrastructure; and the MBTA’s operating costs and debt service. Projects that receive the highest priority are those with the greatest benefit and the least cost, as prioritized by the following criteria:
Transportation equity is also considered.
Below is a description of the programs funded by the MBTA to maintain the transit system.
The revenue vehicle fleet is one of the most visible components of the MBTA service network. These are the trains, buses, and other vehicles that passengers board every day (i.e., all vehicles that carry passengers in revenue service). Scheduled major overhauls, maintenance, and planned retirements allow the fleet to reach its useful life and prevent the unwarranted consumption of resources to maintain its reliability.
The revenue vehicle program is 30 percent of the MBTA’s 2016 CIP, the largest share of any program area. In the 2009–2015 CIP, the MBTA allocated about 31 percent of its capital funds to this program. The MBTA will employ its SGR database to help guide its capital decisions for this program in the future. However, it is expected that funding for this program will continue to require a large share of the capital resources in the future.
Non-revenue vehicles and equipment support the entire range of MBTA operations and include over 1,000 systemwide vehicles and pieces of equipment. This program also includes funding for equipment for weather resiliency efforts as well as snow-fighting equipment.
The non-revenue vehicle program is 11 percent of the MBTA’s 2016 CIP. In the 2009–2015 CIP, the MBTA allocated less than 1 percent of its capital funds to this program. The MBTA will employ its SGR database to help guide its capital decisions for this program in the future. Funding will always be allocated for this program; however, as shown in the varying allocations in the different CIPs, the funding will vary depending on the needs identified by the SGR database.
Tracks/Right-of-Way: Several types of track can be found throughout the MBTA system, depending on the service (i.e., commuter rail, rapid transit). The right-of-way for heavy rail rapid transit track often includes an electrified third rail through which subway cars receive the traction power needed for movement.
Signals: The primary responsibility of the MBTA signal system is to control trains for efficient spacing and run times, making it an integral part of the transit system. The signal system’s goal is to maintain train separation while attempting to minimize headways and run times.
Systemwide track maintenance is 8 percent of the MBTA’s 2016 CIP. In the 2009–2015 CIP, the MBTA allocated 17 percent of its capital funds to this program. The signal systems are crucial for supporting the safe and efficient operations of trains systemwide and account for 8 percent of the MBTA’s 2016 CIP. In the 2009–2015 CIP, the MBTA allocated 6 percent of its capital funds to this program.
The MBTA will employ its SGR database to help guide its capital decisions for this program in the future. Funding will always be allocated for this program; however, as shown in the varying allocations in the different CIPs, the funding will vary depending on the needs identified by the SGR database.
Continued maintenance and rehabilitation of the MBTA’s bridges will be required. This will include replacing bridge decks and reconstructing bridges. The MBTA bridge inspection program is tailored to ensure that bridge repairs are prioritized and that all bridges receive adequate attention.
The Bridge Program is 9 percent of the MBTA’s 2016 CIP. In the 2009–2015 CIP, the MBTA allocated 5 percent of its capital funds to this program. The MBTA prioritizes its bridges through its bridge inspection program. Funding will always be allocated for this program; however, as shown in the varying allocations in the different CIPs, the funding will vary depending on the needs identified by the SGR database.
MBTA stations are one of the most visible components of the transit system; they provide access to rapid transit, light rail, commuter rail, and Silver Line services in the MBTA transit system. Many of the bus stops also have bus shelters of various kinds. The majority of funding for stations is devoted to renovation of subway stations, including accessibility upgrades and the systemwide replacement of escalators and elevators.
The Stations Program, including elevators and escalators, is 12 percent of the MBTA’s 2016 CIP. In the 2009–2015 CIP, the MBTA allocated 25 percent of its capital funds to this program. The MBTA will employ its SGR database to help guide its capital decisions for this program in the future. Funding will always be allocated for this program; however, as shown in the varying allocations in the different CIPs, the funding will vary depending on the needs identified by the SGR database.
The Supporting Infrastructure Program includes both facilities and power.
Facilities: Facilities include administrative buildings, vent buildings, storage buildings, noise walls, retaining walls, culverts, parking garages and parking lots, layover facilities, and fencing (which prevent trespassers from gaining access to tracks and fast-moving trains).
Power: While power for the MBTA’s network is supplied by an outside utility, the MBTA transforms and distributes electricity over its own system to power the entire network of subway, trackless trolley, and light rail lines. The capital equipment in this power program is essential to operations. It supplies electricity to subway trains and trolleys for the traction power needed for movement; to the signal systems for the power needed to control the trains; and to the stations to operate their lights, elevators, escalators, and other equipment. The MBTA’s power program, arguably one of the least visible elements to passengers, is one of the most complex, important, far-reaching, and expensive systems for the MBTA to maintain.
The supporting infrastructure program is 15 percent of the MBTA’s 2016 CIP. In the 2009–2015 CIP, the MBTA allocated 12 percent of its capital funds to this program. The MBTA will employ its SGR database to help guide its capital decisions for this program in the future. Funding will always be allocated for this program; however, as shown in the varying allocations in the different CIPs, the funding will vary depending on the needs identified by the SGR database.
The MBTA Communications Department’s responsibilities include maintaining an inventory of equipment and overseeing contract services for the Wide Area Network, two-way radio systems, microwave links, emergency intercoms, public address systems, light-emitting-diode (LED) message signs, fire alarm systems, security systems, and the supervisory control and data acquisition system. The department manages the MBTA’s Operations Control Center, which consists of technology that allows for real-time monitoring and supervisory control of the signal and communications systems for the rapid transit and bus systems. Current investments include a Green Line Real-Time Tracking System, systemwide communications enhancements, and a Maintenance Management System.
The communications and technology program is 3 percent of the MBTA’s 2016 CIP. In the 2009–2015 CIP, the MBTA allocated 3 percent of its capital funds to this program. The MBTA will employ its SGR database to help guide its capital decisions for this program in the future. Funding will vary depending on the needs identified by the SGR database.
The Enhancement Program includes capital projects that improve existing service and foster increased ridership. Current investments include the Green Line Collision Avoidance Program, Commuter Rail Positive Train Control, and a climate change adaptation strategy.
The enhancement program is 5 percent of the MBTA’s 2016 CIP. The MBTA will employ its SGR database to help guide its capital decisions for this program in the future. Funding will vary depending on the needs identified by the SGR database.
In Charting Progress to 2040, the MPO has provided a 25-year vision of the Boston Region’s transportation needs. Land-use patterns, growth in employment and population, and trends in travel patterns differ in how they affect demands on the region’s transportation system. In order to estimate future demands on the system for this LRTP, the MPO utilized a regional travel demand forecast model. The model is a planning tool used to evaluate the impacts of transportation alternatives given varying assumptions about population, employment, land use, and traveler behavior. The model is used to assess potential projects in terms of air-quality benefits, travel-time savings, and congestion reduction.
Before describing the general capabilities of, and inputs to, the current travel demand model, a list of recent major changes to the model set follows:
As discussed earlier in this section, the Boston Region MPO utilizes a robust quantitative travel model framework that employs a traditional four-step planning process—trip generation, trip distribution, mode choice, and trip assignment. This travel demand model set simulates existing travel conditions and forecasts future-year travel on eastern Massachusetts transit and highway systems. For a more accurate picture of travel demands in the Boston region, all communities within the commuting shed (the area from which people commute) for eastern Massachusetts are represented in the modeled area, including an additional 63 communities that are outside of the 101-municipality MPO region.
The model represents all MBTA rail and bus lines, private express-bus carriers, commuter boat services, limited-access highways and principal arterials, and many minor arterials and local roadways. The region is subdivided into 2,727 transportation analysis zones (TAZ). A TAZ is a unit of geography that is defined based on demographic information— poulation, employment, and housing—and the numbers of trips generated in, and attracted to, it. The model set is made up of several models, each of which represents a step in the travel decision-making process (the four-step process). The model set simulates transportation supply characteristics and transportation demand for travel from every TAZ to every other TAZ.
This simulation is the result of several inputs (different categories of data). Two broad sets of these inputs are land-use patterns, to identify amount and types of trips produced and how they are distributed (trip generation and trip distribution); and a transportation network with associated trip-making behavioral parameters, to allocate each trip onto different travel modes and onto a system of transportation network links (mode choice and trip assignments).
MAPC is responsible for developing the land-use inputs for the travel demand model. With guidance from an advisory panel (local jurisdiction staff, academic experts, and state agencies), MAPC and the MPO, in a joint effort, implemented an iterative land-use transportation model to quantify land-use patterns, by answering this basic set of questions:
For each TAZ, this process generated number of households, household characteristics, employment-related activities, auto ownership, and other variables that produce travel demand on transportation systems (see Appendix E and the section below for more details).
This set of inputs was derived from various resources such as the Massachusetts Roadway Inventory File (RIF) and the MBTA routes and schedules.
The model is used to answer questions such as:
All these inputs are updated on a regular basis to ensure reliability of forecasts.
The travel model analysis for the LRTP consisted of several steps. First, staff tested an existing conditions network with existing land-use patterns, to simulate recent 2012 travel conditions. This constituted the model’s Base Year. Projects included for analysis in the Base Year model were deemed “regionally significant,” as defined by the federal government, because of being regional in nature, adding capacity, and having air-quality impacts for the region as measured by the model. Existing land-use information was derived from comprehensive land development and demographic databases maintained by MAPC and the Boston Region MPO.
Next, a 2040 No-Build alternative was incorporated into the model. This 2040 No-Build alternative was structured around the 2012 Base Year, and projects that were constructed between 2012 and 2015, as well as those that are currently under construction and those that are programmed in the first year of the 2015–2018 TIP. The process for developing 2040 land-use forecasts is described below.
Land-use forecasts, in the context of travel demand analyses, involve two basic factors or “agents” of growth–households and employments. To better deal with uncertainties in future projections of these variables, MAPC employed a scenario exercise between two alternatives, “Status Quo” and “Stronger Region.” The latter option aligned better with the adopted land-use growth vision of the region called “MetroFuture,” which entails the following assumptions:
With these assumptions, household and employment control totals were developed for the region and individual municipalities. The process utilized current and historic growth trends from a number of databases at the federal (Census Bureau, Bureau of Labor Statistics), state (Massachusetts Department of Public Health), and local (MAPC Development Database, local jurisdiction parcel database) levels. Finally, an iterative land-use transportation model in a software platform called Cube Land was used to allocate these household/employment projections onto each TAZ. In this modeling framework, projected households and employers (“agents”) compete to locate in a landscape of various land-use supplies, which are determined by economic factors (“bid-rents”) and zonal attraction characteristics (land-rent affordability, transportation connectivity). More detail is provided in Appendix E – Methodology for Land Use Projections in the Boston Region.
The 2012 Base Year and 2040 No-Build scenarios thus provided a baseline against which the predicted effects of potential investments in the transportation system were measured.
Finally, staff developed an alternative set of projects called the 2040 Build Scenario through an investment scenario process discussed earlier in the Project Selection section. This set of projects was analyzed with same 2040 No-Build land-use assumptions in the travel demand model set. Several important travel statistics were reported and compared from all these conditions, including:
Selected travel-modeling results for the 2012 Base Year, 2040 No-Build, and 2040 Build scenarios—are shown in Table 5.7 below.
TABLE 5.7
2012 Base Year, 2040 No-Build, and 2040 Build Scenarios
Measure |
2012 Base |
2040 No-Build |
2040 Build |
Percentage Change From 2012 to 2040 No-Build |
Percentage Change From 2040 No-Build to 2040 Build |
Socioeconomic Variables (BRMPO) |
|
|
|
|
|
Population |
3,163,900 |
3,601,600 |
3,601,600 |
13.8% |
0.0% |
Households |
1,243,900 |
1,522,300 |
1,522,300 |
22.4% |
0.0% |
Household Size |
2.5 |
2.4 |
2.4 |
-7.0% |
0.0% |
Total Employment |
1,850,000 |
2,027,800 |
2,027,800 |
9.6% |
0.0% |
Basic |
371,800 |
316,300 |
316,300 |
-14.9% |
0.0% |
Retail |
316,800 |
334,600 |
334,600 |
5.6% |
0.0% |
Service |
1,161,400 |
1,376,900 |
1,376,900 |
18.6% |
0.0% |
Households with Vehicles (BRMPO) |
|
|
|
|
|
0 vehicles |
16% |
20% |
20% |
25.0% |
0.0% |
1 vehicle |
37% |
39% |
39% |
6.4% |
0.0% |
2 vehicles |
35% |
25% |
25% |
-29.3% |
0.0% |
3+ vehicles |
13% |
16% |
16% |
30.9% |
0.0% |
Trip Activity |
|
|
|
|
|
Person Trips in Eastern MA |
16,451,300 |
19,024,000 |
19,024,000 |
15.6% |
0.0% |
Auto person trips |
13,425,500 |
15,077,100 |
15,076,600 |
12.3% |
0.0% |
Transit person trips |
905,000 |
1,152,100 |
1,152,400 |
27.3% |
0.0% |
Non-motorized |
2,120,800 |
2,794,800 |
2,795,000 |
31.8% |
0.0% |
Person Trips in BRMPO |
12,801,500 |
14,802,600 |
14,802,600 |
15.6% |
0.0% |
Auto person trips |
10,122,800 |
11,270,500 |
11,270,000 |
11.3% |
0.0% |
Transit person trips |
898,100 |
1,144,700 |
1,145,000 |
27.5% |
0.0% |
Non-motorized |
1,780,600 |
2,387,400 |
2,387,600 |
34.1% |
0.0% |
Mode Choice |
|
|
|
|
|
Mode Share in Eastern MA |
100% |
100% |
100% |
0.0% |
0.0% |
Auto share |
82% |
79% |
79% |
-2.9% |
0.0% |
Transit share |
6% |
6% |
6% |
10.1% |
0.0% |
Non-motorized share |
13% |
15% |
15% |
14.0% |
0.0% |
Mode Share in BRMPO |
100% |
100% |
100% |
0.0% |
0.0% |
Auto share |
79% |
76% |
76% |
-3.7% |
0.0% |
Transit share |
7% |
8% |
8% |
10.2% |
0.0% |
Non-motorized share |
14% |
16% |
16% |
16.0% |
0.0% |
Highway Results (Interzonal) |
|
|
|
|
|
Vehicles Assigned in Eastern MA |
12,733,200 |
14,291,400 |
14,291,000 |
12.2% |
0.0% |
Auto |
10,540,700 |
11,793,300 |
11,792,900 |
11.9% |
0.0% |
Trucks |
2,192,500 |
2,498,100 |
2,498,100 |
13.9% |
0.0% |
Vehicles Assigned in BRMPO |
10,169,600 |
10,637,900 |
10,637,500 |
4.6% |
0.0% |
Auto |
7,977,100 |
8,847,600 |
8,847,200 |
10.9% |
0.0% |
Trucks |
2,192,500 |
1,790,300 |
1,790,300 |
-18.3% |
0.0% |
VMT in Eastern MA |
106,030,300 |
116,912,800 |
116,957,500 |
10.3% |
0.0% |
Auto |
86,846,500 |
93,362,500 |
93,413,300 |
7.5% |
0.1% |
Trucks |
19,183,800 |
23,550,255 |
23,544,235 |
22.8% |
0.0% |
VMT in BRMPO |
69,448,500 |
74,968,400 |
74,970,100 |
7.9% |
0.0% |
Auto |
57,594,000 |
61,058,400 |
61,073,800 |
6.0% |
0.0% |
Trucks |
11,854,500 |
13,910,000 |
13,896,300 |
17.3% |
-0.1% |
VHT in Eastern MA |
3,277,800 |
3,765,200 |
3,763,600 |
14.9% |
0.0% |
Auto |
2,712,500 |
3,049,500 |
3,048,500 |
12.4% |
0.0% |
Trucks |
565,300 |
715,700 |
715,100 |
26.6% |
-0.1% |
VHT in BRMPO |
2,301,000 |
2,556,500 |
2,553,600 |
11.1% |
-0.1% |
Auto |
1,924,300 |
2,109,200 |
2,107,200 |
9.6% |
-0.1% |
Trucks |
376,700 |
447,300 |
446,400 |
18.7% |
-0.2% |
Average Speed in Eastern MA |
32.3 |
31.1 |
31.1 |
-4.0% |
0.1% |
Auto |
32.0 |
30.6 |
30.6 |
-4.4% |
0.1% |
Trucks |
33.9 |
32.9 |
32.9 |
-3.0% |
0.1% |
Average Speed in BRMPO |
30.2 |
29.3 |
29.4 |
-2.8% |
0.1% |
Auto |
29.9 |
28.9 |
29.0 |
-3.3% |
0.1% |
Trucks |
31.5 |
31.1 |
31.1 |
-1.2% |
0.1% |
Congested VMT (0.75 V/C <) |
|
|
|
|
|
in Eastern MA |
65,875,292 |
78,083,600 |
79,281,500 |
18.5% |
1.5% |
BRMPO |
45,748,927 |
52,608,500 |
53,130,700 |
15.0% |
1.0% |
Transit Results |
|
|
|
|
|
Transit Trips (Linked) |
905,000 |
1,152,100 |
1,152,400 |
27.3% |
0.0% |
Local Bus |
360,000 |
435,600 |
435,300 |
21.0% |
-0.1% |
Express Buses |
25,600 |
26,900 |
27,100 |
5.1% |
0.7% |
Bus Rapid Transit |
27,400 |
63,000 |
63,200 |
129.9% |
0.3% |
Rapid Transit Lines |
700,000 |
896,000 |
896,600 |
28.0% |
0.1% |
Commuter Rail |
104,000 |
122,700 |
122,000 |
18.0% |
-0.6% |
Ferry |
4,500 |
11,700 |
11,700 |
160.0% |
0.0% |
Transit Trips (Unlinked) |
1,221,500 |
1,555,900 |
1,555,900 |
27.4% |
0.0% |
Walk Access Transit |
1,050,500 |
1,338,100 |
1,338,900 |
27.4% |
0.1% |
Drive Access Transit |
171,000 |
217,800 |
217,000 |
27.4% |
-0.4% |
Average Transfer Rate |
1.35 |
1.35 |
1.35 |
0.1% |
0.0% |
Air Quality (BRMPO) |
|
|
|
|
|
Volotile Organic Compounds (kg) |
8,546 |
3,908 |
3,905 |
-54.3% |
-0.08% |
Nitrogen Oxides(kg) |
54,672 |
27,927 |
27,914 |
-48.9% |
-0.05% |
Carbon Monoxide - Winter (kg) |
222,485 |
66,731 |
66,693 |
-70.0% |
-0.06% |
BRMPO - Boston Region MPO (101 Municipalities)
Eastern MA (164 Municipalities)
Linked Transit Trips - A transit trip made between an origin and a destination that does not account for transfers between vehicles or modes.
Unlinked Transit Trips - A transit trip made between an origin and a destination that accounts for transfers between vehicles or modes.
Analyzing current patterns of demographic shifts and the Boston region’s vibrant economy, the 2040 demographic forecasts projected an increase in population (13.8 percent), households (22.4 percent), and employment (9.6 percent). This assumed level of demographic growth is estimated to produce approximately 19 million trips on an average weekday, regardless of modes—a 16 percent increase from the 2012 Base-Year conditions for the model area.
Within this overall growth, there is a larger growth shift estimated in the millennial (birth years from early 1980s to early 2000s) and the baby boomer (births between the years 1946 and 1964) age cohorts, which likely resulted in a greater number of 0 and 3+ vehicles households in the region. Consequently, there is a shift in mode choice between 2012 Base Year and 2040 No-Build/Build conditions.
Transit and nonmotorized trips are expected to grow faster than auto trips. Nonmotorized trips are forecasted to have the greatest percentage increase of slightly more than 34 percent, from 1,780,600 trips in 2012 to 2,387,400 trips in the 2040 No-Build condition. Transit trips will grow from 898,100 trips to 1,144,700 trips (28 percent), with a modest increase in auto trips, from 10,122,800 in 2012 to 11,270,500 in 2040 (about 11 percent). These higher growth shares in nonmotorized and transit trips are a result of underlying land-use allocation assumptions, as more households are located near transit services and other activity centers in a compact fashion. Figure 5.2 below shows the change in share of auto, transit, and nonmotorized trips in the Base Year, 2040 No-Build, and 2040 Build conditions. As transit and nonmotorized trips are growing at faster rates than auto trips, these modes have a slightly greater percentage of total trips made in the future year.
FIGURE 5.2
Mode Share Split – Person-Trips Under 2012 Base Year, 2040 No-Build, and 2040 Build Conditions
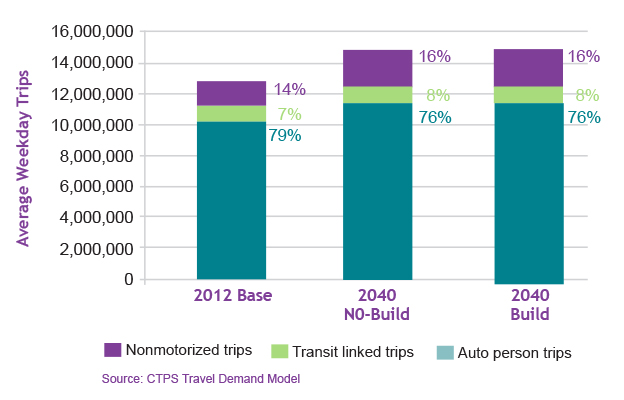
As in the highway assignment portion of the model framework, transit ridership forecasts were not constrained by existing and proposed transit service capacity. This produced a true level of demands on highway and transit facilities. In the Base Year, the model set estimated 905,000 linked transit trips on a typical weekday. With an observed average transfer rate of 1.35, this translates to 1,221,500 unlinked trips. In the 2040 No-Build condition, growth of more than 27 percent was estimated for these transit trips. Two factors contributed to this growth: assumed growth in overall population and associated demographic shift (more 0-vehicle households), and changes in transit service supply (Green Line extension to Union Square, Fairmount Line service improvements, etc.). Figure 5.3 shows how these additional transit trips are estimated to be allocated across various transit modes.
FIGURE 5.3
Increases in Transit Trips by Mode
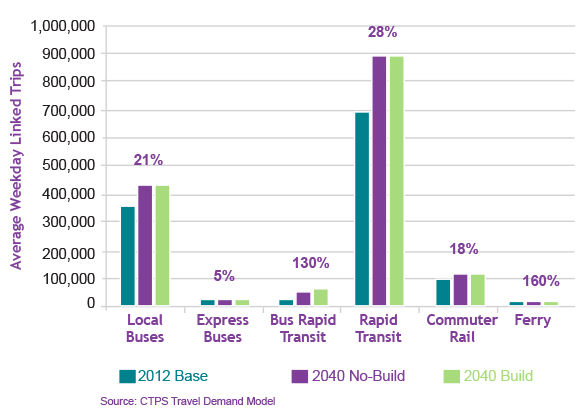
In addition to overall growth in transit trips because of transit-conducive demographic growth, there is mode-specific growth that warrants further discussion. The number of linked trips on the bus rapid transit system is forecasted to grow by 35,600 trips (130 percent) in the 2040 No-Build condition. This is based on forecasted congestions on roadway corridors where BRT services are offered, such as those to South Boston and the corridor south heading to Dudley Square and an extension of the Silver Line service from South Station and the Airport to Chelsea.
Rapid transit lines also are expected to grow significantly, from 700,000 trips in 2012 to 896,000 in 2040, a 28 percent increase. This is a result of new rapid transit services: –the Green Line extension in Somerville and Medford, service enhancements for the Blue Line, and capacity expansions in a number of park-and-ride locations along the rapid transit service corridors. A sizeable portion of existing population growth is not served by premium transit services (BRT, rapid transit, or commuter rail), such as high-density population along local bus routes 23 and 28. These areas will continue to grow, resulting in a substantial increase in local bus trips (21 percent). There is a new Inner Harbor ferry service proposed between Charlestown-East Boston-South Boston, as well as ferry service to the new casino in Everett. This added capacity may have attracted new ferry trips, rising from 4,500 in 2012 to 11,700 in 2040.
The 2040 Build condition should reflect the expected impact that the region’s transportation investments may have on the system. A set of improvement projects and programs was selected for this Build condition from the low-cost Operation-and-Management (O&M) investment scenario. The following programs were identified to receive funding during the life cycle of this LRTP: Complete Street, Bicycle/Pedestrian, Intersection Improvement, and Community Transportation/Parking/Clean Air Mobility. Specific projects under these programs are in various stages of development, and are discussed in other sections of the LRTP. Among major infrastructure/capacity projects included in the Build condition, the Phase 2 Green Line extension resulted in a slight increase in trips for rapid transit mode, between 2040 Build and No-Build conditions.
Although auto mode share is forecasted to decline compared to transit and nonmotorized modes, the model estimated a net increase in several metrics from highway assignments. This is because a large portion of the trip-making population will continue to depend on automobiles; which results in growth of total vehicle trips (from 10.2 million to 10.6 million, or 4.6 percent), and total VMT (from 69.5 million to 75 million, or 7.9 percent). With this increased level of automobile and other vehicle (non-transit) activities, roadway links will continue to be congested. This is reflected in the larger growth in total vehicle hours of travel (VHT) as compared to VMT. VHT is estimated to grow from 2.3 million in the 2012 Base Year to 2.6 million under 2040 No-Build conditions, leading to a decrease in average speed on roadway links (-2.8 percent). Freight trucks traverse the same roadway facilities as passenger autos, and their share of VHTs is estimated to grow at a faster rate of almost 19 percent. This needs to be addressed in the MPO’s transportation investment program, as freight mobility is vital to the region’s economic growth.
The cumulative effects of major highway capacity projects on vehicle travel, as analyzed in the 2040 Build condition, is minimal. With more roadway capacities introduced, there is an increase in VMTs, and a corresponding slight decrease in VHTs, both less than one percentage point. A decrease in truck VHT is estimated, from 447,300 in No-Build to 430,900 in Build condition. This reduction in vehicle travel time between Build and No-Build conditions is expected, as the Build condition consisted of few large infrastructure projects from the adopted low-cost O&M Investment Programs.
Travel activities in this category consist of walking and bicycling trips occurring between, and within, traffic analysis zones (TAZs). These trips are a function of existing and assumed future land-use patterns; more compact and mixed-use land-use scenarios lead to a greater number of bicycle and pedestrian trips. With the MPO’s adopted Stronger Region land-use scenario, nonmotorized trips are forecasted to grow by 34 percent between Base year and the 2040 No-Build conditions. The LRTP’s Bicycle/Pedestrian and Complete Streets programs could add 3,400 pedestrian and bicycle trips per day in the Build condition.