Chapter 1—Transportation Planning for the Boston Region
To get from one place to another, it is helpful to have a clear vision of where you want to go and a plan that outlines the steps needed for the journey. The plan should include a road map to guide the way and, help you understand the terrain you will need to negotiate, and the obstacles in your way. Also important to the plan would be knowledge of the resources you could draw on to stay on track and keep moving forward.
This document, Charting Progress to 2040, is such a plan. It is the Boston Region Metropolitan Planning Organization’s (MPO) Long-Range Transportation Plan (LRTP) that will be used to move the region’s transportation network from its present state towards the MPO’s vision for the system’s future:
The Boston Region Metropolitan Planning Organization envisions a modern transportation system that is safe, uses new technologies, provides equitable access, excellent mobility, and varied transportation options—in support of a sustainable, healthy, livable, and economically vibrant region.
To help achieve the MPO’s vision, this LRTP defines goals and objectives that guide the planning process and establish performance metrics to evaluate progress. The plan also describes the problems the region would face as it moves toward its vision, and the needs that it must address. In addition, the LRTP evaluates various strategies’ potential to meet those needs, and identifies financial resources and impediments to implementing solutions.
Charting Progress to 2040 is a product of the Boston Region MPO, which is the designated metropolitan planning organization for the Boston metropolitan area. States create MPOs for urbanized areas of more than 50,000 people. The Federal-aid Highway Act of 1962 mandated the existence of MPOs to ensure that decisions about federal funding of transportation projects and programs would be based on a “continuing, cooperative, and comprehensive” (3C) planning process. To implement the prescribed 3C planning process, MPOs are required to:
The current federal legislation governing MPOs is Moving Ahead for Progress in the 21st Century (MAP-21). This law establishes national goals for federal highway programs that relate to safety, system preservation, congestion reduction, system reliability, improved freight movement for economic vitality, environmental sustainability, and reduced project delay and delivery. MAP-21 continues many of the metropolitan planning requirements established through previous iterations of federal highway legislation, such as:
MAP-21 also introduced some new metropolitan planning responsibilities, such as requiring MPOs to implement performance-based planning practices that include performance measures and targets to track and report on progress toward well-defined goals and objectives.
In addition to MAP-21, a number of other federal and state laws, regulations, executive orders, policy directives, and planning frameworks influence and guide metropolitan transportation planning:
All of the above are discussed in Appendix A of the Charting Progress to 2040 Needs Assessment document (available online at http://www.bostonmpo.org/Drupal/charting_2040_needs).
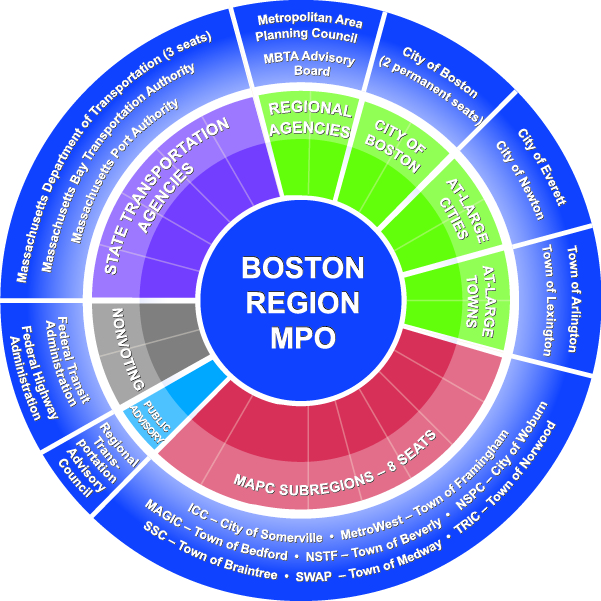
The Boston Region MPO is responsible for transportation planning in the metropolitan area. Currently, the MPO has 22 voting members, which include representatives from state transportation agencies, regional entities involved in transportation, and municipalities. The Federal Highway Administration (FHWA) and Federal Transit Administration (FTA) participate in the MPO in a nonvoting capacity. (For more information about Boston Region MPO membership see Figure 1.1.)
Figure 1.1 Circle Chart showing the MPO membership.
The Central Transportation Planning Staff (CTPS) is the technical staff to the MPO. CTPS conducts planning studies and technical analyses, and develops and maintains a set of specialized analytical tools that help to inform the MPO’s transportation planning and policy decisions.
(For more information about the MPO and its operation, visit the MPO website at www.bostonmpo.org.)
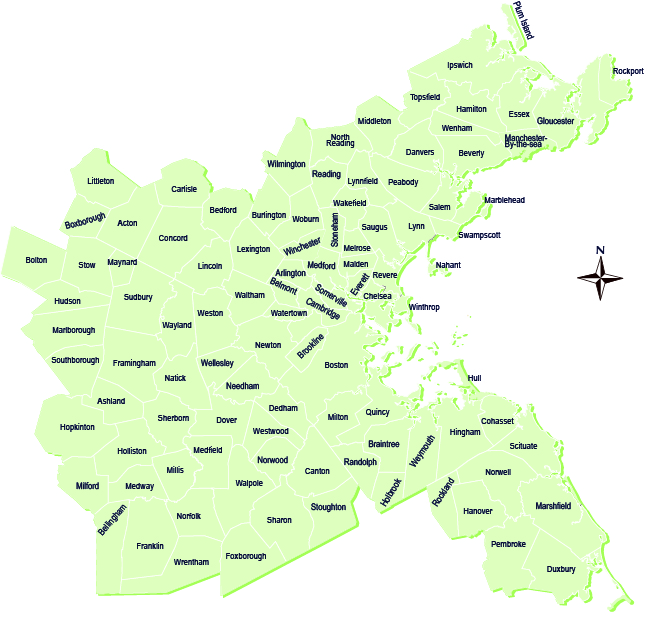
The area for which the Boston Region MPO has transportation planning responsibility encompasses 101 cities and towns from Boston to Ipswich in the north, Duxbury in the south, and Marlborough in the west (see Figure 1.2). This area covers 1,405 square miles and makes up about 18 percent of the state’s land area. It includes more than three million residents—48 percent of the state’s population.
Figure 1.2 is the MPO area map.
To understand a region’s transportation problems and needs, it is important to appreciate the diversity of its land use, population, employment, geography, and travel options that help to shape the transportation system and regional travel patterns.
The Boston region is notable for its diverse municipalities, ranging from relatively rural towns, such as Essex, to the densely populated, urban city of Cambridge. At its heart is the city of Boston, which covers 48.4 square miles. Although the city comprises only 3 percent of the region’s area, it is home to 20 percent of the region’s jobs and 20 percent of its residents.
The region’s municipalities can be divided into four different community types, based on existing development patterns and growth potential.
Figure 1.3 MAP of MAPC Community Types
-01.jpg)
The Boston region is home to a diverse population in terms of race, language, and age, as well as household size and income.
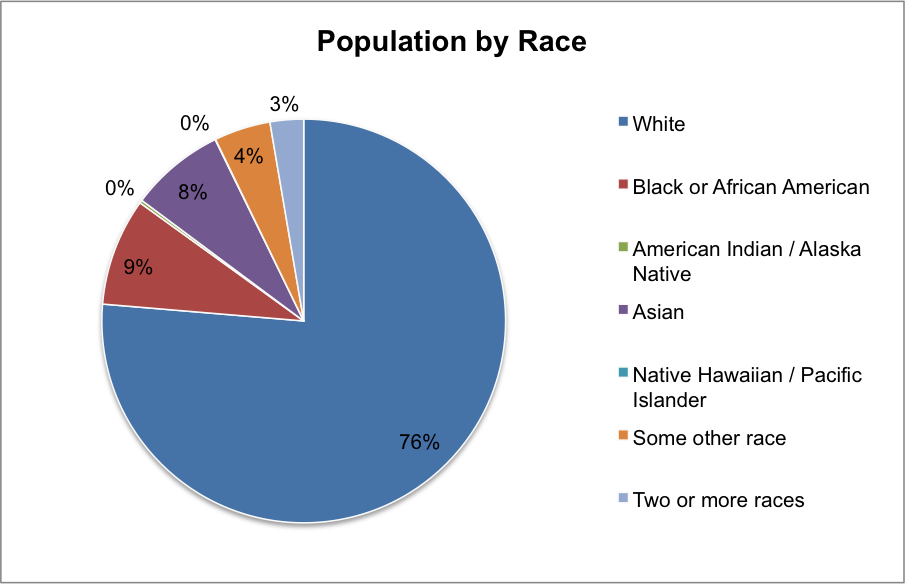
A quarter (25 percent), of the population speaks a language other than English at home (Figure 1.4) and a quarter of the population (24 percent) identifies as nonwhite (Figure 1.5).
Figure 1.4
Language Spoken at Home
for the Population Five Years and Older, 2009−2013
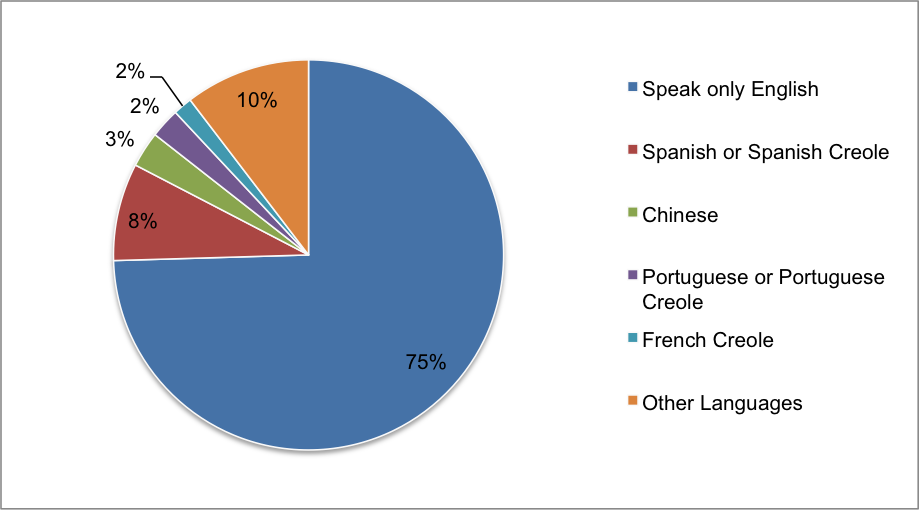
Source: US Census, 2013 American Community Survey 5-Year Summary File, Table B16001.
Figure 1.5
Population by Race, 2009–2013
Although the population is representative of all ages, the largest age groups are 5 to 17, 45 to 54, and 25 to 34 years, with a median age of 37.9 years (Figure 1.6). This provides the Boston region with a robust workforce, and the large number of young residents fuels growth of the region’s education sector. Household size is shrinking, with one- and two-person households making up 62 percent of all households in the region (Figure 1.7).
The region’s residents also fare well economically, with 50 percent of households earning more than $75,000. Despite this, 22 percent of the region’s households earn less than $29,000, highlighting the need to examine regional economic equity (Figure 1.8).
Figure 1.6
Population by Sex and Age, 2009–2013
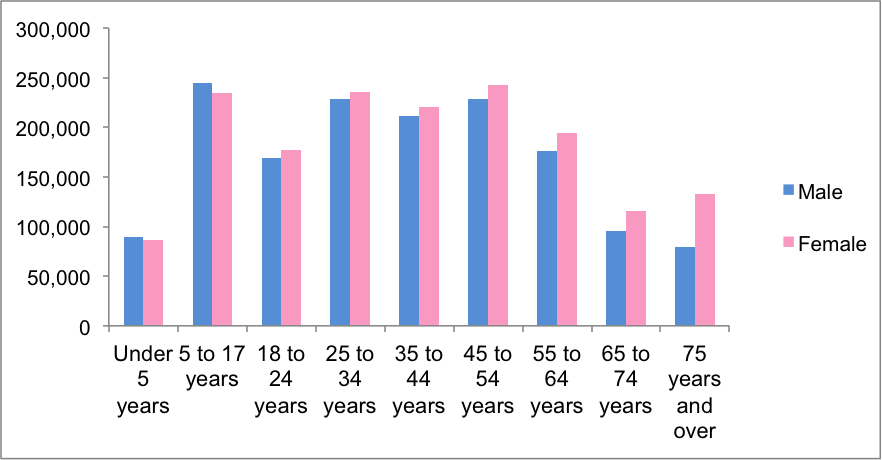
Source: US Census, 2013 American Community Survey 5-Year Summary File.
Figure 1.7
Households by Size, 2009–2013
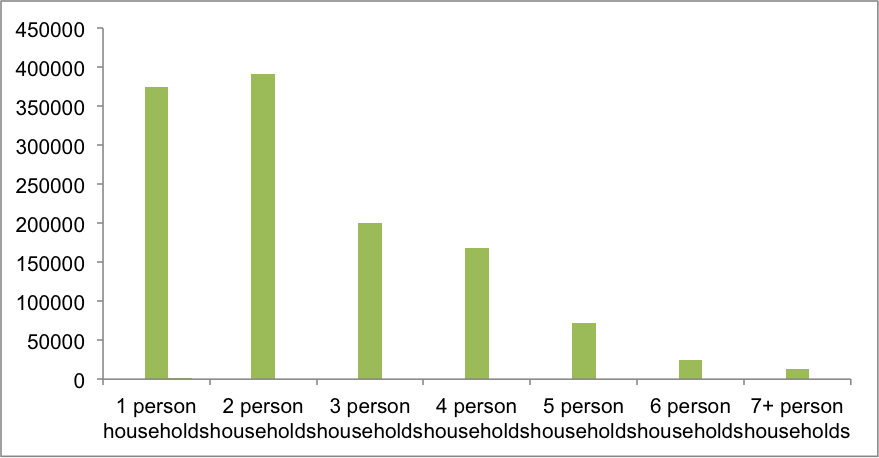
Source: US Census, 2013 American Community Survey 5-Year Summary File.
Figure 1.8
Household Income, 2009–2013 (in 2013 Dollars)
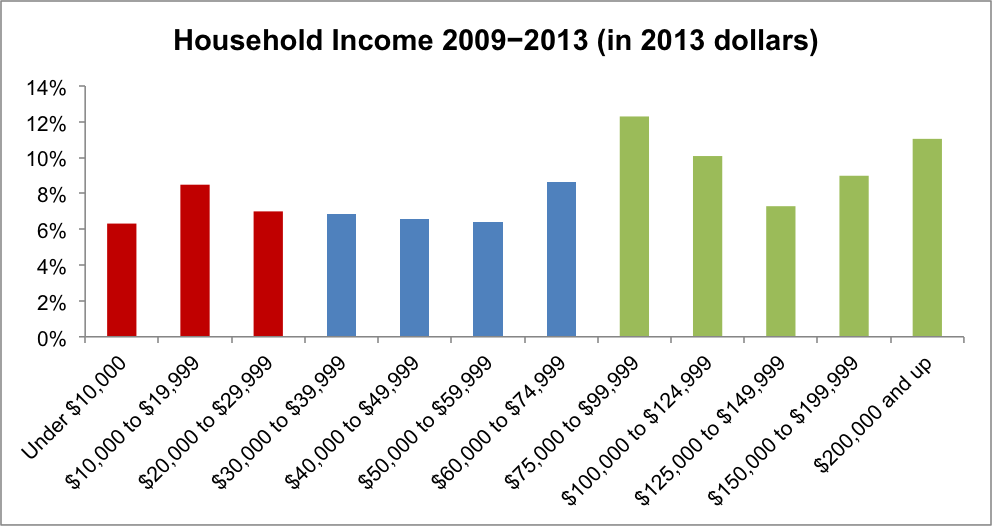
Source: US Census, 2013 American Community Survey 5-Year Summary File.
The Boston region is home to a broad spectrum of industries and professions. The largest employment sectors include educational services, health care, and social assistance, totaling 26.8 percent of all employment. The second-largest sectors include the professional, scientific, and management fields, as well as administrative and waste-management services, at 16.1 percent of total regional employment. Combined, these sectors comprise almost half of the region’s employment, at 42.9 percent (Figure 1.9).
The Boston region is a national leader in education and health care, and the prominence of these industries enables a consistently strong economy, with only 6 percent of the population older than 16 years unemployed (Figure 1.10). The importance of the region’s finance and housing markets also is reflected in strong employment in finance, insurance, and real estate. Finally, the region is notably shaped by the arts, entertainment, and recreation, as well as retail, all of which contribute to the region’s strong tourism trade and cultural environment.
Figure 1.9
Employment by Industry
as a Percentage of Total Employment, 2009–2013
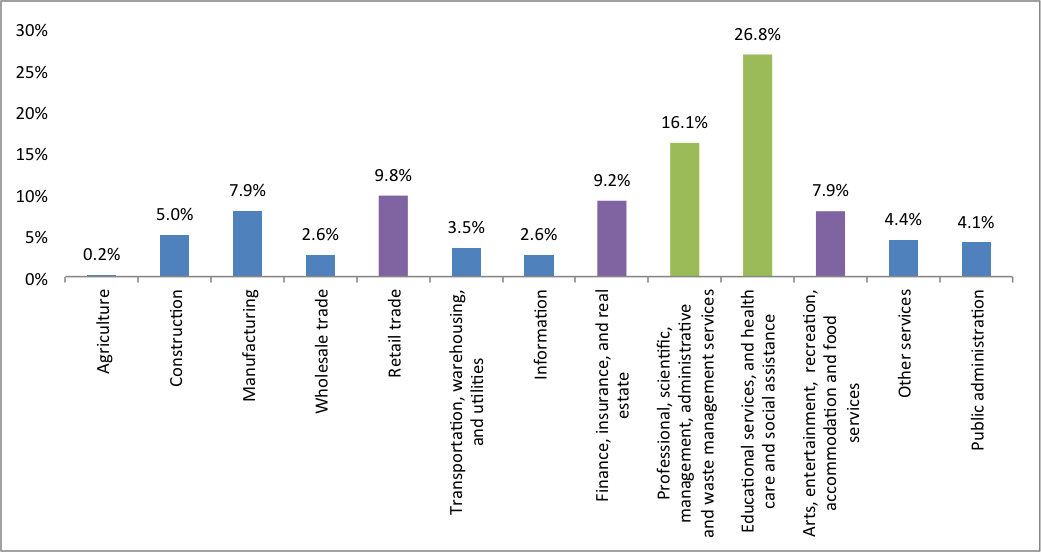
Source: US Census, 2013 American Community Survey 5-Year Summary File.
Figure 1.10
Employment Status, 2009–2013
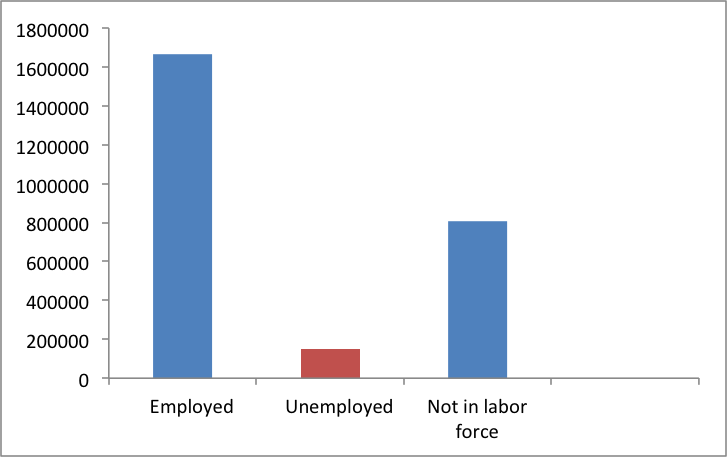
Source: US Census, 2013 American Community Survey 5-Year Summary File.
Although the City of Boston and the 13 surrounding cities form the heart of the region, it also includes a sizable amount of undeveloped land. The Boston region is home to more than 25 state forests and parks, and forests cover 39 percent of the land area. The region is rich in other types of natural landscapes as well, with water, wetlands, and open space comprising another 11 percent of total land area, and 550 miles of coastline.
The Boston region’s transportation system provides varied travel options. In addition to the roadway network, which allows residents to commute by car, bike, and foot, an extensive public transportation system provides bus, heavy and light rail, ferry, and commuter rail services. Although the majority of residents drive to work, 16.15 percent take some form of transit, making the Boston metropolitan area one of the highest users of public transportation for commuting compared to other metropolitan areas in the country (Figure 1.11).
Figure 1.11
Means of Transportation to Work, 2009–2013
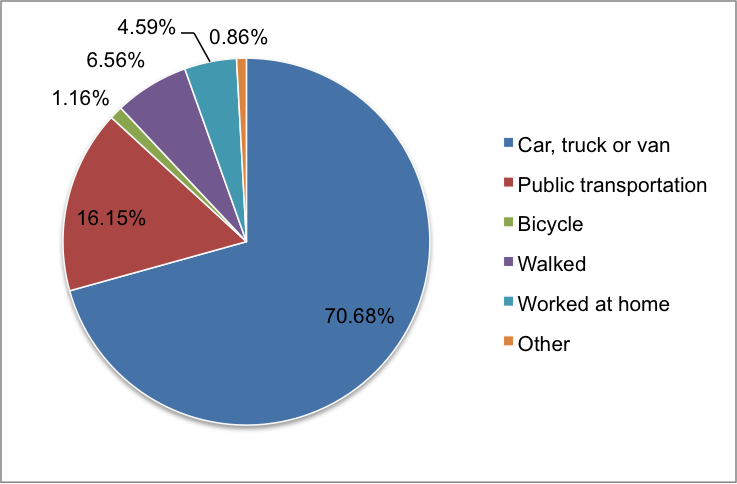
Source: US Census, 2013 American Community Survey 5-Year Summary File.
The region also has a significant number of zero- and one-vehicle households, totaling more than half of all households at 53 percent (Figure 1.13).
Figure 1.12
Vehicles Available by Household
as Percentage of Total Households, 2009–2013
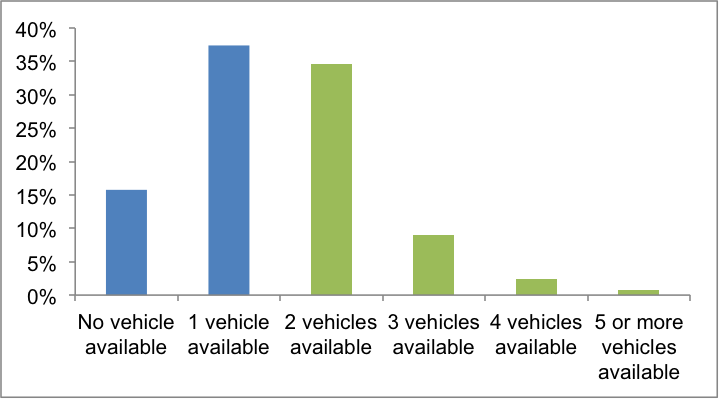
Source: US Census, 2013 American Community Survey 5-Year Summary File.
Most of the Boston region’s commuting trips take less than 35 minutes; however, almost a quarter (23 percent) are longer than 45 minutes (Figure 1.13). The average travel time to work in the region for all travel modes is 22.9 minutes. Walkers have the shortest average commute time, at 13.3 minutes, followed by those who drive alone or in carpools (20 minutes), taxicab, motorcycle, or bike (24 minutes), and public transportation (39.3 minutes). Although the region has a relatively large share of transit commuters, transit commutes remain significantly longer than other average commute times.
Figure 1.13
Commute Time, 2009−2013
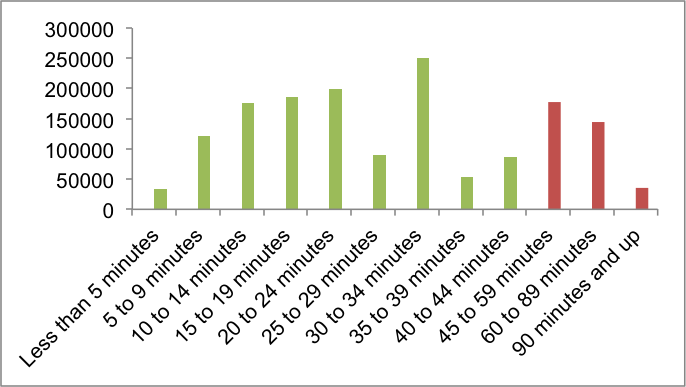
Source: US Census, 2013 American Community Survey 5-Year Summary File.
The MPO understands that transportation is not a simple end in itself. People use various transportation modes because they want to move themselves and/or their goods from one place to another in order to accomplish innumerable purposes. These may be for commuting between work and home, or home and school, or between home and other economic, health, administrative or recreational activities or services. In brief, the function of transportation is to enable social interaction, commerce, and personal development and fulfillment.
However, there are obstacles to serving these functions. Foremost is the combined lack of adequate funding and aging transportation infrastructure. In addition, the socio-demographic and economic patterns of the region are in transition. Because of the region’s aging population over the next 25 years, and forecasted in- versus out-migration, the region’s mobility and accessibility needs are evolving. The MPO is forging consensus about which projects are priorities for development and the density of their related economic and residential land uses.
Considering that the ultimate purpose of transportation is to serve human activity, the MPO defines its challenge for this LRTP as:
How can we maintain the transportation network to meet existing needs, adapt and modernize it for future demand, while simultaneously working within the reality of constrained fiscal resources?
Charting Progress to 2040 is the roadmap for responding to this conundrum. The subsequent chapters describe ways to work toward achieving the MPO’s vision and goals for the region that are both visionary and tangibly realistic.
Chapter 2—Process for Developing Charting Progress to 2040—provides an overview of the process used to develop this plan, including updating the MPO’s vision and establishing related goals and objectives; assessing the region’s transportation needs; developing and analyzing future transportation scenarios; finalizing the plan; and citing the public participation that supported the planning process throughout.
Chapter 3—Transportation Needs in the Boston Region—includes a summary of the regional transportation needs identified in the Needs Assessment.
Chapter 4—Funding the Transportation Network—considers all transportation funding to be spent in the MPO region over the life of the LRTP; explains LRTP fiscal constraint requirements; and identifies the amount of total transportation funding over which the MPO has decision-making power, compared to the cost of selected projects and programs.
Chapter 5—The Recommended Plan—describes and maps the set of projects and programs selected for the LRTP.
Chapter 6—Charting Performance—discusses MAP-21 requirements for performance measurement and describes the MPO's development and implementation of a performance-based planning practice.
Chapter 7—Transportation Equity—includes a description of the MPO approach to identifying communities of concern and their role in Title VI analysis and in the MPO Transportation Equity Program; describes the Transportation Equity Program, its goals, activities, and some key results; presents Title VI analysis and reporting; explains the Transportation Equity analysis for the LRTP, both the procedure and results; identifies projects and programs that benefit transportation equity areas.
Chapter 8—Air Quality Conformity Determination and Greenhouse Gas Analysis—includes the air-quality conformity determination showing that the LRTP is consistent with the Commonwealth’s plans for attaining and maintaining air-quality standards; a report on legislation and regulations requiring carbon dioxide (CO2) emission reductions by the MPO and the process for documenting CO2 emissions associated with projects and programs included in the LRTP as required for implementing the Massachusetts Global Warming Solutions Act.
Several components of the LRTP were designed to be dynamic and will be continuously updated and developed. These include the Needs Assessment, performance-based planning practice, and the public participation program.
All interested parties, including members of the public, are encouraged to follow the MPO’s work and to be engaged in the development and modifications that will be underway during the next four years.