Chapter 2—MassDOT 2018 Title VI Work Plan
Appendix A—Dissemination of Revised Complaint Forms and Procedures
Project Manager
Betsy Harvey
Project Principal
Ali Kleyman
Data Analysts
Betsy Harvey
Graphics
Kate Parker-O’Toole
Cover Design
Kate Parker-O’Toole
The preparation of this document was supported by the Federal Highway Administration through MPO 3C PL contract #105757 and the Federal Transit Administration through §5303 contract #102694 and #106374.
Central Transportation Planning Staff Directed by the Boston Region Metropolitan Planning Organization. The MPO is composed of state and regional agencies and authorities, and local governments.
January 2019

To request additional copies of this document or copies in an accessible format, contact:
Central Transportation Planning Staff
State Transportation Building
Ten Park Plaza, Suite 2150
Boston, Massachusetts 02116
(857) 702-3700
(617) 570-9192 (fax)
(617) 570-9193 (TTY)
Title VI of the Civil Rights Act of 1964 states that “no persons in the United States shall, on the ground of race, color, or national origin, be excluded from participation in, denied the benefits of, or be subject to discrimination under any program or activity receiving federal financial assistance.” To fulfill this mandate, each federal agency that provides financial assistance is authorized and directed by the United States Department of Justice to apply Title VI to each recipient of federal funds by issuing applicable requirements. The Federal Highway Administration (FHWA) requires that recipients of its financial assistance document their compliance with Title VI requirements on an annual basis, while the Federal Transit Administration (FTA) requires documentation of compliance on a triennial basis.
As a subrecipient of FHWA and FTA funding distributed through the Massachusetts Department of Transportation (MassDOT), the Boston Region Metropolitan Planning Organization (MPO) has prepared this 2018 annual report of the MPO’s Title VI compliance activities. This report responds to MassDOT’s recommendations with regards to the MPO’s Title VI Program in the federal fiscal year (FFY) 2018.
The Boston Region Metropolitan Planning Organization (MPO) is responsible for conducting the federally required metropolitan transportation planning process (often called the 3C—continuing, cooperative, and comprehensive—process) for the Boston metropolitan area. The MPO uses this process to develop a vision for the transportation system in the region and then decides how to allocate federal and state transportation funds to programs and projects—roadway, transit, bicycle, and pedestrian projects—that support this vision. To perform the 3C planning process, the MPO receives funding from both the Federal Transit Administration (FTA) and Federal Highway Administration (FHWA).
As a recipient of this federal funding, the MPO is required to comply with various civil rights statutes, executive orders, and regulations that are intended to ensure that populations that have traditionally been underserved by the transportation system are included in the planning process and have access to the MPO’s planning activities. The primary civil rights authorizations that guide the MPO’s planning process are as follows:
The MPO is a subrecipient of federal financial assistance, which is distributed through the Massachusetts Department of Transportation (MassDOT). As such, MassDOT oversees the MPO’s compliance with FHWA and FTA Title VI requirements, through the MPO’s annual and triennial Title VI reports. Based on the MPO’s 2017 triennial report submittal, MassDOT developed a customized work plan for the MPO and provided feedback and recommendations to the MPO to maintain compliance with Title VI requirements set by FTA and FHWA. This annual report addresses those recommendations and reflects the MPO’s actions in FFY 2018 to comply with MassDOT’s work plan.
MassDOT developed a customized work plan for the MPO for FFY 2018 to set the parameters of Title VI reporting compliance activities. It includes specific comments and recommendations structured around the MPO’s compliance efforts articulated in the MPO’s 2017 Triennial Title VI Report. This annual report summarizes MassDOT’s recommendations and related comments, and the MPO’s responses.
MassDOT’s work plan for the MPO includes two recommendations related to language access for people with limited English proficiency. The first requests a summary of FFY 2018 usage of multilingual content on the MPO’s website. Using Google Analytics, the MPO staff documents the extent to which visitors to the MPO’s website translate materials using a configured web browser or the Google Translate widget that is on each page, as well as how often translated documents are accessed on the MPO website. The second recommended that future updates to the MPO’s language access strategy prioritize language access based on the MPO’s planning functions rather than on those at other transportation agencies. The MPO staff is committed to ensuring that future updates to the MPO’s language access strategy comply with this directive.
The work plan also contains recommendations relating to two of the MPO’s equity analyses. The first concerns the equity analysis completed for the Unified Planning Work Program (UPWP) that analyzes the distribution of federal and state funds for MPO-funded studies. The MPO staff proposed several ways to improve this analysis in the MPO’s 2017 Title VI Triennial Report and documents the feasibility of these and next steps as part of the response to the recommendation in this report. The second recommendation concerns the MPO’s effort to develop a disparate impact and disproportionate burden (DI/DB) policy for evaluating the program of projects in the Long-Range Transportation Plan (LRTP). This section documents the remaining work, obstacles, and anticipated timeframe for finalizing the DI/DB policy.
For the 2017 Triennial Title VI Report, the MPO staff analyzed the distribution of state and federal funds programmed in the FFYs 2017–21 Transportation Improvement Program (TIP) for public transit projects to determine if the funds were equitably distributed to low-income, non-low-income, minority, and nonminority passengers. In the 2018 work plan, MassDOT requested that staff complete this analysis for the subsequent two TIPs, which program funds for projects in FFYs 2018–22, and FFYs 2019–23. This analysis identifies the amount of investment per transit passenger, and shows the trends over the past three TIPs for all TIP transit funding, as well as for MPO target funds.
Finally, the work plan identified two further reporting requirements. The first is to update the new complaint forms and procedures—and their translations— provided by MassDOT to Massachusetts MPOs. The second requires the MPO staff to update relevant attributes of social service and other organizations that represent traditionally underserved populations within the Boston region in MassDOT’s Engage tool. The MPO staff documents compliance with these recommendations in this report.
Title VI of the Civil Rights Act of 1964 provides that “no person in the United States shall, on the grounds of race, color, or national origin, be excluded from participation in, be denied the benefits of, or be subject to discrimination under any program or activity receiving federal financial assistance.” To fulfill this civil rights mandate, each federal agency that provides financial assistance for any program is authorized to apply provisions of Title VI to each program by issuing applicable rules, regulations, or requirements. Therefore, as federal agencies, the Federal Transit Administration (FTA) and the Federal Highway Administration (FHWA) require funding recipients to develop Title VI programs and to report regularly on the status and implication of program activities. The FHWA requires that recipients document their compliance with Title VI requirements on an annual basis, while the FTA requires documentation on a triennial basis. FHWA’s Title VI/Nondiscrimination Program covers those populations protected by Title VI, as well as populations covered by other federal regulations that prohibit discrimination based on sex, age, limited English proficiency (LEP), income, and disability.
Other federal civil rights statutes, executive orders, and regulations that protect these populations are based on the authorizations described below. As a recipient of federal funding, the MPO also is required to comply with these mandates that are intended to ensure that populations that have traditionally been underserved by the transportation system are included in the planning process and have access to the MPO’s planning activities:
Both the FTA needs of populations protected under the mandates discussed above; analyzes the effects of the MPO’s activities and investments; and undertakes public engagement efforts to meaningfully involve populations protected under federal regulations in the MPO’s planning process.
As a subrecipient of FTA and FHWA funding, which is distributed through the Massachusetts Department of Transportation (MassDOT), the Boston Region MPO submits its annual and triennial reports to MassDOT documenting the implementation of the MPO’s Title VI Program. This report describes MassDOT’s recommendations for the MPO’s Title VI Program for the federal fiscal year (FFY) 2018 and the MPO staff’s efforts to comply with these recommendations.
Subsequent to reviewing the MPO’s Triennial Title VI reports, MassDOT typically prepares a customized work plan for the MPO. This plan provides a course of action for carrying out the MPO’s Title VI Program in order for the MPO to remain in compliance with federal Title VI requirements. After reviewing the MPO’s 2017 Triennial Title VI Report, MassDOT prepared a work plan for the MPO that highlights notable findings and provides recommendations for ways that the MPO could improve its Title VI Program. The recommendations cover several components of the MPO’s Title VI Program: language access for people with limited English proficiency (LEP); equity analyses; transit funding distribution analysis; complaint forms; support to MassDOT’s Engage tool, an online resource to support outreach to protected populations in the state; and dissemination of new translations of complaint procedures. The remainder of this chapter contains MassDOT’s comments and recommendations, followed by the MPO staff’s responses to MassDOT’s recommendations.
MassDOT provided recommendations regarding the MPO’s provision of multilingual online content and language access strategy.
The MPO/RPA indicates that it began tracking the usage of multilingual content on its website in 2017, through the incorporation of Google Analytics, and should have preliminary results in FFY 2018.
Provide a summary of the usage statistics for FFY 2018 of multilingual content on the MPO’s website and an accompanying narrative to interpret the results of the tracking efforts to date.
To better track the number of times viewers access materials on the MPO’s website in languages other than English, the MPO staff refined the configuration of Google Analytics on its website in May 2017.1 There are three indicators the MPO staff can extract from Google Analytics data, each of which has its own strengths and limitations: the language setting of a visitor’s web browser; the number of downloads of translated documents; and usage of the Google Translate widget that is embedded in every page of the site. By tracking all three indicators, the MPO staff gains a more complete view of how many website viewers who are not fluent in English access the site and how they interact with it.
MPO staff investigated Google Analytics data for FFY 2018 (October 1, 2017, to September 30, 2018). As with all websites, a certain proportion of visitor sessions were initiated by legitimate web indexing services (web crawlers) or automated contact form submission software (spambots), or were attempts to probe site weaknesses. For the MPO’s website, this proportion is estimated to be about five percent. Because these “visitors” would distort the data analysis, their records were excluded from the analysis. Additionally, sessions by MPO staff were excluded. The remaining visitors and their web sessions are referred to here as “valid” visitors or sessions.2 Ensuring that Google Analytics data only reflect real website visitors and are free of spambots, web crawlers, and other malicious agents is an ongoing process. As FFY 2018 was the first full year for which Google Analytics data were available for this analysis, the MPO staff expects that not all spambots and web crawlers were filtered from the data analyzed for this report and that over time the filtering of these “visitors” will improve.
Google Analytics tracks the language setting of each web browser that visits the MPO’s website. Each browser defaults to requesting web pages in the language set on the computer’s operating system (OS) or the language of the browser’s user interface, though visitors may set their web browser to request web pages in any language of their choosing. For example, a browser whose menus and dialog boxes are in Chinese may nonetheless be set to request web pages in English, and vice versa. Taking the language setting at face value, one can assume that visitors to the site whose browser requests a language other than English do not speak English well. However, visitors may simply use the default language setting of their browser, even if they speak a different language. (For example, a visitor who is fluent in both English and Spanish may leave the browser language default setting as Spanish simply because of a preference for reading in Spanish. Furthermore, visitors may not change the browser language because it seldom has any practical effect: websites may not have alternate language content to provide or may have to provide content in a single language, regardless of the language requested by the browser.) There is no relationship between the language setting of the web browser and the visitor’s language proficiency as defined by the US Census. Therefore, the browser configuration provides, at best, an approximation of the language the visitor prefers to read in, rather than an indication of his or her native language or proficiency in the English language.
For the analysis of website visits in FFY 2018, two invalid language codes were removed that would otherwise distort the results: “(not set)” and “c.” When the language of the browser is not set, this often indicates that the visitor is connecting via a cellphone that does not relay the browser’s language.3 About 0.1 percent (26 sessions) of all valid sessions did not have a language set. In a further 0.4 percent of all sessions, the web browser language was recorded as “c” (125 sessions). A session with this code may indicate automated, or “bot,” traffic, rather than a human visitor.4
The final count of valid sessions in FFY 2018 for which a language was identified was 31,196. In approximately 95 percent of the sessions (30,095 sessions) the web browsers were configured to English. The majority of non-English web browsers were configured to Chinese or Korean. (Google Analytics does not distinguish between traditional and simplified Chinese). Table 1 shows the number and percent of valid sessions for the non-English languages to which visitors configured their web browsers.
Table 1
Language Configuration of Web Browsers: FFY 2018 Web Sessions on the Boston Region MPO’s Website
Languagea |
Number of Valid Sessions |
Percent of Total Valid Sessions—All Languages |
Percent of Total Valid Sessions—Non-English Languages |
English |
30,095 |
95.8% |
N/A |
Chinese |
313 |
1.0% |
26.6% |
Korean |
308 |
1.0% |
26.2% |
Spanish |
123 |
0.4% |
10.5% |
French |
100 |
0.3% |
8.5% |
Portuguese |
97 |
0.3% |
8.3% |
Japanese |
38 |
0.1% |
3.2% |
German |
35 |
0.1% |
3.0% |
Russian |
28 |
0.1% |
2.4% |
Finish |
20 |
0.1% |
1.7% |
Polish |
16 |
0.1% |
1.4% |
Arabic |
15 |
0.0% |
1.3% |
Swedish |
14 |
0.0% |
1.2% |
Thai |
14 |
0.0% |
1.2% |
Dutch |
9 |
0.0% |
0.8% |
Italian |
7 |
0.0% |
0.6% |
Turkish |
6 |
0.0% |
0.5% |
Indonesian |
5 |
0.0% |
0.4% |
Romanian |
4 |
0.0% |
0.3% |
Vietnamese |
4 |
0.0% |
0.3% |
Hebrew |
3 |
0.0% |
0.3% |
Slovakian |
3 |
0.0% |
0.3% |
Bulgarian |
2 |
0.0% |
0.2% |
Greek |
2 |
0.0% |
0.2% |
Catalan |
2 |
0.0% |
0.2% |
Hungarian |
2 |
0.0% |
0.2% |
Farsi |
1 |
0.0% |
0.1% |
Croatian |
1 |
0.0% |
0.1% |
Ukrainian |
1 |
0.0% |
0.1% |
Danish |
1 |
0.0% |
0.1% |
Lithuanian |
1 |
0.0% |
0.1% |
Total Valid Sessions |
31,196 |
N/A |
N/A |
Total Valid Non-English Sessions |
1,175 |
N/A |
N/A |
Further analysis showed that during FFY 2018, visitors whose browsers were configured for a non-English language downloaded 265 documents (PDF or HTML). About 27 percent of those documents were related to the Long-Range Transportation Plan (LRTP) and 26 percent were related to MPO-supported studies. Of the 265 documents, eight had been translated into Chinese, two had been translated into Spanish, and one had been translated into Portuguese.
The MPO translates its vital documents into several languages based on its 2017 Language Assistance Plan: Chinese (traditional and simplified), Spanish, Portuguese, and Haitian Creole. (Because MassDOT provides translations of the notice to beneficiaries and complaint forms and procedures in additional languages, those that were downloaded in other languages besides those five are also included here.) Table 2 shows the number of vital documents that were downloaded in PDF and HTML formats in FFY 2018. These figures indicate a demand for documents in languages for which the MPO currently provides translations, but these figures do not reveal whether there is a demand for documents in other languages. Further, it does not indicate which documents visitors would prefer to access if translations were available.
Table 2
Downloads of Translated Documents from the Boston Region MPO’s Website: FFY 2018
Language |
PDF Downloads |
HTML Downloads |
Chinese |
37 |
7 |
Spanish |
10 |
5 |
Portuguese |
7 |
5 |
Haitian Creole |
1 |
0 |
Russian |
1 |
0 |
Vietnamese |
0 |
1 |
Total |
56 |
18 |
The Google Translate widget is available on every page of the MPO’s website. Visitors may use this tool to translate the text on the site into any language that Google makes available on the widget. While the translations are not perfect, given the technical nature of the MPO’s planning topics, the widget does allow the MPO to significantly expand the number of languages in which visitors can access the website.
Google Translate was used a total of 54 times by website visitors during FFY 2018; 49 of those visits involved translations to languages other than English (the other five involved translations into English, presumably because the visitor’s computer’s default language was not English). Table 3 shows the number of times that website visitors used Google Translate in FFY 2018, and the languages they used for translation. One of the drawbacks of the widget is that it does not allow for the identification of the web pages or documents that were downloaded by people who used the Google Translate widget.
The MPO website’s embedded Google Translate widget is not the only way to effect machine translation of the website. One example of indirect machine translation may occur if visitors navigate to https://translate.google.com or https://www.bing.com/translate and provide the MPO’s website address. The MPO staff has no way to detect translations occurring through these entry points. By contrast, certain browsers (Google Chrome among them) automatically offer to apply machine translation to web pages in languages that do not match the language setting of the browser. While the MPO staff likewise cannot track when this browser feature is used, staff is able to detect website sessions in which the browser language settings are not English.
Table 3
Languages Accessed on the Boston Region MPO’s Website via Google Translate Widget: FFY 2018
Languagea |
Unique Eventsb |
Percent of Total Valid Sessions—All Languages |
Percent of Total Valid Sessions— Non-English Languages |
Chinese |
23 |
42.6% |
46.9% |
English |
5 |
9.3% |
N/A |
Spanish |
4 |
7.4% |
8.2% |
Farsi |
3 |
5.6% |
6.1% |
Bulgarian |
2 |
3.7% |
4.1% |
Hawaiian |
2 |
3.7% |
4.1% |
Malay |
2 |
3.7% |
4.1% |
Portuguese |
2 |
3.7% |
4.1% |
Arabic |
1 |
1.9% |
2.0% |
Armenian |
1 |
1.9% |
2.0% |
French |
1 |
1.9% |
2.0% |
German |
1 |
1.9% |
2.0% |
Hmong |
1 |
1.9% |
2.0% |
Lao |
1 |
1.9% |
2.0% |
Maori |
1 |
1.9% |
2.0% |
Russian |
1 |
1.9% |
2.0% |
Yiddish |
1 |
1.9% |
2.0% |
Hausa |
1 |
1.9% |
2.0% |
Tagalog |
1 |
1.9% |
2.0% |
Total |
54 |
N/A |
N/A |
The results from analysis of the use of the Google Translate widget, the number of downloads of translated documents, and the use of configured web browsers suggest that, while visitors who are not fluent in English do not represent a significant proportion of the website’s total traffic, there is a need for translation services nonetheless. Chinese appears to be the most widely used non-English language by visitors to the MPO’s website, followed by Korean and Spanish.
Interestingly, there are several languages that do not rank highly among the region’s safe harbor languages, but several visitors either configured their web browsers or used the Google Translate widget to access documents in Korean, Farsi, French, and Japanese. Meanwhile, Haitian Creole was conspicuously absent from these analyses, despite the fact that Haitian Creole is the fourth- most frequently spoken non-English language in the Boston region. This may be a result of several factors. The number of people who speak a language in a given area does not necessarily correlate with people who use the website; Haitian Creole speakers may have different web access ability or patterns overall than speakers of other more commonly translated languages. Secondly, the bar for LEP is quite low such that people who do not meet the standard of speaking English “very well” according to the US Census, and are therefore considered to have LEP, may have the ability to read English. Additionally, people who visit the MPO’s website do not all live in the Boston region. Future analyses could filter out people whose IP addresses show that they are not located in the region at the time they visit the site. However, these data have issues with accuracy at the geographic level needed for such an analysis. Finally, while MPO staff has removed much of the spambot and web crawler traffic from the results reported here, there is still room for improvement. Some of the non-English language traffic may have originated from spambots or web crawlers that went undetected in the analysis, making it appear that there were more valid non-English language sessions than there actually were.
This analysis only documented the languages used in any given session (for the widget and the web browser configuration.) It reveals little about visitors’ comparative quality of interaction with the website, such as how many pages they visited, which links they interacted with, and how long they spent on the site. Future analyses should explore these questions further in order to get a more complete picture of how people with non-English language needs are interacting with the website.
Despite these challenges, Google Analytics remains the most useful tool for understanding the use of the MPO’s website by English-speaking and non- English-speaking visitors alike. The MPO staff will continue to improve its analyses by filtering out spambots and web crawlers, as well as by developing more in-depth analyses to better understand how visitors interact with the website, with the goal of improving their experience and providing a more useful website for non-English speakers.
The MPO/RPA has provided a clear articulation of the organization’s reasoning for following a different strategy than “safe-harbor” for meeting language needs in the region and taking reasonable steps to provide LEP populations with meaningful opportunities to participate.
In describing its compliance strategy for language access requirements, the MPO/RPA emphasizes that its activities are of a non-emergency nature and therefore a delay in accessing these services by LEP individuals would not pose a serious threat. While the MPO/RPA is correct that part of the language access analysis can consider the vital nature of the organization’s activities, it is inaccurate to compare the activities of the organization to those that perform safety, security, or emergency related functions. The functions of the MPO/RPA should be prioritized without comparison to the functions of other organizations. When preparing a restatement of this narrative as part of an upcoming Language Access Plan (LAP) update, compliance reporting initiative, or other such update to Title VI related program materials, please make any necessary adjustments to the language access strategy to reflect this.
In the next update of the MPO’s Triennial Title VI report, due in 2020, staff will update the LAP according to MassDOT’s recommendation. The MPO’s functions will be prioritized relative only to other MPO activities, rather than to the functions of other transportation agencies. The MPO’s compliance strategy will be restated to reflect these changes, along with the MPO’s translation priorities based on the vital nature of each activity and the resources available to the MPO.
MassDOT commends the MPO/RPA on the quality of the organization’s LRTP, Transportation Improvement Program (TIP), and Unified Planning Work Program (UPWP) equity analyses. These analyses are supported by clear and concise data tables and maps that readily provide a “spot check” of the outcomes of the organization’s project programming decisions and annual work tasks. MassDOT acknowledges the efforts of the MPO/RPA to continue to expand and refine these analyses.
The MPO/RPA identified several potential improvements to the UPWP equity analysis methodology (comparing types of benefits received by communities, needs identified across communities receiving UPWP tasks, spending per capita, etc.). The organization should pursue these improvements and determine if they can be incorporated into the next UPWP equity analysis and reflect on the results.
In the FFY 2019 UPWP, the MPO staff proposed several potential new approaches to assessing the equity of the distribution of MPO-funded studies to communities with sizable minority populations and low-income populations as compared to communities of largely nonminority and non-low-income populations, respectively.5 Prior to FFY 2019, the MPO staff determined if funds were distributed equitably by focusing on the number of studies that were concerned with each municipality. The share of the population or households in each municipality that was minority or low-income, respectively, was considered as a preliminary way of assessing the extent to which MPO studies may benefit these populations. Acknowledging that more comprehensive analyses were needed, the MPO staff also described several possible methods for conducting this analysis in future UPWPs:
The short-term and long-term feasibility of the various analyses identified in the FFY 2019 UPWP is discussed below. (The testing of all the analysis methods used information from the FFY 2010 through FFY 2018 UPWPs.)
The MPO staff is currently building a database to track the details and recommendations from MPO-funded studies and technical assistance work. Staff has begun geocoding the location of each study area, but due to the time- intensive nature of this task a significant amount of work remains and the task will not be complete for the FFY 2020 UPWP. Once the geocoding is complete, the study areas will be mapped precisely (at a finer scale than at the municipal level), which will allow the MPO staff to determine which populations benefit from each study and how much money is spent to benefit minority and low-income populations. Until then, it will be challenging to determine with any precision whether minority or low-income populations benefit from MPO-supported studies to the same degree as nonminority and non-low-income populations. Currently, the best practice is to analyze the number of studies per 1,000 people and compare the results for the minority population or low-income households to the nonminority population or non-low-income households, respectively.
The MPO/RPA indicates that it continues to develop a Disparate Impact and Disproportionate Burden Policy to set the parameters for equity analyses performed by the organization.
Please provide a brief description of the remaining work to be done to finalize the MPO/RPA’s DI/DB policy and the anticipated timeframe to completion. Please detail any persistent obstacles to finalizing the effort.
Since developing a draft DI/DB policy that was applied to the program of projects in the 2015 LRTP, Charting Progress to 2040, MPO staff has been working to develop a policy for the MPO’s consideration to adopt and apply to the program of projects in the 2019 LRTP, Destination 2040. The policy would allow the MPO to identify potential future disparate impacts and disproportionate burdens by setting a threshold that, if exceeded, would indicate that a disparate impact or disproportionate burden may result if the program of projects was implemented in its entirety by the horizon year of the LRTP.
Over the past year, MPO staff has been working to develop a DI/DB policy, for the MPO to consider adopting prior to endorsing Destination 2040, through a combination of quantitative analyses, best practice research, and a comprehensive public engagement process. The public engagement process consisted of meetings of a stakeholder working group and a public workshop that took place between May and July of 2018. MPO staff received input on impacts that the MPO staff could assess for disparate impacts and disproportionate burdens, as well as a consensus by the stakeholder working group on a recommendation for a threshold component of the DI/DB policy. Staff presented the outcomes of the public engagement process to the MPO board on October 4, 2018, and received the board’s feedback, which is also being addressed.
Currently, staff is working on identifying a margin of error for the regional travel demand model that is used to assess the LRTP program of projects and to determine if the implementation of the projects could result in disparate impacts or disproportionate burdens; the margin of error will help to assess the level of impacts that are statistically likely to occur. These results will be integrated into the DI/DB policy. Concurrently, staff is developing a threshold recommendation for a draft policy, and an accompanying memorandum and presentation for the MPO. Finally, staff has updated the metrics that are used to assess disparate impacts and disproportionate burdens, reflecting input received from the public. MPO staff plan on discussing the results of these three efforts with the MPO board in early 2019. There are no major impediments to this schedule at this time.
MassDOT commends the MPO/RPA on the quality of the organization’s transit funding/project distribution analyses. These analyses are supported by clear and concise data tables and maps that readily provide a “spot check” of the outcomes of the organization’s project programming decisions. MassDOT acknowledges the efforts of the MPO/RPA to continue to expand and refine these analyses and encourages these efforts.
MassDOT recognizes the MPO/RPA’s observation that discrepancies in transit spending over a single TIP cycle may not necessarily indicate a disparity concern. Therefore, MassDOT encourages the MPO/RPA to follow through on the proposed analysis methodology to monitor discrepancies in funding allocations across Title VI and non-Title VI populations over time to determine if actual concerns of disparities are indicated and therefore warrant further attention.
In keeping with FTA Title VI requirements, the MPO staff analyzes the distribution of federal and state funds in the aggregate for public transportation purposes to minority and low-income populations. This is based on the ridership demographics of each public transit line and/or station, and the planned improvements to the facilities. Included in this section are the analysis results from the last three TIPs: FFYs 2017–21, FFYs 2018–22, and FFYs 2019–23. (The FFYs 2017–21 TIP analysis was discussed in the 2017 Triennial Title VI report and the results are included here for comparison purposes.)
Public transit ridership was derived from the Massachusetts Bay Transportation Authority’s (MBTA) Systemwide Passenger Survey (SPS). The FFYs 2017–21 TIP was analyzed using data from the 2008–09 SPS, while the FFYs 2018–22 and FFYs 2019–23 TIPs were analyzed using data from the newly available 2015–17 SPS. Respondents were divided by demographic: low-income or non- low-income and minority or nonminority. Minority and low-income status were derived from responses to the SPS. Minority respondents were those who reported being American Indian or Alaskan Native, Asian, Black/African American, Hispanic/Latino of any race, and/or Native Hawaiian or Pacific Islander. Households with incomes of less than $43,500 were classified as low- income. (This figure is 60 percent of the median household income for the MBTA service area based on figures from the 2013 American Community Survey. Note that this figure differs slightly from the MPO’s low-income threshold of $45,392.)
Tables 4 and 5 show the transit mode shares from the 2015–17 SPS for low- income, non-low-income, minority, and nonminority respondents by mode.
Compared to the 2008–09 SPS, the share of minority and low-income populations remained about the same for each mode. However, Silver Line routes were not included in the 2008–09 SPS as they had been covered in a special survey several years prior.
Table 4
MBTA Ridership by Minority Status
Transit Mode |
Minority Ridership |
Nonminority Ridership |
Percent Minority Ridership |
Percent Nonminority Ridership |
Rapid transit |
203,951 |
457,920 |
30.8% |
69.2% |
Bus |
152,154 |
165,113 |
48.0% |
52.0% |
Silver Line |
12,218 |
17,097 |
41.7% |
58.3% |
Commuter rail |
15,986 |
93,618 |
14.6% |
85.4% |
Ferry |
66 |
3,886 |
1.7% |
98.3% |
MBTA System Total |
384,375 |
737,634 |
34.3% |
65.7% |
Table 5
MBTA Ridership by Income
Transit Mode |
Low-income Ridership |
Non-low-income Ridership |
Percent Low- income Ridership |
Percent Non-low- income Ridership |
Rapid transit |
160,199 |
444,384 |
26.5% |
73.5% |
Bus |
119,784 |
68,612 |
41.5% |
58.5% |
Silver Line |
6,626 |
9,937 |
24.9% |
75.1% |
Commuter rail |
6,506 |
9,174 |
6.8% |
93.2% |
Ferry |
125 |
3,242 |
3.7% |
96.3% |
MBTA System Total |
293,240 |
25,349 |
28.8% |
71.2% |
Projects funded by the MBTA, MetroWest Regional Transit Authority (MWRTA), and Cape Ann Transportation Authority (CATA) were included in this analysis, as well as MPO target-funded transit projects.6 Projects were only included if they were expressly for transit purposes, such as infrastructure improvements, facility maintenance, and vehicle purchases, and if they were funded with state and/or federal dollars. Roadway improvements were not included even if they would potentially benefit bus passengers. Projects funded by FTA Section 5310 were not included, as the ridership that would be generated by these projects was unknown. The analysis was performed with the assumption that all investments result in a net benefit to transit passengers.
The analysis compared the investment per passenger for the low-income population to that for the non-low-income population and the investment per passenger for the minority population to that for the nonminority population. The following steps were taken to determine the investment per passenger:
This section shows the results of the analysis for both the entire TIP—which includes funding programmed for the MBTA, MWRTA, CATA, and the MPO’s target program—and the MPO target program only. The results include investments per passenger, the ratio of the per-person investment for minority passengers to the per-person investment for nonminority passengers, and the ratio of the per-person investment for low-income passengers to the per-person investment for non-low-income passengers.
Table 6 shows the per-passenger investment in the FFYs 2017–21, FFYs 2018– 22, and FFYs 2019–23 TIPs. The results show significant differences in investments per passenger between TIPs. These differences are likely due an increase in passengers using the system between the time that the 2008–09 SPS and the 2015–17 SPS were conducted, and because of differences in the total transit investment in each TIP.
Table 6
Transit Investment per Passenger in the Boston Region
Population |
FFYs 2017–21 TIP |
FFYs 2018–22 TIP |
FFYs 2019–23 TIP |
Minority |
$4,045 |
$1,608 |
$2,838 |
Nonminority |
$5,936 |
$2,243 |
$4,170 |
Low-income |
$4,606 |
$1,684 |
$3,234 |
Non-low-income |
$6,218 |
$2,453 |
$4,438 |
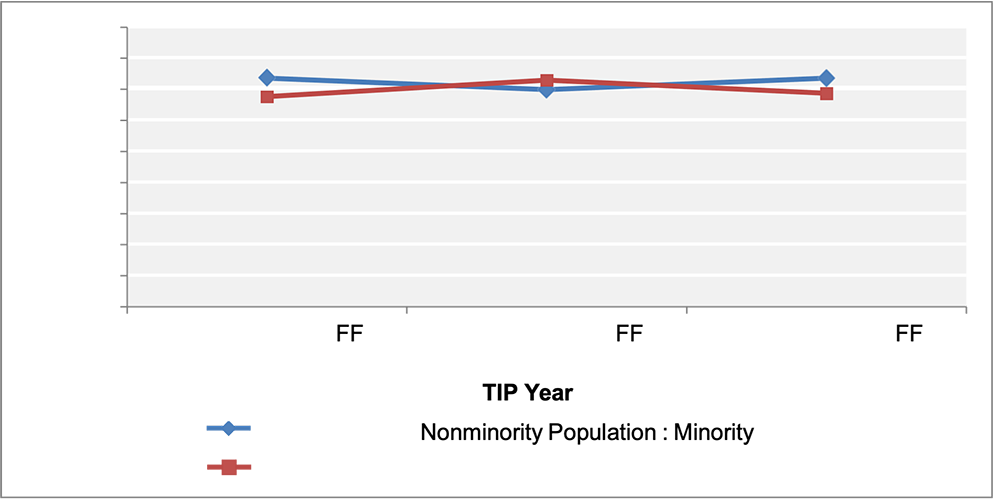
Figure 1 shows the ratio of the per-person investment for minority passengers to the per-person investment for nonminority passengers, and for low-income to non-low-income passengers. This statistic accounts for the change in SPS data from the 2008–09 survey to the 2015–17 survey and changes in total investments, and allows comparisons between all of the TIPs, regardless of year. It shows that the ratio has stayed approximately the same over the past three TIPs. Nevertheless, investments in projects benefiting non-low-income and nonminority passengers continue to be about 1.4 times greater than the investments in projects benefiting low-income and minority passengers.
Figure 1
Comparison of Transit Investment per Passenger in the Boston Region
In light of the FHWA funds that the MPO flexes to transit projects—and particularly in anticipation of the MPO’s new Community Transportation/Parking/ Clean Air and Mobility (CT) investment program—this section shows a separate analysis of only MPO target-funded projects. Table 7 shows the per passenger investment in the FFYs 2017–21, FFYs 2018–22, and FFYs 2019–23 TIPs. It shows a significant difference in investment per passenger between the FFYs 2017–21 TIP and the FFYs 2018–22 TIP. This difference is likely due to an increase in passengers using the system between the time that the 2008–09 SPS and the 2015–17 SPS were conducted and because a substantial amount of target funding was flexed to transit for the Green Line Extension project in the earlier years.
Table 7
Boston Region MPO Target Funding per Passenger for Transit Projects
Population |
FFYs 2017–21 TIP |
FFYs 2018–22 TIP |
FFYs 2019–23 TIP |
Minority |
$552 |
$209 |
$152 |
Nonminority |
$746 |
$385 |
$272 |
Low-income |
$556 |
$264 |
$190 |
Non-low-income |
$840 |
$391 |
$278 |
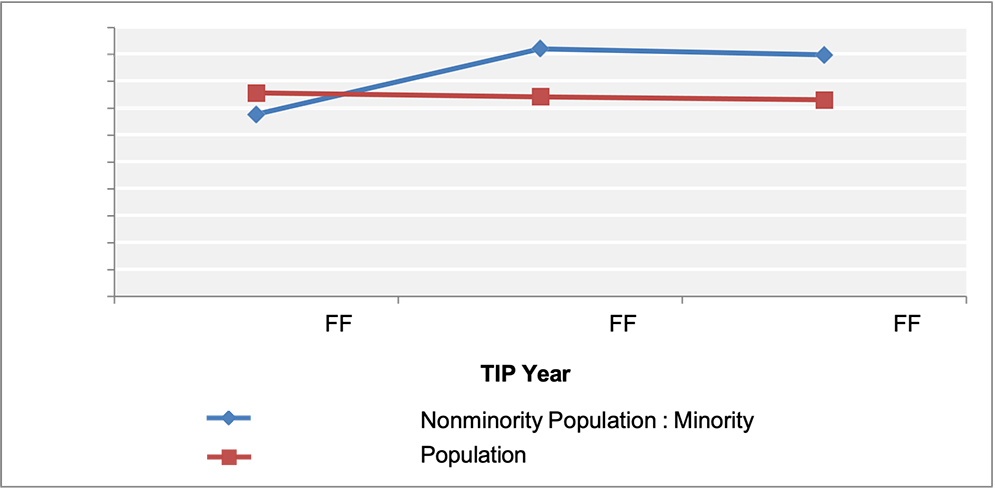
Figure 2 shows the ratio of investments per nonminority passenger to minority passenger, and the ratio of investments per non-low-income passenger to low- income passenger. It shows that over the past three years investments in projects that would benefit nonminority passengers increased from approximately
1.4 times to approximately 1.8 times that of investments in projects that would benefit minority passengers. Meanwhile, investments in projects that would benefit non-low-income passengers remained at about 1.5 times that of investments in projects that would benefit low-income passengers.
It is important to note that bus ridership shares for the MBTA region were used to assess the CT Program, as the individual projects that will be funded under this program are not yet known. The MPO anticipates programming the first projects in the CT Program in 2021, at which point the analysis will better reflect actual planned programming.
Figure 2
Comparison of Boston Region MPO Target Funding per Passenger for Transit Projects
The results from these analyses show that TIP transit investments that benefit nonminority and non-low-income passengers continue to outpace those that benefit minority and low-income passengers, respectively. MPO target funding for minority passengers has decreased relative to funding for nonminority passengers, whereas target funding for low-income populations has slightly increased relative to non-low-income passengers. In the last three years, both ratios have changed little in the TIP. Given these results, the MPO should consider providing target funding to transit projects that would serve minority passengers in particular, as well low-income passengers, to improve the ratio. Similarly, the region’s regional transit authorities (RTAs) should also consider prioritizing funding for projects in the Boston region that would benefit minority and low-income passengers.
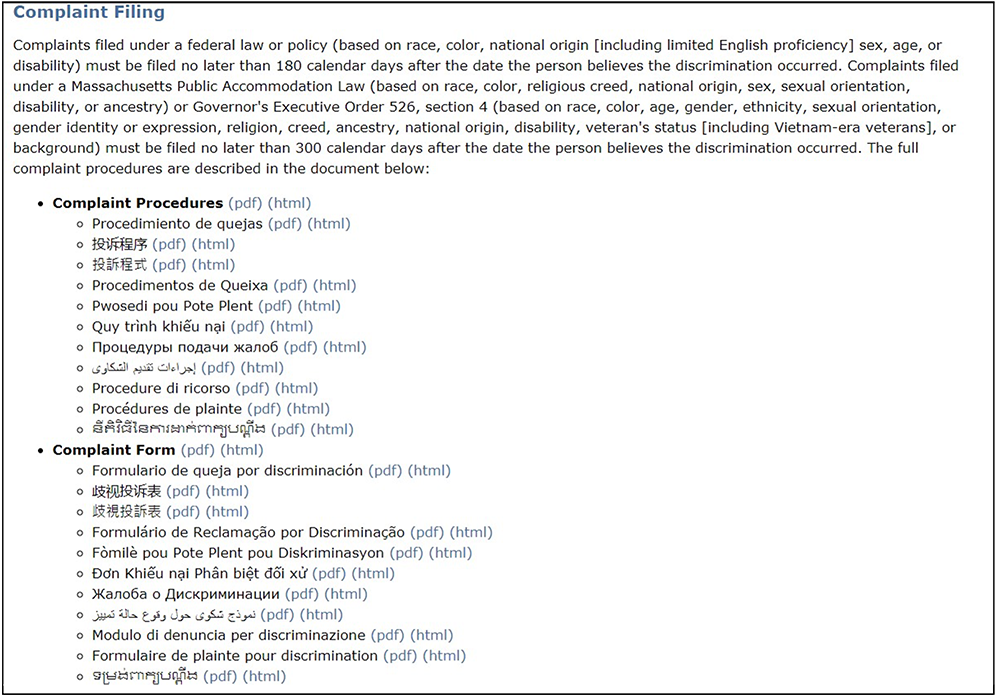
MassDOT has updated and translated (into the top ten languages in the Commonwealth) the Title VI Complaint Procedures document. These procedures are designed to instruct recipients and subrecipients of federal transportation dollars on how to process allegations of discrimination made by members of the public. The revisions reflect recent guidance from FHWA regarding delegation of authority to recipients and subrecipients to conduct Title VI investigations. In addition, in creating these updated procedures, MassDOT’s Title VI staff worked closely with the agency’s Manager of Investigations in order to simplify the content for ease of understanding among members of the public. These revised complaint procedures are in use by MassDOT and as such have been reviewed and approved by FHWA and FTA. In addition, they have been professionally translated. Please download the documents from the MassDOT Title VI SharePoint page (https://services.eot.state.ma.us/cr) and document their dissemination.
MPO staff has downloaded MassDOT’s translated complaint procedures and has made them available on the MPO’s website. Their availability is indicated in all communications with the public. See Appendix A for documentation of the dissemination.
“Engage” Contact Data: MassDOT continues to refine the “Engage” suite of Title VI and ADA related public engagement tools on the GeoDOT platform. Recent upgrades to the database for contact information requires the attention of MPO/RPA staff to ensure that data housed in the platform is up to date and includes all relevant attributes. Please consider the following list of needed updates as part of your ongoing efforts to keep this content relevant. For this reporting cycle, it is particularly important that MassDOT receive updated data in the fields of “Service Area,” “Public Organization,” and “Category/Subcategory.”
MPO staff is updating information about the organizations in the Engage database that are within the Boston region, with a focus on the fields of “Service Area,” “Public Organization,” and “Category/Subcategory.” This task is expected to be completed by the end of January 2019.
Boston Region Metropolitan Planning Organization 2018 Title VI Annual Update
January 2019
1 It is impossible to know if website visitors meet the federal definition of people with LEP, but it can be assumed that people who access translated documents or translate the website using a configured browser or the Google Translate widget are not fluent in English. This term—“not fluent in English”—will be used in the context of this section’s discussion in order to distinguish them from people with LEP.
2 According to Google Analytics, a session is “a group of user interactions with your website that take place within a given time frame. For example a single session can contain multiple page views, events, social interactions, and ecommerce transactions.” One visitor can open multiple sessions, over one day or many days. For the MPO staff’s purposes, this is the most useful metric for analyzing website traffic based on browser configuration and use of the Google Translate widget. (“How a Web Session is Defined in Analytics,” Analytics Help, accessed November 9, 2018, https://support.google.com/analytics/answer/2731565?hl=en)
3 “Languages Report in Google Analytics,” Bounteous, last updated February 12, 2013, https://www.bounteous.com/insights/2013/02/12/languages-report-google-analytics/
4 “How to Filter out C Language of ‘Bot’ Traffic from Google Analytics,” Performancing, last updated September 4, 2015, https://performancing.com/how-to-filter-out-c-language-or-bot- traffic-from-google-analytics/
5 People who are described as minority are those who identify as Hispanic or Latino/a/x and/or a race other than white. Low-income households are those for which the household income is less than or equal to 60 percent of the region’s median household income, or $45,392.
6 In this analysis, it was assumed that demographics for the MBTA service area were similar to those of CATA’s and MWRTA’s service areas given that the latter significantly overlap with the MBTA’s service area. Any differences were unlikely to affect the results of this analysis given that the total funding in any given TIP dedicated to CATA and MWRTA is less than one percent of the entire amount of funds programmed in the TIP.