
Online Map of Systemic Network
4. Systemic Analysis Methodology
Large Vehicle-Involved Crashes
5. Example of Site Scoring Process
Table D-1 | Facility Types and Risk Factors Identified for Each Key Emphasis Area
Table D-2 | Intersections by Risk Category and Jurisdiction (Intersection Angle Crashes)
Table D-3| Segment-level Risk Factors for VRU-Involved Crashes on Principal Arterials (Other)
Table D-4| Segment-level Risk Factors for VRU-Involved Crashes on Minor Arterials
Table D-5 | Segment-level Risk Factors for VRU-Involved Crashes on Major Collectors
Table D-6| Centerline Miles by Risk Category and Jurisdiction (VRU Crashes)
Table D-7| Intersection-level Risk Factors for VRU-Involved Crashes
Table D-8 | Intersections by Risk Category and Jurisdiction (VRU Crashes)
Table D-9 | Risk Factors for Lane Departure Crashes on Urban, Two-Lane, Undivided Roads
Table D-10| Risk Factors for Lane Departure Crashes on Rural, Two-Lane, Undivided Roads
Table D-11 | Centerline Miles by Risk Category and Jurisdiction (Lane Departure Crashes)
Table D-12 | Primary Risk Towns (Older Driver Crashes)
Table D-13 | Secondary Risk Towns (Older Driver Crashes)
Table D-14 | Risk Factors for Large Vehicle Crashes on Urban Uncontrolled Minor Arterials
Table D-15 | Centerline Miles by Risk Site Categories and Jurisdictions (Large Vehicle Crashes)
Table D-16 | Risk Factors for Speeding Crashes on Urban Uncontrolled Principal Arterials (Other)
Table D-17 | Risk Factors for Speeding Crashes on Urban Uncontrolled Minor Arterials
Table D-18 | Risk Factors for Speeding Crashes on Urban Uncontrolled Major Collectors
Table D-19 | Risk Factors for Speeding Crashes on Urban Uncontrolled Local Roads
Table D-20| Centerline Miles by Risk Site Categories and Jurisdictions (Speeding Crashes)
Table D-21 | Calculation Example of Normalized Risk Score
Figure D-1 | Online Systemic Network Viewing Application
Figure D-2| Crash Tree for Large Vehicle-Involved Segment Crashes
Figure D-3 | Crash Tree for Speeding-Related Segment Crashes
As a supplement to the crash-based (reactive) network screening analysis used to develop the High-Injury Network (HIN), in this systemic analysis a proactive approach was used to identify risk factors commonly associated with fatal and serious injury crashes and to evaluate the road network based on site-specific risk levels. While the HIN targeted locations with a high concentration of historical crashes, the systemic analysis focused on locations with a significant risk of severe crashes, regardless of crash history. By focusing on where crashes are more likely to occur in the future, this proactive approach enables road owners to prioritize higher-risk locations for preventative safety improvements before a significant number of severe crashes occur.
The screening and prioritization process of systemic analysis, as described in the Federal Highway Administration’s (FHWA) Systemic Safety User Guide, typically consists of six steps:
The results of a systemic analysis can support the development of comprehensive safety plans and inform the installation of low-cost proven safety countermeasures to effectively reduce fatalities and serious injuries at scale.1
The Massachusetts Department of Transportation (MassDOT) first implemented the systemic approach for network screening with a grant received from the United States Department of Transportation (U.S. DOT) in 2020 as part of the competitive Safety Data Initiative (SDI) process. Following FHWA’s systemic analysis process, MassDOT identified focus crash types, facility types, and risk factors for each emphasis area outlined in the 2018 Strategic Highway Safety Plan (SHSP). In 2023, the analysis was updated using crash data from 2017 to 2021. A Risk-Based Network Screening Tool was developed accordingly in the IMPACT portal, allowing users to visualize the systemic network screening results and filter top-ranked, high-risk sites.
Drawing on findings from the Risk-Based Network Screening Tool, this appendix includes a summary of the systemic analysis results for each key emphasis area identified in the Existing Conditions Report in Appendix B:
These summaries can help the Boston Region MPO strategically identify and address locations with the greatest potential for severe crashes across the region’s network.
The IMPACT Risk-Based Network Screening Tool is the primary data source for the systemic analysis result summaries. The tool provides outputs identifying high-risk towns, road segments, and intersections at the MPO level for most of the key emphasis areas based on specific risk factors for each emphasis area. Each emphasis area targets specific focus facility types, so not all segments and intersections are included in the analysis.
In addition, roadway attribute data from MassDOT’s Road Inventory (2022) were used to analyze the distribution of roadway segments by risk level across different jurisdictions. Since the systemic analysis for large vehicle-involved crashes had not been updated by MassDOT using the most recent crash data and the speeding-related systemic analysis was completed only at the town level, fatal and serious injury crash data from 2018 to 2022 also were collected from the MassDOT Data Query and Visualization Tool. These crashes were combined with the road inventory data to determine focus facility types and risk factors and to identify high-risk sites for crashes involving large vehicles and speeding-related crashes.
This section summarizes the key findings of the analysis competed using the MassDOT IMPACT Risk-Based Network Screening Tool and the additional analysis completed for emphasis areas not covered by the tool. For the risk-based network screening, MassDOT prioritized sites by ranking them based on risk scores derived from site-specific risk factors for each emphasis area. Sites ranked in the top 5th percentile were classified as “Primary Risk Sites,” indicating the highest risk for the emphasis area, while sites in the next highest 10th percentile were “Secondary Risk Sites,” representing a moderate risk. All remaining sites were classified as “Not a Risk Site.”
The MassDOT IMPACT Risk-Based Network Screening Tool visualizes primary and secondary risk sites for each emphasis area at both the state and MPO levels. The tool provides the following outputs that correspond to the region’s key emphasis areas identified in the Existing Conditions Report in Appendix B:
Key Takeaways
A distinct set of focus facility types and associated risk factors was identified for each emphasis area. Table D-1 lists the focus facility types and risk factors identified for key emphasis areas covered by the MassDOT Risk-Based Network Screening Tool and for the additional “Large Vehicle” and “Speeding” emphasis areas, which were identified through a manual systemic analysis.
As a summary, for emphasis areas with multiple focus facility types, the associated risk factors were combined by category in the table. The full list of risk factors for each focus facility type within each emphasis area is provided in Section 4, along with a summary of sites by jurisdiction and risk category. The full systemic analysis methodology for the “Large Vehicle” and “Speeding” emphasis areas is also included in Section 4.
Table D-1 | Facility Types and Risk Factors Identified for Each Key Emphasis Area
| Emphasis Area |
Focus Facility Type |
Risk Factor Category |
|
|---|---|---|---|
Intersection Angle Crashes |
|
|
|
VRU Crashes—Segments |
|
|
|
VRU Crashes—Intersections |
|
|
|
Lane Departure Crashes |
|
|
|
Older Driver-Involved Crashes |
Analysis was performed at town level |
|
|
Large Vehicle-Involved Crashes |
|
|
|
Speeding-Related Crashes |
|
|
|
1 Environmental justice criteria, determined by Massachusetts Executive Office of Energy and Environmental Affairs (EEA), include the following: 1) Income: The annual median household income is 65 percent or less of the statewide annual median household income; 2) Minority: Minorities make up 40 percent or more of the population; 3) English Isolation: 25 percent or more of households identify as speaking English less than "very well"; 4) Minorities make up 25 percent or more of the population and the annual median household income of the municipality in which the neighborhood is located does not exceed 150 percent of the statewide annual median household income.
2See MassDOT’s Potential for Everyday Biking (2022 Update) and Potential for Walkable Trips (2022 Update).
To better view the systemic network, an online application was created as seen in Figure D-1 . This application allows for comparison between the systemic network and the HIN to identify overlaps and similarities. Each network was developed through a different methodology, so it is not expected that they identify identical locations. Locations that were identified as being on both the systemic network and HIN should be reviewed independently to determine if all fatal and serious injury crashes are tied to systemic issues or if there is a need for supplemental tailored treatments.
Figure D-1 | Online Systemic Network Viewing Application
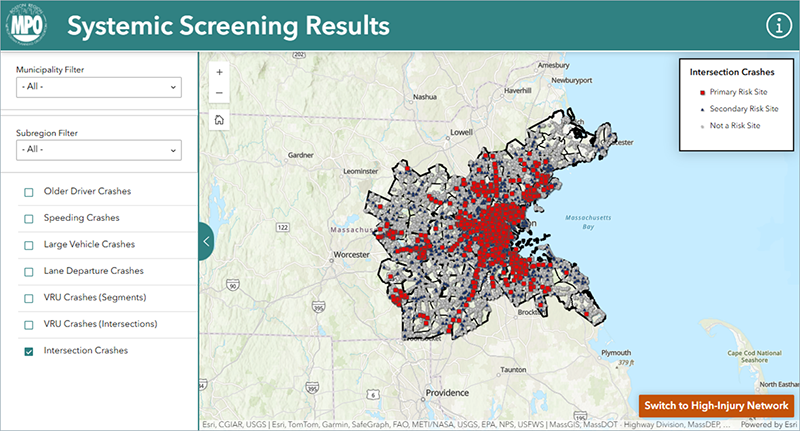
The HIN, systemic analysis, and existing conditions analysis can be used at the regional, subregional, and municipal levels to identify locations where safety improvements are needed and to plan for projects both reactively and proactively. These resources will support decision-makers as they prioritize safety projects in the Boston region, and they will inform strategies and actions as the Vision Zero Action Plan is implemented.
A key next step in the implementation of the Vision Zero Action Plan will be the development of subregion safety profiles that describe the common infrastructure, behavioral, operational, and modal safety problems in each subregion. These profiles will combine results from the Existing Conditions Report in Appendix B, the HIN, outreach activities, and more aspects of the plan to provide a holistic view of safety specific to each subregion.
This section outlines the development of focus facility types and associated risk factors for the region’s key emphasis areas. A complete list of focus facility types and risk factors identified for each emphasis area is provided. The methodology used for the manual systemic analysis of large vehicle crashes and speeding-related crashes is also discussed.
The systemic analysis of intersection crashes was performed by MassDOT and focused on multi-vehicle angle crashes, defined as those where the first harmful event was a “collision with a motor vehicle in traffic” and the manner of collision was “angle.” All angle crashes that occurred at four-way intersections, T-intersections, Y-intersections, traffic circles, or intersections with five or more legs were considered.
To determine the most common focus facility types where angle crashes have resulted in fatal and serious injuries, MassDOT developed a crash tree to analyze crash distribution by intersection geometry and traffic control type. All intersections except circular intersections and nonconventional intersections were included as focus facility types. For these selected intersections, risk factors that potentially contribute to an increased risk of severe angle crashes were assessed using various datasets, including intersection inventory data, land use data, and environmental justice data. Eight risk factors were identified:
MassDOT assigned an equal weight to each risk factor, except for “All-way stop-control,” which was given a weight of 0.75, and “Major Approach AADT,” which received a variable weight ranging from 0 to 1 based on the major approach AADT value. A normalized risk score was then calculated for each intersection, and a percentile rank was generated at the MPO level. Further details on the risk factor identification and facility scoring process can be found in the Risk Factors for SHSP Emphasis Areas report published by MassDOT. An example application of the scoring process also is provided in Section 5 using a randomly selected intersection in the region to illustrate how MassDOT evaluated site-specific risk levels after identifying focus facility types and risk factors.
Within the region, intersections ranked in the top 5 percent were categorized as “Primary Risk Intersection,” and intersections ranked in the next 10 percent were categorized as “Secondary Risk Intersection.” Table D-2Figure D-2 summarizes the number of intersections by risk category and jurisdiction.
Table D-2 | Intersections by Risk Category and Jurisdiction (Intersection Angle Crashes)
| Jurisdiction |
Primary Risk Site |
Secondary Risk Site |
Not a Risk Site |
Total |
|||
|---|---|---|---|---|---|---|---|
| Number |
Percentage |
Number |
Percentage |
Number |
Percentage |
||
MassDOT |
325 |
13% |
469 |
18% |
1,778 |
69% |
2,572 |
Non-MassDOT |
870 |
4% |
1,919 |
9% |
15,522 |
87% |
21,311 |
Total |
1,195 |
5% |
2,388 |
10% |
20,300 |
85% |
23,883 |
Note: Data in the MassDOT IMPACT Network Screening Risk-Based Tool only specify intersection jurisdiction as MassDOT or non-MassDOT. This table includes all intersections (except roundabouts, other circular intersections, and nonconventional intersections).
Source: MassDOT IMPACT Network Screening Risk-Based Tool.
Since VRUs are susceptible to serious injuries and fatalities in crashes involving motor vehicles, a systemic analysis was performed by MassDOT for crashes involving pedestrians and bicyclists at both roadway segment and intersection levels.
For serious injury crashes involving pedestrians and bicyclists on roadway segments, the crash distribution by roadway functional classification identified principal arterials, minor arterials, and major collectors as focus facility types. Separate sets of segment-level risk factors were identified for each focus facility type, using a combined dataset of roadway attributes, biking-walking infrastructure, land use types, and socioeconomic considerations at the block group level. Full lists of the identified risk factors for each focus facility type are provided in Table D-3 through Table D-5 .
Table D-3 | Segment-level Risk Factors for VRU-Involved Crashes on Principal Arterials (Other)
| Focus Facility Type |
Risk Factor (Pedestrian) |
Risk Factor (Bicycle) |
|---|---|---|
|
|
|
1 Environmental justice criteria, determined by Massachusetts Executive Office of Energy and Environmental Affairs (EEA), include the following: 1) Income: The annual median household income is 65 percent or less of the statewide annual median household income; 2) Minority: Minorities make up 40 percent or more of the population; 3) English Isolation: 25 percent or more of households identify as speaking English less than “very well;” 4) Minorities make up 25 percent or more of the population and the annual median household income of the municipality in which the neighborhood is located does not exceed 150 percent of the statewide annual median household income.
AADT = annual average daily traffic. mph = miles per hour. VRU = vulnerable road user.
Source: MassDOT Network Screening Risk-Based Methodology Reports.
Table D-4 | Segment-level Risk Factors for VRU-Involved Crashes on Minor Arterials
| Focus Facility Type |
Risk Factor (Pedestrian) |
Risk Factor (Bicycle) |
|---|---|---|
|
|
|
AADT = annual average daily traffic. mph = miles per hour. VRU = vulnerable road user.
Source: MassDOT Network Screening Risk-Based Methodology Reports.
Table D-5 | Segment-level Risk Factors for VRU-Involved Crashes on Major Collectors
| Focus Facility Type |
Risk Factor (Pedestrian) |
Risk Factor (Bicycle) |
|---|---|---|
|
|
|
AADT = annual average daily traffic. mph = miles per hour. VRU = vulnerable road user.
Source: MassDOT Network Screening Risk-Based Methodology Reports.
Considering the quality of available data and the potential impact of each risk factor on pedestrian and bicyclist crashes, a weighted sum of the identified risk factors was calculated for each segment within its respective focus facility type and normalized at the MPO level. A corresponding percentile rank was then computed. Similar to the analysis performed for multi-vehicle angle crashes in intersections, segments were categorized into three risk levels based on their percentile ranks. The systemic analysis process for the pedestrian crashes and bicyclist crashes is documented in detail in the Risk Factors for SHSP Emphasis Areas: Pedestrian Crashes and Risk Factors for SHSP Emphasis Areas: Bicycle Crashes reports.
To determine the overall segment risk categories for VRU crashes, segment risk levels derived from pedestrian and bicyclist systemic analyses were combined by selecting the higher of the two. Within the Boston region, 10 percent of selected focus facilities (measured by centerline miles) were identified as primary risk sites; 78 percent of those miles (246 out of 314 miles) were under municipal jurisdiction. Table D-6 summarizes the number of VRU crash sites by risk category and jurisdiction.
Table D-6 | Centerline Miles by Risk Category and Jurisdiction (VRU Crashes)
| Jurisdiction |
Primary Risk Site |
Secondary Risk Site |
Not a Risk Site |
Total |
|||
|---|---|---|---|---|---|---|---|
| Number |
Percentage |
Number |
Percentage |
Number |
Percentage |
||
Municipality |
245.6 |
10% |
371.5 |
15% |
1,827.2 |
75% |
2,444.3 |
MassDOT |
54.3 |
8% |
64.4 |
9% |
575.9 |
83% |
694.6 |
DCR |
14.1 |
11% |
36.0 |
27% |
84.1 |
63% |
134.2 |
Other1 |
0.0 |
0% |
1.9 |
33% |
3.8 |
67% |
5.7 |
Total |
314.3 |
10% |
473.8 |
14% |
2,491.0 |
76% |
3,278.8 |
1 The jurisdiction category “Other” includes the Massachusetts Port Authority, State Park or Forest, State Institutional, Federal Park or Forest, County Institutional, U.S. Air Force, U.S. Army Corps of Engineers, Federal Institutional, Private, and U.S. Army.
Note: This table only includes the identified focus facility types (principal arterials, minor arterials, and major collectors).
DCR = Department of Conservation and Recreation. VRU = vulnerable road user.
Source: MassDOT IMPACT Network Screening Risk-Based Tool and MassDOT Road Inventory 2022.
For intersection-related pedestrian and bicyclist crashes, all intersections (except roundabouts, other circular intersections, and nonconventional intersections) were considered as focus facility types. Risk factors were identified based on intersection-level attributes and community-based characteristics, with a complete list provided in Table D-7.
Table D-7 | Intersection-level Risk Factors for VRU-Involved Crashes
| Focus Facility Type |
Risk Factor (Pedestrian) |
Risk Factor (Bicycle) |
|---|---|---|
All intersections (except roundabouts, other circular intersections, and non-conventional intersections) |
|
|
1 Environmental justice criteria, determined by Massachusetts Executive Office of Energy and Environmental Affairs (EEA), include the following: 1) Income: The annual median household income is 65 percent or less of the statewide annual median household income; 2) Minority: Minorities make up 40 percent or more of the population; 3) English Isolation: 25 percent or more of households identify as speaking English less than “very well;” 4) Minorities make up 25 percent or more of the population and the annual median household income of the municipality in which the neighborhood is located does not exceed 150 percent of the statewide annual median household income.
AADT = annual average daily traffic. VRU = vulnerable road user.
Source: MassDOT Network Screening Risk-Based Methodology Reports.
Based on the weighted sum of these risk factors for each intersection and the corresponding percentile ranks within the Boston Region MPO, Table D-8 shows that 7 percent of intersections were classified as “Primary Risk Sites.” Notably, intersections under MassDOT jurisdiction have a higher proportion of primary and secondary risk sites (31 percent) compared to those under non-MassDOT jurisdiction (18 percent).
Table D-8 | Intersections by Risk Category and Jurisdiction (VRU Crashes)
| Jurisdiction |
Primary Risk Site |
Secondary Risk Site |
Not a Risk Site |
Total |
|||
|---|---|---|---|---|---|---|---|
| Number |
Percentage |
Number |
Percentage |
Number |
Percentage |
||
MassDOT |
347 |
13% |
461 |
18% |
1,764 |
69% |
2,572 |
Non-MassDOT |
1,253 |
6% |
2,472 |
12% |
17,586 |
83% |
21,311 |
Total |
1,600 |
7% |
2,933 |
12% |
19,350 |
81% |
23,883 |
Note: Data in the MassDOT IMPACT Network Screening Risk-Based Tool only specify intersection jurisdiction as MassDOT or non-MassDOT.
This table includes all intersections (except roundabouts, other circular intersections, and non-conventional intersections).
Source: MassDOT IMPACT Network Screening Risk-Based Tool.
For a more complete understanding of pedestrian and bicyclist safety issues and which areas to focus VRU safety improvements, the high-risk locations identified through systemic analysis can be layered with historically high-crash frequency locations from the MassDOT Crash-based Network Screening Analysis, as discussed in the 2023 Massachusetts Vulnerable Road User Safety Assessment. Using this combined approach, MassDOT identified the top 5 percent of towns considered high risk based on each town’s pedestrian and bicyclist crash history and coverage of top risk sites. Notably, 13 of the 17 identified high-risk towns are within the Boston region:
The Boston Region MPO should prioritize targeted systemic safety improvements in these high-risk towns to proactively reduce the risk of future severe crashes.
Lane departure crashes have been a leading cause of fatal and serious injury crashes both statewide and within the Boston region. The systemic analysis performed by MassDOT for lane departure crashes included all crashes in which the first harmful event involved a collision with a fixed object, running off the road, or crossing the centerline or median.
MassDOT identified urban and rural two-lane, two-way, undivided highways as focus facility types for lane departure crashes. Due to limited AADT data for many local roads, these two facility types were further divided into four categories based on the availability of AADT information. Separate sets of risk factors were then identified for each facility category using roadway attribute data and operational data at the segment level, along with town-level data on Alcoholic Beverage Control Commission (ABCC) licenses. Table D-9 and Table D-10 present the complete sets of risk factors for urban and rural, two-lane, undivided roadway segments.
Table D-9 | Risk Factors for Lane Departure Crashes on Urban, Two-Lane, Undivided Roads
| Focus Facility Type |
Risk Factor |
Risk Factor |
|---|---|---|
Urban, Two-Lane, Undivided Roads |
|
|
AADT = annual average daily traffic. ABCC = Alcoholic Beverage Control Commission. MPO = metropolitan planning organization.
Source: MassDOT Network Screening Risk-Based Methodology Reports.
Table D-10 | Risk Factors for Lane Departure Crashes on Rural, Two-Lane, Undivided Roads
| Focus Facility Type |
Risk Factor |
Risk Factor |
|---|---|---|
Rural, Two-Lane, Undivided Roads |
|
|
AADT = annual average daily traffic. mph = miles per hour. MPO = metropolitan planning organization.
Source: MassDOT Network Screening Risk-Based Methodology Reports.
Based on the identified risk factors, normalized risk scores and percentile ranks were calculated for each segment within the region. Table D-11 summarizes the distribution of roadway segments by risk site category and jurisdiction.
Table D-11 | Centerline Miles by Risk Category and Jurisdiction (Lane Departure Crashes)
| Jurisdiction |
Primary Risk Site |
Secondary Risk Site |
Not a Risk Site |
Total |
|||
|---|---|---|---|---|---|---|---|
| Number |
Percentage |
Number |
Percentage |
Number |
Percentage |
||
Municipality |
492.7 |
6% |
922.5 |
12% |
6,469.4 |
82% |
7,884.7 |
MassDOT |
36.6 |
14% |
77.5 |
30% |
142.9 |
56% |
257.0 |
DCR |
13.6 |
21% |
16.7 |
25% |
35.3 |
54% |
65.6 |
Other1 |
1.1 |
0% |
38.4 |
6% |
558.6 |
93% |
598.1 |
Total |
544.0 |
6% |
1,055.1 |
12% |
7,206.3 |
82% |
8,802 |
1 The jurisdiction category “Other” includes the Massachusetts Port Authority, State Park or Forest, State Institutional, Federal Park or Forest, County Institutional, U.S. Air Force, U.S. Army Corps of Engineers, Federal Institutional, Private, and U.S. Army.
DCR = Department of Conservation and Recreation.
Note: This table only includes the identified focus facility types (urban two-lane, two-way undivided highways and rural two-lane, two-way undivided highways).
Source: MassDOT IMPACT Network Screening Risk-Based Tool and MassDOT Road Inventory 2022.
Due to the prevalence of fatal and serious injury crashes involving older drivers in various facility types, MassDOT performed the systemic analysis at the town-level to prioritize communities for education campaigns and safety initiatives focused on older road users. The analysis identified eight town-level risk factors applicable to the region:
MassDOT assigned a risk score between 0 and 1 to each risk factor, and ranked towns at the MPO level using the normalized combined risk scores and percentile ranks.
In the Boston Region MPO area, the systemic analysis identified five primary risk towns, representing 10 percent of the region’s population and 6 percent of its roadway mileage. Additionally, 10 secondary risk towns were identified, accounting for an additional 12 percent of the population and 11 percent of roadway mileage. Detailed information on these towns is provided in Table D-12 (Primary Risk Towns) and Table D-13 (Secondary Risk Towns), with towns listed in descending order based on their percentile ranks within the region.
Table D-12 | Primary Risk Towns (Older Driver Crashes)
| Town |
Population |
Centerline Mileage by Jurisdiction |
Older Driver KA Crashes per 100k Population |
||||||||
|---|---|---|---|---|---|---|---|---|---|---|---|
| Municipality |
MassDOT |
DCR |
Other |
Total |
|||||||
Lynn |
101,253 |
159.8 |
91% |
3.0 |
2% |
3.3 |
2% |
9.3 |
5% |
172 |
30 |
Revere |
62,186 |
86.1 |
78% |
15.2 |
14% |
7.2 |
7% |
1.9 |
2% |
110.3 |
26 |
Somerville |
81,045 |
93.2 |
83% |
7.1 |
6% |
2.0 |
2% |
10.7 |
9% |
112.9 |
7 |
Peabody |
54,481 |
173.6 |
90% |
13.6 |
7% |
0 |
0% |
4.8 |
2% |
192.0 |
28 |
Saugus |
28,619 |
94.2 |
82% |
8.2 |
7% |
2.7 |
2% |
10.3 |
9% |
115.3 |
56 |
Note: This table includes Interstates and other fully access-controlled roadways.
DCR = Department of Conservation and Recreation. KA = crashes involving a fatality or serious injury.
Source: MassDOT IMPACT Network Screening Risk-Based Tool and MassDOT Road Inventory 2022.
Table D-13 | Secondary Risk Towns (Older Driver Crashes)
| Town |
Population |
Centerline Mileage by Jurisdiction |
Older Driver KA Crashes Per 100k Population |
||||||||
|---|---|---|---|---|---|---|---|---|---|---|---|
| Municipality |
MassDOT |
DCR |
Other |
Total |
|||||||
Salem |
44,480 |
90.8 |
90% |
4.7 |
5% |
0.0 |
0% |
5.8 |
6% |
101.3 |
9 |
Stoneham |
23,244 |
64.6 |
79% |
4.8 |
6% |
5.7 |
7% |
6.6 |
8% |
81.7 |
30 |
Weymouth |
57,437 |
151.6 |
81% |
15.6 |
8% |
0.0 |
0% |
19.1 |
10% |
186.3 |
44 |
Waltham1 |
65,218 |
117.6 |
70% |
6.9 |
4% |
0.3 |
0% |
42.2 |
25% |
167.0 |
127 |
Brookline |
63,191 |
93.5 |
87% |
3.0 |
3% |
2.6 |
2% |
8.4 |
8% |
107.5 |
8 |
Wilmington |
23,349 |
102.9 |
77% |
12.6 |
9% |
0.0 |
0% |
18.8 |
14% |
134.3 |
39 |
Watertown |
35,329 |
73.1 |
92% |
1.1 |
1% |
3.1 |
4% |
1.8 |
2% |
79.0 |
17 |
Milton |
28,630 |
99.7 |
80% |
9.5 |
8% |
9.6 |
8% |
5.9 |
5% |
124.8 |
24 |
Norwood |
31,611 |
104.4 |
89% |
9.2 |
8% |
0.0 |
0% |
3.5 |
3% |
117.1 |
28 |
Randolph |
34,984 |
99.8 |
84% |
8.7 |
7% |
0.0 |
0% |
9.6 |
8% |
118.1 |
51 |
1 As identified in Appendix B, the City of Waltham likely has inaccurately coded fatal and serious injury crash data. Despite this leading to potentially misleading analyses, Waltham was kept in this table to ensure consistency with the results of MassDOT’s approach to older driver systemic screening.
Note: This table includes Interstates and other fully access-controlled roadways.
DCR = Department of Conservation and Recreation. KA = crashes involving a fatality or serious injury.
Source: MassDOT IMPACT Network Screening Risk-Based Tool and MassDOT Road Inventory 2022.
The five primary risk towns in Table D-12 were identified mainly due to a combination of a greater older population (more than 5,600) and a significant proportion (over 6 percent) of older adults with self-reported cognitive issues. To address the elevated crash risk in these areas, potential countermeasures, including improved roadway signage and overall visibility, and targeted education programs on safe driving practices for older adults, should be considered.
In the MassDOT risk-based network screening, crashes involving large vehicles were defined as crashes involving a single-unit or larger truck or a bus. While relatively infrequent, crashes involving large vehicles tend to result in more severe outcomes compared to those involving passenger vehicles. Therefore, these types of crashes were identified as a focus crash type in the systemic analysis performed by MassDOT in 2017. However, this specific analysis has not been updated to incorporate more recent crash data, and its results have not been integrated into the IMPACT Risk-Based Network Screening Tool. Given that crashes involving large vehicles are still considered an emphasis area for the Boston Region MPO, the previous systemic analysis was updated using a similar approach based on crash data from 2018 to 2022.
Between 2018 and 2022, 312 of 4,770 (6.5 percent) fatal and serious injury crashes in the region involved large vehicles. Since most of these crashes occurred on roadway segments (60 percent), the analysis focused on segment-level crashes to identify focus facility types, and a crash tree was developed accordingly.
Figure D-2 shows the distribution of fatal and serious injury crashes involving large vehicles on roadway segments by access control type and functional classification. Although segments with full access control, such as Interstates and other expressways or freeways, account for a significant share of large vehicle crashes (39 percent), they were not included as potential focus facility types. This analysis focused on local roads to more effectively address the areas where interventions are most needed and can have the greatest impact on reducing fatal and serious injury crashes.
After the exclusion of Interstates and other expressways and freeways, urban, uncontrolled, principal arterials (other) and urban, uncontrolled, minor arterials were identified as focus facility types, as they accounted for the highest proportion of crashes involving large vehicles among the remaining facility types (underscored in Figure D-2).
Figure D-2 | Crash Tree for Large Vehicle-Involved Segment Crashes
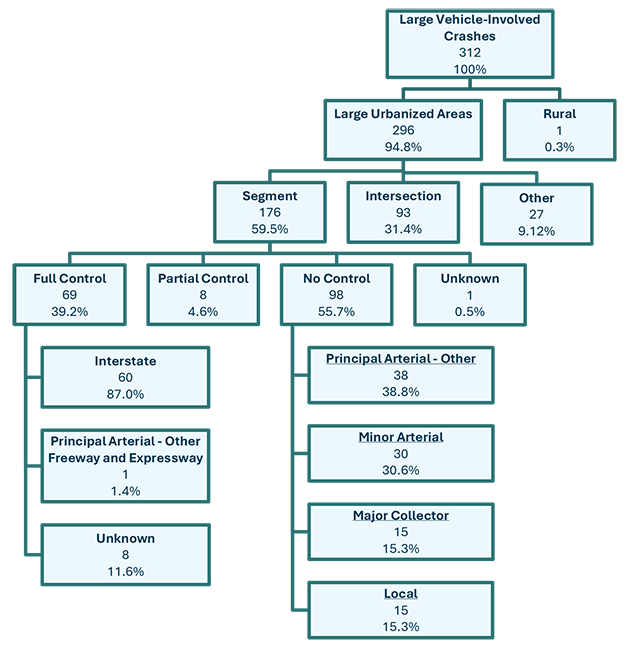
Note: This chart includes fatal and serious injury crashes along Interstates and other fully access-controlled roadways.
Source: MassDOT IMPACT Crash Tree Builder.
Following the selection of focus facility types, the overrepresentation approach was used to determine potential risk factors. The following data were examined: the 2018 to 2022 crash data obtained from the MassDOT IMPACT tool, 2022 road inventory data, factors related to crash characteristics, roadway attributes, and involved vehicles and persons recorded in the crash dataset.
For each focus segment type, an attribute was considered a risk factor if the proportion of fatal and serious injury crashes involving large vehicles with that attribute was statistically higher than the proportion of centerline miles with the same attribute within that facility type. Statistical significance was determined by constructing 90 percent confidence intervals around the proportion.
For urban, uncontrolled, principal arterials, no statistically significant risk factor was identified relevant to crashes involving large vehicles. However, a slight overrepresentation of crashes was observed on segments with the following characteristics: AADT above 20,000, left-side curb only, MassDOT jurisdiction, four travel lanes, right shoulder width between 4 and 12 feet, right sidewalk width between 9 and 12 feet, speed limits of 40 miles per hour (mph) or above, and traveled way width less than 25 feet. While these factors did not reach statistical significance in this analysis, the observed overrepresentation suggests that there are potential correlations with crashes involving large vehicles. Thus, these factors should still be considered in future screening efforts.
For urban, uncontrolled, minor arterials, Table D-14 presents the risk factors identified for crashes involving large vehicles, along with the percentages of crashes and roadway mileages to help prioritize higher-risk facility elements for safety improvements.
Table D-14 | Risk Factors for Large Vehicle Crashes on Urban Uncontrolled Minor Arterials
| Risk Factor |
Risk Factor Criteria |
Large Vehicle Fatal and Serious Injury Crashes |
Urban Uncontrolled Minor Arterials |
||
|---|---|---|---|---|---|
| Crash |
Crash Percentage |
Centerline Miles |
Mileage Percentage |
||
AADT |
20,000–30,000 |
5 |
17% |
43.2 |
3% |
Curb |
Right side only |
6 |
20% |
91.8 |
7% |
Jurisdiction |
MassDOT |
7 |
23% |
119.6 |
9% |
Road Surface Width |
> 30 feet |
15 |
50% |
437.7 |
34% |
Right Shoulder Type |
No Shoulder |
23 |
77% |
750.5 |
58% |
Right Sidewalk Width |
4–9 feet |
17 |
57% |
481.6 |
37% |
Note: This table only includes fatal and serious injury crashes along urban uncontrolled minor arterials.
AADT = annual average daily traffic.
Source: MassDOT IMPACT Data Query and Visualization Tool and MassDOT Road Inventory 2022.
Road segments that have the characteristics noted above are considered to be at higher-risk for crashes involving large vehicles. Roads that meet multiple risk factors would be considered to be most at-risk for these crashes.
For each focus segment type, risk factors were combined and weighted equally. A risk score was calculated for each segment based on the total number of applicable risk factors present. This risk score was then normalized by the maximum possible risk score for that facility type to allow for consistent prioritization across different facility types. Using the normalized risk scores, percentile ranks also were computed for each segment at the MPO level. Segments ranked in the top 5 percent were identified as a “Primary Risk Site,” and those in the next 10 percent were identified as a “Secondary Risk Site.”
Table D-15 summarizes the centerline miles of urban, uncontrolled, minor arterials by risk site category and jurisdiction for large vehicle crashes. Although only 120 miles of the facility type within the region are managed by MassDOT, these roads have the highest proportion (24 percent) of mileage considered as high risk for fatal and serious injury crashes involving large vehicles, compared to 8 percent for DCR-owned roads and 14 percent for municipally owned roads. Location and risk assessment information of each individual segment within the identified focus facility types is available through the online data dashboard; available at https://bostonmpo.org/visionzero.
Table D-15 | Centerline Miles by Risk Site Categories and Jurisdictions (Large Vehicle Crashes)
| Jurisdiction |
Centerline Miles by Large Vehicle Crash Risk Site Categories (miles/percentages) |
||||||
|---|---|---|---|---|---|---|---|
| Primary Risk Site |
Secondary Risk Site |
Not a Risk Site |
Total |
||||
Municipality |
45.8 |
4% |
115.2 |
10% |
960.0 |
86% |
1,121.0 |
MassDOT |
17.6 |
15% |
10.9 |
9% |
91.1 |
76% |
119.6 |
DCR |
1.3 |
2% |
3.4 |
6% |
50.4 |
92% |
55.0 |
Other1 |
0.2 |
4% |
0.7 |
13% |
4.5 |
83% |
5.5 |
Total |
64.9 |
5% |
130.2 |
10% |
1,106.0 |
85% |
1,301.1 |
1 The jurisdiction category “Other” includes the Massachusetts Port Authority, State Park or Forest, State Institutional, Federal Park or Forest, County Institutional, U.S. Air Force, U.S. Army Corps of Engineers, Federal Institutional, Private, and U.S. Army.
Note: This table only includes the identified focus facility types (urban uncontrolled minor arterials).
DCR = Department of Conservation and Recreation.
Source: MassDOT IMPACT Data Query and Visualization Tool and MassDOT Road Inventory 2022.
Given the substantial increase in speeding-related fatal and serious injury crashes across both the Commonwealth and the Boston region during the past five years, addressing speeding-related issues remains a critical priority. While MassDOT updated its systemic analysis for speeding crashes with recent crash data, the analysis was limited to the town-level due to the lack of reliable operational speed data at individual sites.
Recognizing that even in the absence of operational speed data, the site-level systemic analysis still offers the advantage of identifying location-specific risk factors and enabling a more efficient prioritization of safety improvements based on detailed risk assessment, a separate site-level systemic analysis was performed for speeding crashes within the Boston region. Crash data from 2018 to 2022 were obtained from the MassDOT IMPACT tool; and consistent with MassDOT’s definition, any crash in which the “Driver Contributing Circumstances” field indicated “Exceeded authorized speed limit” was considered as a speeding-related crash.
Within the Boston region, a total of 270 fatal and serious injury crashes related to speeding occurred between 2018 and 2022. Similar to the pattern observed in crashes involving large vehicles, 66 percent of speeding-related crashes occurred on roadway segments versus intersections. Given this high concentration of crashes on urban segments, a crash tree was developed to help identify the focus facility types for speeding-related crashes at the segment level.
As indicated in Figure D-1 , roadways with no access control accounted for the highest share of speeding-related fatal and serious injury crashes (67 percent), followed by roadways with full access control (25 percent). To prioritize segments where municipal-level safety interventions can be most effective, Interstates and other expressways or freeways were excluded from the analysis. Based on crash frequency, urban, uncontrolled, principal arterials (other), minor arterials, major collectors, and local roads were identified as focus facility types, each representing a significant portion of speeding-related fatal and serious injury crashes.
Figure D-3 | Crash Tree for Speeding-Related Segment Crashes
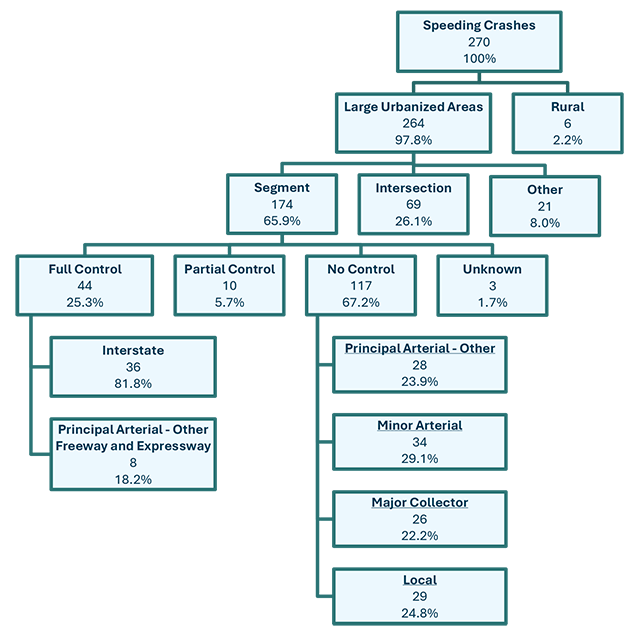
Note: This chart includes fatal and serious injury crashes along Interstates and other fully access-controlled roadways.
Source: MassDOT IMPACT Crash Tree Builder.
To identify risk factors associated with a higher risk of severe speeding-related crashes on the selected focus facilities, factors related to crash circumstances, roadway attributes, and details of involved vehicles and persons were analyzed separately for each facility type using the overrepresentation method described in the Large Vehicle-Involved Crashes section. Table D-16 through Table D-19 summarize the identified risk factors for speeding-related crashes on urban, uncontrolled, principal arterials (other), minor arterials, major collectors, and local roads.
For urban, uncontrolled, principal arterials, results suggest that speeding-related crashes were significantly more prevalent on segments with narrow medians (less than 5 feet wide) and wide traveled ways (more than 30 feet wide). Since wider travel lanes can create a false sense of safety at higher speeds and narrow medians often provide insufficient separation between opposing traffic, this combination can increase both the chance of speeding and the severity of resulting crashes. Additionally, high traffic volumes (above 20,000 AADT) were also found to be associated with an elevated risk of speeding-related crashes. This may be due to the increased potential for conflicts and more frequent aggressive driving behavior in high-volume traffic.
Table D-16 | Risk Factors for Speeding Crashes on Urban Uncontrolled Principal Arterials (Other)
| Risk Factor |
Risk Factor Criteria |
Speeding-Related Fatal and Serious Injury Crashes |
Urban Uncontrolled Principal Arterials (Other) |
||
|---|---|---|---|---|---|
| Crash |
Crash Percentage |
Centerline Miles |
Mileage Percentage |
||
AADT |
>20,000 |
73 |
56% |
256.3 |
36% |
Median Width |
1 – 5 ft |
19 |
15% |
49.2 |
7% |
Road Surface Width |
> 30 ft |
44 |
34% |
175.5 |
25% |
Number of Opposing Lanes |
2 |
23 |
18% |
81.0 |
11% |
Speed Limit |
30–35 mph |
87 |
67% |
410.8 |
58% |
Note: This table only includes fatal and serious injury crashes along urban uncontrolled principal arterials (Other).
AADT = annual average daily traffic. mph = miles per hour.
Source: MassDOT IMPACT Data Query and Visualization Tool and MassDOT Road Inventory 2022.
Table D-17 | Risk Factors for Speeding Crashes on Urban Uncontrolled Minor Arterials
| Risk Factor |
Risk Factor Criteria |
Speeding-Related Fatal and Serious Injury Crashes |
Urban Uncontrolled Minor Arterials |
||
|---|---|---|---|---|---|
| Crash |
Crash Percentage |
Centerline Miles |
Mileage Percentage |
||
AADT |
20,000 - 30,000 |
17 |
11% |
43.2 |
3% |
Curb |
Right side only |
20 |
13% |
91.8 |
7% |
Right Shoulder Width |
4–9 ft |
11 |
7% |
33.4 |
3% |
Right Sidewalk Width |
9 - 12 ft |
14 |
9% |
61.1 |
5% |
Note: This table only includes fatal and serious injury crashes along Urban Uncontrolled Minor Arterials.
AADT = annual average daily traffic.
Source: MassDOT IMPACT Data Query and Visualization Tool and MassDOT Road Inventory 2022.
Table D-18 | Risk Factors for Speeding Crashes on Urban Uncontrolled Major Collectors
| Risk Factor |
Risk Factor Criteria |
Speeding-Related Fatal and Serious Injury Crashes |
Urban Uncontrolled Major Collectors |
||
|---|---|---|---|---|---|
| Crash |
Crash Percentage |
Centerline Miles |
Mileage Percentage |
||
Curb |
Left side only |
12 |
11% |
56.6 |
5% |
Right Shoulder Width |
1 – 4 ft |
75 |
69% |
666.6 |
56% |
Note: This table only includes fatal and serious injury crashes along Urban Uncontrolled Major Collectors.
AADT = annual average daily traffic.
Source: MassDOT IMPACT Data Query and Visualization Tool and MassDOT Road Inventory 2022.
Table D-19 | Risk Factors for Speeding Crashes on Urban Uncontrolled Local Roads
| Risk Factor |
Risk Factor Criteria |
Speeding-Related Fatal and Serious Injury Crashes |
Urban Uncontrolled Local Roads |
||
|---|---|---|---|---|---|
| Crash |
Crash Percentage |
Centerline Miles |
Mileage Percentage |
||
Median Width |
11 – 20 ft |
3 |
2% |
7.7 |
0.1% |
Road Surface Width |
> 30 ft |
23 |
18% |
750.3 |
10% |
Number of Opposing Lanes |
2 |
3 |
2% |
8.1 |
0.1% |
Terrain |
Level terrain |
106 |
83% |
5,736.4 |
78% |
Note: This table only includes fatal and serious injury crashes along urban, uncontrolled, local roads.
Source: MassDOT IMPACT Data Query and Visualization Tool and MassDOT Road Inventory 2022.
Using the selected risk factors, each segment within the identified focus facility types was assigned a normalized risk score, and a corresponding percentile rank at the regional level. Based on these rankings, segments were categorized as primary risk sites, secondary risk sites, or sites with no identified risk.
Table D-20 provides a detailed distribution of centerline miles by risk site categories across jurisdictions. Among all focus facilities, roadways under the local jurisdiction had the highest proportion of segments classified as “Primary Risk Sites” (5 percent) compared to other jurisdictions. Location and risk assessment information of each individual segment within the identified focus facility types can be viewed in the online data dashboard; available at https://bostonmpo.org/visionzero.
Table D-20 | Centerline Miles by Risk Site Categories and Jurisdictions (Speeding Crashes)
| Jurisdiction |
Centerline Miles by Speeding Crash Risk Site Categories (miles/percentages) |
||||||
|---|---|---|---|---|---|---|---|
| Primary Risk Site |
Secondary Risk Site |
Not a Risk Site |
Total |
||||
Municipality |
472.7 |
5% |
942.8 |
10% |
7,765.9 |
85% |
9,181.4 |
MassDOT |
41.1 |
11% |
49.2 |
14% |
272.7 |
75% |
362.9 |
DCR |
13.4 |
12% |
17.9 |
16% |
81.3 |
72% |
112.5 |
Other1 |
3.0 |
0.3% |
50.4 |
5% |
892.6 |
94% |
946.0 |
Total |
530.1 |
5% |
1,060.3 |
10% |
9,012.5 |
85% |
10,602.9 |
1 The jurisdiction category “Other” includes the Massachusetts Port Authority, State Park or Forest, State Institutional, Federal Park or Forest, County Institutional, U.S. Air Force, U.S. Army Corps of Engineers, Federal Institutional, Private, and U.S. Army.
Note: This table only includes the identified focus facility types (urban uncontrolled principal arterials, minor arterials, major collectors, and local roads).
DCR = Department of Conservation and Recreation.
Source: MassDOT IMPACT Data Query and Visualization Tool and MassDOT Road Inventory 2022.
This section provides an example of the scoring process on a randomly selected intersection in the region to explain the scoring methodology used by MassDOT for the “Intersections” emphasis area. The example site is a two-way, stop-controlled, cross-intersection located at Everett Avenue (major approach) and Arlington Street (minor approach) in the Town of Chelsea.
For the “Intersections” emphasis area, all intersections (except roundabouts, other circular intersections, and nonconventional intersections) were considered focus facilities. The associated risk factors and their assigned weights are listed in Table D-21 . A risk score was calculated for each risk factor based on whether the intersection meets the risk factor criteria and the according weight.
For the selected intersection, the relevant attributes corresponding to each risk factor are detailed in Table D-21 , along with the calculated individual risk scores. By summing these individual risk scores, a total risk score of 4.9 was computed for the intersection site. To allow for comparison across different types of focus facilities, the total risk score was further normalized by the maximum possible risk score a site can achieve within each focus facility type. For this emphasis area, the maximum possible total risk score is 6. Thus, the normalized risk score for the selected intersection site is 0.82.
Table D-21 | Calculation Example of Normalized Risk Score
| Risk Factor |
Weight |
Intersection Attribute |
Risk Score |
|---|---|---|---|
Major Approach AADT |
Variable from 0 to 1 based on the range of major approach AADT |
20,326 |
0.9 |
Minor approach AADT 1,500 and above |
1 |
3,437 |
1 |
Respective town meets three environmental justice criteria |
1 |
Respective town meets the “Minority”, “Income”, and “English Isolation” criteria |
1 |
Three or more through lanes on major approach |
1 |
Maximum number of through lanes on major approach is 2 |
0 |
Two-way stop-control |
1 |
Two-way stop-control |
1 |
All-way stop-control |
0.75 |
Not all-way stop-control |
0 |
Signalized control |
1 |
Not signalized-control |
0 |
Four or more intersection legs |
1 |
Four intersection legs |
1 |
Total Risk Score |
4.9 |
||
Normalized Risk Score = Total Risk Score / Maximum Possible Risk Score |
0.82 |
||
AADT = annual average daily traffic.
Source: MassDOT Network Screening Risk-Based Methodology Reports and MassDOT IMPACT Network Screening Risk-Based Tool.
1 FHWA, Systemic Approach to Safety, https://highways.dot.gov/safety/data-analysis-tools/systemic#:~:text=It%20can%20be%20used%20to,and%20serious%20injuries%20at%20scale.
2 Environmental Justice criteria, determined by Massachusetts Executive Office of Energy and Environmental Affairs (EEA), include: 1. Income: the annual median household income is 65 percent or less of the statewide annual median household income; 2. Minority: minorities make up 40 percent or more of the population; 3. English Isolation: 25 percent or more of households identify as speaking English less than "very well"; 4. Minorities make up 25 percent or more of the population and the annual median household income of the municipality in which the neighborhood is located does not exceed 150 percent of the statewide annual median household income.