Disparate Impact and Disproportionate Burden Mitigation Analysis Results
Addressing Adverse Impacts on Minority and Low-income Communities through TIP Programming
During the development of the Boston Region Metropolitan Planning Organization’s (MPO) 2023 Long-Range Transportation Plan (LRTP), Destination 2050, we (MPO staff) conducted a Disparate Impact and Disproportionate Burden (DI/DB) analysis to determine if minority and low-income populations would be disproportionately impacted by the projects, in the aggregate, in the LRTP compared to nonminority and non-low-income populations, respectively. These impacts are assumed to occur by 2050, if all the projects are built. Disparate impacts—adverse impacts on minority populations—and disproportionate burdens—adverse impacts on low-income populations—were identified for several metrics:
As is required by federal regulations, the MPO must mitigate these disparate impacts and disproportionate burdens, which we are doing through the projects funded in its capital program, the Transportation Improvement Program (TIP). To initiate this process, we conducted an initial DI/DB Mitigation Analysis in the fall of 2023 and winter of 2024. This document describes the results of that analysis.
*
*
We conducted the DI/DB Mitigation Analysis using Conveyal, an analytical tool that assesses the ability of people to reach destinations within a given travel time. This first analysis was run on a Baseline Scenario to give the MPO and other interested parties a foundation for comparison when Conveyal is run for the final Federal Fiscal Years (FFYs) 2025–29 TIP scenario.
The Baseline Scenario included projects funded in the FFYs 2024–28 TIP that are presumed to continue to be funded in the FFYs 2025–29 TIP, as well as those projects submitted for funding in the FFYs 2025–29 TIP as of December 31, 2023. It does not reflect projects submitted after that date, or any changes to project readiness or design of existing projects. In addition, some projects were not included due to their negligible impacts in terms of access or travel time metrics. For a full list of projects included in the analysis, see Appendix B—Project Lists.
As with the DI/DB LRTP Analysis, the DI/DB Mitigation Analysis assessed the impacts of projects, in the aggregate, and compared these impacts between two pairs of population groups:
Notably, the analysis was not directly concerned with the absolute project impacts on a population group (such as an increase in travel time), but rather how that increase or decrease compared to the paired population group. So, for example, if the minority and nonminority populations are both expected to experience longer travel times if the projects are constructed, there would only be a disparate impact if the increase for the minority population was greater than the increase for the nonminority population. This is not to say that the increase in travel time for both populations should not be concerning, just that it is not the purview of a DI/DB analysis.
Note that the analysis was only run on the group of MPO Regional Target-funded projects, not individual projects—therefore we did not identify the impacts of specific projects. In addition, when multiple projects are run in a scenario, their interactions may lead to different results than if each project were analyzed individually.
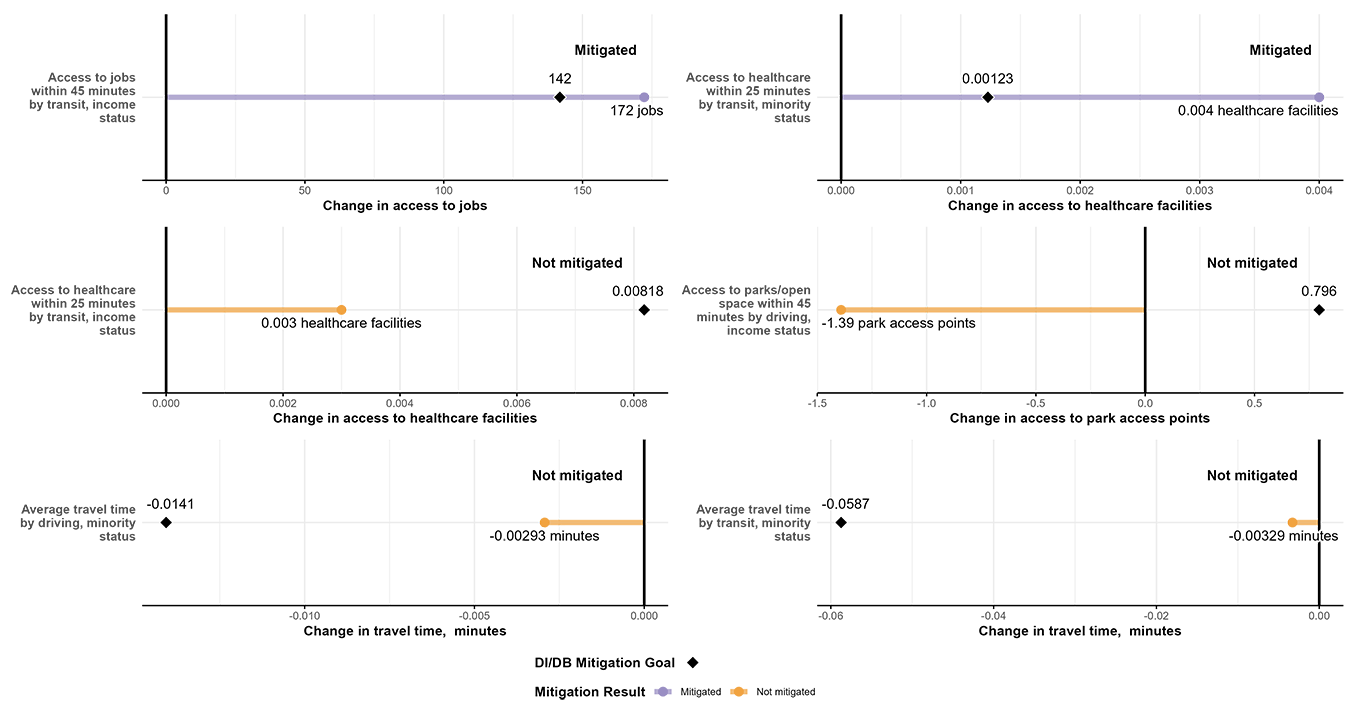
The results show the change in access to opportunities or travel time for each population group that we would expect to see if the projects in the Baseline Scenario were constructed. Note that the analysis results are based on current project design information—actual impacts may differ if designs change. The charts show the amount that needs to be mitigated—the difference in impacts (for example, number of jobs) between the minority and nonminority and between low-income and non-low-income populations. They then show whether the projects in the Baseline Scenario would benefit the minority or low-income populations to the extent that these differences are mitigated.
Figure 1
TIP Project Contribution to DI/DB Mitigation
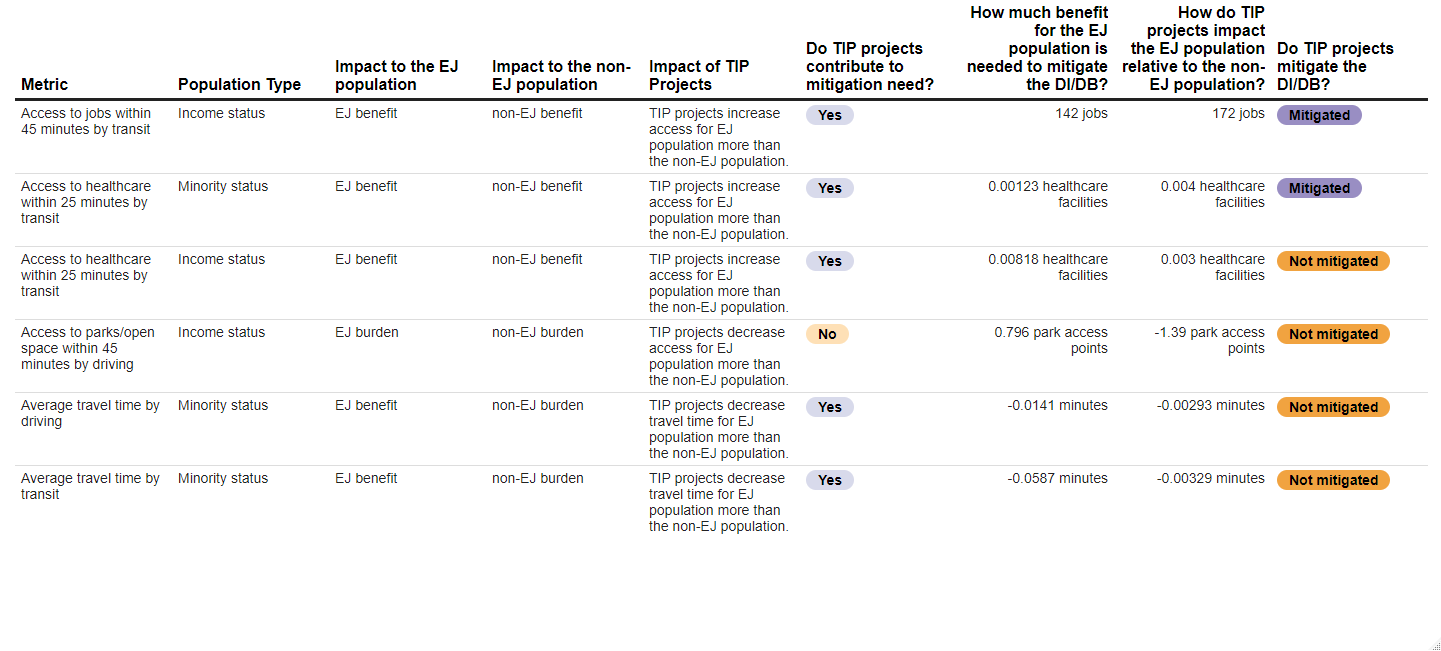
Figure 2
Summary of Projected TIP Project Impacts on DI/DB Metrics
As the MPO works to develop a final programming scenario for the FFYs 2025–29 TIP, staff will run an updated DI/DB Mitigation Analysis to determine the extent to which the disparate impacts and disproportionate burdens will be mitigated. The MPO does not need to accomplish full mitigation in the FFYs 2025–29 TIP. This initial analysis was focused on investigating Conveyal’s utility for DI/DB mitigation, and further work will be done over the next year to develop an overall process for establishing when and how mitigation is accomplished. There are several complexities to consider, particularly the different timeframes of the TIP and LRTP—the LRTP has a 20-year horizon and contains projects whose funding schedules may significantly change within that time frame, whereas the TIP has a four-year horizon with projects ready for implementation. This year, the MPO can begin to track the progress of the metrics for which there are disparate impacts and disproportionate burdens and develop a better understanding of what would be required for the mitigation process.
Additionally, we are currently conducting a study, Applying Conveyal to TIP Project Scoring, to develop the destination access evaluation criteria. Once criteria are established, the MPO will be able to evaluate projects individually for destination access impacts and, therefore, have a better idea which projects could contribute to mitigating remaining disparate impacts and disproportionate burdens in future TIPs. This would allow the MPO to evaluate projects separately—through project scoring—as well as together—through a DI/DB Mitigation Analysis.
This appendix provides more detail on how the DI/DB Mitigation Analysis was conducted.
The DI/DB LRTP Analysis was conducted using the MPO’s travel demand model (TDM23), while the DI/DB Mitigation Analysis was conducted using Conveyal. We chose to use Conveyal for the mitigation analysis because it is a faster, more flexible tool, ideal for use during the development of the TIP. To minimize the differences between the two analyses, we took measures to obtain compatible results.
We also accounted for several key differences that affect analysis results and how we interpret them:
Because of these differences, outputs (such as travel time) of the two processes cannot be compared directly. To compare the results of the LRTP DI/DB Analysis and DI/DB Mitigation Analysis, we developed a conversion factor for each metric to convert the TDM23 outputs into Conveyal units. This factor was developed by comparing the difference, for each metric, between the transportation network without MPO investments in TDM23 and the network in Conveyal.
Full results of the Destination 2050 DI/DB analysis can be found at: https://www.bostonmpo.org/data/pdf/plans/LRTP/destination2050/Destination-2050-LRTP.pdf#page=277.
The MPO’s DI/DB Policy describes how the MPO identifies disparate impacts and disproportionate burdens. In sum, if the minority or low-income population is likely to be impacted more negatively than the respective nonminority or non-low-income population—which can be a denial of benefits or an imposition of burdens—then there is a disparate impact or disproportionate burden. When making this determination, the policy considers any uncertainty that is inherent to transportation modeling processes and tools.
The DI/DB Mitigation Analysis focused on six metrics for which there were disparate impacts and disproportionate burdens identified in Destination 2050:
Destination access metrics examine how many destinations people can reach within a given travel time—travel times are set based on the average travel time in the Boston region to that destination as calculated either from the American Community Survey (access to jobs) or by using the MPO’s travel demand model (all others). Average travel time metrics consider the average travel times for all trips for that mode that begin or end in the Boston region, from TAZ centroid to TAZ centroid.
Destinations are defined in different ways for each destination access metric:
Job data are from LODES 2019 data that are compiled by the US Census Bureau. Parks data are from the December 2021 MassGIS Protected and Recreational Open Space file. Healthcare data are from a combination of the following:
We are currently compiling an online repository of the methodology and data sources used in the DI/DB Mitigation Analysis. This document will be updated with the link once it is live.
This appendix lists the projects included in the DI/DB LRTP Analysis and the DI/DB Mitigation Analysis.
We are currently working on developing the ability to add microtransit and bikeshare projects to Conveyal and anticipate including these projects in future DI/DB Mitigation Analyses.
Note that not all aspects of a project can be modeled in Conveyal. Conveyal is responsive to changes in travel speed, the addition and removal of travel links (such as a new shared-use path), and changes in roadway geometry (such as the removal of a travel lane). Only those projects that have at least one of these elements are included in the analysis. We are continuing to explore Conveyal’s ability to model more project types and characteristics; in future analyses additional projects will be added as feasible.
The TIP and the LRTP contain different types of projects. The LRTP contains a fiscally constrained list of regionally significant projects that are expected to be built in the region in the next 20 years. Broadly speaking, a regionally significant project is one that is on a facility that serves regional transportation needs—at a minimum, all principal arterial highways and fixed guideway transit. Projects in the TIP are ones that the MPO is committing to fund, which may include projects listed in the LRTP if the MPO has elected to fund them, as well as other projects that are not considered regionally significant but that the MPO believes are important to the region. Therefore, the TIP includes many more projects than those listed in the LRTP.
Table B-1
DI/DB Mitigation Analysis Project List
MassDOT Project ID |
Proponent |
Project Name |
608436 |
Ashland |
Rehabilitation and rail crossing improvements on Cherry Street |
606453 |
Boston |
Improvements on Boylston Street, from intersection of Brookline Avenue and Park Drive to Ipswich Street |
609532 |
Chelsea |
Targeted safety improvements and related work on Broadway, from Williams Street to City Hall Avenue |
609257 |
Everett |
Reconstruction of Beacham Street |
605168 |
Hingham |
Improvements on Route 3A from Otis Street/Cole Road, including Summer Street and rotary; Rockland Street to George Washington Boulevard |
610544 |
Peabody |
Multiuse path construction of Independence Greenway at I-95 and Route 1 |
609252 |
Lynn |
Rehabilitation of Essex Street |
608051 |
Wilmington |
Reconstruction on Route 38 (Main Street), from Route 62 to the Woburn city line |
608067 |
Woburn |
Intersection reconstruction at Route 3 (Cambridge Road) and Bedford Road and South Bedford Street |
605743 |
Ipswich |
Resurfacing and related work on Central and South Main Streets |
608940 |
Weston |
Intersection improvements Boston Post Road (Route 20) at Wellesley Street |
608045 |
Milford |
Rehabilitation on Route 16, from Route 109 to Beaver Street |
609204 |
Belmont |
Community Path, Belmont component of the MCRT (Phase I) |
605857 |
Norwood |
Intersection improvements at Route 1 and University Avenue/Everett Street |
612989 |
Boston |
Bridge preservation, B-16-066 (38D), Cambridge Street over MBTA |
609437 |
Salem, Peabody |
Boston Street improvements |
608954 |
Weston |
Reconstruction on Route 30 |
610662 |
Woburn |
Roadway and intersection improvements at Woburn Common, Route 38 (Main Street), Winn Street, Pleasant Street, and Montvale Avenue |
606226 |
Boston |
Reconstruction of Rutherford Avenue, from City Square to Sullivan Square |
610932 |
Brookline |
Rehabilitation of Washington Street |
611983 |
Chelsea |
Park Street and Pearl Street reconstruction |
609246 |
Lynn |
Rehabilitation of Western Avenue (Route 107) |
613088 |
Malden |
Spot Pond Brook Greenway |
607981 |
Somerville |
McGrath Boulevard construction |
610691 |
Natick |
Cochituate Rail Trail extension, from MBTA station to Mechanic Street |
610666 |
Swampscott |
Rail Trail construction |
S12827 |
Wakefield |
Main Street corridor improvement project |
S12826 |
Westwood, Norwood |
Reconstruction of Canton Street to University Drive, including rehabilitation of N-25-032=W-31-018 |
612963 |
Bellingham |
Roadway rehabilitation of Route 126 (Hartford Road), from 800 feet north of the I-495 NB off ramp to Medway town line, including B-06-017 |
TBD |
Malden |
Canal Street bicycle lanes |
610823 |
Quincy |
Intersection improvements at Willard Street and Ricciuti Drive |
MBTA = Massachusetts Bay Transportation Authority. MCRT = Massachusetts Central Rail Trail. TBD = to be determined.
Table B-2
DI/DB LRTP Analysis Projects
MassDOT Project ID |
Proponent |
Project Name |
605857 |
Norwood |
Intersection improvements at Route 1 and University Avenue/Everett Street |
603739 |
Wrentham |
I-495/Route 1A Ramps |
606226 |
Boston |
Reconstruction of Rutherford Avenue from City Square to Sullivan Square |
607981 |
Somerville |
McGrath Boulevard |
606109 |
Framingham |
Intersection improvements at Route 126 and Route 135/MBTA and CSX Railroad |
TBD |
Lexington |
Route 4/225 (Bedford Street) and Hartwell Avenue |
MBTA = Massachusetts Bay Transportation Authority. TBD = to be determined.
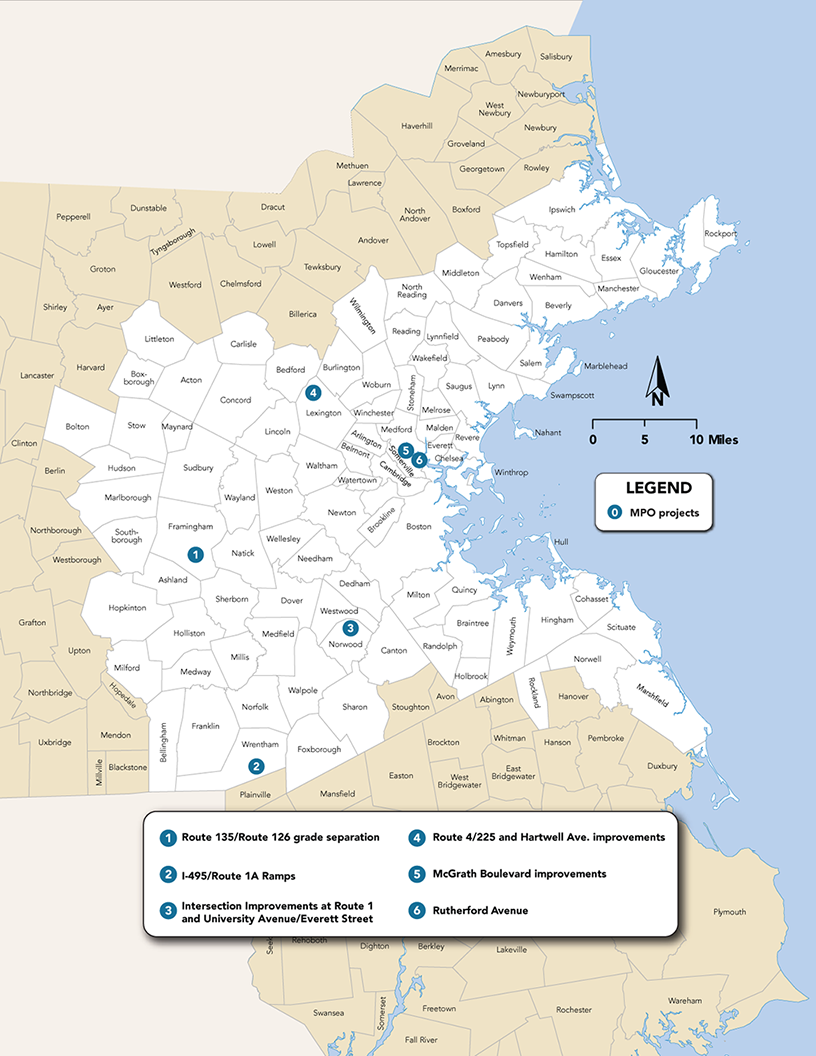
Figure B-1
Locations of DI/DB Mitigation Projects
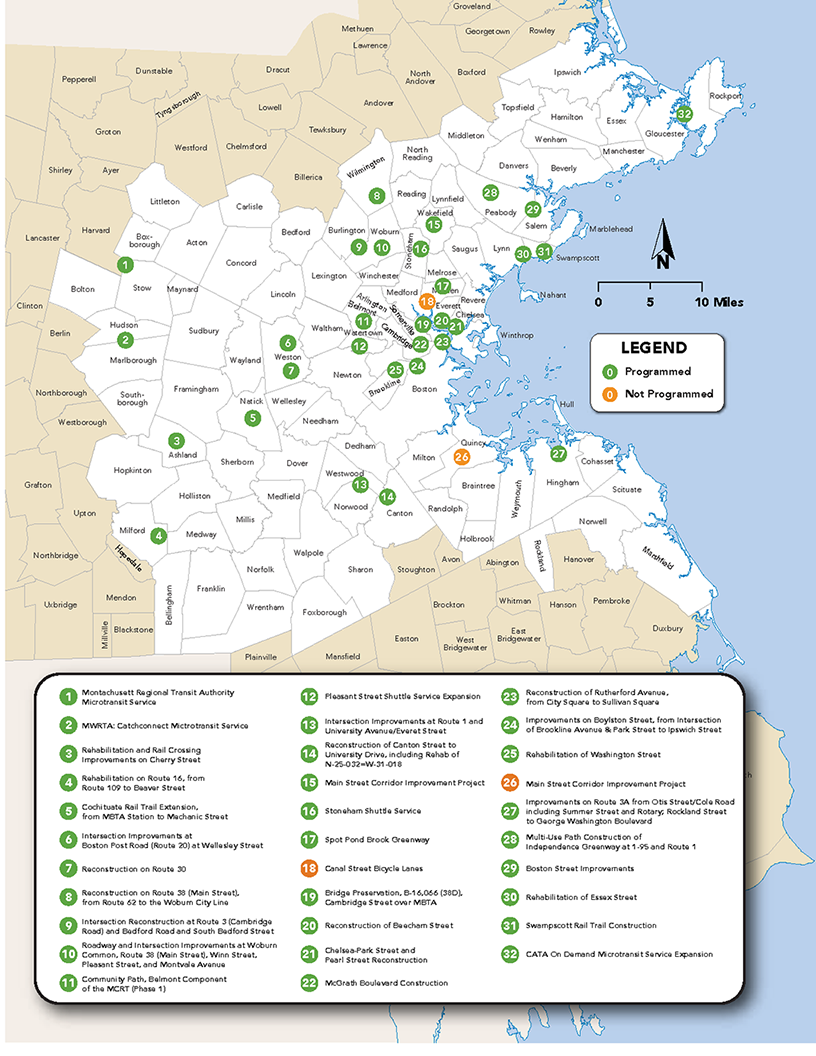
Figure B-2
Locations of DI/DB LRTP Projects