TECHNICAL MEMORANDUM
TO: Boston Region Metropolitan Planning Organization (MPO)
FROM: Steven Andrews, Boston Region MPO
RE: A Method to Evaluate Flexible Bus Service Opportunities
Flexible bus routes are designed to meet rider demand by providing service that deviates from defined stops and routes to pick up and drop off eligible passengers who request trips within a defined area. Flexible routes can provide significant benefits to older adults, people with limited mobility, and people who cannot drive. An ongoing challenge for transit providers is knowing which fixed-route services would better serve riders if they were to operate as a flexible service.
The work performed in the Flexible Fixed-Route Bus Service study is a step towards helping transportation planners determine how and when to consider shifting the operating mode of a transportation service. Our work operated in four general steps: 1) choosing a route to build the methodology; 2) choosing the parameters of the flexible-route service; 3) developing and testing a methodology on a real route, and 4) documenting ongoing opportunities for research in this subject area.
In brief, our methodology creates a geospatial representation of a bus route in terms of buffers (a traditional proximate buffer and a farther flexible-route zone buffer) and sections, or groups, which are slices along a route that provide zones that the bus might serve. Through determining the relative popularity of each zone using a novel dataset from Replica, which models activity in the built environment based on a synthetic population, we can estimate the proportion of the route where unmet demand may lay outside the traditional catchment area. The methodology was developed and tested on Brockton Area Transit’s (BAT) Route 12 and Lowell Regional Transit Authority (LRTA) Route 13. Demonstration results are presented for BAT Route 12.
The methodology described here is largely useful for routes that are relatively straight without significant looping. The outcomes are a description of the trip makers who are traveling near a fixed-route service grouped into zones and an evaluation of the number of zones for which an outside zone has more trip makers in the target population than the central zone. This information provides an operator with information about whether they may want to further explore the operation mode of the route.
This research was supported by the Boston Region Metropolitan Planning Organization (MPO). The principles of serving vulnerable populations, who may otherwise withhold trip-making, with tailored public transportation services primarily supports the Boston Region MPO’s goals of improving access and connectivity and equity, and has the secondary benefit of supporting the MPO’s goals for safety and clean air and healthy communities.
Follow up research opportunities include the following:
Our methodology is largely based on the idea that for a flexible service to work it is necessary to have 1) people who would use the service and 2) a quantity of diversions that is low enough that fixed-route service quality is not substantially degraded. The style of flexible service we envision in this analysis is a route-deviation service that features a main route from which the bus will divert to serve on-demand pick-ups or drop-offs. After serving the demand, the bus returns to its original routing approximately where it left.
The methodology can loosely be broken down into four steps:
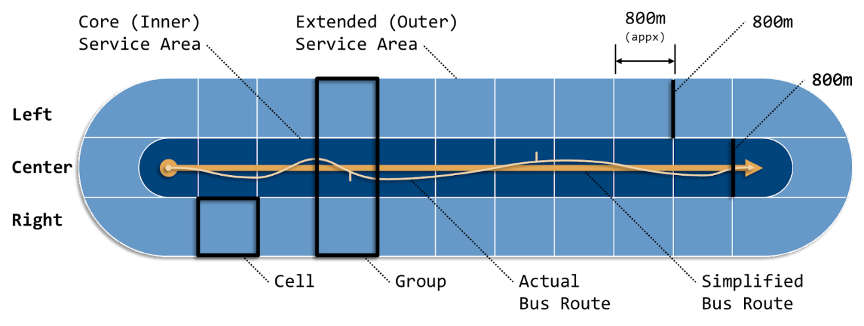
Figure 1
Geospatial representation and nomenclature of an example bus route
These cells denote zones that a bus route might serve. The process we developed simplifies the bus route, identifies critical points to define analysis groups, creates buffers, uses Voronoi polygons to section the route into cells, and performs geospatial operations to create a complex end-cap for the route.
These cells are the smallest unit of analysis and contain a collection of trips or census information. Cells belong to groups. Interior groups contain three cells (the cell to the left and right of the route and along the center of the route). End groups contain four cells (the cells to the left and right of the route, the center cell containing the terminal, and the cell just beyond the terminal).
The direction of a route is only used to determine which side of the geometry is left and right—it is not used to determine if, say, the route should operate in a flexible manner in one direction but not the other. Essentially, the route is assumed to be symmetric.
Figure 2
The quantity of trips starting from each cell made by the target population
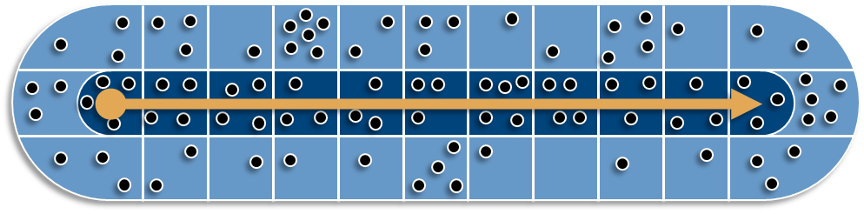
Figure 3
The outer cells in each route that contain the largest number of trips

Figure 4
A scale used to determine whether further exploration is warranted

This section provides a summary of the work completed on a regional transit authority (RTA) bus route that serves the Boston Region MPO. This section is followed by notes and potential improvements based on our experience applying the methodology.
We created a list of 10 candidate bus routes for developing this methodology. These included LRTA Routes 12, 13, 14, and 15; MetroWest Regional Transit Authority (MWRTA) Routes 1, 5, 7, and 9; and BAT Routes 12 and 14. These RTA bus routes serve at least one Boston Region MPO municipality.
We initially used LRTA Route 13 to develop the methodology. After additional development, we selected BAT Route 12 to present in this document. Both routes are relatively straight without excessive loops. LRTA Route 13 only serves one town in the Boston Region MPO area, Burlington, while BAT Route 12 serves four municipalities in the Boston region, Randolph, Quincy, Milton, and Boston.
When we initially tested out the typical version of Route 12, we discovered that its General Transit Feed Specification (GTFS) geometry feature has a “hook” at the end of the route, which caused a strange geometric representation. We instead choose to use the variation that travels near the Campello High Rise apartment complex near MBTA’s Campello Station.
Figure 5 shows the number of trips within each cell made by people meeting two or more of our five criteria and starting their trip within the route’s extended service area within the BAT service area. The image on the far-left shows trips for all people who met two of the five criteria while the other maps show the number of trips by criteria. These maps suggests that many people included in the analysis likely live in low income households and/or zero-vehicle households, although it is important to remember that this is a subset of riders that does not include people who only meet one criterion.
Figure 5
Total number of trips made within each cell by
people who meet two of the five criteria by criteria
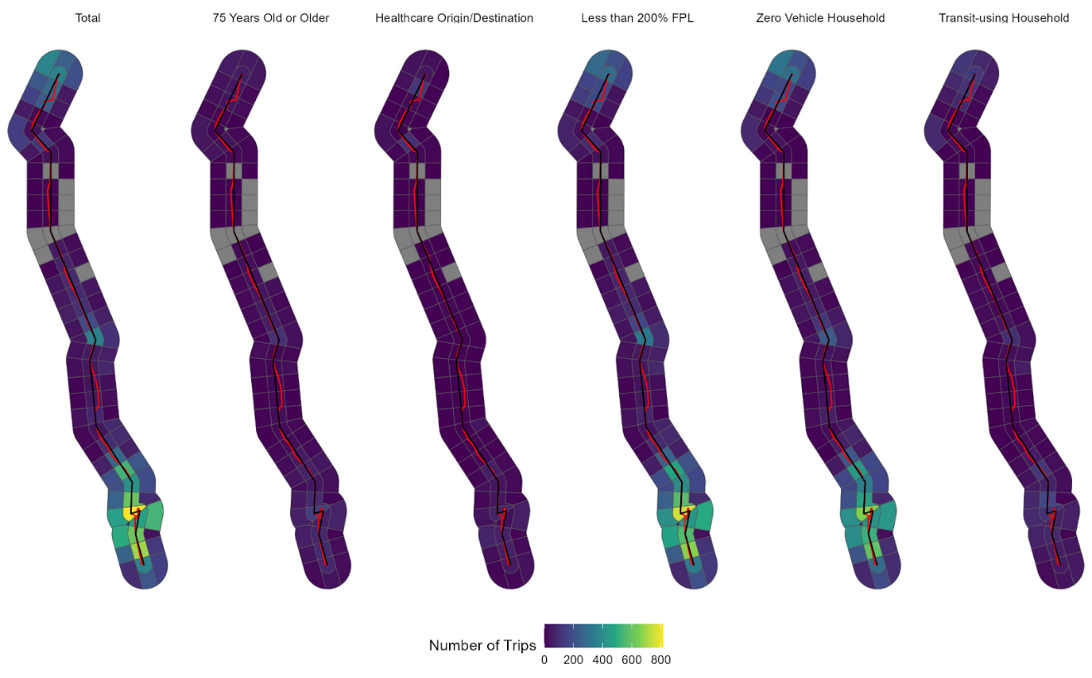
FPL = Federal Poverty Level.
Note: Except for the total column, a criterion does not show all travel for any people meeting that criterion because the dataset filtered out people who met fewer than two criteria.
We also developed a second visualization style, shown in Figure 6, that arranges the cells and displays them as equal-sized areas along a straight line. This visualization style may be easier to glance at to reveal trends, although it does skew the true sizes of the cells. In this case, it is easy to manually count the number of cells where the extended service area contains the greatest number of total trips—the values shown in the far left map in Figure 5.
Figure 6
Cells containing the largest number of
total trips within a group for the target population

For BAT Route 12, we found that in nine of the 35 potential groups, the target population made more trips in the exterior cells than the already served interior cells. This value, shown in Figure 7, is in the general area where further exploration may make sense—the value is certainly more than a few zones but not most of the route. Though it is important to remember that this scale is based on a simple heuristic attempting to generally describe the characteristics of a route where flexible service may be successful, and the scale may need significant revision.
Figure 7
An estimate of whether to continue investigating the operating mode for the route

Through the application of this methodology on BAT Route 12 and LRTA Route 13 (results not shown) we encountered many topics that need additional discussion. These topics are presented in this section.
An interesting phenomenon becomes clear when the bus alignment makes sharp turns. Take an example from BAT Route 12 shown in Figure 8. Similar to the cell sizes shown in the example graphic (Figure 1), Groups 28 and 33 have essentially equal sized cells. As the route turns left in Group 29 then back to the right at Group 31, Group 31’s left cell becomes very large and its right cell becomes pinched. A similar phenomenon occurs at Groups 29 and to a lesser extent as the turn starts (Group 30) and ends (Group 32). As the methodology stands, we left this area difference in the analysis. The large outer zone in Group 31 is the closest area to the route, and a larger area is closer to specifically that side of the route than its pinched side. A way to control for this would be to change the metric from “total trips” to a trip density metric. Certain parameters can cause a cell to disappear from the analysis. We observed this phenomenon on LRTA Route 13 when simplifying the route resulted in a sharp angle.
Figure 8
A close up view of BAT Route 12 showing the sizes of the cells in context

When creating cells, we do not check whether a bus can physically access the trip makers or whether the bus can navigate the path it would need to traverse to serve the trips. The methodology does not account for rivers (Figure 8 notes an area the bus route cannot reasonably serve), marshes, impenetrable land uses, lack of a connected roadway network, low bridges, or other natural and manmade barriers.
When developing the methodology using LRTA Route 13, for example, we identified a zone past the terminal as a place that had a notable number of trips made by people in the target population. However, the existing fixed-route service uses very convenient roadway geometry to turn itself around. A typical 40-foot transit bus may not be able to navigate the surrounding roads to provide flexible service.
A future iteration of the methodology could exclude buffer areas that are inaccessible due to natural barriers. Beyond building a better as-the-crow-flies buffer, we could use a roadway network that could create more realistically defined cells. Given that this methodology is most useful for an initial assessment and further detailed work must occur afterwards regardless, this enhancement to the methodology may not be worth the additional complexity.
The ends of the bus routes are currently modeled as a circular buffer capped with another circular buffer and sectioned into a left, center, and right cell. This is only one of many ways to cap the end of a route.
Figure 9 shows a collection of some of the other choices. The Round Ends method is currently programmed into the analysis. The Inner Square method, which would cause the center inner cell to be the same size as the rest of the inner cells, is easy to implement in the current framework. The Full Square and Inner Circle methods are relatively straightforward to implement in the current framework, but there are some surmountable issues with very small overlapping geometries upon close inspection.
The Only Left and Right method and the two Radiate variants would both work well within the existing framework but are non-trivial to implement.
Figure 9
Additional ways to end the bus route

Implementing more end cap styles would marginally affect the end results. Most of the cells are within the middle of the route and the differences in these methods seem small. If we were to explore this topic further, the Radiate from End method seems like the most desirable way to divide the end cap.
When a bus route “hooks” at one of the ends of its route (for example a bus may loop through a terminal to turn itself in the correct direction to serve passengers), the current methodology extends the route in the direction of the end of the hook rather than the general trajectory of the route. This could be solved by further geospatial operations—perhaps clipping the last 50 meters of the route or through additional work simplifying the route.
This research used travel behavior data sourced from data from Replica, which models activity in the built environment based on a synthetic population. This data differs from a traditional American Community Survey (ACS) dataset in that instead of data being aggregated to census block groups, tracts, or country subdivisions (municipalities), the modeled trip origins, trip destinations, and people are assigned to points within a census block group. While it is important to remember that the data is not the actual true demographic and trip-making patterns of individuals and their households, we expect the data to be generally useful at the area sizes used in our analysis. As an analyst chooses a smaller and smaller geography, they should become less and less confident that travel patterns are representative of a true travel pattern. For example, the small geography pinched down because of a bend in the route we discussed earlier is likely to contain spurious results, but in our case that the number is small is enough information.
The data provide information about an individual's age, income, household makeup, trip origin and destination purposes, mode of transportation, household vehicle ownership, and more. This has the distinct advantage of allowing us to avoid the tedious and—from a quality-of-output standpoint—sometimes unsatisfying work of intersecting buffers. We also use the individual level of the dataset to identify the target population as people who travel within the route and system’s service area—so the service has a chance of getting people to where they want to go—and meet two or more of the five categories—so they are the people who are more likely to actually use the service.
That said, while this style of data is becoming more and more common, having a fallback to census data would be beneficial. While we did not develop a methodology to incorporate census data, we would suggest the following tables (using the table notation from the ‘tidycensus’ R package) as reasonable candidates to replace the data we used.3
Age:
DP05_0016: Sex and Age, Total Population: 75 to 84 years
DP05_0017: Sex and Age, Total Population: 85 years and over
Difficulty Using Fixed-Route Services:
DP02_0072: Disability Status of the Civilian Noninstitutionalized Population:
With a Disability
or
Total Civilian Noninstitutionalized Population with an Ambulatory Difficulty:
S1810_C02_048: Under 18
S1810_C02_049: 18 to 64 years
S1810_C02_052: 65 years and over
Apart from ambulatory disabilities, there are also tables for hearing, vision, cognitive, self-care, and independent living disabilities that follow a similar pattern of ages. They are in the same S1810_C02 family but have different record numbers. The demographic profile question contained in DP02_0072 accounts for people with any of the various types of disabilities recorded by the ACS.
Income:
C17002_001: Ratio of Income to Poverty Level in the Past 12 Months: Total
C17002_008: Ratio of Income to Poverty Level in the Past 12 Months: 2.00 and over
Note: Subtracting the content of table C17002_008 from C17002_001 returns the population whose income to poverty ratio is less than 2.00. Alternatively, one could sum the tables C17002_002 through C17002_007 to arrive at the same value with a different margin of error.
Vehicle Ownership:
B08014_002: Sex of Workers by Vehicles Available: No Vehicles Available
Transportation Mode:
DP03_0021: Commuting to Work, Workers 16 Years and Over Using Public Transportation (Excluding Taxicab)
In some cases, ACS data may contain more information than what we obtained from Replica. For example, while Replica provides language spoken at home for each household, it does not provide data to indicate whether those people speak English “very well,” which is useful in determining a person's Limited English Proficiency (LEP) status.
A methodology using ACS-derived data would follow this general pattern:
For the lowest level of census geometry containing data we are confident in, likely census tracts, obtain the number of people contained in each population. Intersect the buffered geometry created for the bus route of concern and the census geometries. Calculate the share of each census tract’s land area in each cell of the geometry. Multiply the share of the area in each cell by the total number of people meeting each criterion to estimate the number of people meeting each criterion in each cell.
Create a weight for each category then multiply the weights by the estimates to develop a score for each cell. From there the methodology would be largely the same as the Replica-based method: identify the highest score in each row and determine how many times the cells along the route do not have the highest score.
Relative demand, using the Replica-based analysis, is found by identifying trip makers that meet two or more of the target population criteria. This value is flexible and could be changed to any number between zero and five, though zero is likely not going to yield relevant results and five will likely yield few results.
When filtering trips, we select people whose trips start along the route and end anywhere in the transit service provider’s service area. This factor could be changed to be stricter by including only trip makers whose trips start and end within the route’s service area. This population would represent a more focused group of beneficiaries. However, fewer people would be included in the dataset limiting our confidence in the synthetic population’s characteristics.
When finding the total number of trips in a cell we use the number of trips as the weight, not the number of trip makers. If a person makes two trips from a cell, that person is included twice. An alternative would be to switch this weight to be the number of trip makers, essentially including each person once per cell. This would provide a different way to view the trip-making characteristics of people in the service area.
Determining whether to switch to a flexible service requires more than a simple evaluation of the number of trips made by the target population outside the existing service area; that is to say, more trips made by the target population outside the existing service area should not necessarily lead to a switch to a flexible service. However, the two extremes—when the existing service area always or never contains the most trips—give us some insight into how we can use this method to, at least, get us to the next step of determining whether we should keep exploring a flexible service option on the route. If the center cells always contain the most trips, this may suggest that the target population is well served by the existing service.
In our demonstration described in the next section, we took the original scale and essentially scaled it up to 35 groups. It may be the case that the absolute number of cells is more important than the relative share of cells. With detailed ridership data and more detailed analytic work, we may be able to estimate whether the choice to deviate to serve a zone is significant enough to degrade the existing fixed-route performance and the experience of fixed-route riders. Gonzales and Christofa’s Flexible Transit Services report cites many analytic methods used to balance costs and benefits.4
This effort focused largely on the trip-making patterns of a target population. Beyond a warrant analysis, we could provide trip-density metrics that can be useful for determining an operating mode. These metrics would be added as additional output using the existing framework.
Our specific representation of the bus route uses two buffers: 1) a 400-meter (approximately a quarter mile) buffer around the simplified alignment of a bus route, which represents a convenient distance to travel for a bus service; and 2) a buffer between 400 to 1200 meters (approximately three quarters of a mile) away which creates an 800-meter-wide (approximately a half-mile) buffer on each side of the bus route. The second buffer distance represents the zones a bus might divert from its alignment to serve a population. The outer distance represents the distance from a bus service that a transit provider must provide complementary door-to-door paratransit service, as required by the Americans with Disabilities Act (ADA).
Three quarters of a mile is the distance cited in Gonzales and Christofa of UMass Amherst’s July 2021 Flexible Transit Services report as an example of a best practice for the distance flexible service should be provided. This value is derived from Mistretta, Goodwill, Gregg, and DeAnnuntis of the National Center for Transit Research’s 2009 Best Practices in Transit Service Planning report, which notes that “For flexible routes/demand response 100 percent [of residents] should be within [three quarters of a] mile (as designated by ADA).”5 This statement is based on a report from the City of Folsom’s 2005 Short Range Transit Plan. Beyond the Flexible Transit Services report, this distance is used by the Greater Attleboro Taunton Regional Transit Authority’s (GATRA) Manomet/Cedar Deviated Link flexible service and the Cape Cod Regional Transit Authority’s (CCRTA) Flex service.
Regardless of the provenance and usage of the value, the three-quarter mile range overlapping with the required ADA paratransit service area is a good enough reason on its own to choose this distance—agencies are already obliged to serve the area one way or another and using a flexible service may alleviate some of the need for paratransit service. It is also beneficial that this distance creates equal 800-meter-wide cells across a route when intersected with a 400-meter-wide core service area.
While some additional enhancements and modifications are noted in the above text, this section serves as a list of items we identified as possible ways to move forward with this work.
Code Restructuring and Improvements: As the codebase stands, the operator still needs to make manual adjustments to generate results. This process of developing these warrants could be more automated through restructuring and revisions. Beyond the goal of a more automated process, code review, restructuring, and revisions would be important to conduct before this methodology were to be operationalized. Additional work could lead to an interactive web application where an investigator could enter their route and develop insights into the travel patterns of potential riders.
Testing on More Routes: We could test this procedure on more bus routes to test the limits and the utility of the methodology. We would include routes serving more and less dense areas and routes with more circuitous alignments.
At least two services in eastern Massachusetts already run in a flexible manner like that proposed here: GATRA’s Manomet/Cedarville Deviated Link and CCRTA’s Flex service. Implementing this methodology on those services could provide insights into how this methodology relates to real-world flexible service implementations. We may be able to use these routes to set a proper threshold for continuing to explore whether to switch to a flexible service.
Additional Fields and Data Sources: We used five criteria present in our data source to identify target populations who may be likely to use flexible route services. Other sources of data we could include from the Replica dataset include race and ethnicity, language spoken at home, sex, employment status, and education level.
Beyond Replica-based data sources we can also include quantities of paratransit pick-up and drop-off locations occurring within each cell. People who use paratransit services, essentially by definition, have demonstrable challenges with using a traditional fixed-route service. Some of these riders might be able to be served with a flexible service that meets their needs and abilities.
As a route is identified as a potential candidate to become a flexible service, targeted survey and outreach efforts could validate whether the predicted demand truly exists in the areas (cells) that flank the bus route. This may be completed through typical ongoing municipal outreach efforts or by information gathering through a targeted survey effort. Specific identifiable facilities generating the potential demand outside the fixed-route service area, such as senior housing facilities, medical centers, or community centers, may be good populations to survey.
Regional Analysis: The mode of flexible service imagined in this document is largely turning a fixed-route service into a route-deviation flexible service where a bus diverts from its route and serves to pick up or drop off riders beyond the fixed route. There are other modes of flexible route services including zone-to-zone and door-to-door systems which may be suitable transportation solutions. Using similar data sources as those used in this study, we could review existing literature and develop a more generalized way to identify the types of areas that could serve different types of transit.
The Boston Region Metropolitan Planning Organization (MPO) operates its programs, services, and activities in compliance with federal nondiscrimination laws including Title VI of the Civil Rights Act of 1964 (Title VI), the Civil Rights Restoration Act of 1987, and related statutes and regulations. Title VI prohibits discrimination in federally assisted programs and requires that no person in the United States of America shall, on the grounds of race, color, or national origin (including limited English proficiency), be excluded from participation in, denied the benefits of, or be otherwise subjected to discrimination under any program or activity that receives federal assistance. Related federal nondiscrimination laws administered by the Federal Highway Administration, Federal Transit Administration, or both, prohibit discrimination on the basis of age, sex, and disability. The Boston Region MPO considers these protected populations in its Title VI Programs, consistent with federal interpretation and administration. In addition, the Boston Region MPO provides meaningful access to its programs, services, and activities to individuals with limited English proficiency, in compliance with U.S. Department of Transportation policy and guidance on federal Executive Order 13166.
The Boston Region MPO also complies with the Massachusetts Public Accommodation Law, M.G.L. c 272 sections 92a, 98, 98a, which prohibits making any distinction, discrimination, or restriction in admission to, or treatment in a place of public accommodation based on race, color, religious creed, national origin, sex, sexual orientation, disability, or ancestry. Likewise, the Boston Region MPO complies with the Governor's Executive Order 526, section 4, which requires that all programs, activities, and services provided, performed, licensed, chartered, funded, regulated, or contracted for by the state shall be conducted without unlawful discrimination based on race, color, age, gender, ethnicity, sexual orientation, gender identity or expression, religion, creed, ancestry, national origin, disability, veteran's status (including Vietnam-era veterans), or background.
A complaint form and additional information can be obtained by contacting the MPO or at http://www.bostonmpo.org/mpo_non_discrimination.
To request this information in a different language or in an accessible format, please contact
Title VI Specialist
Boston Region MPO
10 Park Plaza, Suite 2150
Boston, MA 02116
civilrights@ctps.org
By Telephone:
857.702.3700 (voice)
For people with hearing or speaking difficulties, connect through the state MassRelay service:
For more information, including numbers for Spanish speakers, visit https://www.mass.gov/massrelay.
2 We used “building-use: healthcare” as a proxy for people who are traveling for medical purposes. .
3 A note on census table prefixes: Data Profiles (“DP”), according to the US Census Bureau, contain “the most frequently requested social, economic, housing, and demographic data.” DP02 contains “Social Characteristics", DP03 contains “Economic Characteristics”, DP04 contains “Housing Characteristics”, and DP05 contains “Demographic Characteristics”. Base (“B”) and Collapsed (“C”) tables are detailed ACS tables, with the collapsed tables containing fewer categories and smaller margins of error than the corresponding base table. Subject (“S”) tables contain a collection of common information about specific subject matter.
4 Gonzales, Eric, and Eleni Christofa. Flexible Transit Services. Report No 21-020. University of Massachusetts Amherst, July 2021. https://www.mass.gov/doc/flexible-transit-service-final-report/download
5 Mistretta, M., J. A. Goodwill, R. Gregg, and C. DeAnnuntis. Best Practices in Transit
Service Planning. Project No. BD549‐38. National Center for Transit Research,
University of South Florida, 2009.