Route 28 Priority Corridor Study
Milton, Massachusetts
Project Manager
Seth Asante
Project Principal
Mark Abbott
Data Analysts
Kathy Jacob
Graphics
Kenneth Dumas
Cover Design
Kim DeLauri
Editor
Meghan O’Connor
The preparation of this document was supported
by Federal Highway Administration through
MPO Combined PL and 5303 #108217 and
MPO Combined PL and 5303 #112310.
Central Transportation Planning Staff is
directed by the Boston Region Metropolitan
Planning Organization (MPO). The MPO is composed of
state and regional agencies and authorities, and
local governments.
For general inquiries, contact
Central Transportation Planning Staff 857.702.3700
State Transportation Building ctps@ctps.org
Ten Park Plaza, Suite 2150 ctps.org
Boston, Massachusetts 02116
The Boston Region Metropolitan Planning Organization (MPO) operates its programs, services, and activities in compliance with federal nondiscrimination laws including Title VI of the Civil Rights Act of 1964 (Title VI), the Civil Rights Restoration Act of 1987, and related statutes and regulations. Title VI prohibits discrimination in federally assisted programs and requires that no person in the United States of America shall, on the grounds of race, color, or national origin (including limited English proficiency), be excluded from participation in, denied the benefits of, or be otherwise subjected to discrimination under any program or activity that receives federal assistance. Related federal nondiscrimination laws administered by the Federal Highway Administration, Federal Transit Administration, or both, prohibit discrimination on the basis of age, sex, and disability. The Boston Region MPO considers these protected populations in its Title VI Programs, consistent with federal interpretation and administration. In addition, the Boston Region MPO provides meaningful access to its programs, services, and activities to individuals with limited English proficiency, in compliance with U.S. Department of Transportation policy and guidance on federal Executive Order 13166. The Boston Region MPO also complies with the Massachusetts Public Accommodation Law, M.G.L. c 272 sections 92a, 98, 98a, which prohibits making any distinction, discrimination, or restriction in admission to, or treatment in a place of public accommodation based on race, color, religious creed, national origin, sex, sexual orientation, disability, or ancestry. Likewise, the Boston Region MPO complies with the Governor's Executive Order 526, section 4, which requires that all programs, activities, and services provided, performed, licensed, chartered, funded, regulated, or contracted for by the state shall be conducted without unlawful discrimination based on race, color, age, gender, ethnicity, sexual orientation, gender identity or expression, religion, creed, ancestry, national origin, disability, veteran's status (including Vietnam-era veterans), or background. A complaint form and additional information can be obtained by contacting the MPO or at http://www.bostonmpo.org/mpo_non_discrimination. To request this information in a different language or in an accessible format, please contact Title VI Specialist By Telephone: For more information, including numbers for Spanish speakers, visit https://www.mass.gov/massrelay
|
Abstract
The Route 28 Priority Corridor Study focuses on one of the locations identified in the Needs Assessment for Destination 2040, the Metropolitan Planning Organization’s (MPO) Long-Range Transportation Plan (LRTP) endorsed in 2019. The LRTP is used to guide investment decisions regarding transportation infrastructure improvements in the Boston region. The MPO prioritized Route 28 in Milton for study after considering a number of factors: the need to address poor safety conditions and traffic congestion; the desire to enhance multimodal transportation; and the potential for recommendations from the study to be implemented. This report details the existing conditions, assesses safety and operational problems, discusses options for improvements, and makes recommendations for implementing improvements. The recommendations, if implemented, would transform the roadway into a more pedestrian- and bicyclist-friendly roadway, improve safety at high-crash locations, make traffic flow and operations efficient, support the vision of connecting the neighborhoods to places, such as schools and local businesses, and promote multimodal transportation.
ES.2.. Existing Conditions and Needs Assessment
ES.3.1 Short-Term Improvements
Chapter 2— Study Location and Process
2.2 .... Study Goals and Objectives
Chapter 3—Roadway Characteristics
3.2......... Route 28 (Brook Road Corridor)
3.2......... Route 28 (Reedsdale Road Corridor)
3.2......... Route 28 (Randolph Avenue Corridor)
3.2.1 Route 28 (Brook Road) and Blue Hills Parkway
3.2.2 Route 28 (Brook Road) at St. Mary’s Road Intersection
3.2.3 Route 28 (Brook Road) at Standish Road Intersection
3.2.4 Route 28 (Brook Road and Reedsdale Road) at Central Avenue Intersection
3.2.5 Route 28 (Reedsdale Road) at Canton Avenue and Centre Street Intersection
3.2.6 Route 28 (Reedsdale Avenue) at Hospital Driveway Intersection
3.2.7 Route 28 (Reedsdale Road) at Randolph Avenue Intersection
3.2.8 Route 28 (Randolph Avenue) at Reed Street/Access Road Intersection
3.2.9 Route 28 (Randolph Avenue) at Hallen Avenue Intersection
3.2.10 Route 28 (Randolph Avenue) at Hillside Street/Driveway Intersection
3.2.11 Route 28 (Randolph Avenue) at Chickatawbut Road Intersection
4.2...... Intersection Layouts And Signal Timing Data
Chapter 5—Projects and Studies
5.1...... Reconstruction of Randolph Road and Chickatawbut Road Intersection
5.2...... The Brook Road—Road Diet.
5.3 .... Reedsdale Road at Beth Israel Deaconess Hospital: Pedestrian and Transit Improvements
Chapter 6—Existing Conditions Analysis
6.1...... Vehicle, Pedestrian, and Bicycle Volumes.
6.2...... Vehicle Speed Information
6.3...... Crash Data and Safety Analysis.
6.3.2 Highway Safety Improvement Program (HSIP) Crash Clusters
6.3.3 Predicted and Expected Crashes
6.3.4 Analysis of Crash Diagrams
6.4...... Level of Service (LOS) Analysis
6.4.2 Pedestrian Level of Service (PLOS)
6.4.3 Bicycle Level of Service (BLOS)
Chapter 7—Community and Stakeholder Engagement
Chapter 8—Deficiencies and Needs
Chapter 9—Short-Term Improvements.
9.1 .... Short-Term Improvements
Chapter 10—Long-Term Improvement Concepts
10.1... Future Traffic Projections
10.2... Brook Road Improvement Concepts
10.2.1 Concept 1—Road Diet, Separated Bike Lanes, and Parking
10.2.2 Concept 2—Road Diet, Separated Bike Lanes, Parking, and Median with Left-turn Lanes
10.2.3 Concept 3—Road Diet, Separated Bike Lanes, Parking, and Two-Way Left-Turn Lane
10.2.4 Retrofit Brook Road and Reedsdale Road and Central Avenue Intersection with Roundabout
10.3... Reedsdale Road Improvement Concepts
10.3.1 Concept 1—Road Diet Separated Bike Lanes, and Two-Way Left-Turn Lane
10.3.2 Concept 2—Road Diet, Multiuse Path, Median with Left-Turn Lanes, and Parking
10.3.3 Concept 3—Lane Diet (Narrow Lanes) with Multiuse Path
10.4... Randolph Avenue Segment Improvement Concepts
10.4.1 Concept 1—Lane Diet (Narrow Lanes) with Multiuse Path
10.4.3 Concept 2—Two Southbound Lanes, One Northbound Lane, Left-Turn Lanes, and Multiuse Path
10.4.2 Concept 3—Two-Way Left-Turn Lane, Separated Bike Lanes, and Improved Sidewalks
10.4.5 Retrofit Randolph Avenue and Reedsdale Road Intersection into Roundabout
10.5... Pedestrian LOS with Improvements
10.6... Bicycle LOS with Improvements
10.7... Safety Impacts of Proposed Improvements
10.8... Comparison of Improvement Concepts
Chapter 11—Conclusion and Next Steps.
11.1... Project Implementation
Table 1 Peak Period Pedestrian Volumes
Table 2 Peak Period Bicycle Volumes
Table 4 Route 28 Crash Statistics (Five-Year Crash Summary)
Table 5 Potential for Safety Improvements
Table 6 Comprehensive Costs of Crashes.
Table 7 Intersection Level of Service Criteria
Table 8 Brook Road: Existing Conditions, Levels of Service, Delays, and Queues.
Table 9 Reedsdale Road: Existing Conditions Levels of Service, Delays, and Queues
Table 10 Randolph Avenue: Existing Conditions Levels of Service, Delays, and Queues
Table 11 Problems and Deficiencies
Table 12 Short-Term Improvements
Table 13 Brook Road: Performance of Short-Term Improvements
Table 14 Reedsdale Road: Performance of Short-Term Improvements
Table 15 Randolph Avenue: Performance of Short-Term Improvements
Table 16 Brook Road: Performance of Long-Term Improvement Concept 1
Table 17 Brook Road: Performance of Long-Term Improvements Concepts 2 and 3
Table 18 Performance of Brook Road and Reedsdale Road Roundabout Concept
Table 19 Reedsdale Road: Performance of Long-Term Improvements— Concepts 1 and 2
Table 20 Reedsdale Road: Performance of Long-Term Improvement—Concept 3
Table 21 Randolph Avenue: Performance of Long-Term Improvement—Concept 1
Table 22 Randolph Avenue: Performance of Long-Term Improvement—Concept 2
Table 23 Randolph Avenue: Performance of Long-Term Improvement—Concept 3
Table 24 Performance of Randolph Avenue and Reedsdale Roundabout Concept
Figure 1 Route 28 in Milton Study Area and Nearby Roadways.
Figure 2 Jurisdictional Map and Study Intersections.
Figure 4 Average Weekday Traffic Volumes
Figure 5 Weekday Peak-Hour Turning Movement Volumes
Figure 6 Measured and Posted Speeds
Figure 7 Observed Intersection and Segment Crashes (2013–17)
Figure 8 Collision Diagram: Brook Road at Reedsdale Road/Central Avenue
Figure 9 Collision Diagram: Reedsdale Road at Canton Avenue and Centre Street
Figure 10 Collision Diagram: Randolph Avenue at Reedsdale Road
Figure 11 Collision Diagram: Randolph Avenue at Chickatawbut Road
Figure 12 Collision Diagram: Randolph Avenue at Hallen Avenue
Figure 13 Collision Diagram: Randolph Avenue Segment between Hallen Avenue and Hillside Street
Figure 14 Collision Diagram: Randolph Avenue Segment between Hillside Street and Chickatawbut Road
Figure 16 Short-Term Improvements: Randolph Avenue Northbound Double Left-Turn Lanes
Figure 17 Brook Road: Long-Term Improvement Concept 1
Figure 18 Brook Road: Long-Term Improvements Concepts 2 and 3.
Figure 19 Roundabout Retrofit at Brook Road and Reedsdale Road Intersection
Figure 20 Reedsdale Road: Long-Term Improvement Concept 1
Figure 21 Reedsdale Road: Long-Term Improvements Concepts 2 and 3
Figure 22 Randolph Avenue: Long-Term Improvement Concept 1
Figure 23 Randolph Avenue: Long-Term Improvements Concepts 2 and 3
Figure 24 Roundabout Retrofit at Randolph Avenue and Reedsdale RoadIntersection
Figure 25 Comparison of Improvement Concepts
Appendix A: Comments and Selection Process
Appendix B: Brook Road: Diet Project
Appendix C: Traffic and Signal Timing Data
Appendix D: Traffic Safety Data
Appendix E: Intersection Level of Service Analysis
Appendix F: Pedestrian and Bicycle Levels of Service
Appendix G: Survey Comments
Appendix H: MassDOT Highway Division Project Development Process
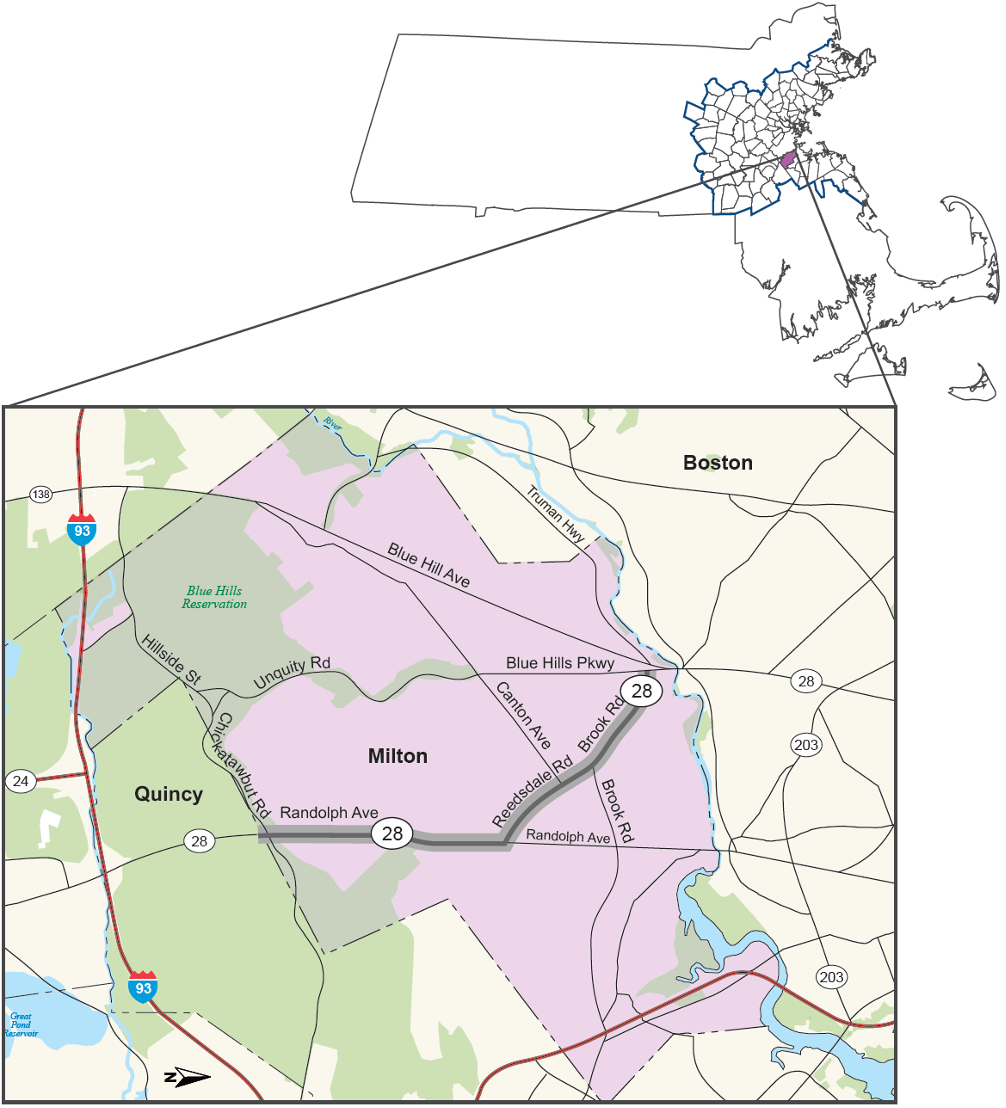
The Boston Region Metropolitan Planning Organization (MPO) selected Route 28 between Blue Hills Parkway and Chickatawbut Road in the Town of Milton as the subject of a corridor study in federal fiscal year 2020. The study focused on one of the locations identified in the Needs Assessment for Destination 2040, the MPO’s Long-Range Transportation Plan endorsed in 2019. The Needs Assessment guides investment decisions regarding transportation infrastructure improvements in the Boston region. The MPO prioritized this location for study after considering a number of factors, including the need to address poor safety conditions and traffic congestion; desire to enhance multimodal transportation; need to maintain regional travel capacity; and the potential to implement the study recommendations. This report analyzes the existing conditions, assesses safety and operational problems in the corridor, and discusses concepts for roadway improvements.
Route 28 in Milton is a two-way, four-lane principal arterial under the jurisdiction of the Massachusetts Department of Transportation (MassDOT) and Town of Milton. A series of maps are appended to this report. The maps in Figures 1 and 2 show the study area, roadway configuration, and study intersections. Because the corridor is long (about four miles), staff segmented it into three to reflect the varied contexts and allow these contexts to be considered in the needs assessment and improvement concepts. Figure 3 shows the three segments.
The MassDOT Highway Division and Boston Region MPO collected and assembled the data used to assess the existing conditions and identify problems in the corridor. The data included vehicular, pedestrian, and bicycle volumes; traffic speeds and crashes; and community input data (community survey). Figures 4 through 14 and Tables 1 through 6 summarize the collected data and Tables 7 through 10 present the existing levels of services, delays, and queues for the selected intersections. Key vehicular, pedestrian, and bicycle issues and concerns identified within the corridor are summarized in Table 11 and described below. These concerns include crossing safety issues, school drop-off and pickup safety issues, parking problems, lack of adequate sidewalk conditions, insufficient pedestrian crossing intervals, wheelchair ramps that are not compliant with the Americans with Disabilities Act, lack of safe bicycling facilities, and traffic congestion at some of the signalized intersections.
Many locations in the study area experienced a greater-than-expected number of crashes: one intersection is on the list of the Top 200 high-crash location in Massachusetts and four intersections (including the one top 200 high-crash locations) are on the list of Highway Safety Improvement Program (HSIP) crash clusters. 1 Figure 7 shows the intersection and segment crashes and HSIP intersection crash clusters. Figures 8 through 14 show the collision diagrams for the high-crash locations. Many of the crashes were caused by failure to yield, inattention or distraction, lack of left-turn lanes, and traveling at high speeds.
Complaints about high travel speeds were received for the entire corridor in the community survey. As Figure 6 shows, there is a considerable variation in posted speed limits throughout the corridor. High speed of vehicles was a major problem for people who walk or bicycle in the corridor. In addition, there were four fatalities in the segment with high posted speed limits (40–45 miles per hour) from Reedsdale Road to Chickatawbut Road.
Many of the signalized intersections in the corridor experience high levels of congestion. Tables 8 through 10 present the existing intersection levels of service and delays. The traffic safety and operational problems include, but are not limited to, lack of left-turn lanes, outdated signal timing plans, lane movement assignments, and cut-through traffic.
Based on the problems and deficiencies, staff determined the following corridor needs:
MPO staff, working with an advisory task force (representatives from MassDOT, the Town of Milton, and state legislators) developed short- and long-term improvement concepts for the corridor.
The proposed short-term improvements address safety and operational concerns that, when implemented, will improve safety for people who walk and bike, and reduce congestion. The improvements include upgrading sidewalks and wheelchair ramps to MassDOT standards and Americans with Disabilities Act (ADA)-compliance; adding countdown timers to help expedite pedestrian crossings; providing bicycle detections at signalized intersections; and painting high visibility crosswalks. In addition, the improvements include traffic signal optimization to reduce congestion, modifying clearance intervals to MassDOT standards to address high number of angle and rear-end crashes, and adding retroreflective backplates with yellow borders to the signal heads to make them more visible to motorists. These improvements are usually low cost, relatively uncomplicated and inexpensive to implement, and require minimal design efforts. The recommended short-term improvements are listed in Table 12, and the intersection level of service that would result from short-term improvements, such as signal retiming and coordination and lane movement assignments are presented in Tables 13 through 15. The analysis indicated that retiming the signals in the corridor would reduce delays between 10 and 30 percent during weekday AM and PM peak periods.
The long-term improvements, usually high cost, require more design and engineering efforts and more funding resources. These improvements would focus on modernizing the roadway to make it multimodal and pedestrian and bicycle friendly (safety, mobility, connectivity, and security). For the purposes of this study, MPO staff divided the corridor into three segments—Brook Road, Reedsdale Road, and Randolph Avenue—and developed improvement concepts for each segment. The improvement concepts are diagramed in Figures 17 through 24. The long-term improvements were aimed at transforming the roadway from a car-centric corridor into a route for everyone that meets the needs of local residents and businesses, pedestrians, bicyclists, transit riders, and motorists.
The concepts developed in this study provide MassDOT, the Town of Milton, and other stakeholders an opportunity to review conceptual options for addressing deficiencies in the corridor before committing design and engineering funds to a roadway improvement project. If implemented, the proposed improvements offered in this report would increase traffic safety, make traffic operations more efficient, and modernize the roadway to accommodate all users. This document provides a guide to possible improvements on this roadway; however, MassDOT and the Town of Milton are not obligated to make these improvements. The study aligns with the Boston Region MPO’s goals of increasing safety on the region’s highway system; modernizing roadways to improve capacity and mobility by expanding the quantity and quality of walking and bicycling infrastructure; making transit service more efficient; reducing congestion; and preserving the transportation system.
The Boston Region Metropolitan Planning Organization (MPO) has been conducting studies of roadway corridors identified through the Needs Assessment of the Long-Range Transportation Plan (LRTP) as needing infrastructure improvements to address safety, mobility, and traffic operations problems. 2 Municipalities in the region and the Massachusetts Department of Transportation (MassDOT) have been receptive to these studies, which provide the opportunity to review conceptual options to improve a specific arterial segment before committing design and engineering funds to a project. If a proponent initiates a project that qualifies for state and federal funds, the study’s documentation may be useful to both MassDOT and the project proponent for completing MassDOT Highway Division’s project initiation forms, identifying problems along the corridor, justifying the need for improvements, and providing improvement concepts to advance into the preliminary design and engineering stages.
MPO staff identified a number of arterial roadway segments listed in the LRTP that should be prioritized because the roadways require maintenance, modernization, and safety and mobility improvements. To address the problems that exist in some of these arterial segments, a LRTP priority corridor study was included in the federal fiscal year (FFY) 2020 Unified Planning Work Program (UPWP).3 Staff selected Route 28 in the Town of Milton as the subject of the priority corridor study. MPO staff selects locations for study (considering agency, municipal, subregional, and other public feedback) and collects data, conducts technical analysis, and recommends improvements. Recommendations from the study are sent to implementing agencies, which may choose to fund improvements through various federal, state, and local sources, separately or in combination.
Chapter 2— Study Location and Process
On November 7, 2019, the Boston Region MPO identified the Route 28 in Milton study, following a selection process that involved a review of safety conditions, congestion, multimodal and regional significance of the roadway, regional equity, and the potential for implementing study recommendations. 4, 5, 6,7 ,8 ,9 Figure 1 shows the study corridor and the surrounding area.
The study location was selected from a list of 44 arterial segments in 37 municipalities in the Boston Region MPO area.10 A copy of the technical memorandum describing the selection process is included in Appendix A. MassDOT Highway Division District 6, the MassDOT Office of Transportation Planning, and the Town of Milton supported the study of Route 28 by collecting data needed for the analyses, reviewing documentation of existing conditions, identifying problems, and developing improvements to mitigate the problems.
Figure 1
Route 28 in Milton Study Area and Nearby Roadways

MassDOT and the Town of Milton have shown a commitment to improving conditions to transform this car-centric corridor into a route for everyone by
Toward that end, the objectives of this study were to
An advisory task force composed of representatives from Milton, MassDOT, and the state legislators representing Milton was established to guide this study. MPO staff met with the task force twice. In the first meeting, the work scope and existing problems were discussed. In the second meeting, MPO staff presented the existing condition analyses, proposed improvements, and received advice from the task force members. This report reflects the task force’s feedback. Appendix A includes a list of task force members and comments.
Chapter 3—Roadway Characteristics
Route 28 in Milton is a state and town highway. Figure 2 shows the jurisdictions of the roadway and selected intersections identified for study. The study corridor is about four miles long and assumes the local road names of Brook Road, Reedsdale Road, and Randolph Avenue. It is a four-lane, two-way roadway classified as an urban principal arterial and part of the National Highway System program. The Brook Road segment was recently reconfigured in October 2020 to a two-way, two-lane roadway with on-street protected bicycle lanes on either side of the roadway and parking at selected locations (Appendix B). The reconfiguration allowed continuous bicycle lanes from Adams Street to the Blue Hills Parkway and added parking for recreational and school needs. The roadway’s right-of-way width varies between 65 feet and 72 feet, with the wider sections on Brook Road and Reedsdale Road and the narrower section on Randolph Avenue. This roadway serves regional and local traffic and includes several MPO transportation equity zones. The posted speed limit varies from 25 miles per hour (mph) to 45 mph throughout the corridor.
In this study, the corridor was divided into three segments for evaluation: Brook Road, Reedsdale Road, and Randolph Avenue (Figure 3). These road segments have different characteristics and contexts that define needs and considerations for developing improvement concepts. The three roadway segments and selected intersections for study are described below.
Figure 2
Jurisdictional Map and Study Intersections

Figure 3
Study Area Key Map

The Brook Road segment is about 0.75 miles long. The area surrounding Brook Road has mixed land uses: residential, recreational, and educational. The St. Mary of the Hills School and Pierce Middle School are located in this section of the corridor, and both driveways are on Brook Road. In addition, the Kelly Field and Brook Road Playground is located adjacent to the road on the west side. There are many residences abutting the road. The speed limit in this corridor is 20 mph at the school zones and 25 mph otherwise. Due to the schools and playgrounds, parking is an issue during school openings and closings and in afternoons for field and playground activities. There are sidewalks on either side of the street. In October 2020, Brook Road was converted from a four-lane road to a two lane road. The reconfiguration added bike lanes on either side of the road and parking at selected locations. The reconfiguration has addressed some of the parking issues and improve connectivity and safety for people who bike.
The Reedsdale Road segment is about one mile long. The area surrounding Reedsdale Road is primarily residential. The Beth Israel Deaconess Hospital is located in this corridor and has a driveway on Reedsdale Road. The speed limit is 30 mph near the signalized intersections and 35 mph otherwise. There are sidewalks on either side of the roadway, but bicycles share the road with vehicles. Transit and pedestrian improvements were previously constructed in April 2020 at the hospital’s driveway, including the installation of a pedestrian hybrid beacon signal and ADA-compliant wheelchair ramps.
The Randolph Avenue segment is about 1.8 miles long. The area surrounding Randolph Avenue is primarily residential and recreational. The Wollaston Golf Club and Granite Links Golf Club are located in the corridor. Many of the residences have driveways on Randolph Avenue or the driveways are accessed through the side streets, requiring turns into and out of Randolph Avenue. There are sidewalks on either side of the street, but bicycles share the road with vehicles. The speed limits in this corridor are 40 mph and 45 mph. The Wollaston Golf Club has its main entrance on Randolph Avenue at the intersection with Ridgewood Road.
Several cross streets and driveways intersect Route 28, which creates safety and operations issues for motorists, pedestrians, and bicyclists. There are eight signalized intersections in the corridor, equipped with fully- or semi-actuated traffic-control systems, however, these systems require updating, lack emergency preemption, and the existing signal timings and phasing plans are outdated. The following section describes the geometry, traffic and control, and land uses surrounding the signalized intersections. Figure 2 shows the aerial photos of the study intersections.
Blue Hills Parkway is the first intersection to the north of the study area. It intersects Route 28 to form a four-leg signalized intersection. At the intersection, Blue Hills Parkway (Route 28) southbound approach has two travel lanes, a shared through and left-turn lane, and an exclusive left-turn lane. Blue Hills Parkway’s northbound approach has two lanes, a share through/right lane and an exclusive through lane. Brook Road (Route 28) westbound approach has two exclusive right-turn lanes and one travel lane for moving traffic at the eastbound approach. The intersection is equipped with a TS2 Type 1 signal controller, which operates as a fully-actuated and isolated traffic signal with bicycle detection. The signal heads are mounted on overhead mast arms with black backplates and no retroreflective yellow borders. There are functioning pedestrian signals with pedestrian-activated pushbuttons, but these signals are not accessible. An accessible pedestrian signal is an integrated device that communicates information about the WALK and DON'T WALK intervals at signalized intersections in nonvisual formats (i.e., audible tones and vibrotactile surfaces) to pedestrians who are blind or have low vision. Crosswalks are provided on all legs of the intersection and the wheelchair/curb ramps have detectable warning plates. The channelized islands and medians at the intersection have adequate openings for wheelchairs ramps. Street lights are present at the intersection. This is one of the critical intersections in the corridor—congested during peak periods with high traffic volumes on Route 28 (a high crash location) and difficult to cross for people who walk and bike. The land use near the intersection is mostly residential and the Tucker Elementary School is 500 feet south of the intersection. A school crossing guard helps students cross at the intersection during school openings and closings.
St. Mary’s Road is a town-owned street that intersects Brook Road to form a three-leg signalized intersection. Each of the approaches on Brook Road has one travel lane that is shared with the left- and right-turn movements, and one lane on St. Mary’s Road for moving all traffic at the approach. The intersection has a semi-actuated and coordinated traffic signal system with functioning accessible pedestrian signals. The traffic signal is interconnected with the midblock pedestrian signal at the St. Mary of the Hills School. The signal heads are mounted on posts and have backplates with retroreflective yellow borders to make them more visible. Crosswalks are provided at the intersection and the wheelchair ramps have detectable warning plates. Street lights are present at the intersection. The Massachusetts Bay Transportation Authority (MBTA) Bus Route 245 has stops at the intersection. The land uses adjacent to the intersection are primarily residential, however, the St. Mary of the Hills School and Kelly Field are located about 500 feet south of the intersection.
Standish Road is a town-owned street that intersects Brook Road to form a three-leg signalized intersection. At the intersection, each approach has one travel lane serving all traffic movements. The intersection has a semi-actuated and coordinated traffic signal system with functioning accessible pedestrian signals. The signal heads are mounted on posts and some have backplates with yellow retroreflective borders. Crosswalks are provided at the intersection, but the wheelchair ramps lack detectable warning plates and are not ADA compliant. Street lights are present at the intersection. The land uses adjacent to the intersection are a mix of educational, recreation, and residential.
Reedsdale Road and Central Avenue are town-owned local roadways. They intersect Brook Road at oblique angles to form a five-leg signalized intersection. The westbound approach of Brook Road has two through lanes and an exclusive left turn lane. Each of the approaches of Brook Road eastbound, Reedsdale Road northbound, and Central Avenue southbound have two travel lanes (a shared left-turn/through lane and a shared through/right lane). The Central Avenue northbound approach has one lane moving traffic in all directions. The intersection is equipped with a fully-actuated and isolated traffic signal system with functioning accessible pedestrian signals. All of the signal heads are mounted on posts and do not have backplates with retroreflective yellow borders. Crosswalks are provided at the intersection, but the wheelchair ramps lack detectable warning plates and are not ADA compliant. Street lights are present at the intersection. Bicycle lanes are provided on the east leg of Brook Road and the north leg of Central Avenue, but the lanes end at the intersection. The land uses in the area are mostly educational and residential.
Canton Avenue and Centre Street are town-owned streets that intersect Reedsdale Road to form a five-leg signalized intersection. At the intersection, Reedsdale Road has two through lanes on each approach that are shared with left- and right-turn movements. The Canton Avenue eastbound approach has two travel lanes, a shared left-turn/through lane, and an exclusive right-turn lane. The Canton Avenue westbound approach and Centre Street southbound approach each have one lane on the approach serving all traffic movements. The intersection is equipped with a fully-actuated and isolated traffic signal system with functioning accessible pedestrian signals. The signal heads are a mixture of mast arm and post mounts, and the signals have backplates with retroreflective yellow borders. Crosswalks are provided on all legs of the intersection, but the wheelchair ramps have no detectable warning plates. Street lights are present at the intersection. The intersection handles high traffic volumes and it is congested during peak periods. The land use in the area is mostly residential, and the Milton Public Library is located in the southeastern corner of the intersection.
Beth Israel Deaconess Hospital’s driveway intersects Reedsdale Road to form a three-leg unsignalized intersection. At the intersection, Reedsdale Road has two travel lanes on each approach that are shared with the left- and right-turn movements. The driveway has one lane on its approach serving all traffic movements. The intersection was recently equipped with pedestrian hybrid beacon signals that are mounted overhead on mast arms and have backplates. There are functioning pedestrian signals with pushbuttons, and the crosswalks have wheelchair ramps with detectable warning plates. Street lights are present at the intersection. The land use in the area is mostly residential.
Reedsdale Road is a town-owned road, which intersects Randolph Avenue, a state-owned road to form a four-leg signalized intersection. The intersection is under MassDOT’s jurisdiction. At the intersection, Randolph Avenue northbound approach has two travel lanes (an exclusive left-turn lane and shared through/right-turn lane) while the southbound approach has one lane serving all traffic movements. Reedsdale Road eastbound approach has two travel lanes (an exclusive right-turn lane and shared through/left-turn lane) while the westbound approach has two travel lanes (shared left-turn/through lane and shared through/right lane). The signal heads are mounted overhead on mast arms and the signals have backplates with no retroreflective yellow borders. There are functioning pedestrian signals at all four corners of the intersection, but the signals are not accessible. Crosswalks with wheelchair ramps are provided on all legs of the intersection, but the crosswalks have no detectable warning plates. The intersection handles high volumes of traffic and it is congested during peak periods. Street lights are present at the intersection. The land uses adjacent to the intersection are mixed commercial and residential. The St. Elizabeth Rectory is located in the northwestern corner of the intersection.
Reed Street is a town-owned street that intersects Randolph Avenue to form a four-leg signalized intersection. The intersection is under MassDOT’s jurisdiction. Access Road is a private road to the Granite Links Golf Club; it is currently closed to traffic. The intersection is under MassDOT’s jurisdiction. Randolph Avenue has two through lanes on each approach that are shared with the left and right turns while Reed Street has one lane on its approach serving all movements. The intersection is equipped with a TS2 Type 1 signal controller, which operates as a fully-actuated system in isolated mode. The signal heads are mounted on a mixture of mast arms and posts, and the signals have backplates without yellow retroreflective borders. Functioning pedestrian signals with pedestrian-activated pushbuttons are provided, but are not accessible. There are crosswalks on all legs of the intersection with wheelchair ramps, but the crosswalks lack detectable warning. Street lights are present at the intersection. The land uses near the intersection are primarily residential and recreational. Because of cut-through traffic during the morning peak travel period, turns into Reed Street are prohibited from 7:00 AM–9:00 AM.
Hallen Avenue is a town-owned street that intersects Randolph Avenue to form a three-leg unsignalized intersection. The intersection is under MassDOT’s jurisdiction. At the intersection, Randolph Avenue has two lanes on each approach that are shared with the left- and right-turn lanes. Hallen Avenue has a single lane serving all traffic movements at the approach. There are no crosswalks at the intersection. The land use adjacent to the intersection is primarily residential. Because of cut-through traffic during the morning peak travel period, turns into Hallen Avenue are prohibited from 7:00 AM–9:00 AM.
Hillside Street is a town-owned road that intersects Randolph Avenue to form a four-leg signalized intersection. The intersection is under MassDOT’s jurisdiction. At the intersection, Randolph Avenue has two through lanes on each approach, which are shared with the left and right turns. Hillside Street has a single lane on its approach for all movements. The fourth leg of the intersection is a driveway that provides access to an adjacent residence. The intersection is equipped with a TS2 Type 1 signal controller, which operates as a fully-actuated system in isolation mode. The signal heads are mounted on a combination of mast arms and posts, and have backplates without yellow retroreflective borders. Functioning pedestrian signals with pedestrian-activated pushbuttons are provided but are not accessible. There are crosswalks on all legs of the intersection with wheelchair ramps, but the crosswalks lack detectable warning. Street lights are present at the intersection. The land use adjacent to the intersection is primarily residential.
Chickatawbut Road is a state-owned road that intersects Randolph Avenue to form a four-leg signalized intersection. The intersection is under MassDOT’s jurisdiction. At the intersection, Randolph Avenue has two through lanes on each approach, which are shared with the left and right turns. Chickatawbut Road has a single lane on each approach for all movements. The intersection is equipped with a TS2 Type 1 signal controller, which operates as a fully-actuated system in isolation mode. The signal heads are mounted on mixture of mast arms and posts, and have backplates without yellow retroreflective borders. Functioning pedestrian signals with pedestrian-activated pushbuttons are provided, but the signals are not accessible. There are crosswalks on all legs of the intersection with wheelchair ramps, but there is no detectable warning. Street lights are present at the intersection. The land uses adjacent to the intersection are primarily residential and recreational. This intersection is currently in MassDOT’s project design process and includes improvements to address its problems—it is therefore excluded from this study.
MPO staff gathered data on vehicle, pedestrian, and bicycle volumes, vehicle travel speeds, crashes, signal timing information, and roadway and intersection geometry data for existing conditions analyses.
MassDOT Highway Division’s Traffic Data Collection section collected traffic data for the study. Automatic traffic recorder (ATR) counts were collected during a seven-day period from Monday, October 26, 2020, to Sunday, November 1, 2020. The ATR counts included daily traffic volumes, speeds, and traffic mix (light and heavy vehicles). MassDOT also collected turning-movement counts (TMC) in the study area on Thursday, October 15, 2020, and on Saturday, October 17, 2020. The TMC counts were performed during the weekday AM peak travel period (6:00 AM to 9:00 AM) and weekday PM peak travel period (3:00 PM to 6:00 PM). In all cases, heavy vehicles, pedestrians, and bicycles were recorded separately.
MassDOT provided MPO staff with intersection layouts. Staff conducted field visits to verify modifications to the intersection layouts and signal timing plans.
MassDOT Highway District 6 and the Town of Milton provided MPO staff with existing signal timings, as-built traffic signal plans, and signal-phase sequences of the signalized intersections.
MPO staff used crash data obtained from MassDOT’s Registry of Motor Vehicles database from January 2013, through December 2017, to evaluate safety for motorists, pedestrians, and bicyclists in the study area.
Transit service data from the MBTA and the Brockton Area Transit Authority (BAT) were gathered to evaluate transit services in the corridor.
MassDOT and the Town of Milton provided information on planned and proposed projects in the corridor.
Chapter 5—Existing Conditions Analysis
Due to the COVID-19 pandemic, the Route 28 October 2020 traffic counts were 30 percent lower. The counts were adjusted by using 2014 historical counts at the intersections of Reedsdale Road at Randolph Avenue and Randolph Road at Chickatawbut Road.
Figure 4 shows a summary of the adjusted average weekday traffic volumes. The amount of daily traffic volumes range from 18,000 to 30,000 vehicles per day. The volumes showed a gradual increase from north of the corridor to south of the corridor. The Randolph Avenue segment carried the highest volume of traffic and Brook Road and Reedsdale Road carried the lowest volume. The higher volumes occurred on Randolph Avenue, because major crossroads intersect Route 28 and connect to the Interstate 93 (Route 128) corridor via Randolph Avenue. Appendix C contains full records of the ATR counts.
Figure 5 shows the turning movement volumes at 12 intersections during the weekday AM and PM peak hours and Saturday PM peak hour. Peak hours in the corridor were recorded as 6:30 AM to 7:30 AM in the morning, 4:00 PM to 5:00 PM in the afternoon, and 12:30 PM to 1:30 PM on Saturday. Because of the pandemic, the October 2020 counts were lower by about 30 percent on Route 28. The counts were adjusted by using 2014 historical counts at the intersections of Reedsdale Road at Randolph Avenue and Randolph Road at Chickatawbut Road. The turning movement data are included in Appendix C.
The TMC data also included volumes of pedestrians and bicyclists during the three-hour collection periods (weekday AM and PM and Saturday midday). Table 1 distinguishes the number of pedestrians that crossed Route 28 from those that crossed an adjacent side street on the east or west side of Route 28. The counts show that pedestrian activity is highest on Brook Road at Standish Road and Central Avenue intersections, which is also the area where the schools and playgrounds are located. The counts show that pedestrian activity is also high on Reedsdale Road, which serves the residential neighborhood and the Beth Israel Deaconess Hospital.
Figure 4
Average Weekday Traffic Volumes
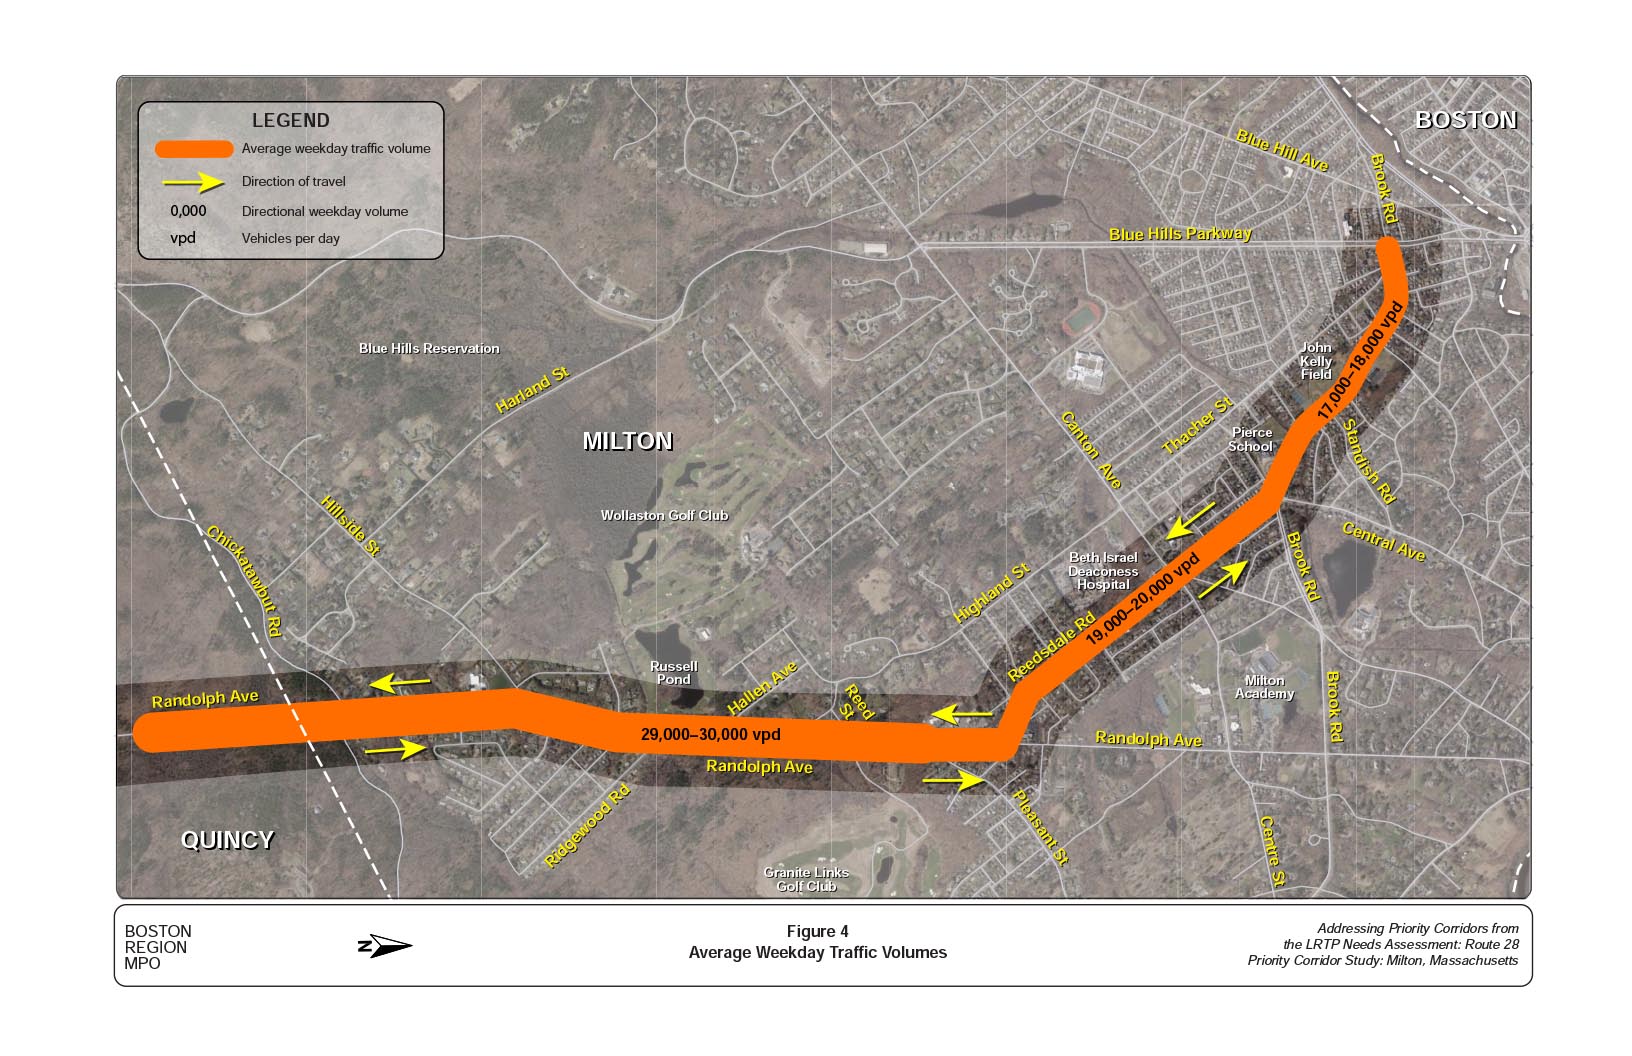
Figure 5
Weekday Peak-Hour Turning Movement Volumes
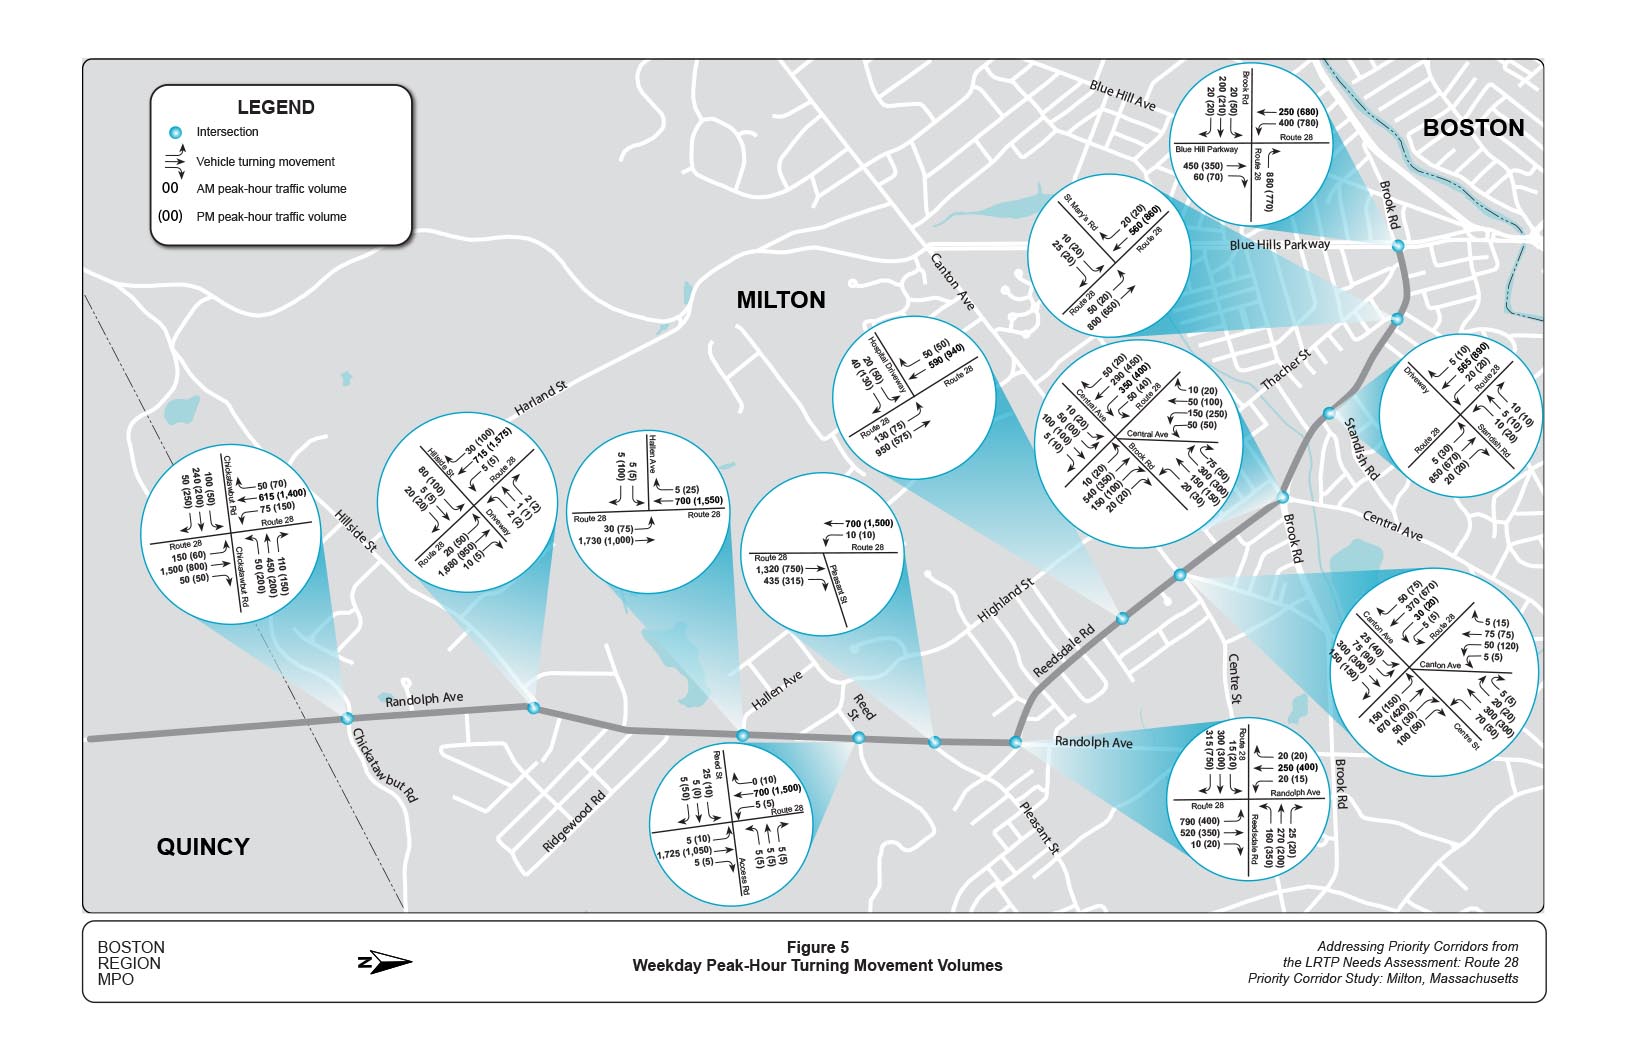
Table 1
Peak Period Pedestrian Volumes
Route 28 Intersection |
Route 28 |
Side Street on the west |
Side Street on the east |
Total |
Blue Hills Parkway/Brook Road |
130 |
66 |
-- |
196 |
Thacher Street |
17 |
79 |
-- |
96 |
St. Mary’s Road |
53 |
35 |
63 |
151 |
Standish Road |
152 |
120 |
86 |
358 |
Central Avenue/Brook Road |
114 |
53 |
64 |
231 |
Canton Avenue/Centre Street |
97 |
35 |
47 |
179 |
Beth Israel Deaconess Hospital |
21 |
56 |
82 |
159 |
Reedsdale Road/Randolph Avenue |
107 |
14 |
16 |
137 |
Reed Street/Access Road |
4 |
7 |
16 |
27 |
Hallen Road |
0 |
9 |
-- |
9 |
Hillside Street |
11 |
9 |
7 |
27 |
Chickatawbut Road |
11 |
1 |
0 |
12 |
Note: Weekday AM = 6:00 AM to 9:00 AM. Weekday PM = 3:00 PM to 6:00 PM. Weekend PM 11:00 AM to 2:00 PM. Shading denotes that a crosswalk is absent on Route 28 at this location.
Source: Central Transportation Planning Staff.
Counts of bicycles on the road and at crosswalks were moderate (Table 2). MPO staff attributes the moderate cyclist volumes primarily to the absence of appropriate facilities in the corridor, high volumes of traffic, and high speeds of vehicles, which create high stress and safety concerns. The data indicate that most bicycle activities take place on Brook Road and Reedsdale Road.
Table 2
Peak Period Bicycle Volumes
Route 28 Intersection |
Bicycle on Road |
Bicycle on Crosswalk |
Total |
Blue Hills Parkway/Brook Road |
121 |
32 |
153 |
Thacher Street |
37 |
6 |
43 |
St. Mary’s Road |
36 |
18 |
54 |
Standish Road |
53 |
43 |
96 |
Central Avenue/Brook Road |
52 |
36 |
88 |
Canton Avenue/Centre Street |
23 |
23 |
46 |
Beth Israel Deaconess Hospital |
10 |
23 |
33 |
Reedsdale Road/Randolph Avenue |
17 |
23 |
40 |
Reed Street/Access Road |
13 |
9 |
22 |
Hallen Road |
10 |
3 |
13 |
Hillside Street |
12 |
0 |
12 |
Chickatawbut Road |
38 |
0 |
38 |
Note: Weekday AM = 6:00 AM to 9:00 AM. Weekday PM = 3:00 PM to 6:00 PM. Weekend PM 11:00 AM to 2:00 PM. Shading denotes that a crosswalk is absent on Route 28 at this location.
Source: Central Transportation Planning Staff.
MPO staff collected vehicle spot speeds at three of the ATR sites on Route 28. The spot speeds measure vehicle speeds at a specific point and do not include delays at the intersections when traveling through the corridor. Table 3 presents the measured spot speeds, and Figure 6 shows the spot speed data and compares it with the posted speed regulations. The data show that the 85th percentile speeds were higher than the posted speed limits, because of the high speeds of vehicles during the off-peak periods. In other words, the 85th percentile speeds are speeds that 15 percent of the motorists sampled exceeded while driving in the corridor. The average spot speeds were also higher than the speed limits on Brook Road and Reedsdale Road, but consistent with the speed limits on Randolph Avenue. Appendix C includes the speed data.
Table 3
Observed Spot Speeds
Location |
Direction |
Average Speed (mph) |
85th Percentile Speed (mph) |
10 mph Pace Speed (mph) |
Average Speed Exceeds Posted Speed Limit? |
85th Percentile Speed Exceeds Posted Speed Limit? |
Brook Road south of Ridge Road |
NB |
No data |
No data |
No data |
No data |
No data |
Brook Road south of Ridge Road |
SB |
34 |
39 |
25–35 |
Yes |
Yes |
Reedsdale Road north of Spafford Road |
NB |
43 |
50 |
35–45 |
Yes |
Yes |
Reedsdale Road north of Spafford Road |
SB |
38 |
44 |
30–40 |
Yes |
Yes |
Randolph Avenue south of Pleasant Street |
NB |
37 |
43 |
30–40 |
No |
Yes |
Randolph Avenue south of Pleasant Street |
SB |
43 |
49 |
35–45 |
Yes |
Yes |
Randolph Avenue south of Hillside Street |
NB |
40 |
48 |
30–40 |
Yes |
Yes |
Randolph Avenue south of Hillside Street |
SB |
38 |
44 |
30–40 |
No |
Yes |
mph = miles per hour. NB = northbound. SB = southbound.
Source: Central Transportation Planning Staff.
Figure 6
Measured and Posted Speeds

During the five-year analysis period, 473 crashes were recorded in the MassDOT database. Table 4 presents a summary of the crashes. Some characteristics of the crashes include the following:
Table 4
Route 28 Crash Statistics (Five-Year Crash Summary)
Crash Variable |
All Crashes |
Percent (%) |
Crash Severity |
¾ |
¾ |
Fatal injury |
4 |
1 |
Nonfatal injury |
189 |
40 |
Property damage only (none injured) |
267 |
56 |
Not Reported |
13 |
3 |
Manner of Collision |
¾ |
¾ |
Rear-end |
126 |
27 |
Angle |
168 |
36 |
Sideswipe, same direction |
42 |
9 |
Single vehicle crash |
100 |
21 |
Head-on |
17 |
4 |
Sideswipe, opposite direction |
12 |
2 |
Not reported |
8 |
1 |
Road Surface Conditions |
¾ |
¾ |
Dry |
361 |
76 |
Wet |
74 |
16 |
Snow/ice/slush |
34 |
7 |
Not reported |
4 |
1 |
Ambient Light Conditions |
¾ |
¾ |
Daylight |
325 |
69 |
Dark—lighted roadway |
123 |
26 |
Dusk |
14 |
3 |
Dawn |
4 |
1 |
Dark—roadway not lighted |
2 |
0 |
Other |
2 |
0 |
Not reported |
3 |
1 |
Weather Conditions |
¾ |
¾ |
Clear |
290 |
61 |
Cloudy |
99 |
21 |
Rain |
54
|
11 |
Snow/sleet/hail |
23 |
5 |
Fog/smog/smoke |
3 |
1 |
Not reported |
4 |
1 |
Travel Period |
¾ |
¾ |
Off-peak |
291 |
62 |
Peak |
182
|
38 |
Pedestrian and Bicycle Crashes |
¾ |
¾ |
Vehicle crashes |
464 |
98 |
Pedestrian-related crashes |
3 |
1 |
Bicycle-related crashes |
6
|
1 |
Crash Location |
|
|
Intersection |
302 |
64 |
Segment |
171 |
36 |
Total crashes |
473 |
100 |
Note: Peak periods are 6:00 AM to 9:00 AM and 3:00 PM to 7:00 PM, Monday through Friday.
Source: Central Transportation Planning Staff.
The HSIP provides funding for eligible improvements that reduce fatalities and serious injuries on public roads. An HSIP-eligible cluster is one in which the total number of EPDO crashes are within the top five percent in the Metropolitan Area Planning Council region. An HSIP-eligible project is any strategy, activity, or project that corrects or improves a hazardous public road location or feature, or addresses a highway safety problem.
Figure 7 shows the crashes at the intersections and between segments, and identifies the HSIP intersection crash clusters within the study corridor. Four intersections on the corridor are HSIP crash clusters.
Figure 7
Observed Intersection and Segment Crashes (2013–17)

MPO staff used the regionalized versions of the Highway Safety Manual (HSM) method for its analysis of intersections. 11 The techniques in the HSM combine roadway geometry, traffic volumes, crash history, and regional factors into unified metrics referred to as predicted and expected crashes. The predicted number of crashes is the estimated crashes under idealized circumstances. The expected number of crashes estimates the intrinsic safety conditions at a site by compensating for the random fluctuations typically associated with samples of crash data. The predicted and expected crashes are used to identify high-risk sites with potential for safety improvements, and to compare the relative merits of different intervention strategies.12 The difference between predicted and expected crashes is referred to as the potential for safety improvement (PSI). If the predicted number of crashes is significantly less than the expected number of crashes, it suggests that correctable factors are elevating the crash rate.
For each intersection and road segment, Table 5 shows the average number of observed, predicted, and expected crashes, along with the total number of crashes that were recorded between 2013 and 2017. Table 5 also shows the numerical values of the PSI for the different intersections and segments (shaded green) within the corridor. This comparison provides insight into the responsiveness of a particular location to potential safety interventions. Many locations in the study area are high-risk sites with potential for safety improvements.
Table 6 shows the total estimated comprehensive societal cost per year that resulted from crashes within the corridor. Estimated costs based on expected crashes per year are well above $12 million, which demonstrates that investing in safety improvements inside the corridor could yield large returns when considering the comprehensive societal cost.13 14 Appendix D provides details about the input data, computational steps, and HSM formula outputs.
Table 5
Potential for Safety Improvements
Intersection/Segment |
Total Crashes (2013–17) |
HSIP |
Average Observed Crashes |
Average Predicted Crashes |
Average Expected Crashes |
PSI |
High -risk Site |
Observed Crashes > Expected Crashes |
Brook Road segment |
42 |
-- |
8.40 |
7.90 |
8.16 |
0.26 |
Yes |
Yes |
Brook Road at Blue Hill Parkway/Thacher Street |
30 |
No |
8.20 |
6.90 |
7.47 |
0.57 |
Yes |
Yes |
Brook Road at St. Mary’s Road |
5 |
No |
1.00 |
4.80 |
1.35 |
-3.45 |
No |
No |
Brook Road at Standish Road |
8 |
No |
1.60 |
3.90 |
0.91 |
-2.99 |
No |
Yes |
Brook Road at Central Avenue |
41 |
Yes |
8.40 |
6.40 |
7.83 |
1.43 |
Yes |
Yes |
Reedsdale Avenue segment |
31 |
-- |
6.2 |
10.53 |
6.90 |
-3.63 |
No |
No |
Reedsdale Road at Canton Avenue |
32 |
Yes |
7.40 |
7.20 |
7.26 |
0.06 |
Yes |
Yes |
Reedsdale Road at Beth Israel Deaconess Hospital |
4 |
No |
0.60 |
2.30 |
0.96 |
-1.34 |
No |
No |
Randolph Avenue segment |
88 |
-- |
17.60 |
14.01 |
14.42 |
0.41 |
Yes |
Yes |
Randolph Avenue and Reedsdale Road |
29 |
Yes |
6.20 |
10.70 |
7.33 |
-3.37 |
No |
No |
Randolph Avenue at Reeds Road |
17 |
No |
3.60 |
7.80 |
4.81 |
-2.99 |
No |
No |
Randolph Avenue at Hallen Avenue |
24 |
No |
4.80 |
6.50 |
5.44 |
-1.06 |
No |
No |
Randolph Avenue at Hillside Street |
11 |
No |
2.20 |
14.50 |
4.24 |
-10.26 |
No |
No |
Randolph Avenue at Chickatawbut Road |
102 |
Yes |
20.20 |
11.86 |
20.55 |
8.69 |
Yes |
No |
Note: Green shading denotes segments within the corridor.
HSIP = Highway Safety Improvement Program. PSI = Potential for Safety Improvement.
Source: Central Transportation Planning Staff.
Table 6
Comprehensive Costs of Crashes
| Crash Severity |
Expected Crashes per Year |
Annual Expected Cost |
|---|---|---|
Property Damage Only |
79.68 |
$1,243,008 |
Fatal and Injury |
41.65 |
$10,862,320 |
Total |
121.33 |
$12,105,328 |
Source: Central Transportation Planning Staff.
MPO staff prepared collision diagrams for the entire length of the corridor to examine patterns within the crash data. The collision diagrams are included in Appendix D. The associated tables may be used to look up additional details for specific crash events. Figures 8 through 11 show the collision diagrams for the HSIP intersection clusters. Figures 12 through 14 show the collision diagrams for locations with fatal crashes. Considering all the available data, MPO staff drew the following conclusions about conditions at different intersections within the study area:
Randolph Avenue and Brook Road segments are the high priority segments. Each of these segments has large numbers of observed crashes and great potential for safety improvement, making them clear targets for intervention. The Brook Road segment has schools, recreational areas, and residences; therefore, its four travel lanes, low volumes, and high vehicle speeds make it unsafe for people who walk or bike. The Randolph Avenue segment has recreational areas, businesses, and residences; therefore, its straight alignment, high speed, and high volume makes it unsafe for people who drive, walk, or bike. There were four fatalities on the Randolph Avenue segment. Important contributing factors in these crashes were peak-period congestion, high speed of vehicles, and lack of turn lanes.
Six intersections were included in this category based on the collision diagrams, HSIP crash clusters, PSI analysis, and unconventional geometry:
Figure 8
Collision Diagram: Brook Road at Reedsdale Road/Central Avenue

Figure 9
Collision Diagram: Reedsdale Road at Canton Avenue and Centre Street
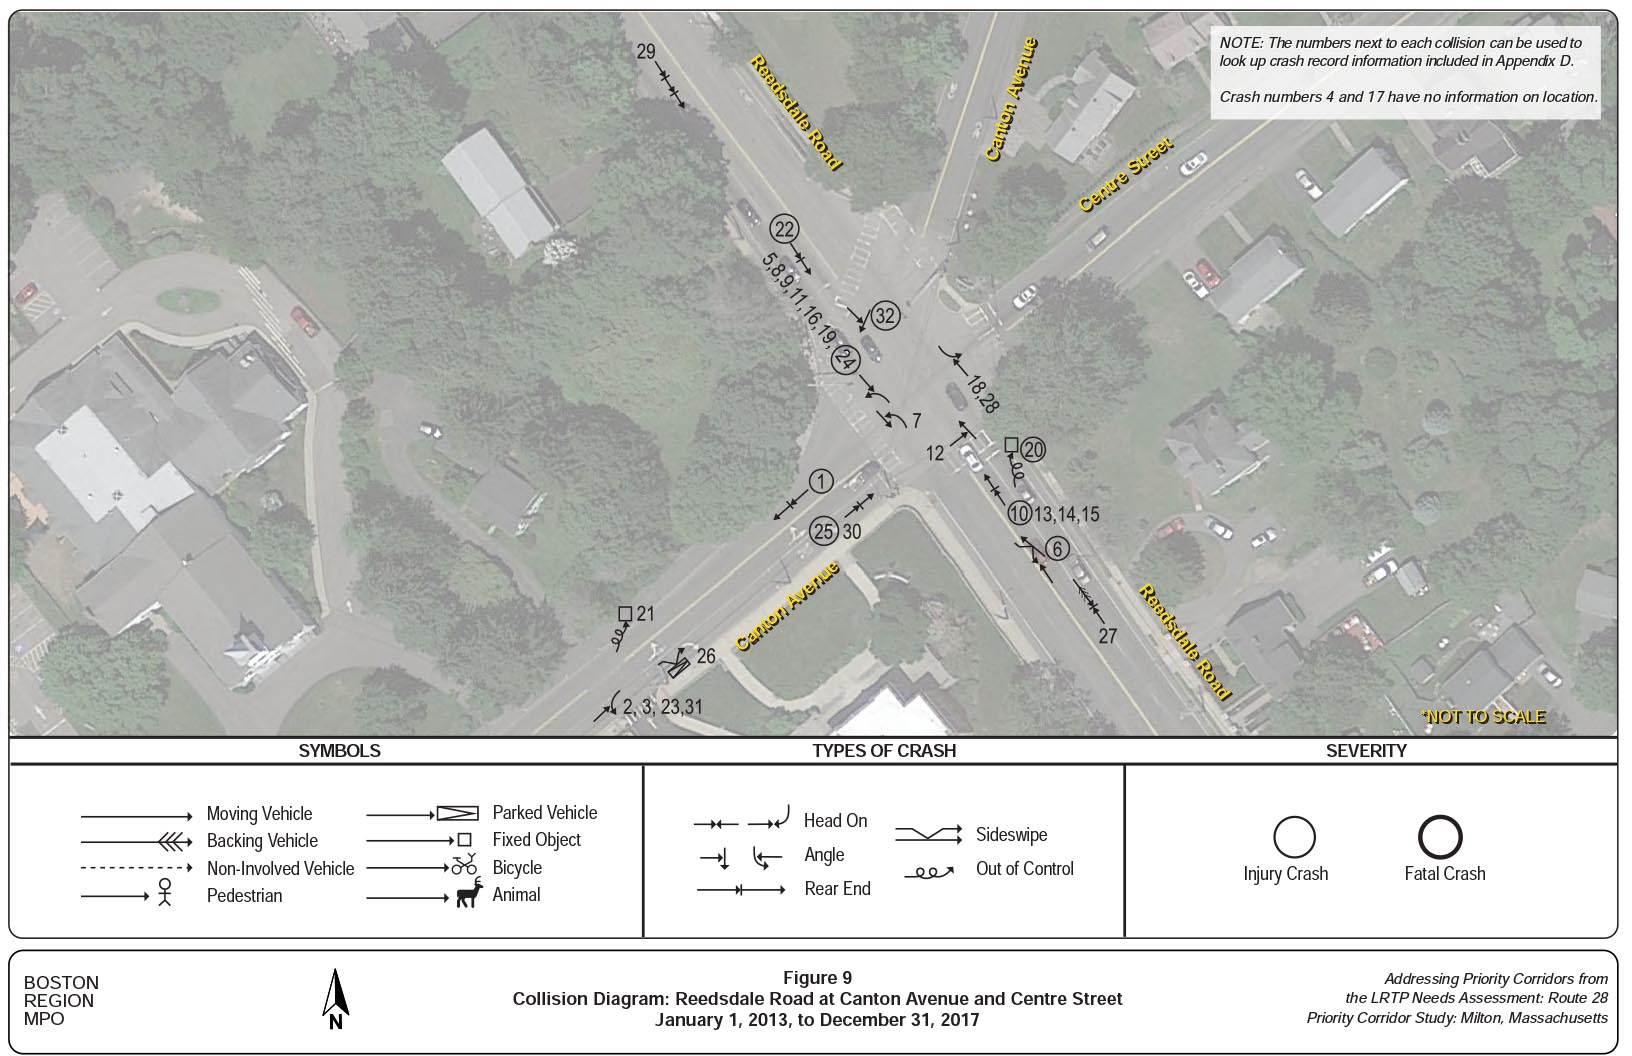
Figure 10
Collision Diagram: Randolph Avenue at Reedsdale Road

Figure 11
Collision Diagram: Randolph Avenue at Chickatawbut Road

Figure 12
Collision Diagram: Randolph Avenue at Hallen Avenue
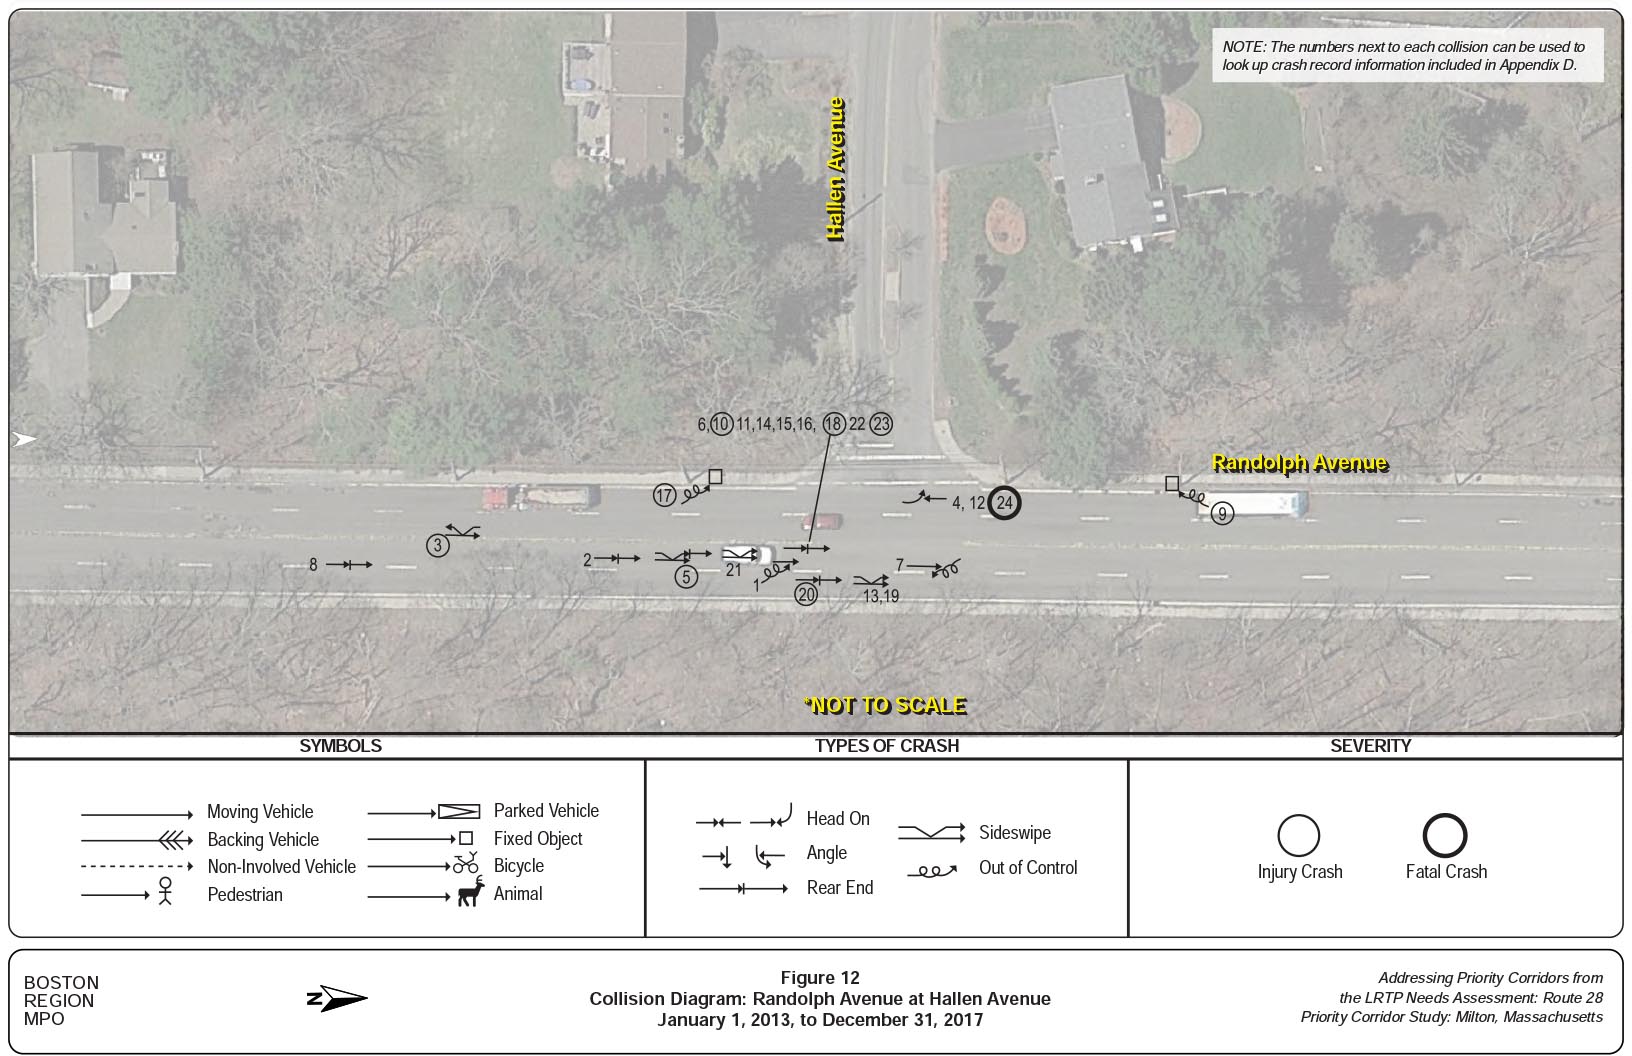
Figure 13
Collision Diagram: Randolph Avenue Segment between Hallen Avenue and Hillside Street

Figure 14
Collision Diagram: Randolph Avenue Segment between Hillside Street and Chickatawbut Road

MPO staff conducted traffic operations analyses consistent with the HCM methodologies.15 HCM methodology is used to assess traffic conditions at signalized and unsignalized intersections and to rate the LOS from A to F. LOS A represents the best operating conditions (little to no delay), while LOS F represents the worst operating conditions (long delay). LOS E represents operating conditions at capacity (the limit of acceptable delay). Table 7 presents the control delays (standards for comparison) associated with each LOS for signalized and unsignalized intersections.
Using the traffic and signal data collected, MPO staff built traffic analysis networks for the weekday AM and weekday PM peak hours. Synchro traffic analysis was used to assess the capacity and quality of traffic flow.16 Tables 8 through 10 show the analysis results for the weekday AM, weekday PM, respectively. Appendix E presents the existing conditions LOS analysis worksheets. Based on the traffic operations analyses, these intersections are congested and have long queues during peak travel hours:
Table 7
Intersection Level of Service Criteria
| Level of Service |
Signalized Intersection Control Delay (seconds per vehicle) |
Unsignalized Intersection Control Delay (seconds per vehicle) |
|---|---|---|
A |
<10 |
<10 |
B |
10–20 |
10–15 |
C |
20–35 |
15–25 |
D |
35–55 |
25–35 |
E |
55–80 |
35–50 |
F |
>80 |
>50 |
Source: Highway Capacity Manual 2010.
Table 8
Brook Road: Existing Conditions, Levels of Service, Delays, and Queues
Street Name |
Approach |
Lane Group |
AM 50% Queue (ft.)* |
AM 95% Queue (ft.)** |
AM Delay (s) |
AM LOS |
PM 50% Queue (ft.)* |
PM 95% Queue (ft.)** |
PM Delay (s) |
PM LOS |
Route 28 |
SB |
L |
171 |
328 |
28.2 |
C |
606 |
-1207 |
67.1 |
E |
Route 28 |
SB |
LT |
175 |
334 |
27.9 |
C |
670 |
-1309 |
73.4 |
E |
Route 28 |
NB |
R |
303 |
-551 |
36.8 |
D |
283 |
505 |
35.3 |
D |
Blue Hill Parkway |
NB |
TR |
172 |
-294 |
48.1 |
D |
185 |
299 |
68.5 |
E |
Brook Road |
EB |
LTR |
155 |
-324 |
57.9 |
E |
235 |
395 |
72.7 |
E |
Intersection |
All |
All |
-- |
-- |
39.1 |
D |
-- |
-- |
61.1 |
E |
Route 28 |
SB |
TR |
0 |
0 |
0.0 |
A |
0 |
0 |
0.0 |
A |
Route 28 |
NB |
LT |
0 |
3 |
0.4 |
A |
0 |
0 |
0.0 |
A |
Thacher Street |
NB |
LR |
50 |
82 |
43.1 |
E |
100 |
144 |
102.8 |
F |
Intersection |
All |
All |
|
|
3.5 |
A |
|
|
6.7 |
A |
Route 28 |
SB |
TR |
0 |
121 |
4.2 |
A |
0 |
201 |
4.8 |
A |
Route 28 |
NB |
LT |
0 |
201 |
5.0 |
A |
0 |
149 |
4.6 |
A |
St. Mary’s Road |
NE |
LR |
1 |
27 |
11.6 |
B |
3 |
32 |
12.8 |
B |
Intersection |
All |
All |
-- |
-- |
4.9 |
A |
-- |
-- |
4.9 |
A |
Route 28 |
NB |
LTR |
43 |
204 |
8.4 |
A |
36 |
171 |
8.4 |
A |
Route 28 |
SB |
LTR |
26 |
128 |
7.3 |
A |
50 |
230 |
9.2 |
A |
Standish Street |
SW |
LTR |
3 |
25 |
16.8 |
C |
9 |
40 |
20.8 |
C |
Intersection |
All |
All |
-- |
-- |
8.1 |
A |
-- |
-- |
9.1 |
A |
Route 28 |
NB |
LTR |
-354 |
-522 |
84.7 |
F |
238 |
306 |
64.6 |
E |
Route 28 |
SB |
LT |
-516 |
-755 |
290.2 |
F |
-628 |
-869 |
365.1 |
F |
Route 28 |
SB |
R |
-386 |
-609 |
171.5 |
F |
-393 |
-635 |
105.5 |
F |
Brook Road |
WB |
L |
125 |
203 |
42.8 |
D |
142 |
222 |
45.4 |
D |
Brook Road |
WB |
TR |
150 |
210 |
42.2 |
D |
171 |
231 |
44.4 |
D |
Central Avenue |
NE |
LR |
64 |
-194 |
58 |
E |
-275 |
-460 |
288.1 |
F |
Central Avenue |
SB |
LTR |
123 |
172 |
65.6 |
E |
205 |
273 |
68.5 |
E |
Intersection |
All |
All |
-- |
-- |
117.3 |
F |
-- |
-- |
137.4 |
F |
Note:
Shading denotes intersections that are congested during peak travel hours.
* Negative (-) sign = Volume exceeds capacity (queue may be longer)
** Negative (-) sign = 95 percentile volume exceed capacity, queue may be longer
EB = eastbound. LOS = level of service. L = left. R = right. LR = left and right. LT= left and through. TR = through and right. LTR = left, through, and right. NE = northeast. NB = northbound. WB = westbound SB = southbound. NW = northwest. SE = southeast. SW = southwest.
Source: Central Transportation Planning Staff.
Table 9
Reedsdale Road: Existing Conditions Levels of Service, Delays, and Queues
Street Name |
Approach |
Lane Group |
AM 50% Queue (ft.)* |
AM 95% Queue (ft.)** |
AM Delay (s) |
AM LOS |
PM 50% Queue (ft.)* |
PM 95% Queue (ft.)** |
PM Delay (s) |
PM LOS |
Route 28 |
NB |
LTR |
-354 |
-522 |
84.7 |
F |
238 |
306 |
64.6 |
E |
Route 28 |
SB |
LT |
-516 |
-755 |
290.2 |
F |
-628 |
-869 |
365.1 |
F |
Route 28 |
SB |
R |
-386 |
-609 |
171.5 |
F |
-393 |
-635 |
105.5 |
F |
Brook Road |
WB |
L |
125 |
203 |
42.8 |
D |
142 |
222 |
45.4 |
D |
Brook Road |
WB |
TR |
150 |
210 |
42.2 |
D |
171 |
231 |
44.4 |
D |
Central Avenue |
NE |
LR |
64 |
-194 |
58 |
E |
-275 |
-460 |
288.1 |
F |
Central Avenue |
SB |
LTR |
123 |
172 |
65.6 |
E |
205 |
273 |
68.5 |
E |
Intersection |
All |
All |
-- |
-- |
117.3 |
F |
-- |
-- |
137.4 |
F |
Route 28 |
NB |
LTR |
-595 |
-889 |
104.2 |
F |
348 |
-530 |
75.7 |
E |
Route 28 |
SB |
LTR |
218 |
327 |
53.8 |
D |
-466 |
-711 |
125.2 |
F |
Canton Avenue |
NE |
LT |
-466 |
-815 |
125 |
F |
-527 |
-906 |
145.2 |
F |
Canton Avenue |
NE |
R |
41 |
123 |
21.9 |
C |
41 |
125 |
22.6 |
C |
Canton Avenue |
SB |
LR |
143 |
-275 |
102.3 |
F |
-249 |
-509 |
147.3 |
F |
Centre Street |
SW |
LTR |
-457 |
-802 |
122.9 |
F |
405 |
-755 |
107 |
D |
Intersection |
All |
All |
-- |
-- |
96.3 |
F |
-- |
-- |
109.3 |
F |
Route 28 |
NB |
LT |
0 |
12 |
1.6 |
A |
0 |
8 |
1.5 |
A |
Route 28 |
SB |
TR |
0 |
0 |
0.0 |
A |
0 |
0 |
0.0 |
A |
Hospital Driveway |
EB |
LR |
0 |
21 |
21.1 |
C |
0 |
71 |
24.9 |
C |
Intersection |
All |
All |
-- |
-- |
1.7 |
A |
-- |
-- |
3.0 |
A |
Route 28 |
NB |
L |
-466 |
-1193 |
177.7 |
F |
129 |
-591 |
53.5 |
D |
Route 28 |
NB |
LTR |
159 |
505 |
21.3 |
C |
115 |
322 |
17.5 |
B |
Route 28 |
SB |
LT |
117 |
316 |
27.9 |
C |
157 |
324 |
32.6 |
C |
Route 28 |
SB |
R |
50 |
131 |
8.8 |
A |
-439 |
-905 |
67.6 |
E |
Reedsdale Road |
WB |
LTR |
91 |
233 |
28.9 |
C |
168 |
-354 |
53.2 |
D |
Randolph Avenue |
SB |
LTR |
115 |
310 |
34.8 |
C |
212 |
-538 |
37.5 |
D |
Intersection |
All |
All |
-- |
-- |
69.2 |
E |
-- |
-- |
47.7 |
D |
Note: Shading denotes intersections that are congested during peak travel hours.
* Negative (-) sign = Volume exceeds capacity (queue may be longer)
** Negative (-) sign = 95 percentile volume exceed capacity, queue may be longer
EB = eastbound. LOS = level of service. L = left. R = right. LR = left and right. LT= left and through. TR = through and right. LTR = left, through, and right. NE = northeast. NB = northbound. WB = westbound SB = southbound. NW = northwest. SE = southeast. SW = southwest.
Source: Central Transportation Planning Staff.
Table 10
Randolph Avenue: Existing Conditions Levels of Service, Delays, and Queues
Street Name |
Approach |
Lane Group |
AM 50% Queue (ft.) |
AM 95% Queue (ft.) |
AM Delay (s) |
AM LOS |
PM 50% Queue (ft.) |
PM 95% Queue (ft.) |
PM Delay (s) |
PM LOS |
Route 28 |
NB |
L |
-466 |
-1193 |
177.7 |
F |
129 |
-591 |
53.5 |
D |
Route 28 |
NB |
LTR |
159 |
505 |
21.3 |
C |
115 |
322 |
17.5 |
B |
Route 28 |
SB |
LT |
117 |
316 |
27.9 |
C |
157 |
324 |
32.6 |
C |
Route 28 |
SB |
R |
50 |
131 |
8.8 |
A |
-439 |
-905 |
67.6 |
E |
Reedsdale Road |
WB |
LTR |
91 |
233 |
28.9 |
C |
168 |
-354 |
53.2 |
D |
Randolph Avenue |
SB |
LTR |
115 |
310 |
34.8 |
C |
212 |
-538 |
37.5 |
D |
Intersection |
All |
All |
-- |
-- |
69.2 |
E |
-- |
-- |
47.7 |
D |
Route 28 |
NB |
LT |
0 |
-797 |
9.2 |
A |
130 |
372 |
13.3 |
B |
Route 28 |
SB |
T |
0 |
182 |
4.8 |
A |
221 |
621 |
17.6 |
B |
Reeds Street |
EB |
LR |
9 |
46 |
32.9 |
C |
21 |
83 |
31.2 |
C |
Intersection |
All |
All |
-- |
-- |
8.2 |
A |
-- |
-- |
16.2 |
B |
Route 28 |
NB |
LT |
0 |
3 |
0.3 |
A |
0 |
19 |
2.5 |
A |
Route 28 |
SB |
TR |
0 |
0 |
0 |
A |
0 |
0 |
0 |
A |
Hallen Avenue |
EB |
LR |
0 |
13 |
15.9 |
B |
20 |
72 |
42.2 |
D |
Intersection |
All |
All |
-- |
-- |
0.6 |
A |
-- |
-- |
2.6 |
A |
Route 28 |
NB |
LTR |
214 |
-980 |
16.7 |
B |
113 |
-573 |
15.6 |
B |
Route 28 |
SB |
LTR |
56 |
268 |
9.1 |
A |
220 |
-981 |
17 |
B |
Hillside Street |
EB |
LTR |
48 |
132 |
43.6 |
D |
59 |
157 |
44.4 |
D |
Driveway |
WB |
LTR |
2 |
17 |
44 |
D |
2 |
17 |
44.8 |
D |
Intersection |
All |
All |
-- |
-- |
15.6 |
B |
-- |
-- |
17.8 |
B |
Note: Shading denotes intersections that are congested during peak travel hours.
* Negative (-) sign = Volume exceeds capacity (queue may be longer)
** Negative (-) sign = 95 percentile volume exceed capacity, queue may be longer
EB = eastbound. LOS = level of service. L = left. R = right. LR = left and right. LT= left and through. TR = through and right. LTR = left, through, and right. NE = northeast. NB = northbound. WB = westbound SB = southbound. NW = Northwest. SE = southeast. SW = southwest.
Source: Central Transportation Planning Staff.
The quality of pedestrian travel is largely affected by the roadway infrastructure, such as whether there are sidewalks and crosswalks present or pedestrian signals that allow pedestrians time to cross an intersection before vehicles get a green light. To reflect the complex relationship between pedestrians and the travel environments, MPO staff developed a PLOS tool, which grades a given roadway on its quality of pedestrian travel, and whether it reflects these objectives: safety, system preservation, capacity management and mobility, and economic vitality.17 Based on the tool, Route 28 in Milton was rated poor in terms of safety, poor in terms of system preservation, and poor in terms of economic vitality, and capacity management and mobility. Overall, the assessment indicates that the roadway needs improvements to safely accommodate pedestrians. The ratings from this pedestrian assessment tool are in Appendix F.
The quality of bicycle travel is largely affected by the character of the roadway, safety, and security, such as speed of vehicles, travel time, comfort and convenience, and freedom to maneuver. The BLOS tool is intended to help users and planners assess the infrastructure to facilitate bicycle travel. The approach is similar to the PLOS tool in that it grades locations with features that are suitable or unsuitable for bicyclists—areas well suited for bicycle travel are awarded high scores and areas unsuitable for bicycle travel are awarded low scores. In addition, the BLOS ratings correlate with the objectives emphasized for PLOS. Based on the BLOS tool, Route 28 in Milton was rated poor in terms of safety, poor in terms of system preservation, and poor in terms of economic vitality, and capacity management and mobility. Overall, the assessment indicates that the roadway needs improvements to accommodate bicyclists. The ratings from this bicycle assessment tool are in Appendix F.
The Route 28 corridor in Milton and surrounding areas are served by three bus routes operated by the MBTA and BAT. BAT’s Route 12 and MBTA’s Route 240 operate full daily schedules, while MBTA’s Route 245 operates only on weekdays with five inbound and outbound trips. All three routes share stops and have designated signs at each of the stops. There are no benches or shelters at any of the bus stops.
The BAT’s Route 12, which serves Ashmont Station to the BAT Center in Brockton, operates on Randolph Avenue, Reedsdale Road, and Central Avenue. It provides bus service to Milton Hospital, the Mattapan High Speed Line, and the Red Line. Buses run Monday through Friday every 15 to 30 minutes from 5:45 AM to 12:02 AM; every 30 minutes on Saturdays from 6:20 AM to 11:45 PM; and every 40 to 80 minutes on Sundays from 11:20 AM to 7:40 PM.
MBTA bus Route 240, which serves Avon Square or Holbrook/Randolph Commuter Rail Station to Ashmont Station, operates through the area on Randolph Avenue, Reedsdale Road, and Central Avenue. It provides bus service to Milton Hospital, the Mattapan High Speed Line, and Red Line. Buses run Monday through Friday every 10 to 30 minutes from 4:45 AM to 12:45 AM; every 30 to 60 minutes on Saturdays from 5:50 AM to 12:45 AM; and every 60 to 90 minutes on Sundays from 7:00 AM to 12:35 AM. On weekdays, Route 240 operates a total of 50 inbound buses and 50 outbound buses through the corridor. On Saturdays, it operates a total of 37 inbound buses and 37outbound buses through the corridor. On Sundays, it operates 15 buses in each direction through the corridor. Total weekday ridership is 4,400 passengers.
MBTA bus Route 245, which serves Quincy Center Station to Mattapan Station, operates through the area on Reedsdale Road, Brook Road, and Blue Hills Parkway. It provides bus service to Milton Hospital and the Mattapan High Speed Line. Buses run Monday through Friday only with five inbound and five outbound trips—two trips in the morning and three trips in the afternoon for each direction. There is no weekend service or service during school vacation days.
Chapter 6—Projects and Studies
Previous transportation projects and studies for the Route 28 corridor that addressed the study area problems are described below. The conceptual improvements developed in this study considered and incorporated recommendations from the previous studies.
MassDOT’s project number 607342 will reconstruct this intersection to address the high number of crashes. This intersection ranks second in the state’s top 200 list given the severity of accidents that occur at this location. The project work will include replacing the existing traffic signal with a two-lane modern roundabout. This project is funded through the MPO’s 2022 Transportation Improvement Program (TIP), and it is currently at 25 percent design.
The main goals of the Road Diet project were to accommodate pedestrians and bicyclists by repurposing the existing road cross section along the corridor. In doing so, Brook Road becomes a safer environment for all users—people who walk, bike, ride the bus, or drive. The improvements allocated space for separated bike lanes on either side of the road to connect the neighborhood roads to the St. Mary’s School and Pierce Middle School, and gave students a safer route to school. It also provided parking and designated pick-up and drop-off spaces at the schools to satisfy demand. Detail of the designs, which were implemented on October 10–14, 2020, are included in Appendix B.
These improvements were constructed by the Town of Milton through the Complete Streets program. The improvements widened the existing sidewalk on the hospital side to provide a bus shelter at the heavily used bus stop, and installed ADA-compliant wheelchair curb ramps and high-visibility crosswalks. In addition, a pedestrian hybrid beacon signal was installed at the existing bus stop to facilitate heavy pedestrian crossing demand.
Chapter 7—Community and Stakeholder Engagement
Stakeholder participation is a crucial part of any study. Hence, MPO staff used a number of methods to engage the community and stakeholders in planning for improvements to Route 28.
MPO staff developed a survey to help determine the public’s opinion about concerns and problems on Route 28 in Milton and how to resolve them. The online survey, posted on the Town of Milton’s website received 550 responses in April 2020. Figure 15 shows the questions contained in the survey, along with the answers received. Many of the respondents left significant free-response feedback for one or more questions; those comments are included in Appendix G. Feedback from the survey was helpful to gauge community sentiment and to solicit ideas for solutions to the existing problems. Some notable conclusions drawn from the survey are below.
Figure 15
Survey Results
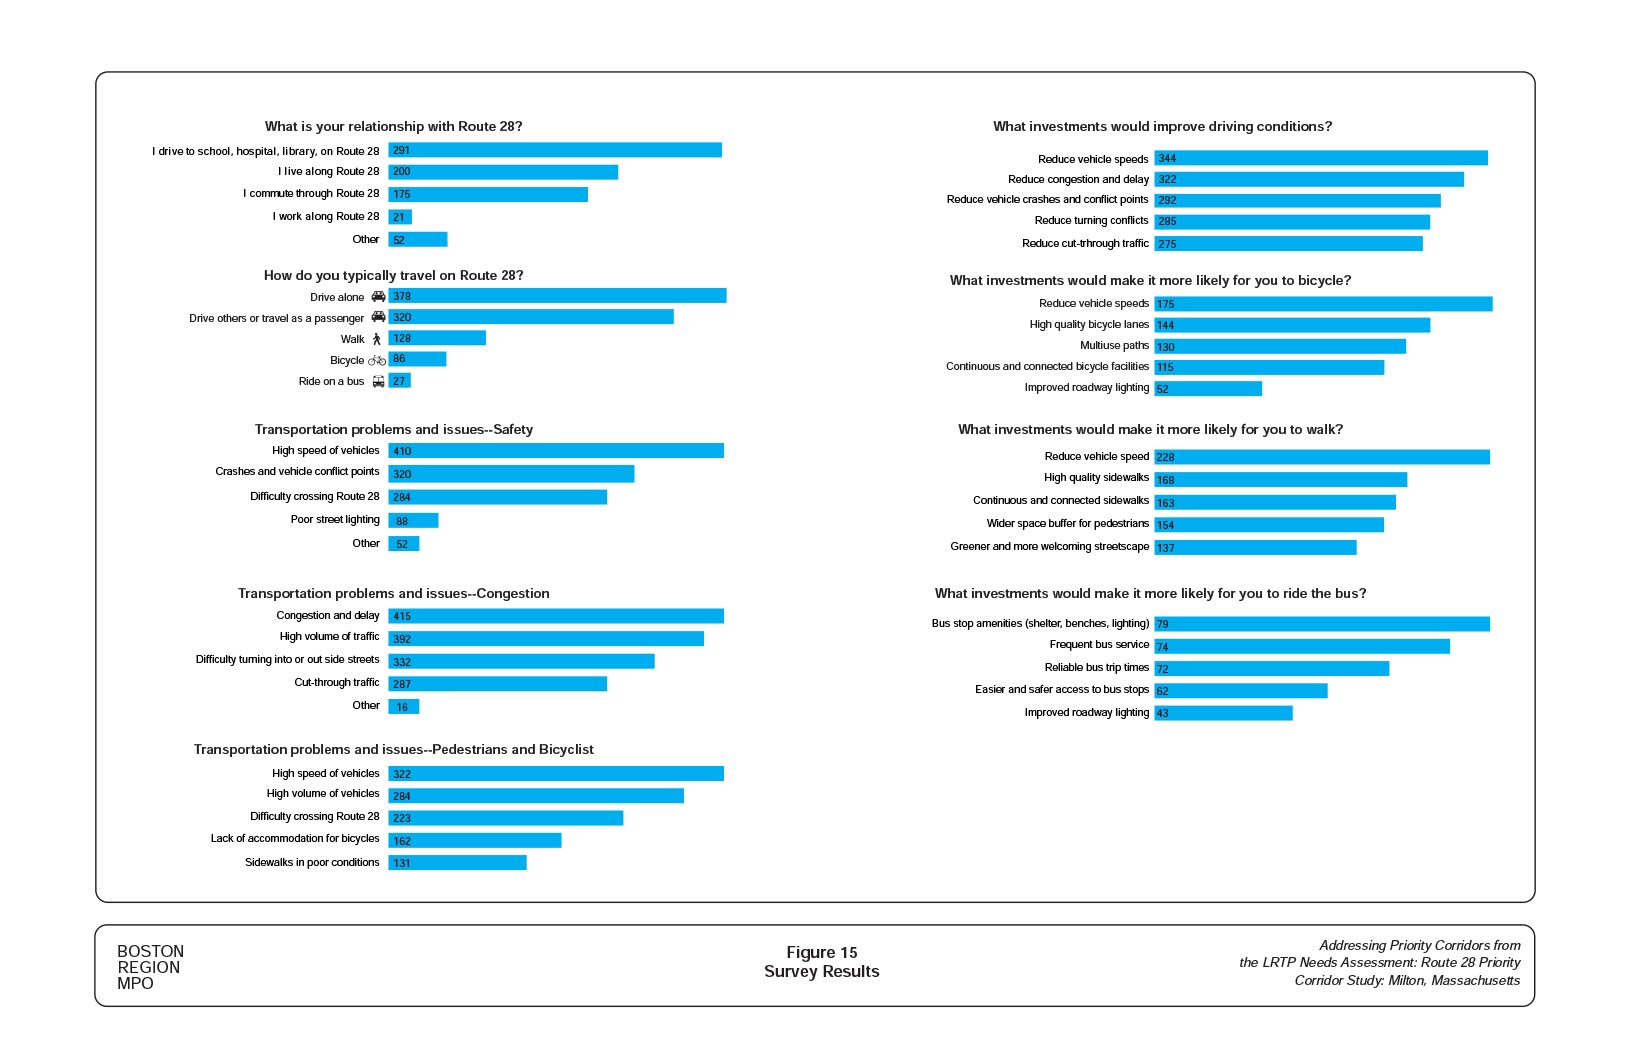
Chapter 8—Deficiencies and Needs
The corridor deficiencies listed below are based on analyzing the collected data from field visits, determining the public’s opinion about the problems, and obtaining feedback from the advisory task force.
Table 11 presents the safety, operational problems, and deficiencies in the Brook Road, Reedsdale Road, and Randolph Avenue corridor.
Table 11
Problems and Deficiencies
|
Issue |
Deficiencies |
Jurisdiction |
|---|---|---|
Pedestrian and bicyclists |
High vehicle speeds present safety problems for parents and students walking, bicycling, or crossing the road |
Milton/MassDOT |
Pedestrians and bicyclists |
Very difficult to cross (four travel lanes), unsafe for students and parents walking and bicycling to and from schools and recreational areas |
Milton/MassDOT |
Pedestrians |
Many wheelchair ramps are not ADA compliant |
Milton/MassDOT |
Pedestrians |
Inadequate sidewalk width and lack of sidewalk buffer place pedestrians too close to high-speed travel lanes, making them uncomfortable |
Milton/MassDOT |
Pedestrians |
Sidewalks obstructed with vegetation outgrowth that reduces width of sidewalk |
Milton/MassDOT |
Bicyclists |
Absence of separated bicycle lanes creates problems for people who bicycle |
Milton/MassDOT |
Bicyclists |
Lack of bicycle racks at destination locations create inconveniences for people who bicycle |
Milton |
Parking |
Lack of parking spaces on Brook Road for people who drop and pick-up students or visit recreation areas on Brook Road |
Milton |
Safety |
High crash segments with three HSIP locations—the intersections of Brook Road at Reedsdale Road and Central Avenue, Reedsdale Road at Canton Avenue, Randolph Avenue at Reedsdale Road and Randolph Avenue at Chickatawbut Road |
Milton/ MassDOT |
Safety |
High numbers of angle, rear-end, and left-turn related crashes at intersections |
Milton/MassDOT |
Safety and operations |
Lack of turn lanes present problems for traffic turning into and out of side streets and driveways |
Milton/MassDOT |
Safety and operations |
Four travel lanes with low volume of traffic causes motorists to drive at high speeds |
Milton/MassDOT |
Safety |
Motorists on Brook Road repeatedly run red lights at St. Mary’s Road and Standish Road |
Milton |
Safety |
Post-mounted signals on Brook Road and Reedsdale Road do not provide adequate visibility for drivers |
Milton |
Safety and operations |
Peak period traffic congestion at the intersections of Brook Road at Central Avenue, Reedsdale Road at Canton Avenue, and Reedsdale Road at Randolph Avenue, and Randolph Avenue at Chickatawbut Road |
Milton/ MassDOT |
Safety and operations |
Lane configuration at Brook Road and Central Avenue intersection is confusing to many motorists |
Milton |
Operations |
Existing traffic signal timings are outdated resulting in poorly timed signals |
Milton/MassDOT |
Safety and operations |
Cut-through traffic on side streets creates safety problems for residents |
Milton/ MassDOT |
Safety |
Four fatal crashes occurred on Randolph Avenue between 2013–17 |
MassDOT |
Safety and operations |
High volume of cut-through traffic on Reed Street, Highland Street, and Hallen Avenue create safety problems for residents |
MassDOT |
Safety and operations |
High volumes of cut-through traffic on Pleasant Street heading to the Interstate 93 corridor during morning and afternoon peak periods |
MassDOT |
Safety and operations |
Congestion and queues southbound on Randolph Avenue during the afternoon peak period divert high volumes of traffic through Heather Drive and Mark Lane; Cut-through and diverted traffic often speed on these otherwise quiet residential streets, which is a huge safety risk for residents |
MassDOT |
Safety and operations |
Very dangerous turns into and out of Hallen Avenue and Ridgewood Road/Wollaston Golf Club due to high vehicle volumes and speeds; Lack of a traffic light at these locations make for dangerous turns |
MassDOT |
ADA = Americans with Disabilities Act. HSIP = Highway Safety Improvement Program. MassDOT = Massachusetts Department of Transportation.
Source: Central Transportation Planning Staff.
Based on the problems and deficiencies, staff determined the following corridor needs:
Chapter 9—Short-Term Improvements
The corridor would immensely benefit from short-term improvements. These improvements include installing signs, marking pavement, painting high-visibility crosswalks, adding detectable warning plates to existing wheelchair ramps, and upgrading signal-head sections. Additional short-term improvements include adding countdown timers for pedestrians, retiming and coordinating signals, repairing substandard sidewalks, and making minor geometric modifications. The time frame categorized as short-term is typically less than five years and the costs are usually low, which can be funded through maintenance budgets. Most short-term improvements typically do not require design and engineering efforts.
Table 12 shows the short-term safety and operational improvements for the Brook Road, Reedsdale Road, and Randolph Avenue segments along with the time frame, cost, and jurisdiction. A high proportion of Randolph Avenue northbound traffic turn left on Reedsdale Road. This movement experiences high delay during peak travel periods because the exclusive left-turn lane is insufficient. Providing double left-turn lane on that approach and retiming the signals would reduce congestion (Figure 16).
MPO staff evaluated what the LOS of Route 28 would be if the traffic signals were retimed and coordinated and double left-turn movement was provided at the intersection of Randolph Avenue and Reedsdale Road. The analysis focused on modifying the yellow and all-red intervals, phase splits, cycle lengths, and offsets to determine the effects of changes on the existing traffic volumes. The results of the LOS analyses are shown in Tables 13 through 15. Appendix E presents the short-term signal timing and coordination LOS analysis worksheets. The short-term analysis indicated that retiming the signals could reduce existing AM and PM peak-hour traffic signal delays by about 16 to 20 percent.
Table 12
Short-Term Improvements
| Issue |
Improvement |
Time Frame |
Cost |
Jurisdiction |
|---|---|---|---|---|
Pedestrian safety |
Trim vegetation outgrowth blocking or reducing sidewalk width |
Short |
Low |
Milton/ MassDOT |
Pedestrian safety |
Make wheelchair ramps ADA-compliant by adding detectable plates |
Short |
Medium |
Milton/ MassDOT |
Pedestrian safety |
Bring poor sidewalks to meet MassDOT standards and ADA compliance |
Medium |
Medium |
Milton/ MassDOT |
Pedestrian safety |
Paint crosswalks and make them highly visible |
Short |
Low |
Milton/ MassDOT |
Pedestrian safety |
Add countdown timers to help expedite pedestrian crossing at signalized intersections |
Short |
Medium |
Milton/ MassDOT |
Pedestrian safety |
Conduct a pedestrian study to determine feasibility of a pedestrian hybrid beacon on Randolph Avenue at Pleasant Street |
Short |
Medium |
MassDOT |
Pedestrian safety |
Inspect and repair broken pedestrian pushbuttons |
Short |
Medium |
MassDOT |
Bicycle safety |
Provide bicycle detection at the signalized intersections |
Medium |
Medium |
Milton/ MassDOT |
Safety |
Modify clearance intervals to MassDOT standards to address high number of angle and rear-end crashes |
Short |
Low |
Milton/ MassDOT |
Safety |
Repaint or remark turn arrows at the intersections to make them highly visible to motorists |
Short |
Low |
Milton/ MassDOT |
Safety |
Install signs in advance of the signalized intersections to direct motorists to the appropriate turn lanes |
Short |
Low |
Milton/ MassDOT |
Safety |
Add backplates with retroreflective to signal heads to make them more visible to motorists |
Short |
Medium |
Milton/ MassDOT |
Congestion |
Optimize traffic signal timings and coordinate signals to reduce congestion and delay |
Short |
Medium |
Milton/ MassDOT |
Congestion |
Provide double left-turn lane on the approach and retime the signals to reduce congestion |
Short |
Medium |
MassDOT |
Safety |
Install signs to prohibit cut-through traffic by nonresident commuters during peak travel periods: Heather Drive and Mark Lane |
Short |
Low |
Milton/ MassDOT |
Safety |
Consider prohibiting cut-through traffic by nonresident commuters during the afternoon peak travel period (3:00 pm—6:00pm) |
Short |
Low |
Milton/ MassDOT |
ADA = Americans with Disabilities Act. MassDOT = Massachusetts Department of Transportation.
Source: Central Transportation Planning Staff.
Figure 16
Short-Term Improvements: Randolph Avenue Northbound Double Left-Turn Lanes
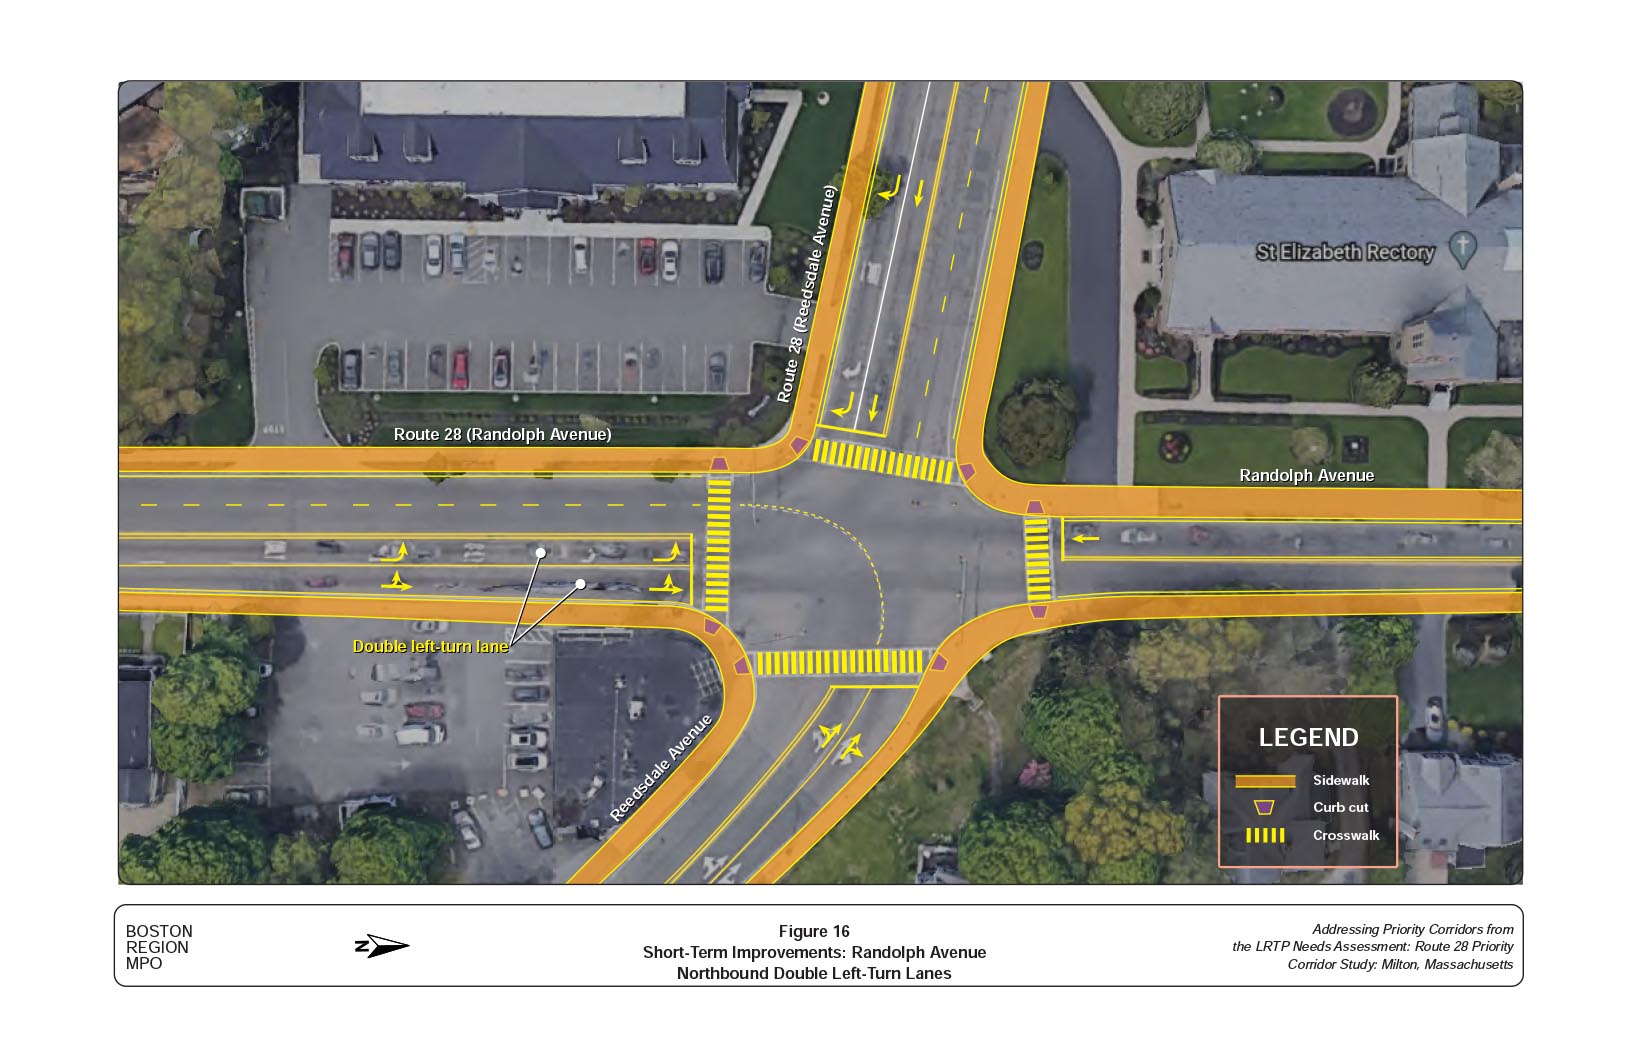
Table 13
Brook Road: Performance of Short-Term Improvements
(Optimize Signal Timings)
Street Name |
Approach |
Lane Group |
AM 50% Queue (ft.)* |
AM 95% Queue (ft.)** |
AM Delay (s) |
AM LOS |
PM 50% Queue (ft.)* |
PM 95% Queue (ft.)** |
PM Delay (s) |
PM LOS |
Route 28 |
SB |
L |
160 |
314 |
26.4 |
C |
584 |
-1038 |
46.5 |
D |
Route 28 |
SB |
LT |
164 |
320 |
26.2 |
C |
646 |
-1133 |
48.9 |
D |
Route 28 |
NB |
R |
286 |
-523 |
35.3 |
D |
273 |
428 |
28.8 |
C |
Blue Hill Parkway |
NB |
TR |
177 |
-327 |
53.4 |
D |
211 |
-366 |
90.8 |
F |
Brook Road |
EB |
LTR |
160 |
-356 |
64.7 |
E |
264 |
-501 |
90.7 |
F |
Intersection |
All |
All |
-- |
-- |
39.9 |
D |
-- |
-- |
53.0 |
D |
Route 28 |
SB |
TR |
0 |
0 |
0.0 |
A |
0 |
0 |
0.1 |
A |
Route 28 |
NB |
LT |
0 |
0 |
0.5 |
A |
0 |
0 |
0.0 |
A |
Thacher Street |
NB |
LR |
0 |
79 |
40.8 |
E |
0 |
133 |
88.0 |
F |
Intersection |
All |
All |
-- |
-- |
3.3 |
A |
-- |
-- |
5.7 |
A |
Route 28 |
SB |
TR |
0 |
126 |
4.5 |
A |
0 |
201 |
4.8 |
A |
Route 28 |
NB |
LT |
0 |
216 |
5.8 |
A |
0 |
149 |
4.6 |
A |
St. Mary’s Road |
NE |
LR |
1 |
27 |
11.7 |
B |
3 |
32 |
12.8 |
B |
Intersection |
All |
All |
-- |
-- |
5.4 |
A |
-- |
-- |
4.9 |
A |
Route 28 |
NB |
LTR |
43 |
202 |
8.3 |
A |
36 |
171 |
8.4 |
A |
Route 28 |
SB |
LTR |
26 |
128 |
7.3 |
A |
50 |
230 |
9.2 |
A |
Standish Street |
SW |
LTR |
3 |
25 |
16.8 |
B |
9 |
40 |
20.8 |
C |
Intersection |
All |
All |
-- |
-- |
8.1 |
A |
|
|
9.1 |
A |
Route 28 |
NB |
LTR |
-400 |
-533 |
96.8 |
F |
-286 |
-405 |
125.2 |
F |
Route 28 |
SB |
LT |
395 |
-620 |
92.9 |
F |
-538 |
-758 |
173.8 |
F |
Route 28 |
SB |
R |
312 |
-462 |
61.9 |
E |
338 |
-571 |
67.2 |
E |
Brook Road |
WB |
L |
115 |
176 |
33.1 |
C |
130 |
197 |
37.5 |
D |
Brook Road |
WB |
TR |
138 |
182 |
33.4 |
C |
157 |
206 |
37.4 |
D |
Central Avenue |
NE |
LR |
71 |
-229 |
93.7 |
F |
-248 |
-424 |
192.5 |
F |
Central Avenue |
SB |
LTR |
-149 |
-246 |
135.7 |
F |
217 |
-314 |
83.6 |
F |
Intersection |
All |
All |
-- |
-- |
81.0 |
F |
-- |
-- |
102.5 |
F |
Note: Shading denotes intersections that are congested during peak travel hours.
* Negative (-) sign = Volume exceeds capacity (queue may be longer)
** Negative (-) sign = 95 percentile volume exceed capacity, queue may be longer
EB = eastbound. L= left. LOS = level of service. LR = left and right. LT= left and through. LTR = left, through, and right. NB = northbound. NE = northeast. NW = northwest. R = right. SB = southbound. SE = southeast. SW = southwest. TR = through and right. WB = westbound.
Source: Central Transportation Planning Staff.
Table 14
Reedsdale Road: Performance of Short-Term Improvements
(Optimize Signal Timings)
Street Name |
Approach |
Lane Group |
AM 50% Queue (ft.)* |
AM 95% Queue (ft.)** |
AM Delay (s) |
AM LOS |
PM 50% Queue (ft.)* |
PM 95% Queue (ft.)** |
PM Delay (s) |
PM LOS |
Route 28 |
NB |
LTR |
538 |
-820 |
75.9 |
E |
328 |
480 |
63.2 |
E |
Route 28 |
SB |
LTR |
190 |
288 |
47.8 |
D |
408 |
-629 |
79.2 |
E |
Canton Avenue |
NE |
LT |
-450 |
-802 |
121.8 |
F |
-430 |
-828 |
138.0 |
F |
Canton Avenue |
NE |
R |
40 |
121 |
21.4 |
C |
134 |
257 |
65.6 |
E |
Canton Avenue |
SB |
LR |
-158 |
-355 |
171.4 |
F |
223 |
-505 |
142.3 |
F |
Centre Street |
SW |
LTR |
-462 |
-802 |
128.6 |
F |
-390 |
-788 |
127.5 |
F |
Intersection |
All |
All |
-- |
-- |
88.8 |
F |
-- |
-- |
95.7 |
F |
Route 28 |
NB |
LT |
0 |
12 |
1.6 |
A |
0 |
12 |
1.5 |
A |
Route 28 |
SB |
TR |
0 |
0 |
0.0 |
A |
0 |
0 |
0.0 |
A |
Hospital Driveway |
EB |
LR |
0 |
21 |
21.8 |
C |
0 |
73 |
25.3 |
C |
Intersection |
All |
All |
-- |
-- |
1.7 |
A |
-- |
-- |
3.0 |
A |
Route 28 |
NB |
L |
-287 |
-925 |
74.0 |
E |
134 |
-375 |
28.4 |
C |
Route 28 |
NB |
LTR |
329 |
-1012 |
46.6 |
D |
168 |
374 |
18.8 |
B |
Route 28 |
SB |
LT |
184 |
353 |
44.0 |
D |
186 |
357 |
39.9 |
D |
Route 28 |
SB |
R |
0 |
31 |
2.1 |
A |
92 |
196 |
8.3 |
A |
Reedsdale Road |
WB |
LTR |
146 |
-302 |
56.5 |
E |
201 |
-419 |
78.9 |
E |
Randolph Avenue |
SB |
LTR |
161 |
328 |
38.0 |
D |
292 |
-639 |
78.0 |
E |
Intersection |
All |
All |
-- |
-- |
48.0 |
D |
-- |
-- |
40.6 |
D |
Note: Shading denotes intersections that are congested during peak travel hours.
* Negative (-) sign = Volume exceeds capacity (queue may be longer)
** Negative (-) sign = 95 percentile volume exceed capacity, queue may be longer
EB = eastbound. L= left. LOS = level of service. LR = left and right. LT= left and through. LTR = left, through, and right. NB = northbound. NE = northeast. R = right. SB = southbound. SW = southwest.TR = through and right. WB = westbound.
Source: Central Transportation Planning Staff.
Table 15
Randolph Avenue: Performance of Short-Term Improvements
(Optimize Signal Timings)
Street Name |
Approach |
Lane Group |
AM 50% Queue (ft.)* |
AM 95% Queue (ft.)** |
AM Delay (s) |
AM LOS |
PM 50% Queue (ft.)* |
PM 95% Queue (ft.)** |
PM Delay (s) |
PM LOS |
Route 28 |
NB |
L |
-287 |
-925 |
74.0 |
E |
134 |
-375 |
28.4 |
C |
Route 28 |
NB |
LTR |
329 |
-1012 |
46.6 |
D |
168 |
374 |
18.8 |
B |
Route 28 |
SB |
LT |
184 |
353 |
44.0 |
D |
186 |
357 |
39.9 |
D |
Route 28 |
SB |
R |
0 |
31 |
2.1 |
A |
92 |
196 |
8.3 |
A |
Reedsdale Road |
WB |
LTR |
146 |
-302 |
56.5 |
E |
201 |
-419 |
78.9 |
E |
Randolph Avenue |
SB |
LTR |
161 |
328 |
38.0 |
D |
292 |
-639 |
78.0 |
E |
Intersection |
All |
All |
-- |
-- |
48.0 |
D |
|
|
40.6 |
D |
Route 28 |
NB |
LT |
212 |
-827 |
13.8 |
B |
87 |
323 |
9.9 |
A |
Route 28 |
SB |
T |
47 |
181 |
6.3 |
A |
152 |
548 |
13.3 |
B |
Reeds Street |
EB |
LR |
12 |
48 |
37.3 |
D |
19 |
90 |
35.2 |
D |
Intersection |
All |
All |
|
|
11.9 |
B |
-- |
-- |
12.4 |
B |
Route 28 |
NB |
LT |
0 |
3 |
0.0 |
A |
0 |
19 |
2.5 |
A |
Route 28 |
SB |
TR |
0 |
0 |
0.0 |
A |
0 |
0 |
0.0 |
A |
Hallen Avenue |
EB |
LR |
0 |
13 |
16.0 |
B |
0 |
72 |
42.2 |
E |
Intersection |
All |
All |
-- |
-- |
0.6 |
A |
-- |
-- |
2.6 |
A |
Route 28 |
NB |
LTR |
256 |
-877 |
16.4 |
B |
118 |
-593 |
16.5 |
B |
Route 28 |
SB |
LTR |
65 |
227 |
8.0 |
A |
231 |
-1010 |
18.2 |
B |
Hillside Street |
EB |
LTR |
51 |
-154 |
52.7 |
D |
59 |
158 |
45.0 |
D |
Driveway |
WB |
LTR |
2 |
15 |
37.0 |
D |
2 |
17 |
45.0 |
D |
Intersection |
All |
All |
-- |
-- |
15.4 |
B |
-- |
-- |
18.8 |
B |
Note: * Negative (-) sign = Volume exceeds capacity (queue may be longer)
** Negative (-) sign = 95 percentile volume exceed capacity, queue may be longer
EB = eastbound. L= left. LOS = level of service. LR = left and right. LT= left and through. LTR = left, through, and right. NB = northbound. NE = northeast. R = right. SB = southbound. SW = southwest.TR = through and right. WB = westbound.
Source: Central Transportation Planning Staff.
Chapter 10—Long-Term Improvement Concepts
The corridor needs long-term improvements to address multimodal transportation needs. Long-term improvements typically require design and engineering efforts and larger funding resources. The time frame categorized as long-term is typically greater than five years, and can be as long as 15 years. The goals of implementing these long-term improvements are to modernize a car-centric corridor into a roadway that connects people to places and provides safe access to schools, recreational areas, neighborhoods, and transit; to increase safety for people who walk, bicycle, or ride the bus; and to support livable communities and economic vitality.
Due to varying needs along the corridor, MPO staff divided the roadway into three segments for long-term improvement concepts—Brook Road, Reedsdale Road, and Randolph Avenue (see Figure 3). Chapter 3 describes the character and context of each segment. Based on discussions with the advisory task force, MPO staff developed three long-term alternatives for each segment. All the alternatives have improvements that mostly fall within the existing roadway’s right-of-way width and considers the needs of abutters and users.
Planners typically use a planning model to forecast traffic volumes based on changes in the transportation network or land use. For this study, MPO staff used the Boston Region MPO’s transportation model, which was recently adopted for the development of the LRTP. This model’s socioeconomic components are derived from forecasts produced by the Metropolitan Area Planning Council. Using this model, staff projected that between now and 2040, traffic volume on Route 28 in Milton would grow by about five percent. Staff grew the existing peak-hour turning movement volumes by five percent to test the impact of future traffic conditions that would result from proposed improvements.
The needs of the Brook Road segments are described in Chapter 8. Three improvement concepts suggested below are designed to address those needs.
Figure 17 shows the cross-sectional configuration of Concept 1.
Figure 17
Brook Road: Long-Term Improvement Concept 1
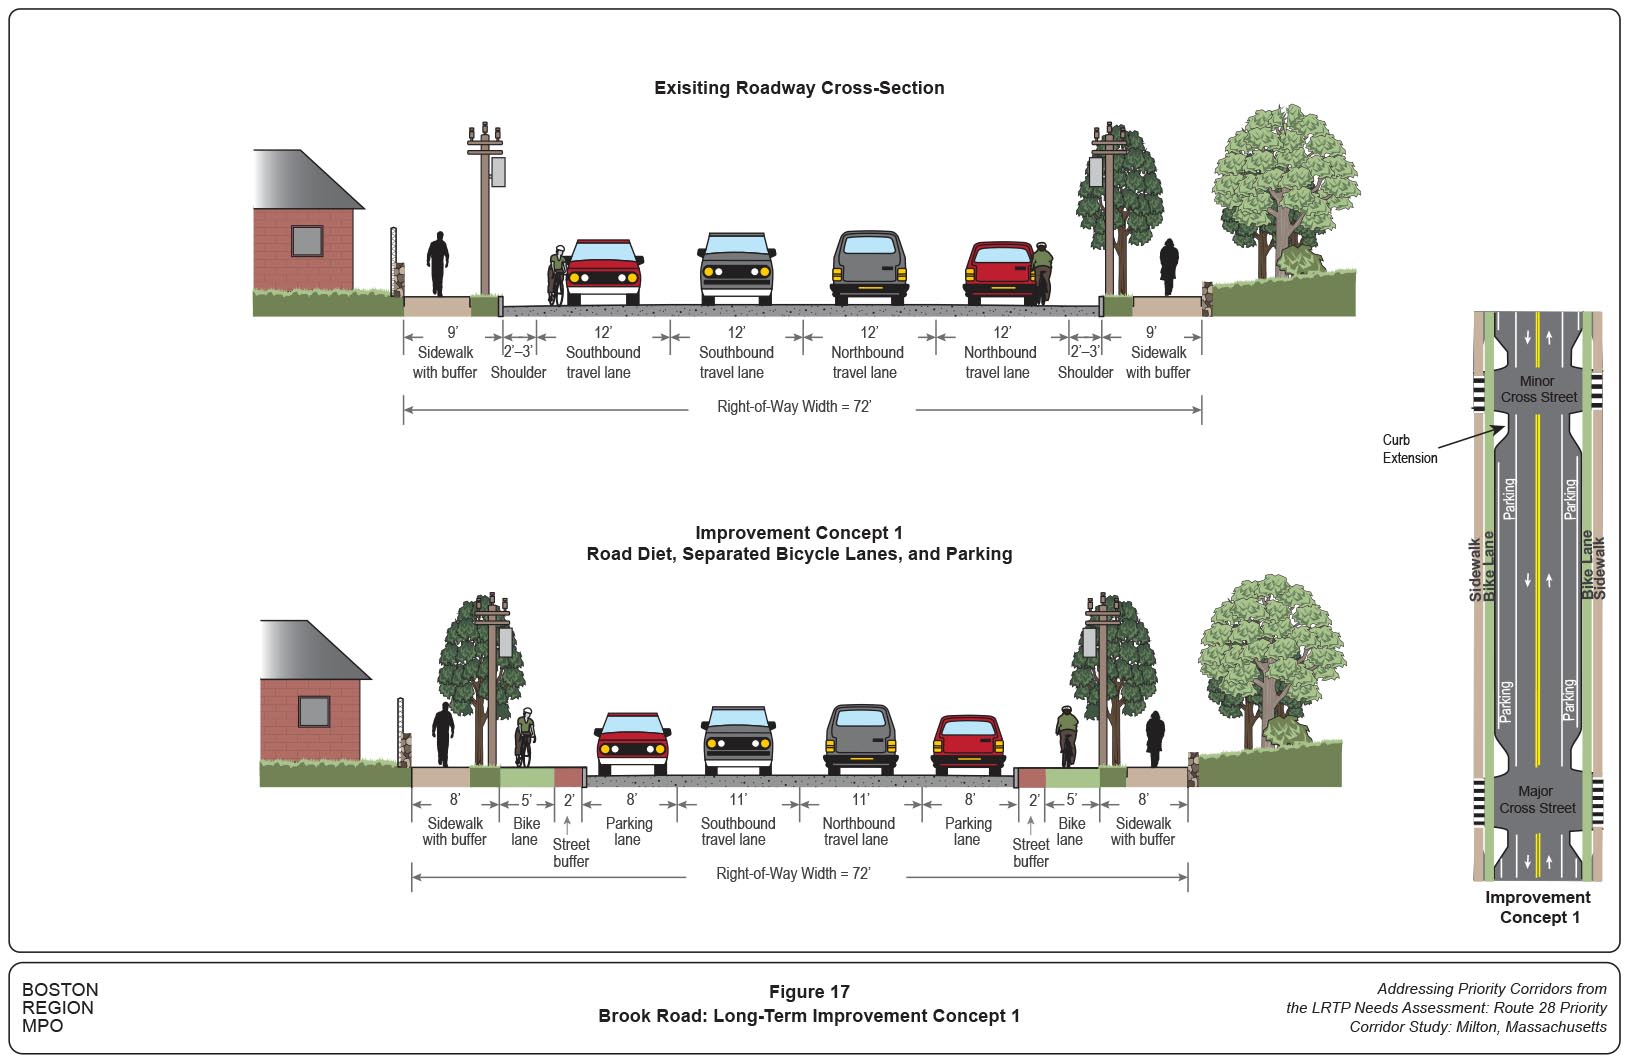
Concept 1 would remove a travel lane in each direction and reconfigure the roadway to install on-street parking, separated bicycle lanes, and sidewalks to ADA standards on either side of the roadway. Concept 1 retains the current configuration at the major signalized intersections. The new roadway could include green streetscape, ornamental street lighting, and bus shelters with benches at the bus stops near the schools and recreation areas. Concept 1 renovates the corridor to meet current needs, making it easier and safer to walk and bike. It provides parking for school drop-off and pick-up and for recreational activities. The improvements would also calm traffic and reduce high speeds of vehicles. Table 16 presents the performance of Concept 1.
Table 16
Brook Road: Performance of Long-Term Improvement Concept 1
Approach |
Lane Group |
AM 50% Queue (ft.)* |
AM 95% Queue (ft.)** |
AM Delay (s) |
AM LOS |
PM 50% Queue (ft.)* |
PM 95% Queue (ft.)** |
PM Delay (s) |
PM LOS |
||
Route 28 |
WB |
R |
303 |
-560 |
36.0 |
D |
233 |
399 |
26.8 |
C |
|
Route 28 |
SB |
L |
168 |
333 |
26.7 |
C |
-534 |
-1003 |
75.0 |
E |
|
Route 28 |
SB |
LT |
172 |
337 |
26.4 |
C |
-626 |
-1086 |
84.4 |
F |
|
Blue Hill Parkway |
NB |
TR |
186 |
-347 |
54.1 |
D |
158 |
-315 |
74.2 |
E |
|
Brook Road |
EB |
LTR |
168 |
-376 |
65.7 |
E |
196 |
-427 |
69.9 |
E |
|
Intersection |
All |
All |
-- |
-- |
40.5 |
D |
-- |
-- |
64.2 |
E |
|
Route 28 |
EB |
TR |
0 |
0 |
0.0 |
A |
0 |
0 |
0.0 |
A |
|
Route 28 |
WB |
LT |
0 |
2 |
0.0 |
A |
0 |
1 |
0.1 |
A |
|
Thacher Street |
NB |
LR |
10 |
43 |
21.5 |
C |
20 |
115 |
64.4 |
E |
|
Intersection |
All |
All |
-- |
-- |
2.3 |
A |
-- |
-- |
4.2 |
A |
|
Route 28 |
EB |
TR |
0 |
331 |
6.6 |
A |
0 |
-705 |
11.1 |
B |
|
Route 28 |
WB |
LT |
0 |
-706 |
11.4 |
B |
0 |
-495 |
9.4 |
A |
|
St. Mary’s Road |
NE |
LR |
2 |
31 |
15.9 |
B |
3 |
32 |
12.8 |
B |
|
Intersection |
All |
All |
-- |
-- |
9.6 |
A |
-- |
-- |
10.4 |
B |
|
Route 28 |
NW |
LTR |
0 |
-775 |
9.4 |
A |
103 |
512 |
9.0 |
A |
|
Route 28 |
SE |
LTR |
0 |
370 |
6.0 |
A |
162 |
-837 |
12.0 |
B |
|
Standish Street |
SW |
LTR |
4 |
31 |
20.6 |
C |
12 |
49 |
27.9 |
C |
|
Intersection |
All |
All |
-- |
-- |
8.3 |
A |
-- |
-- |
11.1 |
B |
|
Route 28 |
NB |
LTR |
-440 |
-580 |
112.4 |
F |
-300 |
-423 |
121.6 |
F |
|
Route 28 |
EB |
LT |
-481 |
-704 |
135.6 |
F |
-523 |
-745 |
125.9 |
F |
|
Route 28 |
EB |
R |
182 |
309 |
34.0 |
C |
360 |
-593 |
63.9 |
E |
|
Brook Road |
WB |
L |
126 |
192 |
35.2 |
D |
-155 |
-319 |
151.7 |
F |
|
Brook Road |
WB |
TR |
143 |
191 |
34.0 |
C |
156 |
204 |
34.2 |
C |
|
Central Avenue |
NE |
LR |
2 |
-98 |
27.5 |
C |
66 |
-247 |
74.3 |
E |
|
Central Avenue |
SB |
LTR |
141 |
-225 |
89.6 |
F |
224 |
-313 |
77.8 |
E |
|
Intersection |
All |
All |
-- |
-- |
79.5 |
E |
-- |
-- |
89.7 |
F |
|
Note: * Negative (-) sign = Volume exceeds capacity (queue may be longer)
** Negative (-) sign = 95 percentile volume exceed capacity, queue may be longer
EB = eastbound. L= left. LOS = level of service. LR = left and right. LT= left and through. LTR = left, through, and right. NB = northbound. NE = northeast. NW = northwest. R = right. SB = southbound. SW = southwest.TR = through and right. WB = westbound.
Source: Central Transportation Planning Staff.
Figure 18 shows the cross-sectional configuration of Concept 2. It is similar to Concept 1 and would reconfigure the roadway to include separated bicycle lane and sidewalks on either side of the roadway, and on-street parking on one side. In addition, Concept 2 adds a median to make it easier to cross the road. The median in Concept 2 could transition into left-turn lanes at the some of the signalized intersections to improve traffic flow and safety. The new roadway could include green streetscape, ornamental street lighting, and bus shelters with benches at the bus stops near the schools and recreation areas.
Concept 2 renovates the corridor to meet current needs, making it easier and safer to walk, bike, cross the road, and provides parking for school and recreational activities. Adding a median would calm traffic, reduce high speeds of vehicles, reduce crossing distances, and provide refuge areas for pedestrians crossing the road. In addition, left-turn lanes at the some of the signalized intersections (Standish Road and St Mary’s Road) would improve traffic flow and safety in the segment during peak travel periods. Table 17 presents the performance of Concept 2.
Figure 18 shows the cross-sectional configuration of Concept 3. It includes many of the same elements in Concept 2, except that the median is replaced with a two-way left-turn lane. Concept 3 also renovates the corridor to address current needs of the corridor—safe accommodation for people who walk and bike and parking for school and recreational activities. The two-way left-turn lane would improve safety of left-turn maneuvers, traffic flow, and safety in the segment. Table 17 presents the performance of Concept 3.
This intersection experiences congestion during peak travel periods. The lane assignments at the approaches of Brook Road and Reedsdale Road are confusing to some motorists and it is a high-crash intersection. Figure 19 shows a roundabout concept that MPO staff developed for the intersection.
Figure 18
Brook Road: Long-Term Improvements Concepts 2 and 3
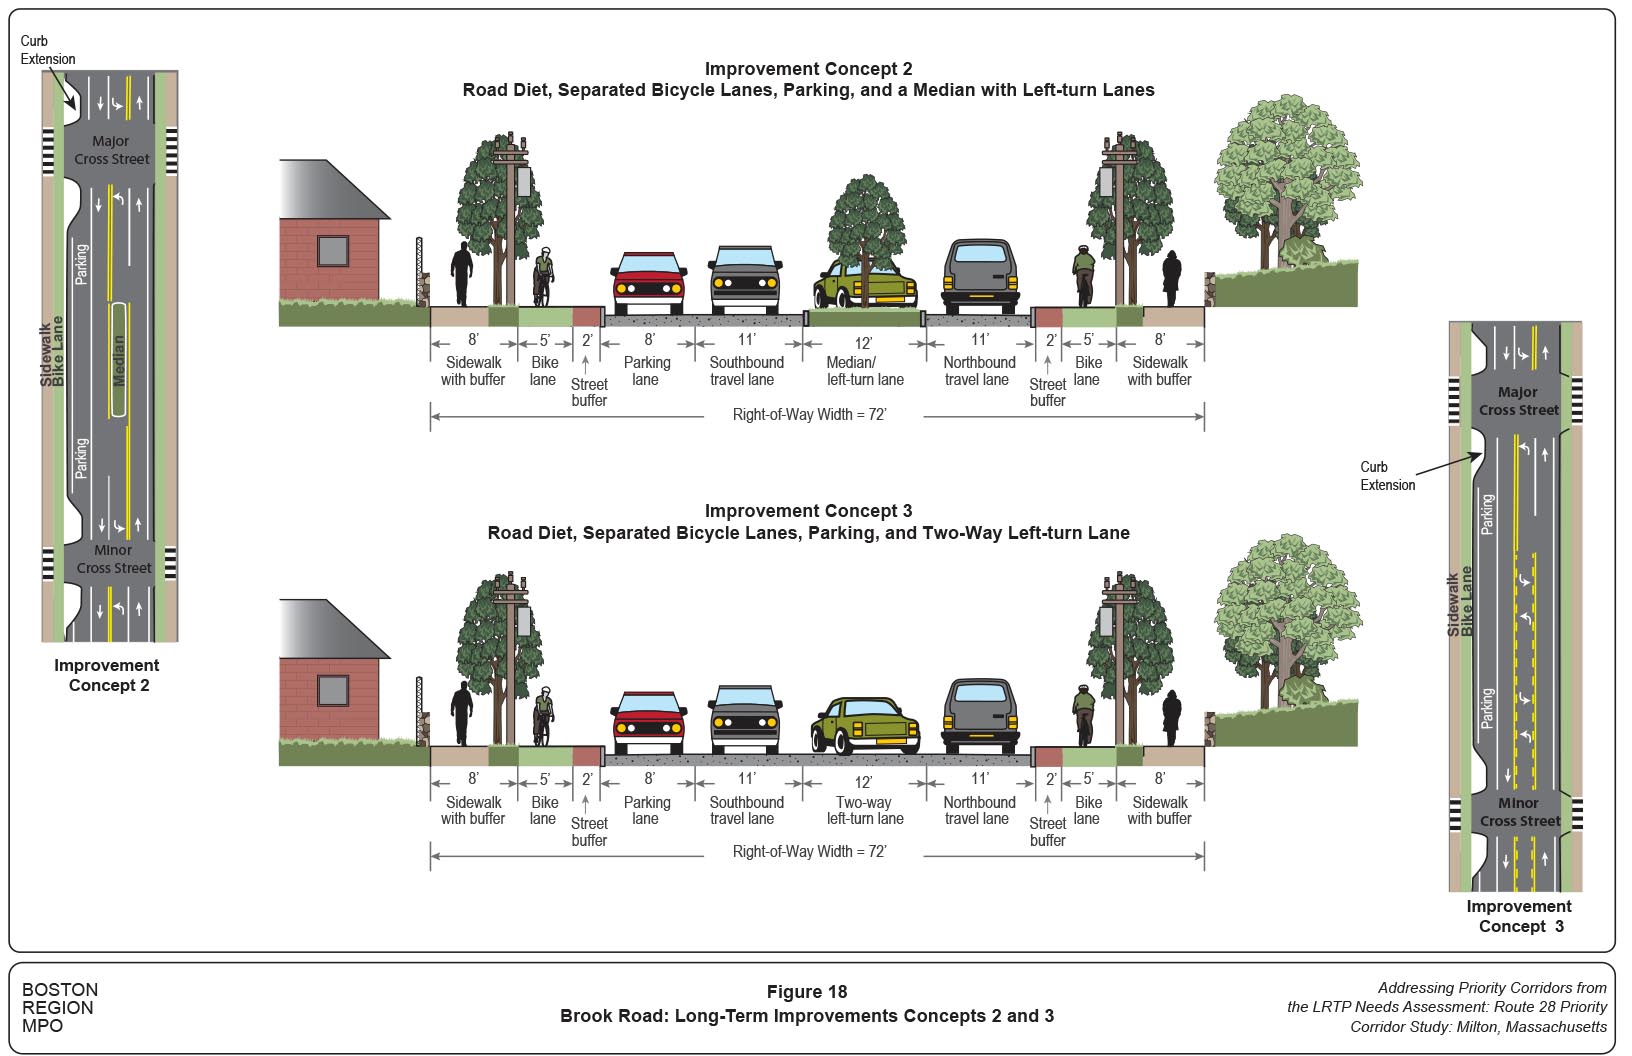
Analysis indicates that retrofitting the signalized intersection with roundabout would work well and reduce severe injury crashes. Roundabouts are geometrically designed to reduce speeds to 15–25 mph and have traffic calming benefits. Table 18 presents the performance of the roundabout concept.
Table 17
Brook Road: Performance of Long-Term Improvements Concepts 2 and 3
Street Name |
Approach |
Lane Group |
AM 50% Queue (ft.)* |
AM 95% Queue (ft.)** |
AM Delay (s) |
AM LOS |
PM 50% Queue (ft.)* |
PM 95% Queue (ft.)** |
PM Delay (s) |
PM LOS |
Route 28 |
WB |
R |
303 |
-560 |
36.0 |
D |
233 |
399 |
26.8 |
C |
Route 28 |
SB |
L |
168 |
333 |
26.7 |
C |
-534 |
-1003 |
75.0 |
E |
Route 28 |
SB |
LT |
172 |
337 |
26.4 |
C |
-626 |
-1086 |
84.4 |
F |
Blue Hill Parkway |
NB |
TR |
186 |
-347 |
54.1 |
D |
158 |
-315 |
74.2 |
E |
Brook Road |
EB |
LTR |
168 |
-376 |
65.7 |
E |
196 |
-427 |
69.9 |
E |
Intersection |
All |
All |
-- |
-- |
40.5 |
D |
-- |
-- |
64.2 |
E |
Route 28 |
EB |
TR |
0 |
0 |
0.0 |
A |
0 |
0 |
0.0 |
A |
Route 28 |
WB |
LT |
2 |
2 |
0.4 |
A |
0 |
0 |
0.0 |
A |
Thacher Street |
NB |
LR |
20 |
43 |
21.5 |
C |
50 |
115 |
64.4 |
E |
Intersection |
All |
All |
-- |
-- |
2.3 |
A |
-- |
-- |
4.2 |
A |
Route 28 |
EB |
TR |
0 |
331 |
6.6 |
A |
0 |
-705 |
11.1 |
B |
Route 28 |
WB |
L |
0 |
33 |
5.9 |
A |
0 |
20 |
7.6 |
A |
Route 28 |
WB |
T |
0 |
-623 |
9.7 |
A |
0 |
-465 |
8.7 |
A |
St. Mary’s Road |
NE |
LR |
2 |
31 |
16.0 |
B |
3 |
32 |
12.8 |
B |
Intersection |
All |
All |
-- |
-- |
8.5 |
A |
-- |
-- |
10.2 |
B |
Route 28 |
NW |
L |
0 |
17 |
5.2 |
A |
3 |
26 |
7.5 |
A |
Route 28 |
NW |
TR |
0 |
-742 |
9.0 |
A |
91 |
442 |
7.9 |
A |
Route 28 |
SE |
L |
0 |
19 |
6.0 |
A |
2 |
17 |
6.1 |
A |
Route 28 |
SE |
TR |
0 |
341 |
5.6 |
A |
151 |
-796 |
11.4 |
B |
Standish Street |
SW |
LTR |
4 |
31 |
20.6 |
C |
11 |
49 |
26.6 |
C |
Intersection |
All |
All |
-- |
-- |
7.8 |
A |
-- |
-- |
10.2 |
B |
Route 28 |
NB |
LTR |
-440 |
-580 |
112.4 |
F |
-300 |
-423 |
121.6 |
F |
Route 28 |
EB |
LT |
-481 |
-704 |
135.6 |
F |
-523 |
-745 |
125.9 |
F |
Route 28 |
EB |
R |
182 |
309 |
34.0 |
C |
360 |
-593 |
63.9 |
E |
Brook Road |
WB |
L |
126 |
192 |
35.2 |
D |
-155 |
-319 |
151.7 |
F |
Brook Road |
WB |
TR |
143 |
191 |
34.0 |
C |
156 |
204 |
34.2 |
C |
Central Avenue |
NE |
LR |
2 |
-98 |
27.5 |
C |
66 |
-247 |
74.3 |
E |
Central Avenue |
SB |
LTR |
141 |
-225 |
89.6 |
F |
224 |
-313 |
77.8 |
E |
Intersection |
All |
All |
-- |
-- |
79.5 |
E |
-- |
-- |
89.7 |
F |
Note: * Negative (-) sign = Volume exceeds capacity (queue may be longer)
** Negative (-) sign = 95 percentile volume exceed capacity, queue may be longer
EB = eastbound. L= left. LOS = level of service. LR = left and right. LT= left and through. LTR = left, through, and right. NB = northbound. NE = northeast. NW = northwest. R = right. SB = southbound. SW = southwest.TR = through and right. WB = westbound.
Source: Central Transportation Planning Staff.
Figure 19
Roundabout Retrofit at Brook Road and Reedsdale Road Intersection
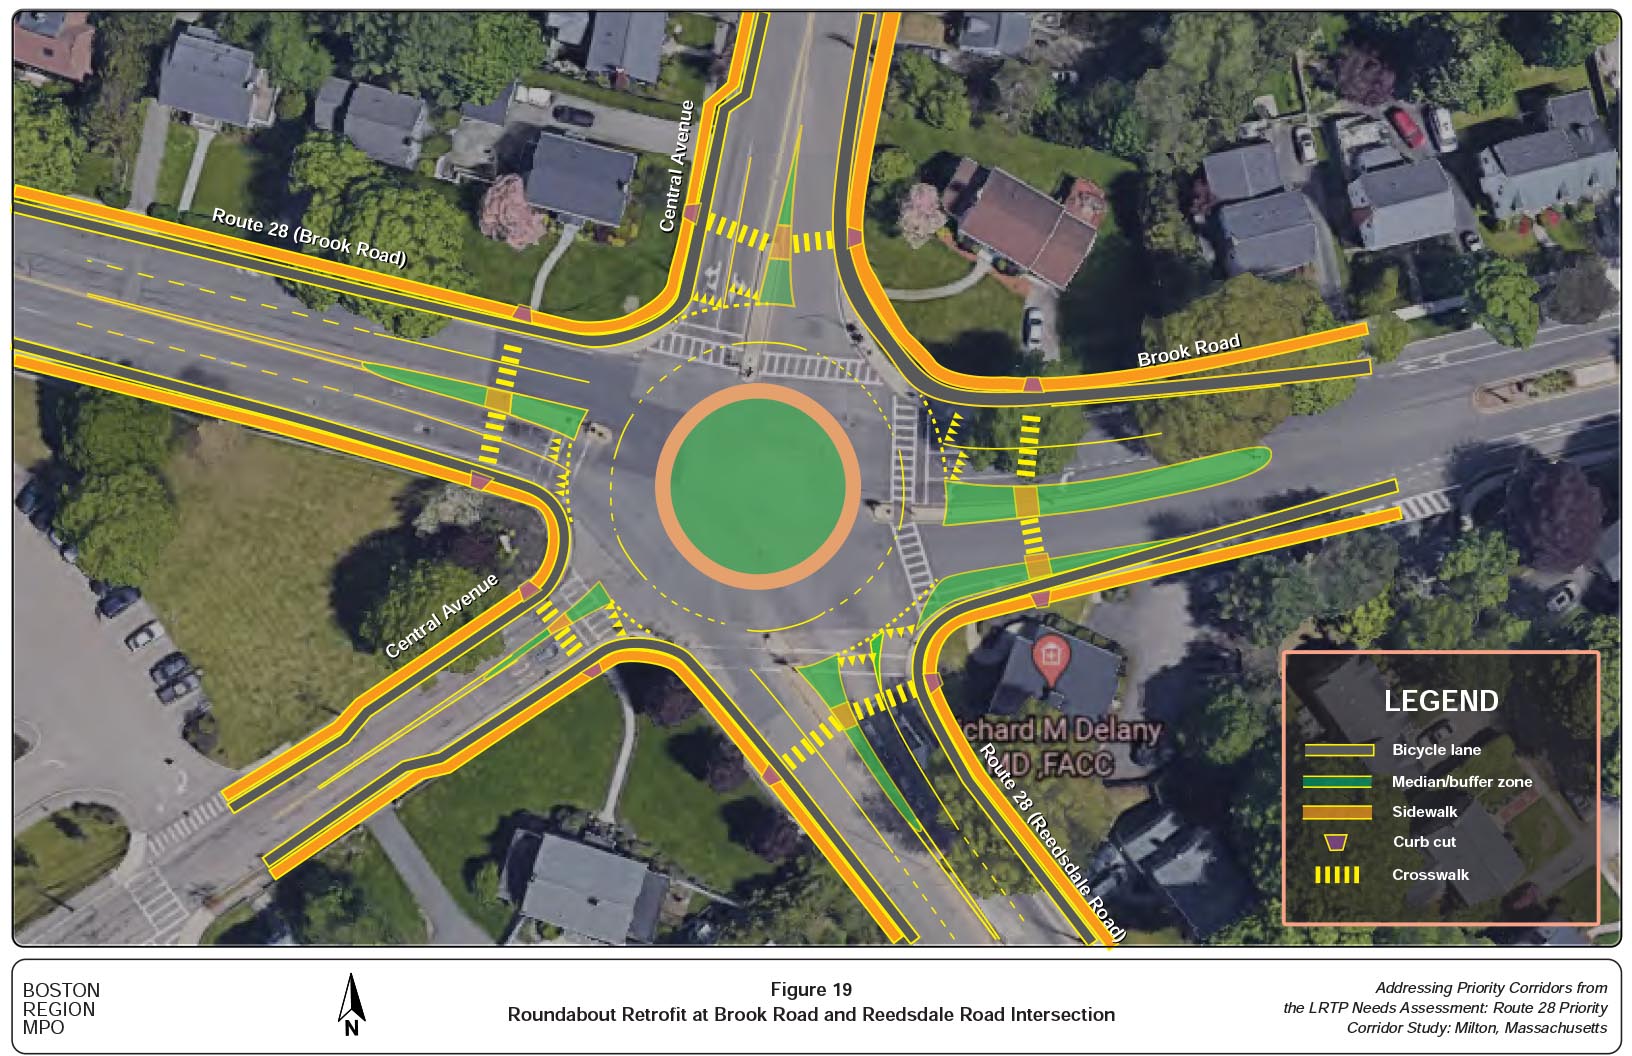
Table 18
Performance of Brook Road and Reedsdale Road Roundabout Concept
Street Name |
Approach |
Lane Group |
AM 50% Queue (ft.)* |
AM 95% Queue (ft.)** |
AM Delay (s) |
AM LOS |
PM 50% Queue (ft.)* |
PM 95% Queue (ft.)** |
PM Delay (s) |
PM LOS |
Route 28 |
NB |
L |
-- |
100 |
15.5 |
C |
-- |
200 |
19.2 |
D |
|
NB |
LTR |
-- |
75 |
11.3 |
B |
-- |
0 |
5.3 |
A |
Route 28 |
SB |
LT |
-- |
75 |
11.4 |
B |
-- |
125 |
18.7 |
C |
|
SB |
R |
-- |
50 |
8.6 |
A |
-- |
125 |
16.4 |
C |
Brook Road |
WB |
LT |
-- |
75 |
14.8 |
B |
-- |
50 |
11.7 |
B |
|
WB |
TR |
-- |
75 |
13.6 |
B |
-- |
50 |
10.6 |
B |
Central Avenue |
SB |
LT |
-- |
25 |
12.6 |
B |
-- |
50 |
14.3 |
B |
Central Avenue |
SB |
TR |
-- |
25 |
11.3 |
B |
-- |
50 |
12.9 |
B |
Central Avenue |
NB |
LTR |
-- |
25 |
10.5 |
B |
-- |
75 |
21.2 |
C |
Intersection |
All |
-- |
-- |
-- |
12.2 |
B |
-- |
-- |
17.7 |
C |
LOS = level of service.
EB = eastbound. L= left. LOS = level of service. LR = left and right. LT= left and through. LTR = left, through, and right. NB = northbound. R = right. SB = southbound. WB = westbound.
Source: Central Transportation Planning Staff.
The needs of the Reedsdale Road segment are described in Chapter 8. The improvement concepts suggested below are designed to address those needs.
Figure 20 shows the cross-sectional configuration of Concept 1. Concept 1 would remove a travel lane in each direction on Reedsdale Road and reconfigure the roadway to include a two-way, left-turn lane, separated bicycle lanes, and ADA-compliant sidewalks. Additional improvements include green streetscape design, ornamental street lighting, bike racks, and bus shelters with benches near the Beth Israel Deaconess Hospital and Milton Library.
Concept 1 renovates the corridor to address current needs, making it easier and safer to walk or bicycle in the segment. The improvements would also calm traffic and reduce high speeds of vehicles. The two-way left-turn lanes would improve safety of left-turn maneuvers. Table 19 presents the performance of Concepts 1 and 2.
Figure 20
Reedsdale Road: Long-Term Improvement Concept 1
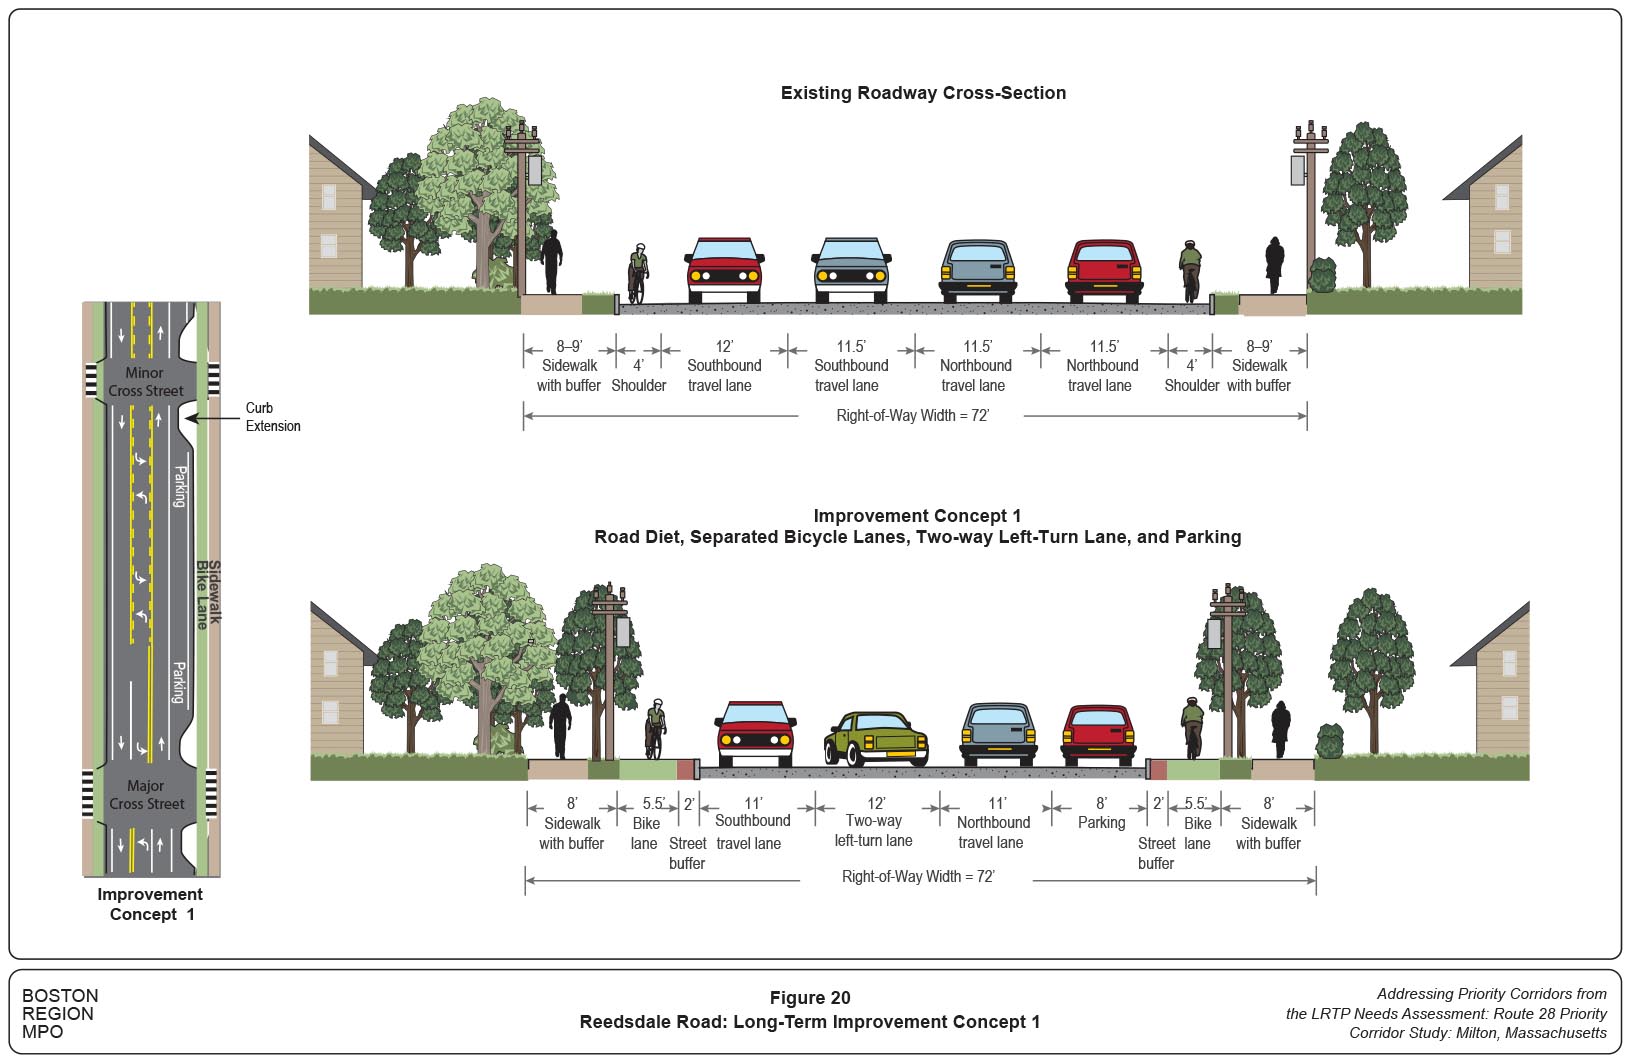
Table 19
Reedsdale Road: Performance of Long-Term Improvements—Concepts 1 and 2
Street Name |
Approach |
Lane Group |
AM 50% Queue (ft.)* |
AM 95% Queue (ft.)** |
AM Delay (s) |
AM LOS |
PM 50% Queue (ft.)* |
PM 95% Queue (ft.)** |
PM Delay (s) |
PM LOS |
Route 28 |
NW |
LTR |
-630 |
-771 |
83.4 |
F |
361 |
-547 |
71.6 |
E |
Route 28 |
SE |
LTR |
198 |
257 |
35.7 |
D |
-492 |
-743 |
121.1 |
F |
Canton Avenue |
NE |
LT |
-555 |
-779 |
164.3 |
F |
-613 |
-1004 |
220.5 |
F |
Canton Avenue |
NE |
R |
49 |
123 |
22.9 |
C |
46 |
134 |
23.3 |
C |
Canton Avenue |
SB |
LR |
42 |
-168 |
57.8 |
E |
-295 |
-564 |
207.1 |
F |
Centre Street |
SW |
LTR |
-545 |
-769 |
161.1 |
F |
-515 |
-879 |
193 |
F |
Intersection |
All |
All |
-- |
-- |
94.5 |
F |
-- |
-- |
137.1 |
F |
Route 28 |
NB |
L |
5 |
15 |
10.1 |
B |
5 |
14 |
13.3 |
B |
Route 28 |
NB |
T |
0 |
0 |
0 |
A |
0 |
0 |
0.0 |
A |
Route 28 |
SB |
TR |
0 |
0 |
0.0 |
A |
0 |
0 |
0.0 |
A |
Hospital Driveway |
EB |
LR |
30 |
80 |
89.5 |
F |
200 |
337 |
307.7 |
F |
Intersection |
All |
All |
-- |
-- |
3.7 |
A |
-- |
-- |
31.0 |
C |
Route 28 |
NB |
L |
-356 |
-977 |
97.3 |
F |
133 |
-405 |
34.9 |
C |
Route 28 |
NB |
LTR |
367 |
-1061 |
57.3 |
E |
190 |
412 |
22 |
C |
Route 28 |
EB |
LT |
199 |
-406 |
44.8 |
D |
191 |
369 |
37.9 |
D |
Route 28 |
EB |
R |
0 |
34 |
2.3 |
A |
146 |
-380 |
12.4 |
B |
Reedsdale Road |
WB |
LTR |
160 |
-337 |
60.1 |
E |
209 |
-433 |
72.2 |
E |
Randolph Avenue |
SB |
LTR |
168 |
331 |
35.7 |
D |
290 |
-619 |
54.6 |
D |
Intersection |
All |
All |
-- |
-- |
56.6 |
E |
-- |
-- |
37.8 |
D |
Note:
Shading denotes intersections that are congested during peak travel hours.
* Negative (-) sign = Volume exceeds capacity (queue may be longer)
** Negative (-) sign = 95 percentile volume exceed capacity, queue may be longer
EB = eastbound. L= left. LOS = level of service. LR = left and right. LT= left and through. LTR = left, through, and right. NB = northbound. NE = northeast. NW = northwest. R = right. SB = southbound. SE = southeast. T = through. SW = southwest.TR = through and right. WB = westbound.
Source: Central Transportation Planning Staff.
Figure 21 shows the roadway cross-sectional configuration of Concepts 2 and 3. Concept 2 would reconfigure the roadway to include an ADA-compliant sidewalk on one side of the roadway and a multiuse path on the other side. Concept 2 also includes a median to make it easier to cross the road and on-street parking for residents. The median would transition into left-turn lanes at the signalized intersections at Central Avenue, Canton Avenue, and Randolph Avenue. Additional improvements include trees or grass buffers to separate pedestrians from travel lanes, ornamental street lighting, and bus shelters with benches near the Beth Israel Deaconess Hospital and Milton Library. Table 19 presents the performance of Concepts 1 and 2.
Figure 21
Reedsdale Road: Long-Term Improvements Concepts 2 and 3
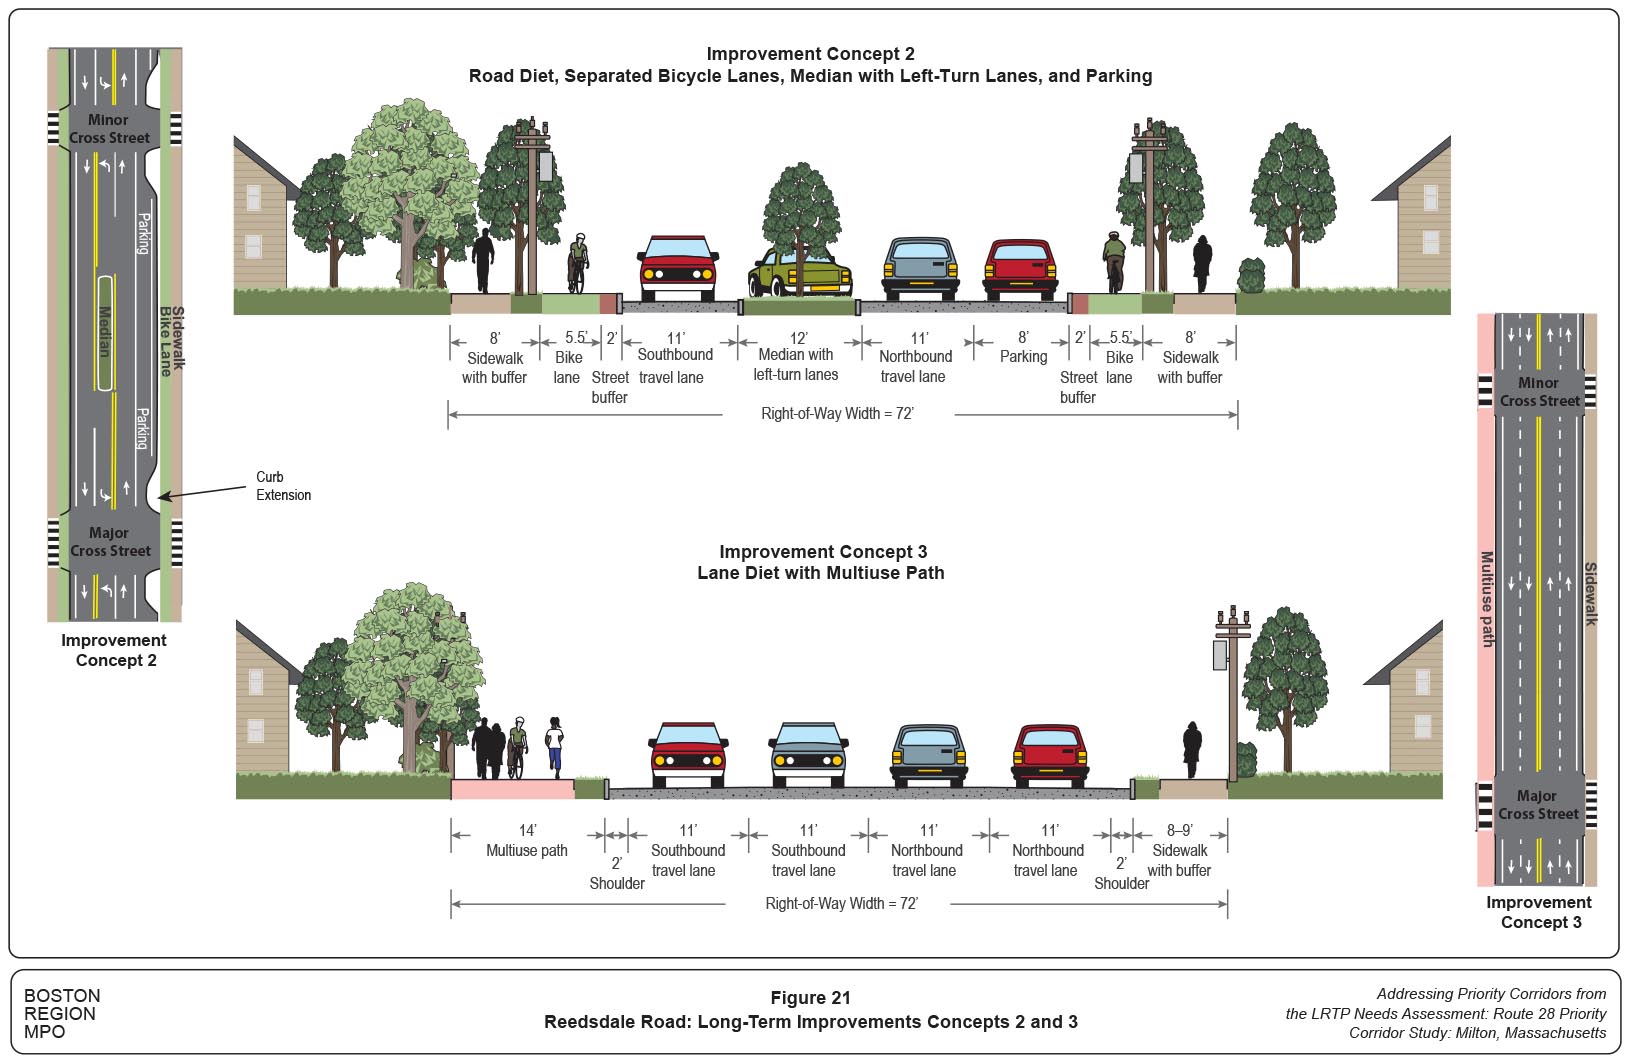
Concept 2 addresses the corridor issues, making it easier and safer to walk, bike, and cross the road. It would improve the safety of left-turn maneuvers, provide parking for residents, calm traffic, reduce high speeds of vehicles, and provide median refuge areas for pedestrians.
Figure 21 shows the roadway cross-sectional configuration of Concepts 2 and 3. Concept 3 maintains the four travel lanes (two in each direction) but reduces lane widths and utilizes the shoulders to install a multiuse path on one side of the roadway and a sidewalk on the other. Table 20 presents the performance of Concept 3.
Table 20
Reedsdale Road: Performance of Long-Term Improvement—Concept 3
Street Name |
Approach |
Lane Group |
AM 50% Queue (ft.)* |
AM 95% Queue (ft.)** |
AM Delay (s) |
AM LOS |
PM 50% Queue (ft.)* |
PM 95% Queue (ft.)** |
PM Delay (s) |
PM LOS |
Route 28 |
NW |
LTR |
-594 |
-908 |
96.1 |
F |
354 |
-535 |
68.4 |
E |
Route 28 |
SE |
LTR |
205 |
310 |
49.7 |
D |
-476 |
-718 |
105.3 |
F |
Canton Avenue |
NE |
LT |
-520 |
-873 |
150.1 |
F |
-505 |
-892 |
172 |
F |
Canton Avenue |
NE |
R |
47 |
133 |
23.1 |
C |
147 |
271 |
67.9 |
E |
Canton Avenue |
SB |
LR |
-180 |
-382 |
201.2 |
F |
-270 |
-549 |
172.6 |
F |
Centre Street |
SW |
LTR |
-522 |
-873 |
158.7 |
F |
-474 |
-852 |
158.9 |
F |
Intersection |
All |
All |
-- |
-- |
108.2 |
F |
-- |
-- |
117.5 |
F |
Route 28 |
NB |
LT |
0 |
13 |
1.8 |
A |
0 |
9 |
1.3 |
A |
Route 28 |
SB |
TR |
0 |
0 |
0.0 |
A |
0 |
0 |
0.0 |
A |
Hospital Driveway |
EB |
LR |
10 |
25 |
24.3 |
C |
30 |
90 |
30.0 |
D |
Intersection |
All |
All |
-- |
-- |
1.8 |
A |
-- |
-- |
3.5 |
A |
Route 28 |
NB |
L |
-385 |
-841 |
110.6 |
F |
154 |
-415 |
33.1 |
C |
Route 28 |
NB |
LTR |
-433 |
-1083 |
71.9 |
E |
184 |
407 |
20.7 |
C |
Route 28 |
EB |
LTR |
238 |
-516 |
55.3 |
E |
200 |
-419 |
43 |
D |
Route 28 |
EB |
R |
68 |
116 |
9.3 |
A |
427 |
-1039 |
39 |
D |
Reedsdale Road |
WB |
LTR |
165 |
-350 |
77.7 |
E |
-241 |
-456 |
107.8 |
F |
Randolph Avenue |
SB |
LTR |
180 |
-373 |
41 |
D |
-318 |
-678 |
93.1 |
F |
Intersection |
All |
All |
-- |
-- |
69.6 |
E |
-- |
-- |
58.0 |
E |
Note: * Negative (-) sign = Volume exceeds capacity (queue may be longer).
** Negative (-) sign = 95 percentile volume exceed capacity, queue may be longer.
EB = eastbound. L= left. LOS = level of service. LR = left and right. LT= left and through. LTR = left, through, and right. NB = northbound. NE = northeast. NW = northwest. R = right. SB = southbound. SE = southeast. SW = southwest.TR = through and right. WB = westbound.
Source: Central Transportation Planning Staff.
Concept 3 renovates the corridor to address some of the corridor needs, making it easier and safer to walk and bicycle, and it reduces congestion. The weaknesses of Concept 3 include minimal impact on high speed and crossing distances, and it does not improve the safety of left-turn maneuvers.
The needs of the Randolph Avenue segment are described in Chapter 8. Unlike the Brook Road and Reedsdale Avenue segments, the right-of-way in the Randolph Avenue segment is constrained, which limits the concepts choices for the segment. The objectives of the improvement concepts are to improve safety for people who walk, bicycle, or drive in the Randolph Avenue segment. There were four fatalities and a high number of crashes in 2013–17. The improvement concepts suggested below are designed to address those needs.
Figure 22 shows the roadway cross-sectional configuration of Concept 1. Concept 1 maintains the four travel lanes (two in each direction) but reduces lane widths to install a multiuse path on one side of the roadway and a sidewalk on the other side. Additional improvements include better streetscape design that could include trees or grass buffers and street lighting. This concept creates space for people who walk and bike, making it easier and safer to walk and bicycle in the segment. Table 21 presents the performance of Concept 1.
A shortcoming of this concept is that it does not address the lack of turn lanes on Randolph Avenue, a major contributor of crashes in the segment, and would not improve the safety of left-turn maneuvers or reduce the high number of crashes or the severity.
Figure 22
Randolph Avenue: Long-Term Improvement Concept 1
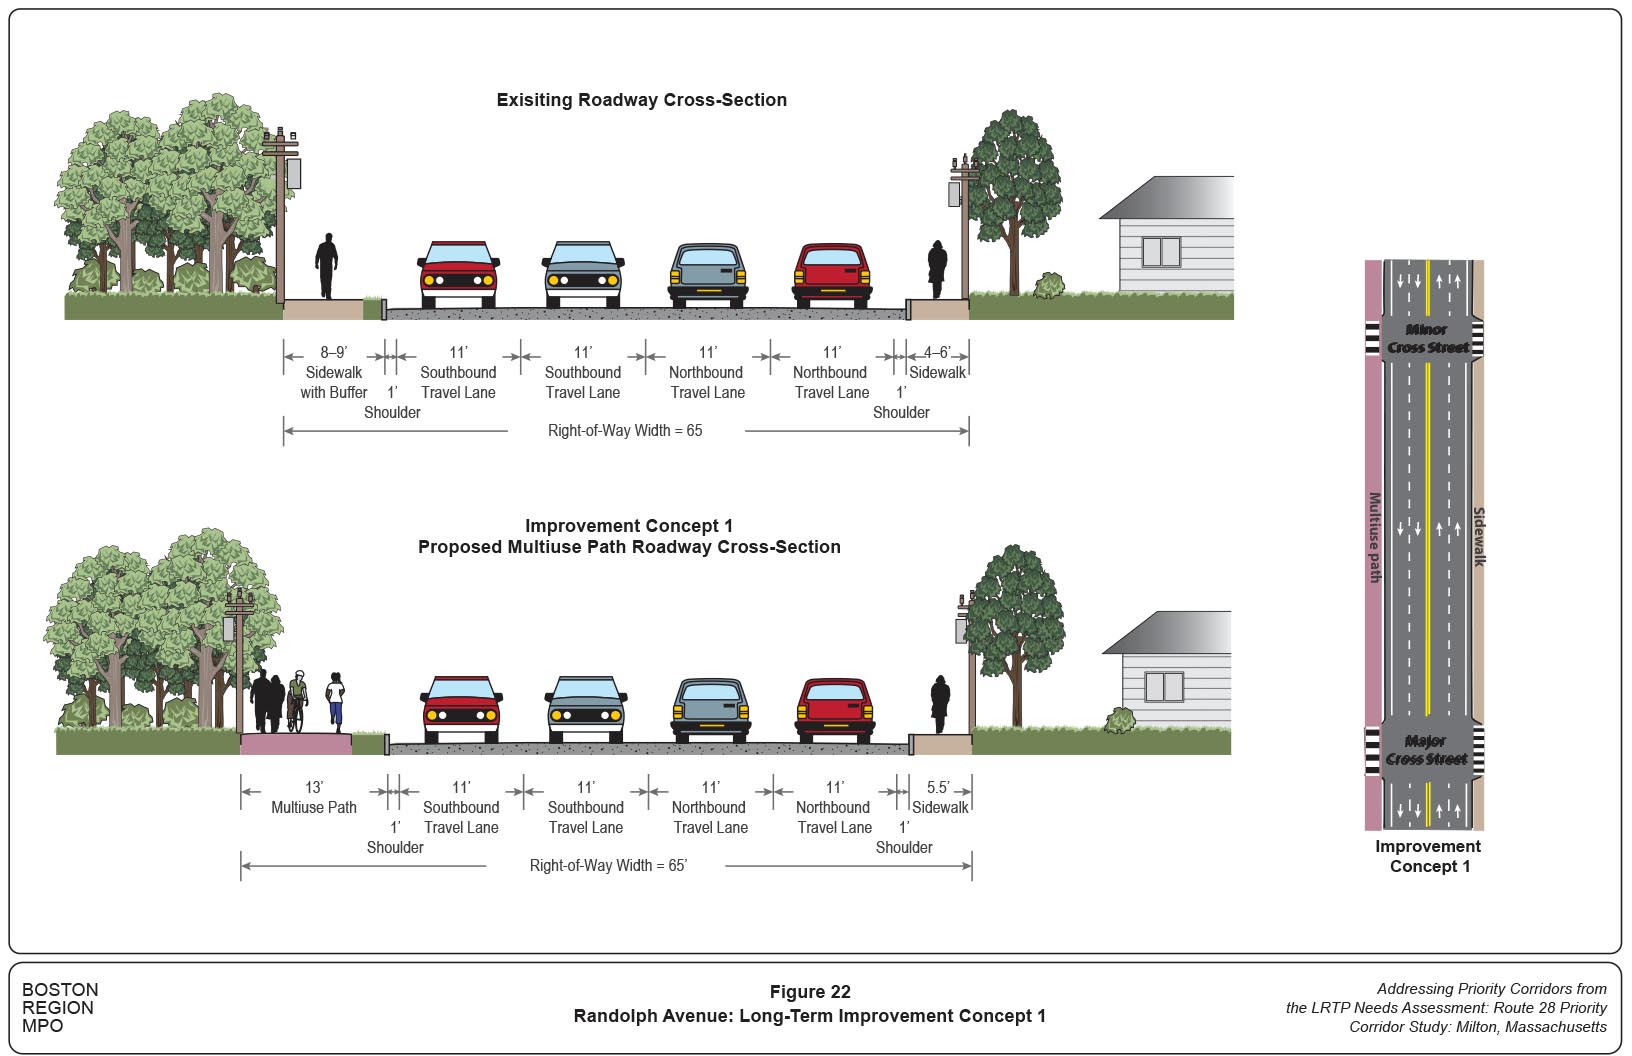
Table 21
Randolph Avenue: Performance of Long-Term Improvement—Concept 1
Street Name |
Approach |
Lane Group |
AM 50% Queue (ft.)* |
AM 95% Queue (ft.)** |
AM Delay (s) |
AM LOS |
PM 50% Queue (ft.)* |
PM 95% Queue (ft.)** |
PM Delay (s) |
PM LOS |
Route 28 |
NB |
L |
-392 |
-995 |
122.2 |
F |
146 |
-429 |
38.1 |
D |
Route 28 |
NB |
LTR |
-412 |
-1082 |
72.4 |
E |
192 |
420 |
23.0 |
C |
Route 28 |
EB |
LT |
200 |
-418 |
45.2 |
D |
193 |
-375 |
38.8 |
D |
Route 28 |
EB |
R |
0 |
35 |
2.5 |
A |
138 |
-371 |
12.1 |
B |
Reedsdale Road |
WB |
LTR |
162 |
-343 |
60.9 |
E |
212 |
-442 |
80.3 |
F |
Randolph Avenue |
SB |
LTR |
167 |
331 |
35.6 |
D |
303 |
-657 |
72.3 |
E |
Intersection |
All |
All |
-- |
-- |
66.4 |
E |
-- |
-- |
42.7 |
D |
Route 28 |
NB |
LT |
237 |
-898 |
14.4 |
B |
95 |
350 |
9.9 |
A |
Route 28 |
SB |
T |
51 |
192 |
6.2 |
A |
166 |
602 |
13.7 |
B |
Reeds Street |
EB |
LR |
13 |
51 |
37.4 |
D |
21 |
92 |
36.8 |
D |
Intersection |
All |
All |
-- |
-- |
12.4 |
B |
-- |
-- |
12.7 |
B |
Route 28 |
NB |
LT |
177 |
327 |
5.9 |
A |
92 |
-575 |
12.9 |
B |
Route 28 |
SB |
TR |
36 |
63 |
2.2 |
A |
126 |
-752 |
10.6 |
B |
Hallen Avenue |
EB |
L |
2 |
13 |
29.8 |
C |
2 |
16 |
36.5 |
C |
Hallen Avenue |
EB |
R |
0 |
31 |
13.7 |
B |
0 |
51 |
15.2 |
B |
Intersection |
All |
All |
-- |
-- |
5.0 |
A |
-- |
-- |
11.7 |
B |
Route 28 |
NB |
LTR |
296 |
-947 |
18.3 |
B |
139 |
-660 |
18.8 |
B |
Route 28 |
SB |
LTR |
72 |
241 |
8.3 |
A |
266 |
-1088 |
20.2 |
C |
Hillside Street |
EB |
LTR |
53 |
-164 |
53.7 |
D |
63 |
166 |
45.5 |
D |
Driveway |
WB |
LTR |
2 |
15 |
37 |
D |
2 |
17 |
45.2 |
D |
Intersection |
All |
All |
-- |
-- |
16.8 |
B |
-- |
-- |
20.9 |
C |
Note: * Negative (-) sign = Volume exceeds capacity (queue may be longer)
** Negative (-) sign = 95 percentile volume exceed capacity, queue may be longer
EB = eastbound. L= left. LOS = level of service. LR = left and right. LT= left and through. LTR = left, through, and right.
NB = northbound. R = right. SB = southbound. SE = southeast. T = through. TR = through and right. WB = westbound.
Source: Central Transportation Planning Staff.
Figure 23 shows the roadway cross-sectional configuration of Concept 2 and 3. Concept 2 reconfigures the roadway to provide two southbound lanes and one northbound lane with left-turn lanes at the intersections. Concept 2 also includes a multiuse path on one side of the roadway and a sidewalk on the other.
Concept 2 renovates the corridor to meet current needs, improves quality of life in the neighborhood, and makes it easier and safer to walk, bike, and cross the road. Concept 2 would calm traffic, reduce high speeds of vehicle, and high number of crashes. The left-turn lanes and two-way, left-turn lanes would improve safety for left-turn maneuvers and reduce crashes on the segment. Concept 2 works well during the PM peak hours of travel. The shortcoming of Concept 2 is that congestion worsens during the AM peak hours of travel with long traffic queues in the northbound direction. Table 22 presents the performance of Concept 2.
Concept 3 was included in this study because there were comments from the community survey about keeping Randolph Avenue as two-lane, two-way road throughout Milton. The four-lane segment is perceived by some residents to attract cut-through traffic avoiding congestion on the Route 128 and the Southeast Expressway. Figure 23 shows the roadway cross-sectional configuration of Concept 3. Concept 3 removes a travel lane in each direction on Randolph Avenue and reconfigures the roadway to include a two-way left-turn lane, separated bicycle lanes, and ADA-compliant sidewalks on both sides of the roadway. The two-way left-turn lane would transition into left-turn lanes at the signalized intersections. Additional improvements include better streetscape design and street lighting.
Concept 3 renovates the corridor to meet current needs, improves quality of life in the neighborhood, and makes it easier and safer to walk, bike, and cross the road. Concept 3 would calm traffic, reduce high speeds of vehicle, and high number of crashes. The two-way left-turn lanes would improve safety for left-turn maneuvers. The shortcoming of Concept 3 is that congestion worsens and traffic operation deteriorates during the peak hours of travel with long traffic queues. The congestion and queues resulting from this concept could increase rear-end crashes and offset safety benefits. Table 23 presents the performance of Concept 3.
Besides traffic congestion, the intersection of Randolph Avenue and Reedsdale Road is a HSIP crash cluster with many angle crashes. Figure 24 shows a roundabout retrofit concept for the intersection. Analysis indicates that retrofitting the signalized intersection with roundabout would work well and reduce crashes. Table 24 presents the performance of the roundabout concept versus the signalized intersection.
Figure 23
Randolph Avenue: Long-Term Improvements Concepts 2 and 3

Table 22
Randolph Avenue: Performance of Long-Term Improvement—Concept 2
Street Name |
Approach |
Lane Group |
AM 50% Queue (ft.)* |
AM 95% Queue (ft.)** |
AM Delay (s) |
AM LOS |
PM 50% Queue (ft.)* |
PM 95% Queue (ft.)** |
PM Delay (s) |
PM LOS |
Route 28 |
NB |
L |
-388 |
-977 |
118.8 |
F |
188 |
-515 |
49.8 |
D |
Route 28 |
NB |
LTR |
-412 |
-1082 |
72.0 |
E |
139 |
307 |
16.7 |
B |
Route 28 |
EB |
LT |
200 |
-418 |
45.2 |
D |
196 |
-400 |
40.4 |
D |
Route 28 |
EB |
R |
0 |
35 |
2.4 |
A |
138 |
-361 |
12.1 |
B |
Reedsdale Road |
WB |
LTR |
162 |
-343 |
60.9 |
E |
-232 |
-450 |
92.9 |
F |
Randolph Avenue |
SB |
LTR |
170 |
335 |
36.9 |
D |
303 |
-655 |
71.7 |
E |
Intersection |
All |
All |
-- |
-- |
65.6 |
E |
-- |
-- |
46.5 |
D |
Route 28 |
NB |
L |
0 |
7 |
6 |
A |
1 |
10 |
5.4 |
A |
Route 28 |
NB |
T |
-93 |
-2308 |
120.5 |
F |
318 |
-1287 |
18.2 |
B |
Route 28 |
SB |
TR |
0 |
246 |
6.6 |
A |
166 |
726 |
11.2 |
B |
Reeds Street |
EB |
LR |
10 |
50 |
35.0 |
C |
6 |
34 |
39.6 |
D |
Intersection |
All |
All |
-- |
-- |
87.0 |
F |
-- |
-- |
14.2 |
B |
Route 28 |
NB |
L |
1 |
23 |
4.9 |
A |
0 |
13 |
3.9 |
A |
Route 28 |
NB |
T |
-88 |
-2163 |
92.4 |
F |
0 |
351 |
3.4 |
A |
Route 28 |
SB |
TR |
35 |
240 |
7.6 |
A |
110 |
324 |
6.1 |
A |
Hallen Avenue |
EB |
L |
2 |
17 |
35.8 |
D |
2 |
15 |
32.8 |
C |
Hallen Avenue |
EB |
R |
0 |
21 |
10.4 |
B |
0 |
44 |
13.8 |
B |
Intersection |
All |
All |
-- |
-- |
65.8 |
E |
-- |
-- |
5.4 |
A |
Route 28 |
NB |
L |
2 |
19 |
4.6 |
A |
6 |
41 |
6.8 |
A |
Route 28 |
NB |
TR |
-1539 |
-2930 |
193.2 |
F |
267 |
-1361 |
21.2 |
C |
Route 28 |
NB |
L |
1 |
8 |
8.4 |
A |
1 |
9 |
8.0 |
A |
Route 28 |
SB |
TR |
55 |
288 |
8.4 |
A |
386 |
-1127 |
22.8 |
C |
Hillside Street |
EB |
LTR |
67 |
-239 |
79.1 |
E |
77 |
-258 |
69.5 |
E |
Driveway |
WB |
LTR |
2 |
18 |
50.2 |
D |
2 |
17 |
45.2 |
D |
Intersection |
All |
All |
-- |
-- |
134.4 |
F |
-- |
-- |
24.0 |
C |
Note: * Negative (-) sign = Volume exceeds capacity (queue may be longer)
** Negative (-) sign = 95 percentile volume exceed capacity, queue may be longer
EB = eastbound. L= left. LOS = level of service. LR = left and right. LT= left and through. LTR = left, through, and right. NB = northbound. R = right. SB = southbound. T = through. TR = through and right. WB = westbound.
Source: Central Transportation Planning Staff.
Table 23
Randolph Avenue: Performance of Long-Term Improvement—Concept 3
Street Name |
Approach |
Lane Group |
AM 50% Queue (ft.)* |
AM 95% Queue (ft.)** |
AM Delay (s) |
AM LOS |
PM 50% Queue (ft.)* |
PM 95% Queue (ft.)** |
PM Delay (s) |
PM LOS |
Route 28 |
NB |
L |
-640 |
-1145 |
150.8 |
F |
182 |
-500 |
43.8 |
D |
Route 28 |
NB |
TR |
202 |
450 |
96.9 |
F |
138 |
303 |
16.7 |
B |
Route 28 |
EB |
LT |
202 |
-418 |
45.9 |
D |
194 |
374 |
39.4 |
D |
Route 28 |
EB |
R |
0 |
22 |
1.4 |
A |
133 |
-268 |
11.1 |
B |
Reedsdale Road |
WB |
LTR |
163 |
-345 |
63.7 |
E |
213 |
-442 |
82.1 |
F |
Randolph Avenue |
SB |
LTR |
206 |
-484 |
87.7 |
F |
299 |
-643 |
64.9 |
E |
Intersection |
All |
All |
-- |
-- |
73.2 |
E |
-- |
-- |
42.0 |
D |
Route 28 |
NB |
L |
0 |
7 |
6.0 |
A |
1 |
10 |
5.7 |
A |
Route 28 |
NB |
T |
-39 |
-2280 |
103.0 |
F |
300 |
-1252 |
16.7 |
B |
Route 28 |
SB |
TR |
0 |
-730 |
10.5 |
B |
-1161 |
-2273 |
119.8 |
F |
Reeds Street |
EB |
LR |
10 |
50 |
34.8 |
C |
6 |
34 |
38.7 |
D |
Intersection |
All |
All |
-- |
-- |
75.6 |
E |
-- |
-- |
77.0 |
E |
Route 28 |
NB |
L |
2 |
7 |
1.5 |
A |
11 |
-88 |
36.3 |
D |
Route 28 |
NB |
T |
-1704 |
-1942 |
90.5 |
F |
175 |
414 |
5.9 |
A |
Route 28 |
SB |
TR |
174 |
288 |
5.4 |
A |
-1514 |
-1927 |
95.9 |
F |
Hallen Avenue |
EB |
L |
4 |
18 |
49.2 |
D |
4 |
19 |
52.7 |
D |
Hallen Avenue |
EB |
R |
0 |
40 |
20.9 |
C |
7 |
64 |
24.8 |
C |
Intersection |
All |
All |
-- |
-- |
64.1 |
E |
-- |
-- |
58.3 |
E |
Route 28 |
NB |
L |
2 |
17 |
5.1 |
A |
5 |
32 |
4.7 |
A |
Route 28 |
NB |
TR |
-1525 |
-2505 |
160.3 |
F |
238 |
-1198 |
15.7 |
B |
Route 28 |
SB |
L |
1 |
12 |
14.0 |
B |
1 |
7 |
5.5 |
A |
Route 28 |
SB |
TR |
144 |
740 |
13.2 |
B |
-1661 |
-2648 |
235.4 |
F |
Hillside Street |
EB |
LTR |
74 |
-238 |
122.1 |
F |
88 |
-273 |
109.1 |
F |
Driveway |
WB |
LTR |
3 |
18 |
50.8 |
D |
2 |
16 |
43.0 |
D |
Intersection |
All |
All |
-- |
-- |
114.4 |
F |
-- |
-- |
150.0 |
F |
Note: * Negative (-) sign = Volume exceeds capacity (queue may be longer)
** Negative (-) sign = 95 percentile volume exceed capacity, queue may be longer
EB = eastbound. L= left. LOS = level of service. LR = left and right. LT= left and through. LTR = left, through, and right. NB = northbound. R = right. SB = southbound. SE = southeast. T = through. TR = through and right. WB = westbound.
Source: Central Transportation Planning Staff.
Table 24
Performance of Randolph Avenue and Reedsdale Roundabout Concept
Street Name |
Approach |
Lane Group |
AM 50% Queue (ft.)* |
AM 95% Queue (ft.)** |
AM Delay (s) |
AM LOS |
PM 50% Queue (ft.)* |
PM 95% Queue (ft.)** |
PM Delay (s) |
PM LOS |
Route 28 |
NB |
LT |
-- |
250 |
23.3 |
C |
-- |
75 |
9.8 |
A |
Route 28 |
NB |
TR |
-- |
150 |
14.1 |
B |
-- |
50 |
7.9 |
A |
Route 28 |
SB |
LTR |
-- |
50 |
9.2 |
A |
-- |
300 |
47.3 |
E |
Route 28 |
SB |
R |
-- |
50 |
8.1 |
A |
-- |
325 |
45.3 |
E |
Reedsdale Road |
WB |
L |
-- |
75 |
24.9 |
C |
-- |
75 |
16.2 |
B |
Reedsdale Road |
WB |
TR |
-- |
200 |
45.7 |
E |
-- |
50 |
11.9 |
B |
Randolph Avenue |
SB |
LT |
-- |
50 |
17.9 |
C |
-- |
50 |
15.5 |
C |
Randolph Avenue |
SB |
TR |
-- |
50 |
15.5 |
C |
-- |
50 |
14.0 |
B |
Intersection |
All |
-- |
-- |
-- |
19.6 |
C |
-- |
-- |
25.0 |
D |
L
OS = level of service.
EB = eastbound. L= left. LOS = level of service. LR = left and right. LT= left and through. LTR = left, through, and right. NB = northbound. R = right. SB = southbound. WB = westbound.
Source: Central Transportation Planning Staff.
Figure 24
Roundabout Retrofit at Randolph Avenue and Reedsdale Road Intersection

These two intersections and the road segment between them experience high numbers of crashes, including two fatalities and several injuries as shown in Figures 12 through 14. Many of the crashes are left-turn-related angle and rear-end crashes and lane-changing-related sideswipes crashes.
MPO staff recommends signalizing these intersections to reduce left-turn-related crashes. The LOS analysis indicates that installing a traffic signal at Hallen Avenue and adding a northbound left-turn lane would operate well. Due to the low traffic volumes collected during the pandemic, staff recommends that MassDOT collect additional traffic volumes to perform traffic signal warrant analysis for these intersections.
Installing additional traffic signals at these intersections would also help to calm traffic, reduce high speeds of vehicles, and add additional crossing opportunities for at these intersections for pedestrians and bicycles.
MPO staff evaluated what the future PLOS of Route 28 would be if the recommendations from this study were implemented. Appendix F contains results of the PLOS scorecard analyses. Based on the assessment, Route 28 was rated good in terms of meeting the MPO’s goals for capacity management and mobility and economic vitality because of the prioritization of safe accommodations for people who walk and for improving the connectivity of the pedestrian network.
MPO staff evaluated what the future BLOS of Route 28 would be in Milton if the recommendations from this study were implemented. Appendix F contains results of the BLOS scorecard analyses. Based on the assessment, Route 28 was rated excellent in terms of meeting the MPO’s goals for capacity management and mobility and economic vitality because of the prioritization of safe accommodations for people who bike, and for improving the connectivity of the bicycle network.
Each of the proposed improvements was chosen to target specific safety and operational deficiencies present in the study area.
A summary of all the improvement concepts showing their advantages and disadvantages are presented in Figure 25. These concepts include safety, congestion, operations, multimodal features (pedestrian and bicycle infrastructure), and traffic calming.
Figure 25
Comparisons of Improvement Concepts
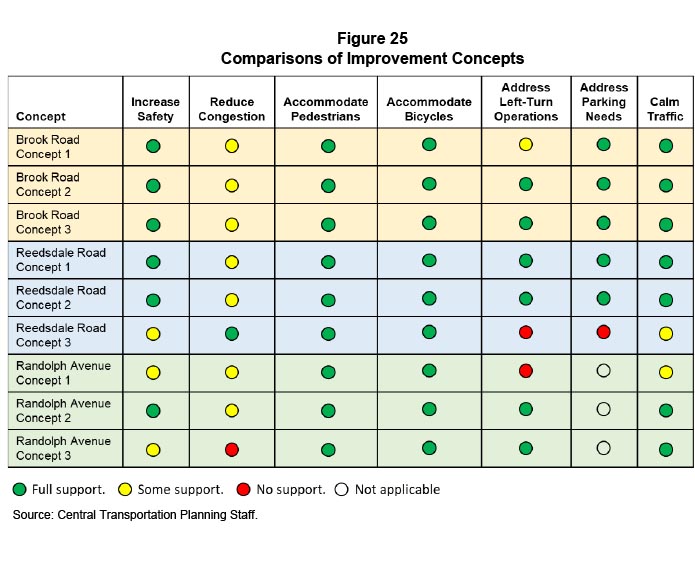
Source: Central Transportation Planning Staff.
Chapter 11—Conclusion and Next Steps
The concepts developed in this study provide MassDOT, the Town of Milton, and other stakeholders an opportunity to review conceptual options for addressing deficiencies in the corridor before committing design and engineering funds to a roadway improvement project. If implemented, the improvement concepts in this report would yield the following benefits:
Successful implementation of the improvements would require cooperation between the MassDOT Highway Division and the Town of Milton to ensure that sidewalks and multiuse paths are continuous and connected, and to ensure that MassDOT’s standards guide the design of roadway elements. In addition, it is important for stakeholders to evaluate the improvement concepts with all road users in mind. MassDOT has jurisdiction of Randolph Avenue and the Town of Milton has jurisdiction of Brook Road and Reedsdale Road, and each would be responsible for implementing renovations to the roadway in its jurisdiction.
Project development is the process that takes transportation improvements from planning concept to construction. This process will depend on cooperation between MassDOT, the Town of Milton, and the Boston Region MPO. This planning study provides the necessary information for the project proponents to initiate the project notification and review process. After completing these initial steps, the proponents can start preliminary design and engineering and begin working with the MPO to program funding for the project in the TIP. Appendix H contains an overview of the project development process.
1 An HSIP crash cluster is a location in which the number and severity of crashes—as measured on the “Equivalent Property Damage Only” (EPDO) index—ranks the location among the top five percent of crash clusters in the region. The EPDO method assigns weighted values to each crash based on whether the crash resulted in property damage (unweighted), injury (weighted by five), or a fatality (weighted by 10).
2 Boston Region Metropolitan Planning Organization, Destination 2040: The New Long-Range Transportation Plan of the Boston Region Metropolitan Planning Organization, endorsed by the Boston Region MPO on August 29, 2019.
3 Boston Region Metropolitan Planning Organization, Unified Planning Work Program, FFY 2020, endorsed by the Boston Region Metropolitan Planning Organization on July 18, 2019.
4 Safety Conditions: The location has a higher-than-average crash rate for its functional class; contains a crash cluster that makes it eligible for HSIP funding; contains a crash location on MassDOT Highway Division’s Top High Crash Locations Report; or has a significant number of pedestrian and bicycle crashes (two or more per mile).
5 Congested Conditions: The travel time index is at least 1.3. The travel time index is the ratio of the peak-period travel time to the free-flow travel time.
6 Multimodal Significance: The roadway carries one or more bus routes or is adjacent to a transit stop or station; the roadway supports bicycle or pedestrian activities or there is a project planned that will support these activities; there is a need to accommodate pedestrians and bicyclists and improve transit on the roadway; or there is a significant amount of truck traffic on the roadway serving regional commerce.
7 Regional Significance: The roadway is on the National Highway System; carries a significant portion of regional traffic (average daily traffic of 20,000 vehicles or more); lies within 0.5 miles of environmental-justice transportation analysis areas or zones; or is essential for the region’s economic, cultural, or recreational development.
8 Regional Equity: To ensure that, over time, all subregions in the MPO’s planning area receive support from the MPO in the form of UPWP planning studies, during each funding cycle, MPO staff select no more than one location per subregion to study and choose a location in a different subregion from the location studied in the preceding cycle.
9 Implementation Potential: The study location is proposed by the jurisdictional agency or agencies for the roadway; proposed or prioritized by a subregional group; or identified as a priority for improvement by other stakeholders.
10 Boston Region Metropolitan Planning Organization, Selection of FFY 2020 LRTP Priority Corridor Study Location, Technical Memorandum, November 7, 2019.
11 Yuanchang Xie and Chen (Julian) Chen, Calibration of Safety Performance Functions for Massachusetts Urban and Suburban Intersections. Report prepared for MassDOT Office of Transportation Planning, March 2016.
12 American Association of State Highway and Transportation Officials, Highway Safety Manual 2010, Washington, DC, December 2010.
13 Jeffrey Gooch, VHB, MassDOT Average Comprehensive Crash Costs, Technical Memorandum, dated January 1, 2018, to MassDOT.
14 For the purposes of this study, MPO staff used two values: $15,600 per property damage only crash and $260,800 per crash involving injury.
15 Transportation Research Board of the National Academies, Highway Capacity Manual 2010, Washington, DC, December 2010.
16 Trafficware Inc., Synchro Studio 9, Synchro plus SimTraffic, Build 914, Sugar Land, Texas.
17 Ryan Hicks and Casey-Marie Claude, Pedestrian Level-of-Service Memorandum, Technical Memorandum to the Boston Region Metropolitan Planning Organization, January 19, 2017.
18 US Department of Transportation Federal Highway Administration, Crash Modification Factors Clearinghouse, August 14, 2018, http://www.cmfclearinghouse.org/.
19 L. Chen, C. Chen, and R. Ewing. “The Relative Effectiveness of Pedestrian Safety Countermeasures at Urban Intersections—Lessons from a New York City Experience.” Presented at the 91st Annual Meeting of the Transportation Research Board, January 22–26, Washington, DC, 2012, http://www.cmfclearinghouse.org/study_detail.cfm?stid=280.
20 P. Alluri, A. Raihan, D. Saha, et al. “Statewide Analysis of Bicycle Crashes.” Florida Department of Transportation (May 2017).