Executive Summary
Chapter 1: 3C Transportation Planning and the Boston Region MPO
Chapter 2: About the Unified Planning Work Program
Chapter 3: Certification Requirements
Chapter 4: Boston Region MPO Planning Studies and Technical Analyses
Chapter 5: Agency and Other Client-Funded Transportation Planning Studies and Technical Analyses
Chapter 6: Resource Management and Support Activities
Chapter 7: Metropolitan Area Planning Council (MAPC) Activities
Chapter 8: Boston Region MPO Budget and Operating Summaries
Prepared by
The Central Transportation Planning Staff:
Staff to the Boston Region Metropolitan Planning Organization
Directed by the Boston Region Metropolitan Planning Organization,
which is composed of the
Massachusetts Department of Transportation
Metropolitan Area Planning Council
Massachusetts Bay Transportation Authority (MBTA)
MBTA Advisory Board
Massachusetts Port Authority
Regional Transportation Advisory Council
City of Beverly, North Shore Task Force
City of Boston
City of Everett, At-Large City
City of Framingham, MetroWest Regional Collaborative
City of Newton, At-Large City
City of Somerville, Inner Core Committee
City of Woburn, North Suburban Planning Council
Town of Acton, Minuteman Advisory Group on Interlocal Coordination
Town of Arlington, At-Large Town
Town of Brookline, At-Large Town
Town of Medway, SouthWest Advisory Planning Committee
Town of Norwood, Three Rivers Interlocal Council
Town of Rockland, South Shore Coalition
Federal Highway Administration (nonvoting)
Federal Transit Administration (nonvoting)
Meeting locations are accessible to people with disabilities and are near public transportation. Upon request (preferably two weeks in advance of the meeting), every effort will be made to provide accommodations such as assistive listening devices, materials in accessible formats and in languages other than English, and interpreters in American Sign Language and other languages. Please contact the MPO staff at 857.702.3700 (voice), 617.570.9193 (TTY), 617.570.9192 (fax), or eharvey@ctps.org. The Boston Region Metropolitan Planning Organization (MPO) operates its programs, services, and activities in compliance with federal nondiscrimination laws including Title VI of the Civil Rights Act of 1964 (Title VI), the Civil Rights Restoration Act of 1987, and related statutes and regulations. Title VI prohibits discrimination in federally assisted programs and requires that no person in the United States of America shall, on the grounds of race, color, or national origin (including limited English proficiency), be excluded from participation in, denied the benefits of, or be otherwise subjected to discrimination under any program or activity that receives federal assistance. Related federal nondiscrimination laws administered by the Federal Highway Administration, Federal Transit Administration, or both, prohibit discrimination on the basis of age, sex, and disability. The Boston Region MPO considers these protected populations in its Title VI Programs, consistent with federal interpretation and administration. In addition, the Boston Region MPO provides meaningful access to its programs, services, and activities to individuals with limited English proficiency, in compliance with U.S. Department of Transportation policy and guidance on federal Executive Order 13166. The Boston Region MPO also complies with the Massachusetts Public Accommodation Law, M.G.L. c 272 sections 92a, 98, 98a, which prohibits making any distinction, discrimination, or restriction in admission to, or treatment in a place of public accommodation based on race, color, religious creed, national origin, sex, sexual orientation, disability, or ancestry. Likewise, the Boston Region MPO complies with the Governor's Executive Order 526, section 4, which requires that all programs, activities, and services provided, performed, licensed, chartered, funded, regulated, or contracted for by the state shall be conducted without unlawful discrimination based on race, color, age, gender, ethnicity, sexual orientation, gender identity or expression, religion, creed, ancestry, national origin, disability, veteran's status (including Vietnam-era veterans), or background. A complaint form and additional information can be obtained by contacting the MPO or at http://www.bostonmpo.org/mpo_non_discrimination. To request this information in a different language or in an accessible format, please contact Title VI Specialist By telephone: For more information, including numbers for Spanish speakers, visit https://www.mass.gov/massrelay
|
By mail:
Boston Region MPO
Certification Activities Group, Central Transportation Planning Staff
10 Park Plaza, Suite 2150
Boston, MA 02116
By telephone:
857.702.3702 (voice)
For people with hearing or speaking difficulties, connect through the state MassRelay service:
Relay Using TTY or Hearing Carry-over: 800.439.2370
Relay Using Voice Carry-over: 866.887.6619
Relay Using Text to Speech: 866.645.9870
For more information, including numbers for Spanish speakers,
visit https://www.mass.gov/massrelay
By fax:
617.570.9192
By email:
mgenova@ctps.org
This document was funded in part through grants from the Federal Highway Administration and Federal Transit Administration of the U.S. Department of Transportation. Its contents do not necessarily reflect the official views or policies of the U.S. Department of Transportation.
[Certification Statement]
These pages will list the eleven requirements of the transportation planning process to be conducted by Metropolitan Planning Organizations (MPOs), and certify that the Boston Region MPO complies with these requirements. The certification of the Transportation Planning Process will be signed by the chair of the Boston Rsolution Actegion MPO after the final endorsement of the FFYs 2022–26 TIP.]
[Global Warming Solution Act]These pages will list the eleven requirements of State Regulation 310 CMR 60.05: Global Warming Solutions Act to be conducted by Metropolitan Planning Organizations (MPOs), and certifies that the Boston Region MPO complies with these requirements. The certification of State Regulation 310 CMR 60.05: Global Warming Solutions Act will be signed by the chair of the Boston Region MPO after the final endorsement of the FFYs 2022–26 TIP.
| Abbreviation |
Term |
|---|---|
3C |
continuous, comprehensive, cooperative [metropolitan transportation planning process] |
|
|
AADT |
average annual daily traffic |
ACS |
American Community Survey [US Census Bureau data] |
ADA |
Americans with Disabilities Act of 1990 |
AFC |
automated fare collection |
BRT |
bus rapid transit |
CA/T |
Central Artery/Tunnel [project also known as “the Big Dig”] |
CAA |
Clean Air Act |
CAAA |
Clean Air Act Amendments |
CATA |
Cape Ann Transportation Authority |
CECP |
Massachusetts Clean Energy and Climate Plan |
CFR |
Code of Federal Regulations |
CIP |
Capital Investment Plan [MassDOT] |
CMAQ |
Congestion Mitigation and Air Quality [federal funding program] |
CMR |
Code of Massachusetts Regulations |
CMP |
Congestion Management Process |
CNG |
compressed natural gas |
CO |
carbon monoxide |
CO2 |
carbon dioxide |
CTPS |
Central Transportation Planning Staff |
CY |
calendar year |
DCR |
Department of Conservation and Recreation |
DEP |
Department of Environmental Protection [Massachusetts] |
DOT |
department of transportation |
EDTTT |
excessive delay threshold travel time |
EJ |
environmental justice |
EO |
executive order |
EOEEA |
Massachusetts Executive Office of Energy and Environmental Affairs |
EOHED |
Massachusetts Executive Office of Housing and Economic Development |
EPA |
Environmental Protection Agency [federal] |
EPDO |
equivalent property damage only [a traffic-related index] |
FARS |
Fatality Analysis and Reporting System [FHWA] |
FAST Act |
Fixing America’s Surface Transportation Act |
FDR |
functional design report |
FFY |
federal fiscal year |
FHWA |
Federal Highway Administration |
FMCB |
MBTA Fiscal and Management Control Board |
FR |
Federal Register |
FTA |
Federal Transit Administration |
GANS |
grant anticipation notes [municipal bond financing] |
GHG |
greenhouse gas |
GWSA |
Global Warming Solutions Act of 2008 [Massachusetts] |
HOV |
high-occupancy vehicle |
HSIP |
Highway Safety Improvement Program [federal funding program] |
ICC |
Inner Core Committee [MAPC municipal subregion] |
IRI |
International Roughness Index |
ITS |
intelligent transportation systems |
LED |
light-emitting diode |
LEP |
limited English proficiency |
LOTTR |
level of travel time ratio |
LRTP |
Long-Range Transportation Plan [MPO certification document] |
MAGIC |
Minuteman Advisory Group on Interlocal Coordination [MAPC municipal subregion] |
MAP-21 |
Moving Ahead for Progress in the 21st Century Act |
MAPC |
Metropolitan Area Planning Council |
MARPA |
Massachusetts Association of Regional Planning Agencies |
MassDOT |
Massachusetts Department of Transportation |
Massport |
Massachusetts Port Authority |
MBTA |
Massachusetts Bay Transportation Authority |
MOVES |
Motor Vehicle Emissions Simulator [EPA air quality model] |
MPO |
metropolitan planning organization [Boston Region MPO] |
MOU |
memorandum of understanding |
MWRC |
MetroWest Regional Collaborative [MAPC municipal subregion] |
MWRTA |
MetroWest Regional Transit Authority |
NAAQS |
National Ambient Air Quality Standards |
NBI |
National Bridge Inventory |
NH DOT |
New Hampshire Department of Transportation |
NHFP |
National Highway Freight Program |
NHPP |
National Highway Performance Program |
NHS |
National Highway System |
NHTSA |
National Highway Traffic Safety Administration |
NMCOG |
Northern Middlesex Council of Governments |
NOx |
nitrogen oxides |
NPMRDS |
National Performance Measure Research Data Set [FHWA] |
NSPC |
North Suburban Planning Council [MAPC municipal subregion] |
NSTF |
North Shore Task Force [MAPC municipal subregion] |
NTD |
National Transit Database |
O&M |
operations and management |
OTP |
MassDOT Office of Transportation Planning |
PBPP |
performance-based planning and programming |
PHED |
peak hours of excessive delay |
PL |
metropolitan planning funds [FHWA] or public law funds |
PM |
particulate matter |
PMT |
Program for Mass Transportation [MBTA] |
ppm |
parts per million |
PRC |
Project Review Committee [MassDOT] |
PSAC |
Project Selection Advisory Council [MassDOT] |
PSI |
Pavement Serviceability Index |
PTASP |
Public Transportation Agency Safety Plan |
RRIF |
Railroad Rehabilitation and Improvement Financing |
RTA |
regional transit authority |
RTAC |
Regional Transportation Advisory Council [of the Boston Region MPO] |
SAFETEA-LU |
Safe, Accountable, Flexible, Efficient Transportation Equity Act: A Legacy for Users |
SEIR |
Single Environmental Impact Report [MEPA] |
SFY |
state fiscal year |
SHSP |
Strategic Highway Safety Plan |
SIP |
State Implementation Plan |
SMS |
safety management systems |
SOV |
single-occupant vehicle |
SPR |
Statewide Planning and Research |
SRTS |
Safe Routes to School [federal program] |
SSC |
South Shore Coalition [MAPC municipal subregion] |
STBGP |
Surface Transportation Block Grant Program [federal funding program; replaced STP] |
STIP |
State Transportation Improvement Program |
STP |
Surface Transportation Program [federal funding program; replaced by STBGP] |
SWAP |
South West Advisory Planning Committee [MAPC municipal subregion] |
TAM |
Transit Asset Management Plan |
TAMP |
Transportation Asset Management Plan |
TAP |
Transportation Alternatives Program [federal funding program] |
TCM |
transportation control measure |
TE |
transportation equity |
TERM |
Transit Economic Requirements Model [FTA] |
TIFIA |
Transportation Infrastructure and Innovation Act |
TIP |
Transportation Improvement Program [MPO certification document] |
TMA |
transportation management association |
TRIC |
Three Rivers Interlocal Council [MAPC municipal subregion] |
TTI |
travel time index |
TTTR |
Truck Travel Time Reliability Index |
ULB |
useful life benchmark |
UPWP |
Unified Planning Work Program [MPO certification document] |
USC |
United States Code |
USDOT |
United States Department of Transportation [oversees FHWA and FTA] |
UZA |
urbanized area |
VPI |
virtual public involvement |
VMT |
vehicle-miles traveled |
VOCs |
volatile organic compounds [pollutants] |
VRM |
vehicle revenue-miles |
The Boston Region Metropolitan Planning Organization’s (MPO) five-year capital investment plan, the Federal Fiscal Years (FFYs) 2022–26 Transportation Improvement Program (TIP), is the near-term investment program for the region’s transportation system. Guided by the Boston Region MPO’s vision, goals, and objectives, the TIP prioritizes investments that preserve the current transportation system in a state of good repair, provide safe transportation for all modes, enhance livability, promote equity and sustainability, and improve mobility throughout the region. These investments fund arterial roadway and intersection improvements, maintenance and expansion of the public transit system, bicycle path construction, infrastructure improvements for pedestrians, and major highway reconstruction.
The Boston Region MPO is guided by a 22-member board with representatives of state agencies, regional organizations, and municipalities. Its jurisdiction extends roughly from Boston north to Ipswich, south to Marshfield, and west to municipalities along Interstate 495. Each year, the MPO conducts a process to decide how to spend federal transportation funds for capital projects. The Central Transportation Planning Staff (CTPS), which is the staff to the MPO, manages the TIP development process.
MPO staff coordinates the evaluation of project funding requests, proposes programming of current and new projects based on anticipated funding levels, supports the MPO board in developing a draft TIP document, and facilitates a public review of the draft before the MPO board endorses the final document.
The complete TIP program is available in Chapter 3 of this document and online at bostonmpo.org/tip. The TIP tables provide details of how funding is allocated to each programmed project and capital investment program. These tables are organized by federal fiscal year, and are grouped by highway and transit programs.
The Highway Program of the TIP funds the priority transportation projects advanced by the Massachusetts Department of Transportation (MassDOT) and the cities and towns within the Boston region. The program is devoted primarily to preserving and modernizing the existing roadway network by reconstructing arterial roadways, resurfacing highways, and replacing bridges.
In Massachusetts, Federal-Aid Highway Program funding is apportioned by MassDOT, which allocates funding to Grant Anticipation Notes (GANs) payments, various statewide programs, and Regional Targets for the state’s MPOs. In the FFYs 2022–26 TIP, roadway, bridge, and bicycle and pedestrian programs account for more than $1.2 billion in funding to the Boston region. The Regional Target funding provided to the MPOs may be programmed for projects at the discretion of each MPO, whereas MassDOT has discretion to propose its recommended projects for statewide programs, such as those related to bridge repairs and interstate highway maintenance.
The Transit Program of the TIP provides funding for projects and programs that address the capital needs prioritized by the three transit authorities in the region: the Massachusetts Bay Transportation Authority (MBTA), the Cape Ann Transportation Authority (CATA), and the MetroWest Regional Transit Authority (MWRTA). The Transit Program is predominantly dedicated to achieving and maintaining a state of good repair for all assets throughout the transit system.
The FFYs 2022–26 TIP includes nearly $3.6 billion in transit investments by the transit authorities that will support state of good repair, modernize transit systems, and increase access to transit. The Green Line Extension project is a major project programmed in this TIP that will expand transit service. Additionally, beginning in FFY 2025, the MPO will allocate five percent of its annual Regional Target funds to its new Transit Modernization investment program. This program aims to build on the investments made through the Transit Program by using a portion of Highway Program funding to fulfill unmet transit project needs in the region.
During FFYs 2022–26, the Boston Region MPO plans to fund 45 projects with its Regional Target funding. In total, nine new projects were added to the MPO’s Regional Target program during this TIP cycle, all of which were funded through the MPO’s Community Connections Program. Two additional fiscal years of funding were also added for one project already programmed by the MPO, the Newton Microtransit Service project. Details on these projects are available in table ES-1.
Table ES-1
New Regional Target Projects Funded in the FFYs 2022–26 TIP
Project Name |
Municipality (Proponent) |
FFYs of Funding |
Regional Target Dollars Programmed |
Royall Street Shuttle |
Canton |
2022-24 |
$534,820 |
Newton Microtransit Service |
Newton |
2023-24* |
$427,000 |
BlueBikes Expansion |
Arlington, Newton, and Watertown |
2022 |
$340,000 |
Alewife Wayfinding Improvements |
Cambridge (128 Business Council) |
2022 |
$292,280 |
Systemwide Bike Racks |
MBTA |
2022 |
$275,740 |
BlueBikes Expansion |
Malden and Medford |
2022 |
$236,830 |
Main Street Transit Signal Priority |
Everett and Malden (MBTA) |
2022 |
$225,000 |
Bicycle Infrastructure |
Wellesley |
2022 |
$85,054 |
Transit App Education Program |
Brookline |
2022 |
$43,620 |
Acton Parking Management System |
Acton |
2022 |
$20,000 |
Total |
N/A |
N/A |
$2,480,344 |
Note: All projects in this table are funded through the MPO’s Community Connections Program.
*The first FFY of funding for the Newton Microtransit Service project is in FFY 2021, in which $300,000 was allocated to the project.
Source: Boston Region MPO.
Other investment decisions made this year include the allocation of more than $10 million in new funding in FFY 2026 to the Reconstruction of Rutherford Avenue in Boston. FFY 2026 is the fourth year of a five-year funding commitment made by the MPO to this project, which is expected to be completed in FFY 2027. The MPO also set aside continued funding for its Community Connections Program (in FFYs 2023–27) and allocated a second year of funding to its Transit Modernization Program in FFY 2026 (in addition to the funds already reserved in FFY 2025). The funding set aside through both of these programs will be allocated to specific projects during future TIP programming cycles.
During the development of the FFYs 2022–26 TIP, the MPO was very limited in its financial capacity to fund new projects. In addition to the inherently constrained nature of transportation infrastructure funding, the need for which greatly exceeds available resources in any given year, significant cost increases for many projects already programmed in FFYs 2021–25 consumed funding for prospective new projects in FFY 2026. Though this challenge inevitably arises to some extent during every TIP cycle, both this year and last year’s FFYs 2021–25 TIP cycle saw especially severe levels of cost increases. This dynamic drove decision making during this fiscal year and led to no new projects being selected for programming in the FFYs 2022–26 TIP except the $2.5 million in Community Connections projects listed above in Table ES-1.
The MPO’s long-time practice has been to fully fund cost increases for projects already programmed in the TIP. This practice provides certainty for project proponents that the investments they make in project design and permitting will lead to capital funding to support the completion of their project. Given the severity of project cost increases in sequential TIP cycles, however, the MPO has formed a subcommittee of board members to examine the issue further and assess whether changes to this policy—or any of the MPO’s other programming policies outlined in this TIP—are warranted. This subcommittee intends to conduct this work during the summer of 2021, with the intent of providing policy change recommendations to the MPO board for adoption prior to the beginning of the FFYs 2023–27 TIP cycle in the fall of 2021.
Figure ES-1 shows how the Regional Target funding for FFYs 2022–26 is distributed across the MPO’s investment programs. As the chart shows, the Boston Region MPO’s Regional Target Program is devoted primarily to enhancing mobility and safety for all travel modes through significant investments in Complete Streets projects. A large portion of the MPO’s funding also supports the modernization of key regional roadways and expansion of transit infrastructure through investments in Major Infrastructure projects. The MPO also elected to leave approximately $20.5 million unprogrammed, preferring that the use of these funds be determined after the conclusion of the policy dialogue discussed above.
Figure ES-1
FFYs 2022–26 TIP Regional Target Funding by MPO Investment Program
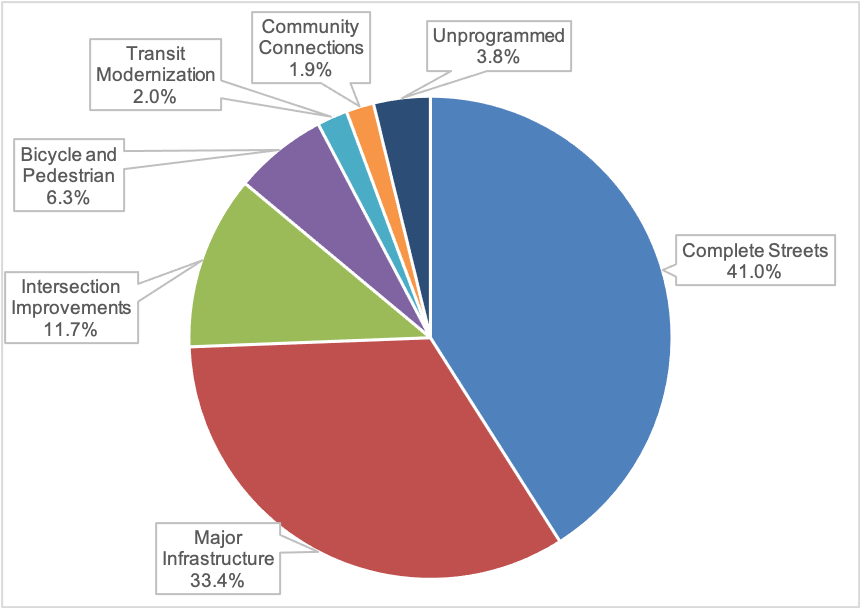
Source: Boston Region MPO.
In addition to the distribution of funding across the MPO’s investment programs listed above, Table ES-2 further details the number of projects and the allocation of funds across each program in the FFYs 2022–26 TIP. As noted in Figure ES-1, the MPO has programmed more than 96 percent of its available funding over five years. More details about every project funded through the MPO’s Regional Target program are available in Chapter 3.
Table ES-2
FFYs 2022–26 Boston Region MPO Regional Target Investment Summary
MPO Investment Program |
Number of Projects |
Regional Target Dollars Programmed |
Bicycle Network and Pedestrian Connections |
4 |
$33,704,014 |
Community Connections (allocated to projects) |
10 |
$2,480,344 |
Community Connections (not yet allocated to projects) |
N/A |
$7,522,281 |
Complete Streets |
19 |
$220,955,609 |
Intersection Improvements |
8 |
$62,805,302 |
Major Infrastructure—Flex to Transit1 |
1 |
$27,116,883 |
Major Infrastructure—Roadway2 |
3 |
$152,977,631 |
Transit Modernization (not yet allocated to projects) |
N/A |
$11,000,000 |
Unprogrammed |
N/A |
$20,496,035 |
Total |
45 |
$539,058,099 |
Note: Funding amounts in this table include both federal and non-federal funds, including matching funds.
1 The MPO will flex federal highway improvement dollars to support the Green Line Extension.
2 In FFY 2022, the MPO will contribute $11,046,213 to Project 606476—Summer Tunnel Improvements—and MassDOT will contribute other funds. This project is included in the total number of projects in this category.
Source: Boston Region MPO.
When making decisions about which projects to fund, the MPO considers not only the relative distribution of funds across projects and investment programs, but also how the allocation of funds to each investment program compares to the funding goals outlined in the MPO’s Long-Range Transportation Plan (LRTP), Destination 2040. The investment program sizes set forth in the LRTP reflect the types of projects the MPO seeks to fund to help it achieve its goals and objectives for the region, from enhancing safety for all users to promoting mobility and accessibility across the region. More information on the MPO’s goals and objectives are available in Chapter 1, and a comparison between LRTP investment program sizes and program funding levels in the FFYs 2022–26 TIP is shown in Figure ES-2.
Figure ES-2
FFYs 2022–26 TIP: Regional Target Funding Levels Relative to LRTP Investment Program Goals
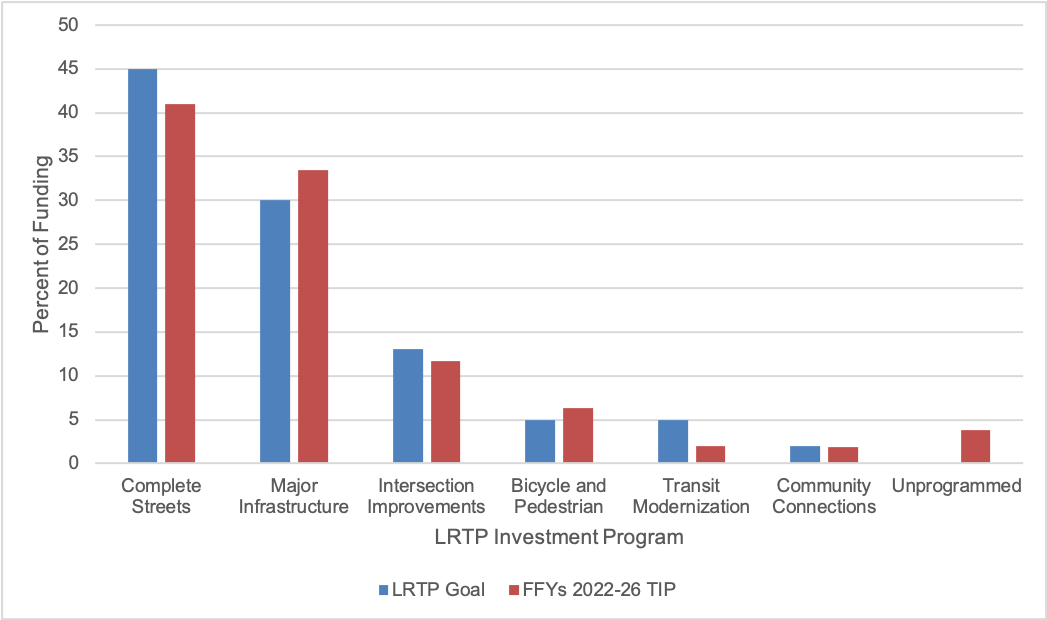
LRTP = Long-Range Transportation Plan. TIP = Transportation Improvement Program.
Source: Boston Region MPO.
The investments made in the FFYs 2022–26 TIP will be implemented in 37 cities and towns throughout the Boston region, ranging from dense inner core communities to developing suburbs further from the urban center. Figure ES-3 illustrates the distribution of Regional Target funding among the eight subregions within the Boston Region MPO’s jurisdiction, as defined by the Metropolitan Area Planning Council (MAPC). This figure also includes information about how the distribution of funds compares to key metrics for measuring the need for funding by subregion, including the percent of regional population, employment, and Federal-Aid roadway miles within each subregion.
Figure ES-3
FFYs 2022-26 TIP: Regional Target Funding Levels Relative to Key Indicators
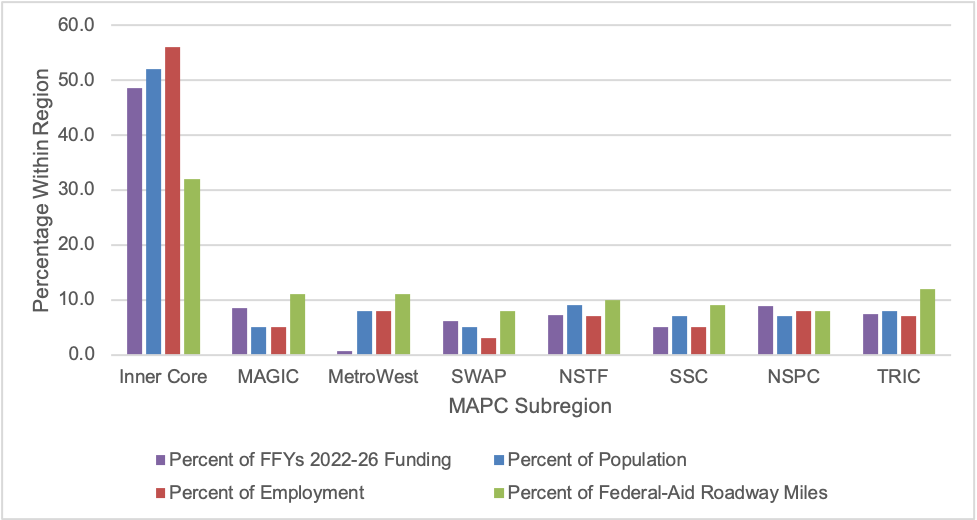
Note: Unprogrammed funds and funds held for the MPO’s Transit Modernization and Community Connections Programs are not included in this figure. Funds allocated to the MBTA’s Systemwide Bicycle Rack project ($275,740 in FFY 2022) are also not included, as these funds will be distributed regionwide.
Source: Boston Region MPO.
Additional information on the geographic distribution of Regional Target funding across the region, including a breakdown of historical funding by municipality, is included in Appendix D.
The TIP Highway Program was developed with the assumption that federal funding for the state would range between $668 million and $721 million annually over the next five years. These amounts include the funds that would be set aside initially by MassDOT as payments for the Accelerated Bridge Program and exclude required matching funds.
The process of deciding how to use this federal funding in the Boston region follows several steps. First, MassDOT reserves funding for GANs debt service payments for the Accelerated Bridge Program; annual GANs payments range between $86 million and $134 million annually over the five years of this TIP.
The remaining Federal-Aid Highway Program funds are budgeted to support state and regional (i.e., MPO) priorities. In this planning cycle, $726 million to $750 million annually was available for programming statewide, including both federal dollars and the local match. MassDOT customarily provides the local match (which can also be provided by other entities); thus, projects are typically funded with 80 percent federal dollars and 20 percent state dollars, depending on the funding program.
Next, MassDOT allocates funding across the following funding categories:
Finally, once these needs have been satisfied, MassDOT allocates the remaining funding among the state’s 13 MPOs for programming. This discretionary funding for MPOs is sub-allocated by formula to determine the Regional Target amounts. The Boston Region MPO receives the largest portion of MPO funding in the state, with approximately 43 percent of Massachusetts’ Regional Target funds allocated to the region. MassDOT develops these targets in consultation with the Massachusetts Association of Regional Planning Agencies (MARPA). This TIP was programmed with the assumption that the Boston Region MPO will have between $105 million and $110 million annually for Regional Target amounts, which consist of federal funding and state funding for the local match.
Each MPO may decide how to prioritize its Regional Target funding. Given that the Regional Target funding is a subset of the Highway Program, the MPO typically programs the majority of funding for roadway projects; however, the MPO has flexed portions of its highway funding to the Transit Program for transit expansion projects and through its Transit Modernization and Community Connections Programs. The TIP Highway Program details the projects that will receive Regional Target funding from the Boston Region MPO and statewide infrastructure projects within the Boston region. Details on these investments are outlined in Chapter 3.
The Federal Transit Administration (FTA) allocates the funds programmed in the TIP Transit Program according to formula. The three regional transit authorities in the Boston Region MPO area that are recipients of these funds are the MBTA, CATA, and MWRTA. The MBTA, with its extensive transit program and infrastructure, is the recipient of the preponderance of the region’s federal transit funds.
Under the federal transportation legislation, Fixing America’s Surface Transportation (FAST) Act, funding is allocated by the following categories:
When determining which projects to fund through the Regional Target funding process, MPO members collaborate with municipalities, state agencies, members of the public, advocacy groups, and other stakeholders. The MPO board uses evaluation criteria in its project selection process to help identify and prioritize projects that advance progress on the MPO’s six goal areas:
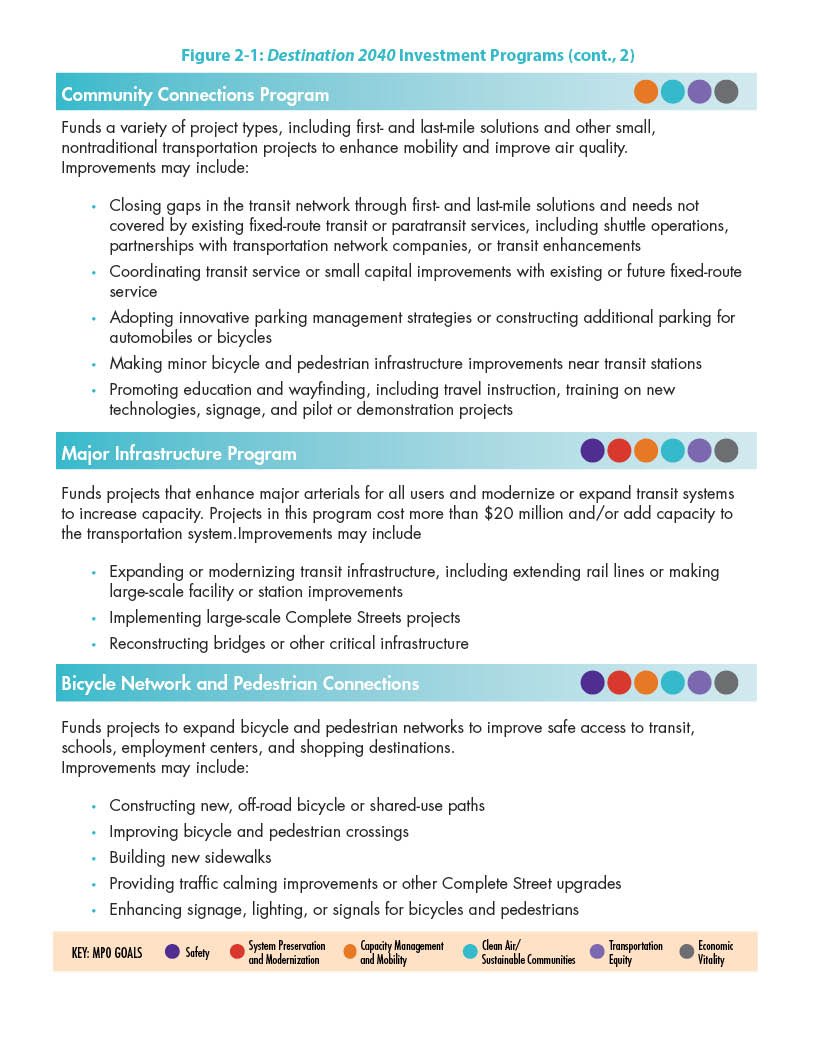
Additionally, the MPO has established investment programs, which are designed to direct Regional Target funding towards MPO priority areas over the next 20 years, to help meet these goals. The investment programs are as follows:
Projects that the MPO selects to receive Regional Target funding through the TIP development process are included in one of the six investment programs listed above. More information on the MPO’s investment programs is available in Chapter 2.
In recent years, the MPO has been incorporating performance-based planning and programming (PBPP) practices into its TIP development and other processes. These practices are designed to help direct MPO funds towards achieving specific outcomes for the transportation system. The MPO’s goals and investment programs are key components of its PBPP framework. In FFY 2018, the MPO began to set targets for specific performance measures. Over time, the MPO will more closely link its performance targets, investment decisions, and monitoring and evaluation activities. More information on PBPP is available in Chapter 4 as well as in Appendix A (Table A-2).
The outreach process begins early in the federal fiscal year, when cities and towns designate TIP contacts and begin developing a list of priority projects to be considered for federal funding, and the MPO staff asks the staffs of cities and towns in the region to identify their priority projects. MPO staff compiles the project funding requests into a Universe of Projects, a list of all Bicycle Network and Pedestrian Connections, Complete Streets, Intersection Improvements, and Major Infrastructure projects identified as potential candidates to receive funding through the TIP. Projects seeking funding through the MPO’s Community Connections Program are not included in the Universe, as all projects that apply for this program’s discrete application process are considered for funding. The Universe include projects at varying levels of readiness, from those with significant engineering and design work complete to those still early in the conceptual or planning stage. MPO staff collects data on each project in the Universe so that the projects may be evaluated.
MPO staff evaluates projects based on how well they address the MPO’s goals. For MPO staff to conduct a complete project evaluation, Bicycle Network and Pedestrian Connections, Complete Streets, Intersection Improvements, and Major Infrastructure projects must have a functional design report or the project plans must include the level of detail defined in a functional design report, a threshold typically reached when a project nears the 25 percent design stage. To complete an evaluation for projects under consideration through the MPO’s Community Connections Program, project proponents must submit a completed application to MPO staff.
The evaluation results for all projects are presented to the MPO board members for their consideration for programming in the TIP. Draft scores are shared directly with project proponents, at which point proponents are encouraged to review the scores and provide feedback so that MPO staff may make any warranted adjustments to arrive at accurate final results. Once proponents review their scores, final scoring results are posted on the MPO’s website where MPO members, municipal officials, and members of the public may review them.
An important step toward TIP programming takes place midway through the TIP development cycle at a meeting—referred to as TIP Readiness Day—that both MassDOT and MPO staff attend. At this meeting, MassDOT project managers provide updates about cost and schedule changes related to currently programmed projects. These cost and schedule changes must be taken into account as MPO staff helps the MPO board consider updates to the already programmed years of the TIP, as well as the addition of new projects in the outermost year of the TIP.
Using the evaluation results and information about project readiness (that is, the extent to which a project is fully designed and ready for construction), MPO staff prepares a recommendation or a series of programming scenarios for how to program the Regional Target funding in the TIP. Other considerations, such as whether a project was included in the LRTP, addresses an identified transportation need, or promotes distribution of transportation investments across the region, are also incorporated into these programming scenarios. The staff recommendation is always financially constrained—meaning, subject to available funding. There was approximately $539 million of Regional Target funding available to the Boston Region MPO for FFYs 2022–26. In this TIP cycle, the MPO board members discussed several scenarios for the Regional Target Program for highway projects and selected a preferred program in April 2021.
In addition to prioritizing the Regional Target funding, the MPO board reviews and endorses the statewide highway program that MassDOT recommends for programming. The board also reviews and endorses programming of funds for the MBTA’s, CATA’s, and MWRTA’s transit capital programs.
After selecting a preferred programming scenario, usually in late March, the MPO board votes to release the draft TIP for a 21-day public review period. The comment period typically begins in late April or early May, and during this time the MPO invites members of the public, municipal officials, and other stakeholders in the Boston region to review the proposed program and submit feedback. During the public review period, MPO staff hosts public meetings to discuss the draft TIP document and elicit additional comments.
After the public review period ends, the MPO board reviews all municipal and public comments and may change elements of the document or its programming. The MPO board then endorses the TIP and submits it to the Federal Highway Administration (FHWA) and the Federal Transit Administration (FTA) for approval. MassDOT incorporates the MPO-endorsed TIP into the State Transportation Improvement Program (STIP). The FHWA, FTA, and United States Environmental Protection Agency review the STIP for certification by September 30, the close of the federal fiscal year.
Even after the TIP has been finalized, administrative modifications, amendments, and adjustments often must be introduced because of changes in project schedule, project cost, funding sources, or available revenues. This may necessitate reprogramming a project in a different funding year or programming additional funds for a project.
Notices of administrative modifications and amendments are posted on the MPO’s website. If an amendment is necessary, the MPO notifies affected municipalities, stakeholders, and members of the public via email. The MPO typically holds a 21-day public review period before taking final action on an amendment. In extraordinary circumstances, the MPO may vote to shorten the public comment period to a minimum of 15 days. Administrative modifications and adjustments are minor and usually do not warrant a public review period.
Public input is an important aspect of the transportation planning process. Please visit bostonmpo.org for more information about the MPO, to view the entire TIP, and to submit your comments. You also may wish to sign up for email news updates and notices by visiting bostonmpo.org/subscribe and submitting your contact information. To request a copy of the TIP in accessible formats, please contact the MPO staff by any of the following means:
Mail: Boston Region MPO c/o CTPS Certification Activities Group, 10 Park Plaza, Suite 2150, Boston, MA 02116-3968
Telephone: 857.702.3702 (voice)
For people with hearing or speaking difficulties, connect through the state MassRelay service:
Relay Using TTY or Hearing Carry-over: 800.439.2370
Relay Using Voice Carry-over: 866.887.6619
Relay Using Text to Speech: 866.645.9870
Fax: 617.570.9192
Email: publicinfo@ctps.org
The Executive Summary of the FFYs 2022–26 TIP is also available as a translation:
Decisions about how to allocate transportation funds in a metropolitan area are guided by information and ideas gathered from a broad group of people, including elected officials, municipal planners and engineers, transportation advocates, and interested residents. Metropolitan planning organizations (MPOs) are the bodies responsible for providing a forum for this decision-making process. Each metropolitan area in the United States with a population of 50,000 or more, also known as an urbanized area, is required by federal legislation to establish an MPO, which decides how to spend federal transportation funds for capital projects and planning studies for the area.
The federal government regulates the funding, planning, and operation of the surface transportation system through the federal transportation program, which was enacted into law through Titles 23 and 49 of the United States Code. Section 134 of Title 23 of the Federal Aid Highway Act, as amended, and Section 5303 of Title 49 of the Federal Transit Act, as amended, require that urbanized areas conduct a transportation planning process, resulting in plans and programs consistent with the planning objectives of the metropolitan area, in order to be eligible for federal funds.
The most recent reauthorization of the surface transportation law is the Fixing America’s Surface Transportation (FAST) Act. The FAST Act sets policies related to metropolitan transportation planning. The law requires that all MPOs carry out a continuing, comprehensive, and cooperative (3C) transportation planning process.
The Boston Region MPO is responsible for carrying out the 3C planning process in the Boston region. The MPO has established the following objectives for the process:
More information about the federal, state, and regional guidance governing the transportation planning process, and about the regulatory framework in which the MPO operates can be found in Appendix E.
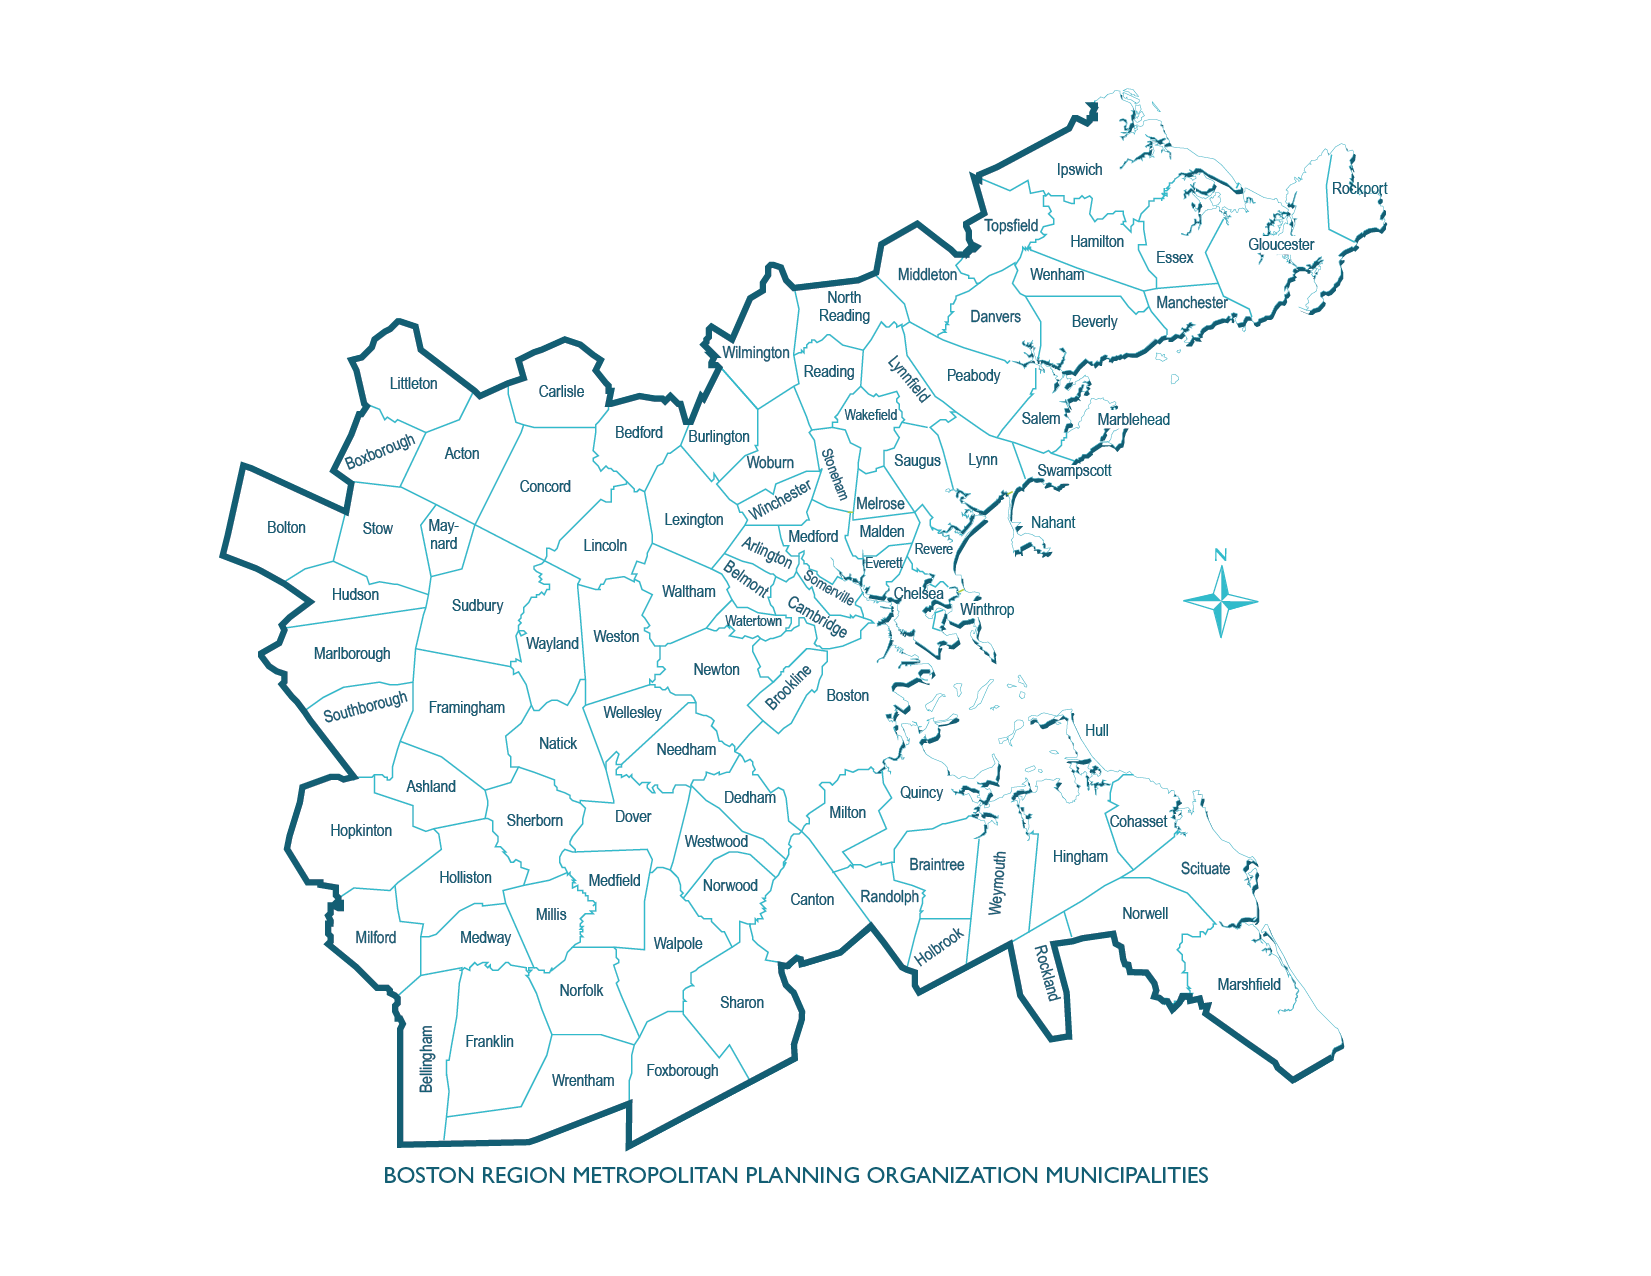
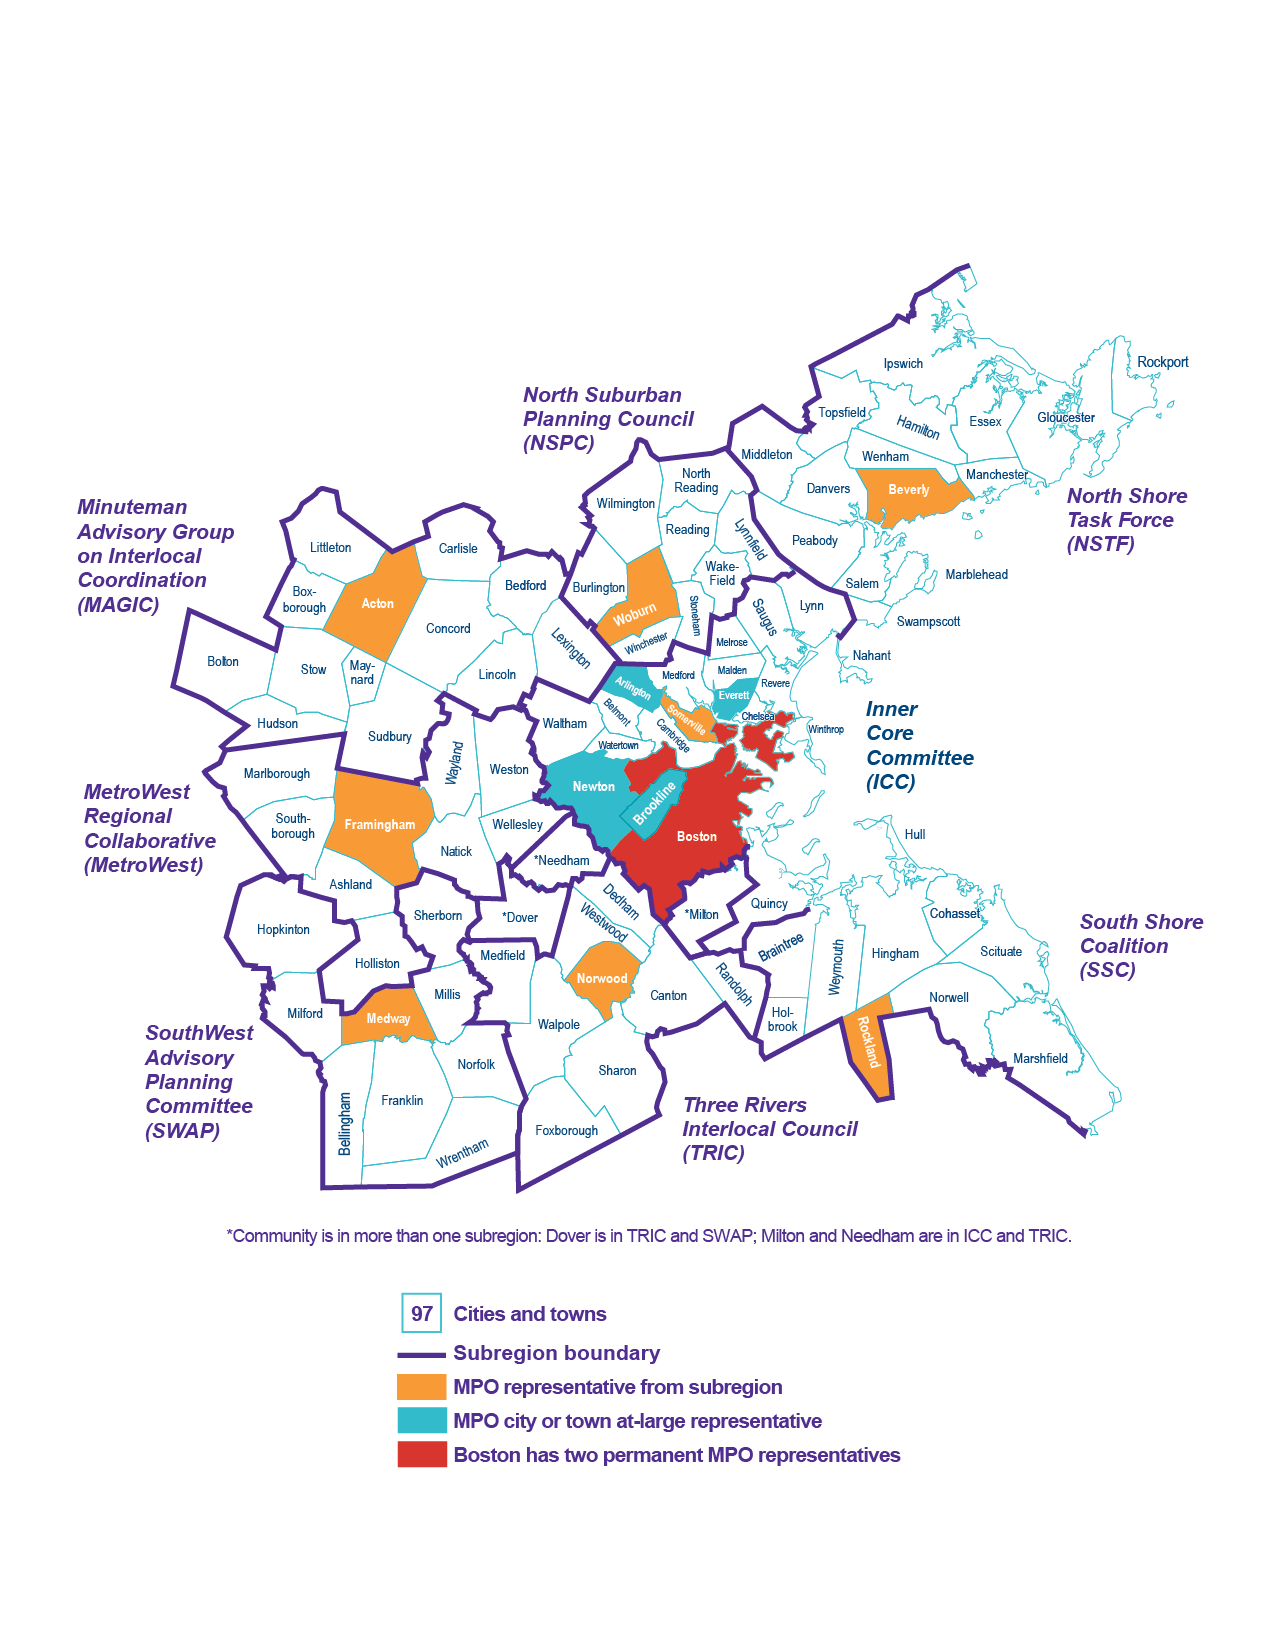
The Boston Region MPO’s planning area extends across 97 cities and towns from Boston north to Ipswich, south to Marshfield, and west to Interstate 495.
Figure 1-1 shows the map of the Boston Region MPO’s member municipalities.
Figure 1-1: Municipalities in the Boston Region
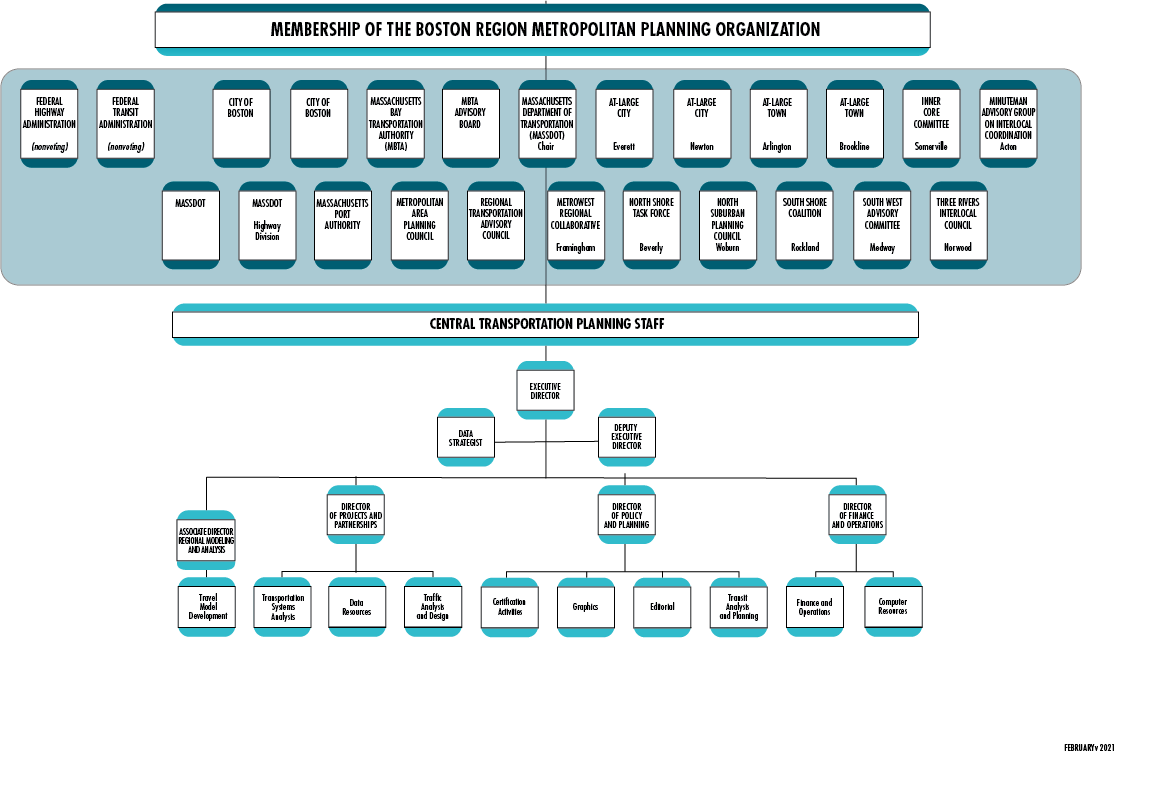
The MPO’s board comprises 22 voting members. Several state agencies, regional organizations, and the City of Boston are permanent voting members, while 12 municipalities are elected as voting members for three-year terms. Eight municipal members represent each of the eight subregions of the Boston region, and there are four at-large municipal seats. The Federal Highway Administration (FHWA) and Federal Transit Administration (FTA) participate on the MPO board as advisory (nonvoting) members. More details about the MPO’s permanent members can be found in Appendix F.
Figure 1-2 shows MPO membership and the organization of the Central Transportation Planning Staff, which serves as staff to the MPO.
Figure 1-2: Boston Region MPO Organizational Chart
The following paragraph is the MPO’s central vision statement, as adopted in Destination 2040, the MPO’s current Long-Range Transportation Plan (LRTP).
The Boston Region MPO envisions a modern, well-maintained transportation system that supports a sustainable, healthy, livable, and economically vibrant region. To achieve this vision, the transportation system must be safe and resilient; incorporate emerging technologies; and provide equitable access, excellent mobility, and varied transportation options.
This vision statement takes into consideration the significant public input received during the drafting of the Needs Assessment for Destination 2040. This statement also reflects the MPO’s desire to add emphasis to the maintenance and resilience of the transportation system while supporting the MPO’s six core goals: Safety, System Preservation and Modernization, Capacity Management and Mobility, Clean Air and Sustainable Communities, Transportation Equity, and Economic Vitality. More information on the MPO’s vision, goals, and objectives for the transportation system is available in Figure 1-3 below.
As part of its 3C process, the Boston Region MPO annually produces the Transportation Improvement Program (TIP) and the Unified Planning Work Program (UPWP). These documents, along with the quadrennial LRTP, are referred to as certification documents and are required for the federal government to certify the MPO’s planning process. This federal certification is a prerequisite for the MPO to receive federal transportation funds. In addition to the requirement to produce the LRTP, TIP, and UPWP, the MPO must establish and conduct an inclusive public participation process, and maintain transportation models and data resources to support air quality conformity determinations and long- and short-range planning work and initiatives.
The following is a summary of each of the certification documents.
The LRTP guides decision-making on investments that will be made in the Boston region’s transportation system over the next two decades. It defines an overarching vision of the future of transportation in the region, establishes goals and objectives that will lead to achieving that vision, and allocates projected revenue to transportation projects and programs consistent with established goals and objectives. The Boston Region MPO produces an LRTP every four years. Destination 2040, the current LRTP, was endorsed by the MPO board in August 2019 and went into effect on October 1, 2019. Figure 1-3 shows the MPO’s goals and objectives as adopted by the MPO board in Destination 2040.
The TIP is a multiyear, multimodal program of transportation improvements that is consistent with the LRTP. It describes and prioritizes transportation projects that are expected to be implemented during a five-year period. The types of transportation projects funded include major highway reconstruction and maintenance, arterial and intersection improvements, public transit expansion and maintenance, bicycle paths and facilities, improvements for pedestrians, and first- and last-mile connections to transit or other key destinations. The TIP contains a financial plan that shows the revenue sources, current or proposed, for each project. The TIP serves as the implementation arm of the MPO’s LRTP, and the Boston Region MPO updates the TIP annually. An MPO-endorsed TIP is incorporated into the State Transportation Improvement Program for submission to the FHWA, FTA, and United States Environmental Protection Agency for approval.
The UPWP contains information about transportation planning studies that will be conducted by MPO staff during the course of a federal fiscal year, which runs from October 1 through September 30. The UPWP describes all of the supportive planning activities undertaken by the MPO staff, including data resources management, preparation of the federally required certification documents, and ongoing regional transportation planning assistance. The UPWP, produced annually, is often a means to study transportation projects and alternatives before advancing to further design, construction, and possible future programming through the TIP. The studies and work products programmed for funding through the UPWP are integrally related to other planning initiatives conducted by the Boston Region MPO, the Massachusetts Department of Transportation, the Massachusetts Bay Transportation Authority, the Massachusetts Port Authority, the Metropolitan Area Planning Council, and municipalities in the Boston region.
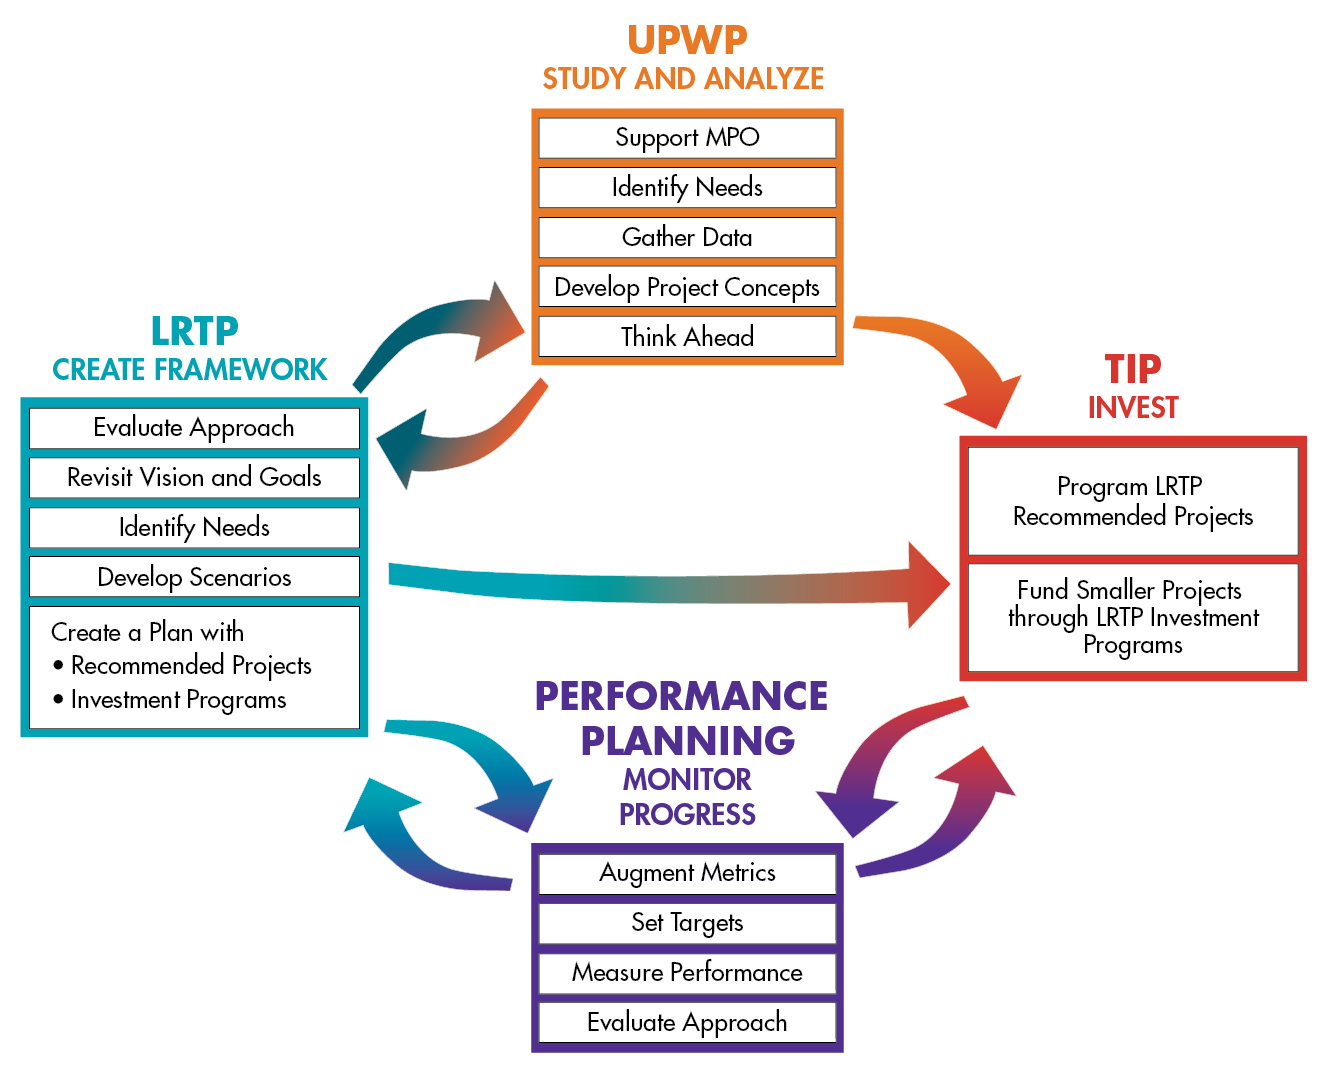
Figure 1-4 depicts the relationship between the three certification documents and the MPO’s performance-based planning and programming process, which is a means to monitor progress towards the MPO’s goals and to evaluate the MPO’s approach to achieving those goals.
Figure 1-3
LRTP Goals and Objectives
Central Vision Statement
The Boston Region Metropolitan Planning Organization envisions a modern, well-maintained transportation system that supports a sustainable, healthy, livable, and economically vibrant region. To achieve this vision, the transportation system must be safe and resilient; incorporate emerging technologies; and provide equitable access, excellent mobility, and varied transportation options.
| Goals | Objectives |
SAFETY: Transportation by all modes will be safe |
|
SYSTEM PRESERVATION: Maintain and modernize the transportation system and plan for its resiliency |
|
CAPACITY MANAGEMENT AND MOBILITY: Use existing facility capacity more efficiently and increase transportation options |
|
TRANSPORTATION EQUITY: Ensure that all people receive comparable benefits from, and are not disproportionately burdened by, MPO investments, regardless of race, color, national origin, age, income, ability, or sex |
|
CLEAN AIR/SUSTAINABLE COMMUNITIES: Create an environmentally friendly transportation system |
|
ECONOMIC VITALITY: Ensure our transportation network provides a strong foundation for economic vitality |
|
Figure 1-4: Relationship between the LRTP, TIP, UPWP, and Performance-Based Planning Process
One of the most important decisions a metropolitan planning organization (MPO) faces is deciding how to allocate limited funds for transportation projects and programs. Transportation improvements are part of the solution to many critical regional, state, national, and even global problems, such as traffic congestion, air pollution, fatalities and injuries on roadways, climate change, and environmental injustice. Because there is not nearly enough funding available for all of the necessary and worthy projects that would address these problems, an MPO’s investment choices must be guided by policies that help identify the most viable and effective solutions.
As described in Chapter 1, the Boston Region MPO develops a Long-Range Transportation Plan (LRTP) and a Transportation Improvement Program (TIP) to prioritize the expenditure of federal funds on transportation projects. The MPO staff manages the development of both plans. The annual development process for the TIP involves evaluating project funding requests from municipalities and state transportation agencies. The MPO staff then proposes a range of alternative scenarios for the programming of new and ongoing projects based on anticipated yearly funding levels, supports the MPO board by creating a draft TIP document, and facilitates a public involvement process that affords the public an opportunity to comment on proposed projects and review the draft TIP before the MPO board endorses the final document.
The first step in allocating federal transportation funds is the passage by the United States Congress of a multi-year act that establishes a maximum level of federal transportation funding per federal fiscal year (FFY).2-1 The establishment of this level of funding is referred to as an authorization.
After the authorization level has been established, the United States Department of Transportation annually allocates funding among the states according to various federal formulas. This allocation is referred to as an apportionment. The annual apportionment rarely represents the actual amount of federal funds that are ultimately committed to a state because of federally imposed limitations on spending in a given fiscal year, referred to as the obligation authority. In Massachusetts, TIPs are developed based on the estimated obligation authority.
The FFYs 2022–26 TIP’s Highway Program was developed with the assumption that funding from the Federal-Aid Highway Program for the Commonwealth of Massachusetts would range between approximately $668 million and $721 million annually over the next five years. These amounts include the funds that would be set aside initially by the Massachusetts Department of Transportation (MassDOT) as payments for the Accelerated Bridge Program and exclude required matching funds.
The process of deciding how to use this federal funding in the Boston region follows several steps. MassDOT first reserves funding for Grant Anticipation Notes (GANs) debt service payments for the Accelerated Bridge Program; annual GANs payments range between approximately $86 million and $134 million annually over the five years of this TIP.
The remaining Federal-Aid Highway Program funds are budgeted to support state and regional (i.e., MPO) priorities. In the FFYs 2022–26 TIP, there is a total of approximately $726 million to $750 million assumed to be annually available statewide for programming (these amounts include both federal dollars and the state-provided local match). MassDOT customarily provides the local match (which can also be provided by other entities); thus, the capital costs of projects are typically funded with 80 percent federal dollars and 20 percent state dollars, depending on the funding program. Costs for project design are borne by the proponent of the project.
The Regional Targets are discretionary funds for MPOs, sub-allocated by formula to each metropolitan planning region. The Boston Region MPO receives about 43 percent of the total funds available statewide for Regional Targets. MassDOT developed the target formula for determining this distribution of funds in consultation with the Massachusetts Association of Regional Planning Agencies (MARPA).
Each MPO in the state can decide how to prioritize its Regional Target funding. Given that the Regional Target funding originates from the Federal-Aid Highway Program, the Boston Region MPO board typically programs the majority of its target funding on roadway projects; however, the MPO board has flexed portions of its TIP Highway Program funding to the TIP’s Transit Program, most notably when the MPO board provided funding in support of the Green Line Extension transit expansion project. Additionally, the FFYs 2022–26 TIP includes an annual allotment of funding to the MPO’s Transit Modernization Program beginning in FFY 2025. This represents the MPO’s first formalized effort to flex Federal-Aid Highway funds to transit projects on a yearly basis, an affirmation of the region’s goals to support multimodal transportation options in a meaningful way. More information on the MPO’s investment strategy is discussed later in this chapter.
During the next five years, the Boston Region MPO’s total Regional Target funding will be approximately $539 million, an average of $107.8 million per year. To decide how to spend its Regional Target funding, the MPO engages its 97 cities and towns in an annual TIP development process.
The Federal-Aid Highway Program dollars discussed in this chapter come through several Federal Highway Administration (FHWA) funding programs, each of which has unique requirements. Table 2-1 lists these programs, which come from the Fixing America’s Surface Transportation (FAST) Act and fund projects in the FFYs 2022–26 TIP.
Table 2-1
Federal Highway Administration Programs Applicable to the FFYs 2022–26 Transportation Improvement Program
FAST Act Program |
Eligible Uses |
Congestion Mitigation and Air Quality Improvement (CMAQ) |
A wide range of projects to reduce congestion and improve air quality in nonattainment and maintenance areas for ozone, carbon monoxide, and particulate matter |
Highway Safety Improvement Program (HSIP) |
Implementation of infrastructure-related highway safety improvements |
National Highway Performance Program (NHPP) |
Improvements to interstate routes, major urban and rural arterials, connectors to major intermodal facilities, and the national defense network; replacement or rehabilitation of any public bridge; and resurfacing, restoring, and rehabilitating routes on the Interstate Highway System |
Surface Transportation Block Grant Program (STBGP) [formerly the Surface Transportation Program (STP)] |
A broad range of surface transportation capital needs, including roads; transit, sea, and airport access; and vanpool, bicycle, and pedestrian facilities |
Transportation Alternatives Program (TAP) |
A set-aside from the STBGP that funds the construction of infrastructure-related projects (for example, sidewalk, crossing, and on-road bicycle facility improvements) |
Metropolitan Planning |
Facilities that contribute to an intermodal transportation system, including intercity bus, pedestrian, and bicycle facilities |
National Highway Freight Program (NHFP) |
Projects that improve the efficient movement of freight on the National Highway Freight Network |
Source: Federal Highway Administration
Federal aid for public transit authorities is allocated by formula to urbanized areas (UZAs). MassDOT is the recipient of this federal aid in the Boston MA-NH-RI UZA. In UZAs with populations greater than 200,000, such as the Boston MA-NH-RI UZA, the distribution formula factors in passenger-miles traveled, population density, and other factors associated with each transit provider. The three regional transit authorities (RTAs) in the Boston Region MPO area are the Massachusetts Bay Transportation Authority (MBTA), MetroWest Regional Transit Authority (MWRTA), and Cape Ann Transportation Authority (CATA). The MBTA, with its extensive transit program and infrastructure, is the recipient of the preponderance of federal transit funds in the region.
The Federal Transit Administration (FTA) distributes funding to transit agencies through several different programs. Table 2-2 shows FTA programs that come from the FAST Act and support transit investments in the FFYs 2022–26 TIP.
Table 2-2
Federal Transit Administration Programs Applicable to the FFYs 2022–26 Transportation Improvement Program
FAST Act Program |
Eligible Uses |
Urbanized Area Formula Grants (Section 5307) |
Transit capital and operating assistance in urbanized areas |
Fixed Guideway/Bus (Section 5337) |
Replacement, rehabilitation, and other state-of-good-repair capital projects |
Bus and Bus Facilities (Section 5339) |
Capital projects to replace, rehabilitate, and purchase buses and related equipment, and to construct bus-related facilities |
Enhanced Mobility of Seniors and Individuals with Disabilities (Section 5310) |
Capital expenses that support transportation to meet the special needs of older adults and persons with disabilities |
Fixed-Guideway Capital Investment Grants (Section 5309) |
Grants for new and expanded rail, bus rapid transit, and ferry systems that reflect local priorities to improve transportation options in key corridors |
Source: Federal Transit Administration
As mentioned previously, each MPO in the state can decide how to prioritize the Regional Target funding it receives through the processes established by FHWA and MassDOT. The Boston Region MPO’s LRTP defines the investment framework that informs the specific investment decisions made in the TIP by establishing
The MPO’s goals and objectives provide the foundation for the evaluation criteria the MPO board uses when selecting transportation projects to be funded with Regional Target dollars. MPO staff compares candidate projects’ characteristics to these criteria to evaluate whether individual projects can help the MPO advance its various goals. The criteria used to select projects for this TIP are based on the MPO’s goals and objectives, adopted as part of Destination 2040, which is the LRTP the MPO endorsed in August 2019. These goals and objectives are listed in Chapter 1.
In Destination 2040, the MPO strengthened the link between its spending and improvements to transportation performance by revising its investment programs to include a broader range of prospective projects. These investment programs focus on specific types of projects that the MPO expects will help achieve its goals and objectives for the transportation system. The MPO created these programs to give municipalities the confidence that if they design these types of projects the MPO will be willing to fund them through the TIP:
Figure 2-1 provides details about the Destination 2040 investment programs and their relationship to the MPO’s goals. When developing the FFYs 2022–26 TIP, the MPO allocated its Regional Target dollars to these investment programs by assigning them to projects that meet the investment programs’ criteria.
Figure 2-1
Destination 2040 Investment Programs

Newly created in Destination 2040, the Transit Modernization Program represents a significant shift in the MPO’s investment strategy, as funding will be allocated to transit projects on an annual basis beginning in FFY 2025. In prior years, the MPO only funded transit projects on a one-off basis when funding was requested for specific projects in the region. By creating the programming infrastructure to flex Regional Target highway funds to transit projects annually, the Boston Region MPO has established itself as a leader among MPOs nationally by crafting an investment strategy that is truly multimodal. The MPO has taken a clear stance that investing in transit is central to improving the region’s broader transportation system. The MPO’s five other investment programs were created during the development of prior LRTPs.2-2
While the MPO did not fund any specific Transit Modernization projects in this TIP cycle, funding was reserved in FFYs 2025 and 2026 for future allocation. In the meantime, the MPO will continue to work with municipalities and transit providers in the region to identify transit needs and determine the most effective use of this funding to address those needs.
Destination 2040 also reflects an updated set of priorities for the MPO's Complete Streets investment program, adding dedicated bus lanes and climate resiliency measures to the types of projects targeted for funding through this program. As with the Transit Modernization program, the MPO will continue to work with municipalities in future TIP cycles to develop and fund projects in these new areas of emphasis.
Finally, while the MPO’s Community Connections investment program was created through the 2015 LRTP, Charting Progress to 2040, the FFYs 2021–25 TIP represented the first TIP cycle that allocated this funding to specific projects. In prior TIP cycles, the $2 million in annual funding for this program was reserved for future use but not allocated, as the development timeline for the first- and last-mile projects funded through this program is much shorter than for other TIP projects. In the FFYs 2022–26 TIP, the MPO built on the success of last year’s pilot round of the Community Connections Program, funding nine additional projects on top of the five projects funded in the previous TIP cycle. Funding continues to be reserved in FFYs 2023–26 for allocation in future TIP cycles. More information on the projects selected for funding in each of the MPO’s investment programs can be found in Chapter 3.
When creating investment program guidelines for Destination 2040, the MPO elected to decrease the amount of funding allocated to large-scale projects that would be included in its Major Infrastructure Program in order to focus a larger percentage of funding on lower cost, operations-and-management projects. Such a funding mix will help the MPO address its goals and provide more opportunities for the MPO to distribute federal transportation dollars to projects throughout the region, as opposed to concentrating it on a few large-scale projects.
Early in the development of the FFYs 2022–26 TIP, the MPO reassessed its definition of Major Infrastructure projects, adopting a new definition through sequential votes on August 20, 2020, and October 1, 2020. The MPO previously defined Major Infrastructure projects as those that cost more than $20 million or that add capacity to the transportation network. The MPO’s new definition classifies Major Infrastructure projects as those that meet any of the following criteria:
Under the MPO’s prior Major Infrastructure definition, the relatively low cost threshold caused several large-scale Complete Streets projects to be classified as Major Infrastructure projects although they were more local in nature. The changes outlined above are intended to focus the Major Infrastructure investment program on those projects that are of significant scale or that are truly important for the broader MPO region. This allows the MPO to better compare like projects when conducting project evaluations. Because the MPO considers the five-year distribution of TIP funds across its investment programs relative to the goals set forth in the LRTP (as shown in Figure 2-2), properly categorizing projects is a critical component of the MPO’s decision-making process. Funding allocation goals like these are some of the LRTP-based guidelines the MPO employs to ensure limited Regional Target funding is programmed in ways that best achieve the MPO’s goals for transportation in the region.
Figure 2-2
Destination 2040 Funding Goals by MPO Investment Program
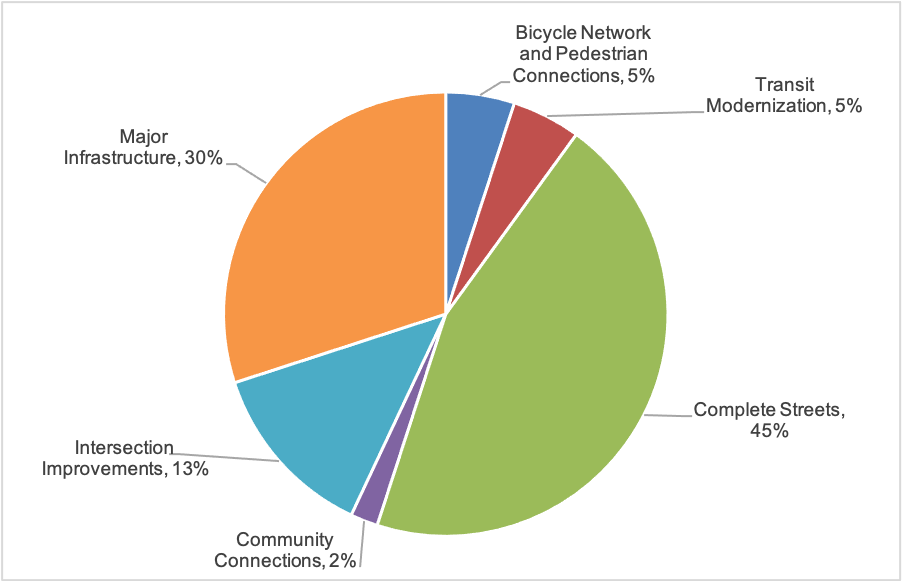
Source: Boston Region MPO.
MassDOT, in coordination with the MBTA, updates its rolling five-year Capital Investment Plan (CIP) on an annual basis. This planning document identifies priority roadway, transit, bridge, and statewide infrastructure projects for the five MassDOT divisions and the MBTA. The CIP process uses a framework that prioritizes funding according to MassDOT’s strategic goals. Reliability is the top priority for MassDOT, followed by modernization and then expansion. MassDOT and the MBTA have created investment programs for the CIP that relate to these strategic goals, and allocate funding to these programs in ways that emphasize their priority. These goals and investment programs are as follows:
The MPO applies its investment framework when developing the TIP. The MPO board’s process for selecting projects to receive highway discretionary—or Regional Target—funding relies on evaluation criteria to help identify and prioritize projects that advance the MPO’s goals. The criteria are based on the MPO’s goals and objectives outlined in the LRTP. All projects are required to show consistency with the LRTP and other statewide and regional plans. Other considerations include the readiness of a project for construction and municipal support for the project. Background information about the TIP project evaluation process is presented in Appendix A.
In the wake of the adoption of Destination 2040 in August 2019, the MPO began the process of revising the TIP evaluation criteria to enhance alignment with the MPO’s updated goals, objectives, and investment programs. These new criteria were adopted by the MPO on October 1, 2020, and were employed during the project selection process for the FFYs 2022–26 TIP. The final criteria were the result of a 15-month process that engaged nearly 1,100 members of the public through surveys and focus groups. This process also prioritized the inclusion of significant direct input from MPO members, which was gathered from more than a dozen presentations, discussions, and focus groups. The outcomes of this process are discussed further in the Project Evaluation section on the following pages.
Because of the limitations on in-person gatherings caused by the COVID-19 pandemic, a vast majority of the surveys, focus groups, and presentations discussed above were conducted virtually, with participation options both online and over the telephone. These virtual engagement opportunities allowed MPO staff to pursue new ways of building relationships with members of the public and other key stakeholders in the region. Given the increase in access to the TIP criteria revision process afforded by these virtual events, MPO staff intend to develop a hybrid outreach model that would support both in-person and virtual engagement when it is safe to resume in-person meetings.
In addition to the process outlined above, which focused on developing new criteria for five of the MPO’s investment programs (Bicycle Network and Pedestrian Connections, Complete Streets, Intersection Improvements, Major Infrastructure, and Transit Modernization), the MPO also adjusted the project selection criteria used to evaluate and fund projects through the Community Connections Program. These revisions were made based on the lessons learned by MPO staff through the pilot round of this program, which took place during the FFYs 2021–25 TIP cycle. More information on these criteria is available in the Project Evaluation section of this chapter, as well as in Appendix A.
The TIP development process begins early in the federal fiscal year when cities and towns in the region designate staff as TIP contacts and begin developing a list of priority projects to be considered for federal funding. Each fall, the MPO staff asks these TIP contacts to identify their city or town’s priority projects and then MPO staff elicits input from interested parties and members of the general public.
These discussions on municipalities’ priority projects mark the start of a robust dialogue between MPO staff and project proponents that continues through the duration of the TIP cycle. As noted above, the COVID-19 pandemic forced the transition of all of these conversations for the FFYs 2022–26 TIP cycle to take place virtually. During the fall of 2020, MPO staff held two virtual workshops for municipalities in the region to develop an understanding of the TIP process. MPO staff provided additional one-on-one virtual office hours throughout the fall for proponents to ask more detailed questions about advancing specific projects for funding, with more than two dozen office hour sessions booked for this purpose during the early stages of developing the FFYs 2022–26 TIP.
Once project proponents have decided to pursue federal funding, they must begin the formal project initiation process. All new Bicycle Network and Pedestrian Connections, Complete Streets, Intersection Improvements, and Major Infrastructure projects must be initiated with the MassDOT Highway Division before they can be considered for programming in the TIP. MassDOT details this process on its project initiation webpage, mass.gov/info-details/massdot-highway-initiating-a-project. To be considered for programming, proponents of Community Connections projects must submit an application for funding directly to MPO staff, as these projects do not need to be initiated by MassDOT.
The MPO staff compiles project funding requests for projects into a Universe of Projects list, which consists of all identified projects being advanced for possible funding in the Bicycle Network and Pedestrian Connections, Complete Streets, Intersection Improvements, and Major Infrastructure investment programs. The Universe includes projects that are at advanced stages of project design, those that are undergoing preliminary engineering and design, and projects still in the conceptual planning stage. Those projects that are active municipal priorities and that are feasibly ready to be programmed in the current TIP cycle continue forward into the MPO’s project evaluation process. Projects that are not ready for programming remain in the Universe for consideration in future TIP cycles. A project Universe is not developed for Community Connections projects, as all eligible projects within this program will be considered for funding during the TIP cycle in which project proponents apply.
The MPO staff uses its project evaluation criteria to logically and transparently evaluate and select projects for programming in the TIP that advance the MPO’s vision for transportation in the region. This process favors projects that support the following goals:
As was noted earlier in Chapter 2, the MPO undertook a process of revising the TIP evaluation criteria prior to the launch of the FFYs 2022–26 TIP to enhance the alignment between the TIP project selection process and the MPO’s updated goals, objectives, and investment programs outlined in Destination 2040. In terms of the overall structure of the criteria, this process resulted in the following outcomes:
In addition to these broader structural changes, a number of updates were made to individual criteria to better accomplish the MPO’s goals in the LRTP:
Several other changes were made to the project evaluation criteria, which are detailed in Appendix A. The point distributions by MPO investment program and LRTP goal area are also available in Figure 2-4.
Though many of the adjustments listed above were in development prior to the onset of the COVID-19 pandemic, the emerging lessons from this event reinforced the importance of making such changes. These changes include emphasizing criteria that award points to projects that invest in walking, bicycling, and transit infrastructure. Also, the need for new criteria that more directly address existing disparities in health and transportation access for minorities and low-income households has been put into stark relief throughout the pandemic. While the MPO did not elect to rescore any currently programmed projects with these new criteria, the revised criteria will be employed in coming TIP cycles to support the funding of transportation projects that act on the lessons learned from COVID-19.
Prior to the FFYs 2022–26 TIP cycle, the MPO also undertook a parallel process to update its evaluation criteria for the smaller-scale, first- and last-mile projects considered for funding through the Community Connections Program. These adjustments were based on the lessons learned from the pilot round of this program during the FFYs 2021–25 TIP cycle. In these revisions, MPO staff aimed to create a more focused set of criteria that better aligned with the types of projects pursuing funding through this program. Revisions to the Community Connections criteria also addressed the discrepancies between capital and operating projects, as the pilot criteria more heavily favored operating projects. These adjustments resulted in more balanced scores that better reflected the goals of the program when implemented for the FFYs 2022–26 TIP cycle. More information on the scoring areas for these criteria is available in Figure 2-3, and all the criteria are available in Appendix A.
Figure 2-3
TIP Project Evaluation Criteria: Point Distribution for Community Connections Projects
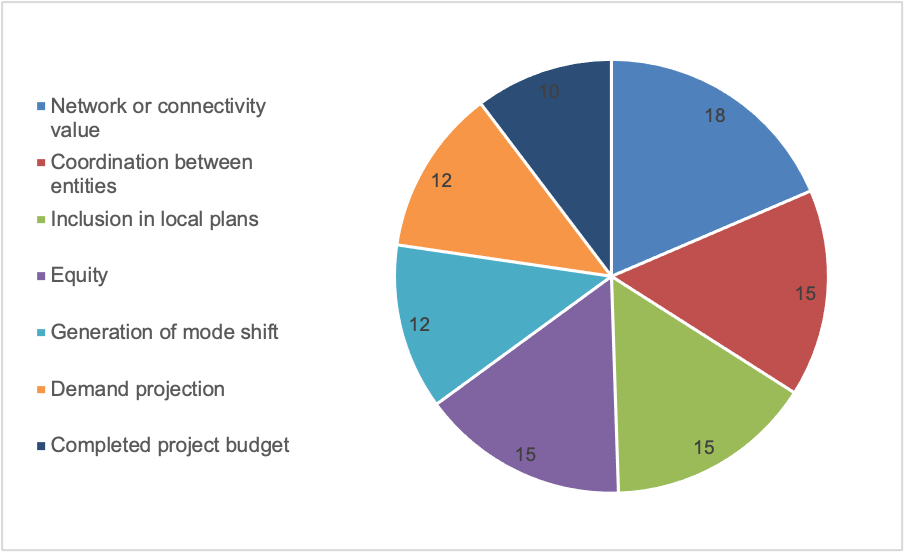
Source: Boston Region MPO.
Figure 2-4
TIP Project Evaluation Criteria: Point Distributions by Project Type (All Other Investment Programs)
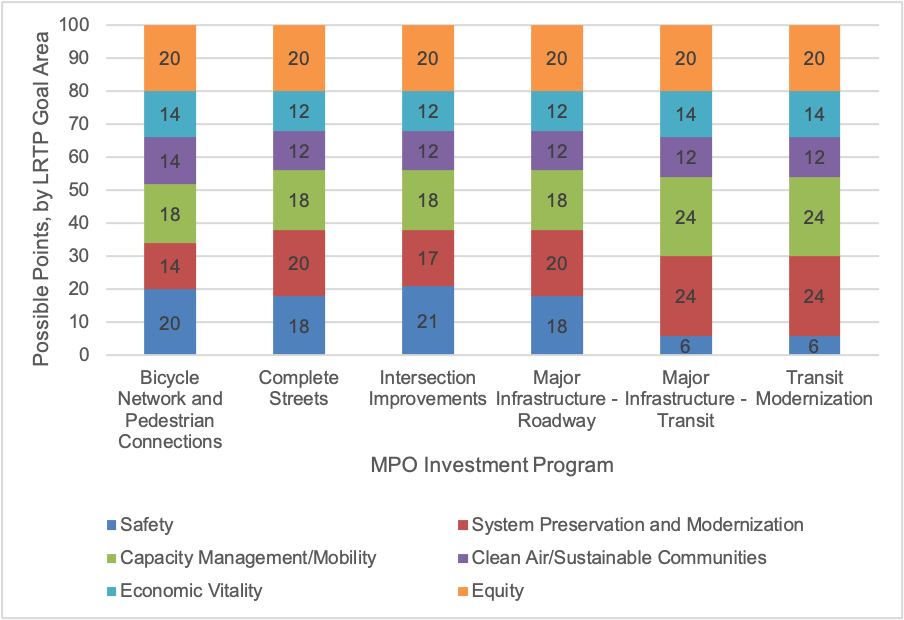
Source: Boston Region MPO.
In order for the MPO staff to conduct a complete project evaluation, each project proponent must provide enough information to meaningfully apply the criteria listed above. Bicycle Network and Pedestrian Connections, Complete Streets, Intersection Improvements, and Major Infrastructure projects must have a functional design report or be near the 25 percent design stage, or its plans must include the level of detail defined in a functional design report. (See MassDOT’s Project Development and Design Guide for information about the contents of a functional design report. This guide is available at mass.gov/lists/design-guides-and-manuals.) For Community Connections projects, proponents must submit a complete application to the MPO, including required supporting documentation.
After MPO staff have completed an initial round of project scoring, draft scores are distributed to project proponents for their review. The MPO’s goal is to fairly and accurately assess all projects, making this review a critical component of the TIP process. Proponents are encouraged to submit feedback to MPO staff on their scores if they feel any criteria have been applied inaccurately. Proponents are also encouraged to submit additional supporting documentation on their projects if doing so would help clarify or correct any elements of the draft scoring. MPO staff take all proponent feedback into consideration and make any warranted adjustments to project scores before considering the evaluation process final and preparing the scores for presentation to the MPO.
For more details about the criteria used to score projects and project evaluation results for projects considered for programming in this TIP, see Appendix A.
On TIP Readiness Day, the MPO staff meets with members of the MassDOT Highway Division to review cost and schedule changes related to currently programmed projects, which are undergoing design review, permitting, and right-of-way acquisition. The MPO board then considers these updated project construction costs and changes to the expected dates for construction advertisement when making decisions about changes to TIP programming. These changes have an impact on the ability of the MPO to program its target funds for new projects in the five-year TIP.
Between the development of the FFYs 2021–25 TIP and the FFYs 2022–26 TIP, more than half of the projects programmed by the MPO experienced cost increases, many of which represented significant increases in percentage terms or in absolute cost. These changes placed severe limitations on the MPO’s ability to consider new projects for funding during the FFYs 2022–26 TIP cycle. As a partner to MassDOT’s Highway Division and Office of Transportation Planning, the MPO recognizes its role in supporting the on-time and on-budget delivery of projects by proponents. For this reason, the MPO board created a subcommittee to further explore the causes of project cost increases and devise MPO policy changes to support more reliable project delivery by all parties. The MPO expects this subcommittee to conclude its work in advance of the project selection process for the FFYs 2023–27 TIP. More information on this subject is available in Chapter 3.
Using the evaluation scores and information gathered about project readiness (when a project likely would be fully designed and ready for advertisement) and cost, staff prepares possible TIP project programming scenarios for the MPO’s consideration. When developing these scenarios, MPO staff also considers whether a project was programmed in the LRTP, LRTP-based guidelines for allocating funds to different programs or project types, the distribution of investments across the region, and availability of sufficient funding. The MPO staff gather feedback from board members, project proponents, and the public to inform a final staff recommendation, which is then presented to the MPO for approval before it is included in the draft TIP for public review.
Given the project cost escalation issues outlined above, the MPO elected not to fund any new projects in the FFYs 2022–26 TIP except for those funded with approximately $2.5 million of Community Connections Program funds that had been previously reserved for such projects. This decision resulted in approximately $20.5 million remaining unprogrammed, allowing the MPO to reassess the use of these funds after any policy changes are made by the board prior to the FFYs 2023–27 TIP cycle. More information on the projects funded in the FFYs 2022–26 TIP, including the Community Connections projects funded with Regional Target funds, is available in Chapter 3.
As discussed above, the selection of transit, bridge, and statewide infrastructure projects for programming in the TIP draws primarily from MassDOT’s CIP. MassDOT and the MBTA evaluate projects for inclusion in CIP programs using criteria established by the independent Project Selection Advisory Council (PSAC). The following criteria from the PSAC process guide project evaluation:
Projects that receive the highest priority are those that meet MassDOT’s goals for maintaining and improving the overall condition and reliability of the system; modernizing the system to make it safer and more accessible and to accommodate growth; and expanding and diversifying transportation options for communities. These project-prioritization processes may also reflect other planning initiatives, such as Focus40, the MBTA’s 25-year investment plan, or MassDOT’s modal plans. More information on regulatory and planning guidance governing TIP project prioritization is available in Appendix E. Once project prioritization is complete, programming decisions are made based on these evaluations and information regarding project readiness, program sizing, and existing asset management plans.
As discussed above, the transit element of the TIP also includes the Federal-Aid Programs of the other two RTAs in the region, CATA and MWRTA. Once selection processes are complete, these agencies submit their lists of bridge projects, statewide infrastructure items, and transit capital projects to the MPO for review.
The MPO board considers the project evaluation results and staff recommendation when prioritizing projects for Regional Target funding. The board also considers public comments, the regional importance of projects, and other factors. In addition to prioritizing the Regional Target funding, the MPO board reviews MassDOT’s proposed statewide highway programming and the proposed capital programs for the MBTA, CATA, and MWRTA before voting to release a draft TIP for public review.
The MPO board votes to release the draft document for public review and invites members of the public, municipal and elected officials, and other stakeholders in the Boston region to review the proposed TIP. The MPO staff hosts outreach events during the public review period to elicit comments on the draft document. (See Appendix C for a full list of public comments submitted on the draft TIP.)
After the public review period ends, the MPO staff and board review all public comments, and the board may change the programming or the document as appropriate before endorsing the TIP. MassDOT staff incorporates the MPO-endorsed TIP into the State Transportation Improvement Program (STIP) and submits it to the FHWA and FTA for approval. The FHWA, FTA, and US Environmental Protection Agency review the STIP and certify it by September 30, the end of the federal fiscal year.
The TIP is a dynamic program that may be amended and adjusted throughout the year. Administrative modifications and amendments are often introduced because of changes in project status (advertisement readiness), project cost, project design scope, or available revenue. An amendment is a revision that requires public review and a demonstration of fiscal constraint.
Consistent with federal guidelines, the Boston Region MPO must release an amendment if there is: (1) a change in project cost of $500,000 or more for projects valued at $5 million or less, or (2) a change of 10 percent or more of the project cost for projects valued greater than $5 million. TIP amendments are also released if there is a proposal to add or remove a project from the TIP or if the programming year of a project is changed. Cost changes that are less than the above threshold amounts may be considered in the form of administrative modifications or adjustments, which must still undergo MPO board action for approval. Administrative modifications or adjustments are also undertaken in the event that a project’s funding source changes. Although a public review period is not required for administrative modifications or adjustments, one may be offered at the MPO board’s discretion.
Though amendments to the TIP happen every year, anomalous events occur during certain TIP cycles that require action by the MPO board. During the development of the FFYs 2022–26 TIP, the reduction in ridership across the MBTA system caused by the COVID-19 pandemic—and the resulting decrease in farebox revenue—required an amendment to the FFYs 2021–25 TIP to reallocate a significant amount of MBTA capital funds to cover operating expenses. This decision delayed several federally funded capital projects, but allowed the MBTA the financial flexibility to fund preventative maintenance activities in support of the transit system’s continued operation during the crisis. Such an event reinforces the notion that the TIP is a living capital plan that is regularly amended in response to the changing needs of the region.
Regardless of the nature of an amendment, all proposed TIP amendments are presented in a public setting at an MPO meeting, and details are posted on the MPO’s website, bostonmpo.org. Public notices are distributed through the MPO’s email contact list, which members of the public may join by signing up on the MPO’s website. Municipal staff who are TIP contacts at the affected municipalities and the public are notified of pending amendments at the start of an amendment’s public review period.
Notices of draft TIP amendments include a summary of the amendment’s contents, dates of the public review period, contact information for submitting a comment to the MPO, and the date, time, and location that the MPO will vote on that amendment. Municipal representatives and members of the public are invited to submit written or oral testimony at the MPO meetings at which amendments are discussed or voted upon.
The MPO typically holds a 21-day public review period before taking final action on an amendment. In extraordinary circumstances, the MPO may vote to shorten the public review period to a minimum of 15 days. (These circumstances are detailed in the MPO’s Public Participation Plan.)
The MPO’s website is the best place to find current information about the TIP. All changes to the draft TIP and changes to the endorsed TIP, such as amendments and modifications that have been approved by the MPO, are available on the TIP webpage, bostonmpo.org/tip.
Comments or questions about the draft TIP materials may be submitted directly to the MPO staff via the website, email, or US mail, or voiced at MPO meetings and other public MPO events.
2-1 The most recent authorization act, Fixing America’s Surface Transportation (FAST) Act, was signed into law on December 4, 2015. A one-year extension of the FAST Act was signed into law on October 1, 2020.
2-2 The Community Connections Program was formerly referred to as the Community Transportation/Parking/Clean Air and Mobility Program when it was originally created in the MPO’s 2015 LRTP, Charting Progress to 2040.
The Transportation Improvement Program (TIP) tables included in this chapter present a listing of all the projects and programs funded with federal highway and transit aid in the Boston region during federal fiscal years (FFYs) 2022–26. These funding tables are also included as part of the State Transportation Improvement Program (STIP).
Table 3-1 presents a summary of the Boston Region Metropolitan Planning Organization’s (MPO) share of Regional Target funds from the Federal-Aid Highway Program. The allocation of these funds is constrained by projections of available federal aid. As shown in Table 3-1, the MPO has programmed much of the available discretionary funds within the limits of projected funding for highway funding programs. As such, the FFYs 2022–26 TIP Regional Target Program complies with financial constraint requirements.
Table 3-1
Boston Region MPO Regional Target Program
Funding Summary
FFY 2022 |
FFY 2023 |
FFY 2024 |
FFY 2025 |
FFY 2026 |
Total |
|
Regional Target Obligation Authority |
$106,681,829 |
$109,011,849 |
$110,440,638 |
$107,862,383 |
$105,061,400 |
$539,058,099 |
Regional Target Funds Programmed |
$106,638,666 |
$108,908,330 |
$110,440,638 |
$107,862,383 |
$84,712,047 |
$518,562,064 |
Regional Target Funds Unprogrammed |
$43,163 |
$103,519 |
$0 |
$0 |
$20,349,353 |
$20,496,035 |
Source: Boston Region MPO.
In the FFYs 2022–26 TIP, the MPO elected to leave approximately $20.5 million in Regional Target funds unallocated to specific projects. This is uncharacteristic, as the MPO typically strives to fully allocate all of its funds in every fiscal year to the extent possible. In drafting this TIP, a significant number of projects that were selected for funding by the MPO in prior TIP cycles saw sizeable cost increases. The MPO’s historic policy has been—and continues to be—to use any available new funding to cover such cost increases before considering new projects for funding.
To provide certainty for project proponents, the MPO elected to maintain this policy during this TIP cycle, resulting in no allocation of funding for new projects in FFYs 2022–26 other than the 10 projects funded through the MPO’s Community Connections Program, which are listed in Table 3-2 below. The funding of these 10 projects—nine of which are new, and one of which is receiving a second and third year of funding—represents a successful second round of this new funding program for first- and last-mile projects, supporting the MPO’s ability to work towards its goals for the region even in years with limited available funding for new projects. (More information on these projects is available on the following pages of this chapter.) To support the MPO’s ability to fund more projects in future years, the MPO has formed a subcommittee of board members to examine the issue of project cost increases further. This subcommittee intends to conduct this work during the summer of 2021, with the intent of providing policy change recommendations to the MPO for adoption prior to the beginning of the FFYs 2023–27 TIP cycle in the fall of 2021.
Table 3-2
New Regional Target Projects Funded in the FFYs 2022–26 TIP
Project Name |
Municipality (Proponent) |
FFYs of Funding |
Regional Target Dollars Programmed |
Royall Street Shuttle |
Canton |
2022-24 |
$534,820 |
Newton Microtransit Service |
Newton |
2023-24* |
$427,000 |
BlueBikes Expansion |
Arlington, Newton, and Watertown |
2022 |
$340,000 |
Alewife Wayfinding Improvements |
Cambridge (128 Business Council) |
2022 |
$292,280 |
Systemwide Bike Racks |
MBTA |
2022 |
$275,740 |
BlueBikes Expansion |
Malden and Medford |
2022 |
$236,830 |
Main Street Transit Signal Priority |
Everett and Malden (MBTA) |
2022 |
$225,000 |
Bicycle Infrastructure |
Wellesley |
2022 |
$85,054 |
Transit App Education Program |
Brookline |
2022 |
$43,620 |
Acton Parking Management System |
Acton |
2022 |
$20,000 |
Total |
N/A |
N/A |
$2,480,344 |
Note: All projects in this table are funded through the MPO’s Community Connections Program.
*The first FFY of funding for the Newton Microtransit Service project is in FFY 2021, in which $300,000 was allocated to the project.
Source: Boston Region MPO.
Additional details of the specific projects programmed with Regional Target funding are shown in Section 1A of each annual element of the TIP tables (Table 3-7). The other sections in Table 3-7 (Sections 1B, 2A, 2B, and 2C) list the following:
Tables 3-8, 3-9, 3-10, and 3-11 list the federally funded transit projects and programs in the Boston region that the Massachusetts Bay Transportation Authority (MBTA), MetroWest Regional Transit Authority (MWRTA), and Cape Ann Transportation Authority (CATA) plan to undertake.
The second part of the chapter includes detailed descriptions of projects funded through both the Regional Target and statewide portions of the Highway Program, including evaluation scores (for MPO-funded projects), project proponents, and funding details. The pages are organized alphabetically by the municipality in which each project is located.
This section summarizes the investments made by the Boston Region MPO, Massachusetts Department of Transportation (MassDOT), MBTA, CATA, and MWRTA in the FFYs 2022–26 TIP. Table 3-3 shows the Boston Region MPO’s investments of Regional Target funding—including both the number of projects and the dollar amount—by investment program. These investments are aimed at making progress towards the MPO’s goals for the region, including enhancing safety for all users, preserving and modernizing the transportation system, promoting mobility and reducing congestion, supporting clean air and sustainability, ensuring all have equitable access to the transportation system, and fostering economic vitality in the region through investments in transportation.
Table 3-3
FFYs 2022–26 Boston Region MPO Regional Target Investment Summary
MPO Investment Program |
Number of Projects |
Regional Target Dollars Programmed |
Bicycle Network and Pedestrian Connections |
4 |
$33,704,014 |
Community Connections (allocated to projects) |
10 |
$2,480,344 |
Community Connections (not yet allocated to projects) |
N/A |
$7,522,281 |
Complete Streets |
19 |
$220,955,609 |
Intersection Improvements |
8 |
$62,805,302 |
Major Infrastructure—Flex to Transit1 |
1 |
$27,116,883 |
Major Infrastructure—Roadway2 |
3 |
$152,977,631 |
Transit Modernization (not yet allocated to projects) |
N/A |
$11,000,000 |
Unprogrammed |
N/A |
$20,496,035 |
Total |
45 |
$539,058,099 |
Note: Funding amounts in this table include both federal and non-federal funds, including matching funds.
1 The MPO will flex federal highway improvement dollars to support the Green Line Extension.
2 In FFY 2022, the MPO will contribute $11,046,213 to Project 606476—Summer Tunnel Improvements—and MassDOT will contribute other funds. This project is included in the total number of projects in this category.
Source: Boston Region MPO.
Table 3-4 shows MassDOT’s FFYs 2022–26 TIP investments—including both the number of projects or programs and the dollar amount—organized by MassDOT program. MassDOT’s investments are distributed across a variety of programs and will support bridge and pavement improvements, roadway improvements and reconstruction, new bicycle and pedestrian infrastructure, and safety improvements. More details on these investments are available on the project summary pages that comprise the second section of this chapter.
Table 3-4
MassDOT Highway Program Investment Summary
MassDOT Program |
Number of Projects |
MassDOT Dollars Programmed |
Bicycles and Pedestrians |
5 |
$34,054,640 |
Bridge Program |
19 |
$146,335,182 |
Earmarks or Discretionary Grants1,2 |
2 |
$146,559,638 |
Intersection Improvements3 |
5 |
$21,394,315 |
Interstate Pavement |
3 |
$59,772,691 |
Non-Interstate Pavement |
8 |
$57,479,177 |
Roadway Improvements |
1 |
$411,782 |
Roadway Reconstruction |
8 |
$171,183,263 |
Safety Improvements |
7 |
$37,638,458 |
Total |
55 |
$674,829,146 |
Note: Funding amounts in this table include both federal and non-federal funds, including matching funds.
1 Funding has been earmarked for two projects, both of which are also receiving funding through MassDOT’s Roadway Reconstruction Program (606476—Summer Tunnel Improvements, and 607977—Interstates 90/495 Interchange Reconstruction). Each project is counted in the tally for the Earmark Projects and Roadway Reconstruction categories, but is only counted once in the total number of projects funded.
2 Project 606476—Sumner Tunnel Improvements—is also funded with $22,115,687 in Regional Target funds, which are not shown in this table.
3 One project is funded through this program while also receiving funding through MassDOT’s Safety Improvements Program (608562—Signal and Intersection Improvements on Interstate 93 at Mystic Avenue and McGrath Highway in Somerville). This project is counted the tally for the Intersection Improvements and Safety Improvements categories, but is only counted once in the total number of projects funded.
Sources: MassDOT and the Boston Region MPO.
Table 3-5 shows the MBTA’s programs and associated TIP funding amounts, with additional details on the MBTA’s programs and projects in Tables 3-8 and 3-9 on the following pages. Investments made through these programs allow the MBTA to continue to maintain and modernize its infrastructure in support of the agency’s role as the largest transit provider in the Commonwealth of Massachusetts. The MBTA caters to a wide range of needs, serving the Boston region with commuter rail, light rail, subway, fixed-route bus, and paratransit services. The MBTA prioritizes projects that keep the existing transit system in a state of good repair, including the purchase of new rolling stock, accessibility and resiliency improvements to stations, the rehabilitation of bridges and tunnels, and the replacement of tracks and signals to support system-wide reliability. Limited system expansion projects are also undertaken through the MBTA’s federal capital program, as is currently demonstrated by the ongoing funding provided in support of the Green Line Extension project. Further information on how the MBTA’s investments support system safety and condition is available in Chapter 4.
Table 3-5
MBTA Transit Program Investment Summary
Federal Transit Administration Program |
MBTA Program |
MBTA Dollars Programmed |
Section 5307: Urbanized Area Formula Grants |
Revenue Vehicle Program |
$735,977,381 |
Section 5307: Urbanized Area Formula Grants |
Signals/Systems Upgrade Program |
$0 |
Section 5307: Urbanized Area Formula Grants |
Stations and Facilities Program |
$233,100,526 |
Section 5337: Fixed Guideway/Bus Funds |
Bridge and Tunnel Program |
$295,197,136 |
Section 5337: Fixed Guideway/Bus Funds |
Revenue Vehicle Program |
$75,824,136 |
Section 5337: Fixed Guideway/Bus Funds |
Signals/Systems Upgrade Program |
$427,731,765 |
Section 5337: Fixed Guideway/Bus Funds |
Stations and Facilities Program |
$178,373,206 |
Section 5339: Bus and Bus Facilities Funds |
Bus Program |
$40,149,866 |
Section 5309: Fixed Guideway Capital Investment Grants |
Green Line Extension—New Starts (Full Funding Grant Agreement) |
$92,242,000 |
Other Federal Funds |
Positive Train Control1 |
$745,369,284 |
Other Federal Funds |
RRIF/TIFIA Financing Program2 |
$715,000,000 |
Total |
N/A |
$3,538,965,301 |
Note: FTA formula funds (Sections 5307, 5337 and 5339) are based on estimated apportionments. TIP programs and projects are based on a preliminary draft Capital Investment Plan (CIP) as of April 22, 2021. Adjustments will be made to federal projects and budgets as the CIP process is finalized. Funding amounts in this table include both federal and non-federal funds, including matching funds.
1 Positive Train Control investments are funded with Railroad Rehabilitation and Improvement Financing (RRIF) funds.
2 RRIF/Transportation Infrastructure Finance and Innovation Act (TIFIA) financing program funding is an initial estimate and will be refined as projects are identified and loans are finalized with the Build America Bureau.
Sources: MBTA and the Boston Region MPO.
Table 3-6 summarizes CATA and MWRTA investments included in the FFYs 2022-26 TIP, with further information available on each agency’s investments in Tables 3-10 and 3-11. Though the MBTA provides commuter rail service to the Cape Ann communities of Rockport and Gloucester, CATA provides additional paratransit and fixed-route bus services to these communities, and to Danvers, Peabody, Ipswich, Essex, and Beverly. CATA’s federal capital program supports its role in providing critical transportation alternatives to residents and visitors of the area, including through the replacement of buses, the modernization of facilities, and the maintenance of assets. MWRTA similarly complements MBTA commuter rail service, operating fixed-route bus, on-demand microtransit, and commuter shuttle services to a number of communities in the MetroWest subregion. MWRTA’s federal capital program supports this mission by funding vehicle replacements, station and facility maintenance and improvements, and operating assistance for paratransit services, among other efforts. Other projects funded in MWRTA’s 2022-26 TIP include the electrification of the agency’s paratransit fleet and investments in technology to support travel training and customer service efforts.
Table 3-6
CATA and MWRTA Transit Program Investment Summary
Regional Transit Authority |
Federal Transit Administration Program |
RTA Dollars Programmed |
CATA |
Section 5307: Urbanized Area Formula Funding |
$3,105,000 |
CATA |
State Transportation Bond Capital Assistance |
$2,145,000 |
CATA |
Municipal and Local Assessments |
$356,250 |
MWRTA |
Section 5307: Urbanized Area Formula Funding |
$16,905,684 |
MWRTA |
Section 5339: Bus and Bus Facilities |
$250,000 |
MWRTA |
State Transportation Bond Capital Assistance |
$1,489,000 |
MWRTA |
Other Federal |
$27,450,990 |
MWRTA |
Other Non-Federal |
$721,100 |
Total |
N/A |
$52,423,024 |
Note: Funding amounts in this table include both federal and non-federal funds, including matching funds.
Sources: CATA, MWRTA, and the Boston Region MPO.
Tables 3-7 through 3-11 build on the summary tables listed above by detailing investments made through both the Highway and Transit Programs by project, program, and funding year.
Table 3-7
FFYs 2022-26 TIP Highway Table
| Year | MassDOT Project ID | MPO | Municipality | MassDOT Project Description | District | Funding Source | Adjusted TFPC | Total Programmed Funds | Federal Funds | Non-Federal Funds | Other Information | ||||
| Federal Fiscal Year 2022 | $299,464,327 | $243,340,692 | $56,123,635 | ||||||||||||
| Section 1A / Regionally Prioritized Projects | $132,888,666 | $106,410,933 | $26,477,733 | ||||||||||||
| Roadway Reconstruction | $35,094,904 | $28,075,923 | $7,018,981 | ||||||||||||
| 2022 | 602077 | Boston Region | Lynn | LYNN- RECONSTRUCTION ON ROUTE 129 (LYNNFIELD STREET), FROM GREAT WOODS ROAD TO WYOMA SQUARE | 4 | CMAQ | $6,643,384 | $1,000,000 | $800,000 | $200,000 | Construction; CMAQ+STBG Total Cost = $6,349,357; MPO Evaluation Score = 38 | ||||
| 2022 | 602077 | Boston Region | Lynn | LYNN- RECONSTRUCTION ON ROUTE 129 (LYNNFIELD STREET), FROM GREAT WOODS ROAD TO WYOMA SQUARE | 4 | STBG | $6,643,384 | $5,349,357 | $4,279,486 | $1,069,871 | Construction; CMAQ+STBG Total Cost = $6,349,357; MPO Evaluation Score = 38 | ||||
| 2022 | 606476 | Boston Region | Boston | BOSTON- ROADWAY, CEILING, ARCH & WALL RECONSTRUCTION AND OTHER CONTROL SYSTEMS IN SUMNER TUNNEL | 6 | STBG | $136,722,750 | $11,046,213 | $8,836,970 | $2,209,243 | Construction; NHPP+HSIP+Other Federal Aid Total Cost = $126,544,931; Total MPO Contribution = $22,115,687; AC schedule over 3 years (2021-2023). MPO funding has 2-year AC schedule (2021-22). | ||||
| 2022 | 608078 | Boston Region | Chelsea | CHELSEA- RECONSTRUCTION ON BROADWAY (ROUTE 107), FROM CITY HALL AVENUE TO THE REVERE C.L. | 6 | CMAQ | $11,301,176 | $1,000,000 | $800,000 | $200,000 | Construction; CMAQ+STBG Total Cost = $11,301,176; MPO Evaluation Score = 61 | ||||
| 2022 | 608078 | Boston Region | Chelsea | CHELSEA- RECONSTRUCTION ON BROADWAY (ROUTE 107), FROM CITY HALL AVENUE TO THE REVERE C.L. | 6 | STBG | $11,301,176 | $10,301,176 | $8,240,941 | $2,060,235 | Construction; CMAQ+STBG Total Cost = $11,301,176; MPO Evaluation Score = 61 | ||||
| 2022 | 608887 | Boston Region | Bellingham | BELLINGHAM- REHABILITATION AND RELATED WORK ON ROUTE 126, FROM DOUGLAS DRIVE TO ROUTE 140 | 3 | CMAQ | $6,398,158 | $2,000,000 | $1,600,000 | $400,000 | Construction; CMAQ+STBG+TAP Total Cost = $6,398,158; MPO Evaluation Score = 45; TAP Proponent = Bellingham | ||||
| 2022 | 608887 | Boston Region | Bellingham | BELLINGHAM- REHABILITATION AND RELATED WORK ON ROUTE 126, FROM DOUGLAS DRIVE TO ROUTE 140 | 3 | STBG | $6,398,158 | $3,517,330 | $2,813,864 | $703,466 | Construction; CMAQ+STBG+TAP Total Cost = $6,398,158; MPO Evaluation Score = 45; TAP Proponent = Bellingham | ||||
| 2022 | 608887 | Boston Region | Bellingham | BELLINGHAM- REHABILITATION AND RELATED WORK ON ROUTE 126, FROM DOUGLAS DRIVE TO ROUTE 140 | 3 | TAP | $6,398,158 | $880,828 | $704,662 | $176,166 | Construction; CMAQ+STBG+TAP Total Cost = $6,398,158; MPO Evaluation Score = 45; TAP Proponent = Bellingham | ||||
| Bicycle and Pedestrian | $23,886,844 | $19,109,475 | $4,777,369 | ||||||||||||
| 2022 | 607738 | Boston Region | Bedford | BEDFORD- MINUTEMAN BIKEWAY EXTENSION, FROM LOOMIS STREET TO THE CONCORD T.L. | 4 | CMAQ | $11,000,168 | $9,500,168 | $7,600,134 | $1,900,034 | Construction; CMAQ+TAP Total Cost = $11,000,168; MPO Evaluation Score = 47; TAP Proponent = Bedford | ||||
| 2022 | 607738 | Boston Region | Bedford | BEDFORD- MINUTEMAN BIKEWAY EXTENSION, FROM LOOMIS STREET TO THE CONCORD T.L. | 4 | TAP | $11,000,168 | $1,500,000 | $1,200,000 | $300,000 | Construction; CMAQ+TAP Total Cost = $11,000,168; MPO Evaluation Score = 47; TAP Proponent = Bedford | ||||
| 2022 | 608164 | Boston Region | Multiple | SUDBURY- CONCORD- BIKE PATH CONSTRUCTION (BRUCE FREEMAN RAIL TRAIL) | 3 | CMAQ | $12,886,676 | $8,834,137 | $7,067,310 | $1,766,827 | Construction; CMAQ+TAP Total Cost = $12,886,676; MPO Evaluation Score = 40; TAP Proponent = Sudbury | ||||
| 2022 | 608164 | Boston Region | Multiple | SUDBURY- CONCORD- BIKE PATH CONSTRUCTION (BRUCE FREEMAN RAIL TRAIL) | 3 | STBG | $12,886,676 | $3,552,539 | $2,842,031 | $710,508 | Construction; CMAQ+TAP Total Cost = $12,886,676; MPO Evaluation Score = 40; TAP Proponent = Sudbury | ||||
| 2022 | 608164 | Boston Region | Multiple | SUDBURY- CONCORD- BIKE PATH CONSTRUCTION (BRUCE FREEMAN RAIL TRAIL) | 3 | TAP | $12,886,676 | $500,000 | $400,000 | $100,000 | Construction; CMAQ+TAP Total Cost = $12,886,676; MPO Evaluation Score = 40; TAP Proponent = Sudbury | ||||
| Earmark Discretionary | $26,250,000 | $21,000,000 | $5,250,000 | ||||||||||||
| 2022 | 607977 | Boston Region | Multiple | HOPKINTON- WESTBOROUGH- RECONSTRUCTION OF I-90/I-495 INTERCHANGE | 3 | Other FA | $285,366,126 | $26,250,000 | $21,000,000 | $5,250,000 | Other FA - SW HIP: $6,784,226 (FY 2022); HIP Boston: $5,176,619 (FY 2022); BUILD Grant: $26,250,000 (FY 2022); HIP BR: $40,000,000 (FY 2023); $111,166,667 WT Funding | ||||
| Intersection Improvements | $18,537,410 | $14,929,928 | $3,607,482 | ||||||||||||
| 2022 | 608229 | Boston Region | Acton | ACTON- INTERSECTION & SIGNAL IMPROVEMENTS AT KELLEY'S CORNER, ROUTE 111 (MASSACHUSETTS AVENUE) AND ROUTE 27 (MAIN STREET) | 3 | CMAQ | $15,311,125 | $3,000,000 | $2,400,000 | $600,000 | Construction; CMAQ+TAP+STBG Total Cost = $15,311,125; MPO Evaluation Score = 45; TAP Proponent = Acton | ||||
| 2022 | 608229 | Boston Region | Acton | ACTON- INTERSECTION & SIGNAL IMPROVEMENTS AT KELLEY'S CORNER, ROUTE 111 (MASSACHUSETTS AVENUE) AND ROUTE 27 (MAIN STREET) | 3 | STBG | $15,311,125 | $12,111,125 | $9,688,900 | $2,422,225 | Construction; CMAQ+TAP+STBG Total Cost = $15,311,125; MPO Evaluation Score = 45; TAP Proponent = Acton | ||||
| 2022 | 608229 | Boston Region | Acton | ACTON- INTERSECTION & SIGNAL IMPROVEMENTS AT KELLEY'S CORNER, ROUTE 111 (MASSACHUSETTS AVENUE) AND ROUTE 27 (MAIN STREET) | 3 | TAP | $15,311,125 | $200,000 | $160,000 | $40,000 | Construction; CMAQ+TAP+STBG Total Cost = $15,311,125; MPO Evaluation Score = 45; TAP Proponent = Acton | ||||
| 2022 | 608443 | Boston Region | Multiple | LITTLETON- AYER- INTERSECTION IMPROVEMENTS ON ROUTE 2A AT WILLOW ROAD AND BRUCE STREET | 3 | HSIP | $3,226,285 | $1,000,000 | $900,000 | $100,000 | Construction; HSIP+STBG Total Cost = $3,226,285; MPO Evaluation Score = 36 | ||||
| 2022 | 608443 | Boston Region | Multiple | LITTLETON- AYER- INTERSECTION IMPROVEMENTS ON ROUTE 2A AT WILLOW ROAD AND BRUCE STREET | 3 | STBG | $3,226,285 | $2,226,285 | $1,781,028 | $445,257 | Construction; HSIP+STBG Total Cost = $3,226,285; MPO Evaluation Score = 36 | ||||
| Flex to FTA | $27,909,903 | $22,327,922 | $5,581,981 | ||||||||||||
| 2022 | S10780 | Boston Region | Medford, Somerville | GREEN LINE EXTENSION PROJECT- EXTENSION TO COLLEGE AVENUE WITH THE UNION SQUARE SPUR | 4 | CMAQ | $27,096,238 | $27,116,883 | $21,693,506 | $5,423,377 | Construction; STBG+CMAQ+Section 5309 (Transit) Total MPO Contribution = $190,079,465; Total funding in this TIP = $27,116,883; AC Yr 6 of 6; Funding flexed to FTA; Match provided by local contributions | ||||
| 2022 | S12116 | Boston Region | Cambridge | ALEWIFE WAYFINDING IMPROVEMENTS | 6 | CMAQ | $292,280 | $292,280 | $233,824 | $58,456 | Construction; CMAQ Total Cost = $292,280; MPO Evaluation Score = 24; Project funded through MPO's Community Connections Program. | ||||
| 2022 | S12117 | Boston Region | Multiple | MBTA SYSTEMWIDE BIKE RACKS | Regionwide | CMAQ | $275,740 | $275,740 | $220,592 | $55,148 | Construction; CMAQ Total Cost = $275,740; MPO Evaluation Score = 64; Project funded through MPO's Community Connections Program. | ||||
| 2022 | S12119 | Boston Region | Everett, Malden | MAIN STREET TRANSIT SIGNAL PRIORITY | 4 | CMAQ | $225,000 | $225,000 | $180,000 | $45,000 | Construction; CMAQ Total Cost = $225,000; MPO Evaluation Score = 72; Project funded through MPO's Community Connections Program. | ||||
| Transit Grant Program | $1,209,605 | $967,684 | $241,921 | ||||||||||||
| 2022 | S12114 | Boston Region | Canton | ROYALL STREET SHUTTLE | 6 | CMAQ | $534,820 | $209,101 | $167,281 | $41,820 | Operations; CMAQ Total Cost = $534,820; MPO Evaluation Score = 51; Project funded through MPO's Community Connections Program. | ||||
| 2022 | S12115 | Boston Region | Multiple | BLUEBIKES EXPANSION IN ARLINGTON, NEWTON, AND WATERTOWN | 4, 6 | CMAQ | $340,000 | $340,000 | $272,000 | $68,000 | Construction; CMAQ Total Cost = $340,000; MPO Evaluation Score = 52; Project funded through MPO's Community Connections Program. | ||||
| 2022 | S12118 | Boston Region | Multiple | BLUEBIKES EXPANSION IN MALDEN AND MEDFORD | 4 | CMAQ | $236,830 | $236,830 | $189,464 | $47,366 | Construction; CMAQ Total Cost = $236,830; MPO Evaluation Score = 73; Project funded through MPO's Community Connections Program. | ||||
| 2022 | S12120 | Boston Region | Wellesley | WELLESLEY BICYCLE INFRASTRUCTURE | 6 | CMAQ | $85,054 | $85,054 | $68,043 | $17,011 | Construction; CMAQ Total Cost = $85,054; MPO Evaluation Score = 42.75; Project funded through MPO's Community Connections Program. | ||||
| 2022 | S12121 | Boston Region | Brookline | TRANSIT APP EDUCATION PROGRAM | 6 | CMAQ | $43,620 | $43,620 | $34,896 | $8,724 | Operations; CMAQ Total Cost = $43,620; MPO Evaluation Score = 49; Project funded through MPO's Community Connections Program. | ||||
| 2022 | S12122 | Boston Region | Acton | PARKING MANAGEMENT SYSTEM | 3 | CMAQ | $20,000 | $20,000 | $16,000 | $4,000 | Construction; CMAQ Total Cost = $20,000; MPO Evaluation Score = 29; Project funded through MPO's Community Connections Program. | ||||
| 2022 | S12125 | Boston Region | Newton | NEWTON MICROTRANSIT SERVICE | 6 | CMAQ | $427,000 | $275,000 | $220,000 | $55,000 | Operations; CMAQ Total Cost = $727,000; MPO Evaluation Score = 53; Project funded over three fiscal years (2021-2023)through MPO's Community Connections Program. | ||||
| Section 1B / Earmark or Discretionary Grant Funded Projects | $42,784,269 | $34,227,415 | $8,556,854 | ||||||||||||
| Earmark Discretionary | $42,784,269 | $34,227,415 | $8,556,854 | ||||||||||||
| 2022 | 606476 | Boston Region | Boston | BOSTON- ROADWAY, CEILING, ARCH & WALL RECONSTRUCTION AND OTHER CONTROL SYSTEMS IN SUMNER TUNNEL | 6 | NHPP-E | $136,722,750 | $30,823,424 | $24,658,739 | $6,164,685 | Construction; NHPP+HSIP+Other Federal Aid Total Cost = $126,544,931; Total MPO Contribution = $22,115,687; AC schedule over 3 years (2021-2023). MPO funding has 2-year AC schedule (2021-22). | ||||
| 2022 | 607977 | Boston Region | Multiple | HOPKINTON- WESTBOROUGH- RECONSTRUCTION OF I-90/I-495 INTERCHANGE | 3 | HIP | $285,366,126 | $11,960,845 | $9,568,676 | $2,392,169 | Other FA - SW HIP: $6,784,226 (FY 2022); HIP Boston: $5,176,619 (FY 2022); BUILD Grant: $26,250,000 (FY 2022); HIP BR: $40,000,000 (FY 2023); $111,166,667 WT Funding | ||||
| Section 2A / State Prioritized Reliability Projects | $71,549,639 | $57,283,481 | $14,266,158 | ||||||||||||
| Bridge On-system NHS | $49,443,262 | $39,554,610 | $9,888,652 | ||||||||||||
| 2022 | 604173 | Boston Region | Boston | BOSTON- BRIDGE REPLACEMENT, B-16-016, NORTH WASHINGTON STREET OVER THE BOSTON INNER HARBOR | 6 | NHPP | $176,318,433 | $28,825,727 | $23,060,582 | $5,765,145 | Project ACd over 2017-2022. | ||||
| 2022 | 604952 | Boston Region | Multiple | LYNN- SAUGUS- BRIDGE REPLACEMENT, L-18-016=S-05-008, ROUTE 107 OVER THE SAUGUS RIVER (AKA - BELDEN G. BLY BRIDGE) | 4 | NHPP | $98,962,749 | $20,617,535 | $16,494,028 | $4,123,507 | Project ACd over 2019-2022. | ||||
| Non-Interstate Pavement | $3,248,450 | $2,598,760 | $649,690 | ||||||||||||
| 2022 | 608495 | Boston Region | Multiple | CONCORD- LEXINGTON- LINCOLN- RESURFACING AND RELATED WORK ON ROUTE 2A | 4 | NHPP | $3,248,450 | $3,248,450 | $2,598,760 | $649,690 | |||||
| Roadway Improvements | $411,782 | $329,426 | $82,356 | ||||||||||||
| 2022 | 608599 | Boston Region | Multiple | CANTON- NORWOOD- STORMWATER IMPROVEMENTS ALONG ROUTE 1 & I-95 | 5 | STBG | $411,782 | $411,782 | $329,426 | $82,356 | |||||
| Bridge Systematic Maintenance | $5,349,900 | $4,279,920 | $1,069,980 | ||||||||||||
| 2022 | 608866 | Boston Region | Multiple | NEWTON- WESTON- STEEL SUPERSTRUCTURE CLEANING (FULL REMOVAL) AND PAINTING OF 3 BRIDGES: N-12-051, W-29-011 & W-29-028 | 6 | NHPP | $2,349,900 | $2,349,900 | $1,879,920 | $469,980 | |||||
| 2022 | 612028 | Boston Region | Stoneham | STONEHAM- DECK REPLACEMENT & SUPERSTRUCTURE REPAIRS, S-27-006 (2L2), (ST 28) FELLSWAY WEST OVER I-93 | 4 | NHPP | $3,000,000 | $3,000,000 | $2,400,000 | $600,000 | |||||
| Safety Improvements | $13,096,245 | $10,520,766 | $2,575,479 | ||||||||||||
| 2022 | 609060 | Boston Region | Multiple | LYNNFIELD- PEABODY- DANVERS- GUIDE AND TRAFFIC SIGN REPLACEMENT ON I-95/128 (TASK 'A' INTERCHANGE) | 4 | HSIP | $437,700 | $437,700 | $393,930 | $43,770 | |||||
| 2022 | 609090 | Boston Region | Multiple | BOSTON- MILTON- QUINCY- HIGHWAY LIGHTING SYSTEM REPLACEMENT ON I-93, FROM NEPONSET AVENUE TO THE BRAINTREE SPLIT | 6 | NHPP | $12,658,545 | $12,658,545 | $10,126,836 | $2,531,709 | |||||
| Section 2B / State Prioritized Modernization Projects | $40,254,605 | $35,829,145 | $4,425,461 | ||||||||||||
| Roadway Reconstruction | $40,254,605 | $35,829,145 | $4,425,461 | ||||||||||||
| 2022 | 606476 | Boston Region | Boston | BOSTON- ROADWAY, CEILING, ARCH & WALL RECONSTRUCTION AND OTHER CONTROL SYSTEMS IN SUMNER TUNNEL | 6 | NHPP | $136,722,750 | $4,000,000 | $3,200,000 | $800,000 | Construction; NHPP+HSIP+Other Federal Aid Total Cost = $126,544,931; Total MPO Contribution = $22,115,687; AC schedule over 3 years (2021-2023). MPO funding has 2-year AC schedule (2021-22). | ||||
| 2022 | 607977 | Boston Region | Multiple | HOPKINTON- WESTBOROUGH- RECONSTRUCTION OF I-90/I-495 INTERCHANGE | 3 | NHPP-I | $285,366,126 | $12,233,939 | $11,010,545 | $1,223,394 | Other FA - SW HIP: $6,784,226 (FY 2022); HIP Boston: $5,176,619 (FY 2022); BUILD Grant: $26,250,000 (FY 2022); HIP BR: $40,000,000 (FY 2023); $111,166,667 WT Funding | ||||
| 2022 | 607977 | Boston Region | Multiple | HOPKINTON- WESTBOROUGH- RECONSTRUCTION OF I-90/I-495 INTERCHANGE | 3 | NFP-I | $285,366,126 | $24,020,666 | $21,618,599 | $2,402,067 | Other FA - SW HIP: $6,784,226 (FY 2022); HIP Boston: $5,176,619 (FY 2022); BUILD Grant: $26,250,000 (FY 2022); HIP BR: $40,000,000 (FY 2023); $111,166,667 WT Funding | ||||
| Section 2C / State Prioritized Expansion Projects | $11,987,148 | $9,589,718 | $2,397,430 | ||||||||||||
| Bicycle and Pedestrian | $11,987,148 | $9,589,718 | $2,397,430 | ||||||||||||
| 2022 | 608943 | Boston Region | Boston | BOSTON- NEPONSET RIVER GREENWAY CONSTRUCTION, INCLUDING NEW BRIDGE B-16-309 (C6Y) OVER DORCHESTER BAY | 6 | CMAQ | $8,809,272 | $8,809,272 | $7,047,418 | $1,761,854 | |||||
| 2022 | 609066 | Boston Region | Multiple | NEWTON- WESTON- MULTI-USE TRAIL CONNECTION, FROM RECREATION ROAD TO UPPER CHARLES RIVER GREENWAY INCLUDING RECONSTRUCTION OF PED BRIDGE N-12-078=W-29-062 | 6 | CMAQ | $3,177,876 | $3,177,876 | $2,542,301 | $635,575 | |||||
| Year | MassDOT Project ID | MPO | Municipality | MassDOT Project Description | District | Funding Source | Adjusted TFPC | Total Programmed Funds | Federal Funds | Non-Federal Funds | Other Information | ||||
| Federal Fiscal Year 2023 | $275,789,516 | $226,115,864 | $49,673,653 | ||||||||||||
| Section 1A / Regionally Prioritized Projects | $108,908,329 | $87,606,835 | $21,301,494 | ||||||||||||
| Intersection Improvements | $15,627,974 | $12,632,551 | $2,995,423 | ||||||||||||
| 2023 | 606130 | Boston Region | Norwood | NORWOOD- INTERSECTION IMPROVEMENTS AT ROUTE 1A & UPLAND ROAD/WASHINGTON STREET & PROSPECT STREET/FULTON STREET | 5 | CMAQ | $8,270,371 | $1,000,000 | $800,000 | $200,000 | Construction; CMAQ+STBG Total Cost = $8,270,371; MPO Evaluation Score = 53 | ||||
| 2023 | 606130 | Boston Region | Norwood | NORWOOD- INTERSECTION IMPROVEMENTS AT ROUTE 1A & UPLAND ROAD/WASHINGTON STREET & PROSPECT STREET/FULTON STREET | 5 | STBG | $8,270,371 | $7,270,371 | $5,816,297 | $1,454,074 | Construction; CMAQ+STBG Total Cost = $8,270,371; MPO Evaluation Score = 53 | ||||
| 2023 | 608889 | Boston Region | Framingham | FRAMINGHAM- TRAFFIC SIGNAL INSTALLATION AT EDGELL ROAD AT CENTRAL STREET | 3 | CMAQ | $2,655,882 | $1,680,000 | $1,344,000 | $336,000 | Construction; CMAQ+STBG Total Cost = $2,655,882; MPO Evaluation Score = 41 | ||||
| 2023 | 608889 | Boston Region | Framingham | FRAMINGHAM- TRAFFIC SIGNAL INSTALLATION AT EDGELL ROAD AT CENTRAL STREET | 3 | STBG | $2,655,882 | $975,882 | $780,706 | $195,176 | Construction; CMAQ+STBG Total Cost = $2,655,882; MPO Evaluation Score = 41 | ||||
| 2023 | 609253 | Boston Region | Wilmington | WILMINGTON- INTERSECTION IMPROVEMENTS AT LOWELL STREET (ROUTE 129) AND WOBURN STREET | 4 | CMAQ | $4,701,721 | $3,400,000 | $2,720,000 | $680,000 | Construction; CMAQ+HSIP Total Cost = $4,701,721; MPO Evaluation Score = 53 | ||||
| 2023 | 609253 | Boston Region | Wilmington | WILMINGTON- INTERSECTION IMPROVEMENTS AT LOWELL STREET (ROUTE 129) AND WOBURN STREET | 4 | HSIP | $4,701,721 | $1,301,721 | $1,171,549 | $130,172 | Construction; CMAQ+HSIP Total Cost = $4,701,721; MPO Evaluation Score = 53 | ||||
| Roadway Reconstruction | $91,280,355 | $73,374,284 | $17,906,071 | ||||||||||||
| 2023 | 606226 | Boston Region | Boston | BOSTON- RECONSTRUCTION OF RUTHERFORD AVENUE, FROM CITY SQUARE TO SULLIVAN SQUARE | 6 | NHPP | $183,633,774 | $13,000,000 | $10,400,000 | $2,600,000 | Construction; NHPP+STBG+TAP Total Cost = $183,633,774; AC schedule over 5 years (2023-2027); Total funding in this TIP = $125,744,000; $25,000,000 in anticipated funding provided by City of Boston; MPO Evaluation Score = 59; TAP Proponent = Boston | ||||
| 2023 | 606226 | Boston Region | Boston | BOSTON- RECONSTRUCTION OF RUTHERFORD AVENUE, FROM CITY SQUARE TO SULLIVAN SQUARE | 6 | STBG | $183,633,774 | $15,741,203 | $12,592,962 | $3,148,241 | Construction; NHPP+STBG+TAP Total Cost = $183,633,774; AC schedule over 5 years (2023-2027); Total funding in this TIP = $125,744,000; $25,000,000 in anticipated funding provided by City of Boston; MPO Evaluation Score = 59; TAP Proponent = Boston | ||||
| 2023 | 606226 | Boston Region | Boston | BOSTON- RECONSTRUCTION OF RUTHERFORD AVENUE, FROM CITY SQUARE TO SULLIVAN SQUARE | 6 | TAP | $183,633,774 | $1,000,000 | $800,000 | $200,000 | Construction; NHPP+STBG+TAP Total Cost = $183,633,774; AC schedule over 5 years (2023-2027); Total funding in this TIP = $125,744,000; $25,000,000 in anticipated funding provided by City of Boston; MPO Evaluation Score = 59; TAP Proponent = Boston | ||||
| 2023 | 606453 | Boston Region | Boston | BOSTON- IMPROVEMENTS ON BOYLSTON STREET, FROM INTERSECTION OF BROOKLINE AVENUE & PARK DRIVE TO IPSWICH STREET | 6 | CMAQ | $8,665,052 | $1,000,000 | $800,000 | $200,000 | Construction; CMAQ+TAP+STBG Total Cost = $8,665,052; MPO Evaluation Score = 58; TAP Proponent = Boston | ||||
| 2023 | 606453 | Boston Region | Boston | BOSTON- IMPROVEMENTS ON BOYLSTON STREET, FROM INTERSECTION OF BROOKLINE AVENUE & PARK DRIVE TO IPSWICH STREET | 6 | STBG | $8,665,052 | $6,852,620 | $5,482,096 | $1,370,524 | Construction; CMAQ+TAP+STBG Total Cost = $8,665,052; MPO Evaluation Score = 58; TAP Proponent = Boston | ||||
| 2023 | 606453 | Boston Region | Boston | BOSTON- IMPROVEMENTS ON BOYLSTON STREET, FROM INTERSECTION OF BROOKLINE AVENUE & PARK DRIVE TO IPSWICH STREET | 6 | TAP | $8,665,052 | $812,432 | $649,946 | $162,486 | Construction; CMAQ+TAP+STBG Total Cost = $8,665,052; MPO Evaluation Score = 58; TAP Proponent = Boston | ||||
| 2023 | 607244 | Boston Region | Winthrop | WINTHROP- RECONSTRUCTION & RELATED WORK ALONG WINTHROP STREET & REVERE STREET CORRIDOR | 6 | CMAQ | $5,931,953 | $2,000,000 | $1,600,000 | $400,000 | Construction; CMAQ+STBG+TAP Total Cost = $5,931,953; MPO Evaluation Score = 54; TAP Proponent = Winthrop | ||||
| 2023 | 607244 | Boston Region | Winthrop | WINTHROP- RECONSTRUCTION & RELATED WORK ALONG WINTHROP STREET & REVERE STREET CORRIDOR | 6 | STBG | $5,931,953 | $3,371,953 | $2,697,562 | $674,391 | Construction; CMAQ+STBG+TAP Total Cost = $5,931,953; MPO Evaluation Score = 54; TAP Proponent = Winthrop | ||||
| 2023 | 607244 | Boston Region | Winthrop | WINTHROP- RECONSTRUCTION & RELATED WORK ALONG WINTHROP STREET & REVERE STREET CORRIDOR | 6 | TAP | $5,931,953 | $560,000 | $448,000 | $112,000 | Construction; CMAQ+STBG+TAP Total Cost = $5,931,953; MPO Evaluation Score = 54; TAP Proponent = Winthrop | ||||
| 2023 | 607777 | Boston Region | Watertown | WATERTOWN- REHABILITATION OF MOUNT AUBURN STREET (ROUTE 16) | 6 | CMAQ | $28,340,090 | $1,000,000 | $800,000 | $200,000 | Construction; HSIP+CMAQ+STBG Total Cost = $28,340,090; 2-year AC schedule (2023-2024); MPO Evaluation Score = 75 | ||||
| 2023 | 607777 | Boston Region | Watertown | WATERTOWN- REHABILITATION OF MOUNT AUBURN STREET (ROUTE 16) | 6 | HSIP | $28,340,090 | $2,000,000 | $1,800,000 | $200,000 | Construction; HSIP+CMAQ+STBG Total Cost = $28,340,090; 2-year AC schedule (2023-2024); MPO Evaluation Score = 75 | ||||
| 2023 | 607777 | Boston Region | Watertown | WATERTOWN- REHABILITATION OF MOUNT AUBURN STREET (ROUTE 16) | 6 | STBG | $28,340,090 | $9,169,621 | $7,335,697 | $1,833,924 | Construction; HSIP+CMAQ+STBG Total Cost = $28,340,090; 2-year AC schedule (2023-2024); MPO Evaluation Score = 75 | ||||
| 2023 | 607899 | Boston Region | Dedham | DEDHAM- PEDESTRIAN IMPROVEMENTS ALONG BUSSEY STREET, INCLUDING SUPERSTRUCTURE REPLACEMENT, D-05-010, BUSSEY STREET OVER MOTHER BROOK | 6 | STBG | $5,157,564 | $4,630,368 | $3,704,294 | $926,074 | Construction; STBG+TAP Total Cost = $5,157,564; MPO Evaluation Score = 35; TAP Proponent = Dedham | ||||
| 2023 | 607899 | Boston Region | Dedham | DEDHAM- PEDESTRIAN IMPROVEMENTS ALONG BUSSEY STREET, INCLUDING SUPERSTRUCTURE REPLACEMENT, D-05-010, BUSSEY STREET OVER MOTHER BROOK | 6 | TAP | $5,157,564 | $527,196 | $421,757 | $105,439 | Construction; STBG+TAP Total Cost = $5,157,564; MPO Evaluation Score = 35; TAP Proponent = Dedham | ||||
| 2023 | 608348 | Boston Region | Beverly | BEVERLY- RECONSTRUCTION OF BRIDGE STREET | 4 | CMAQ | $7,942,866 | $3,000,000 | $2,400,000 | $600,000 | Construction; CMAQ+STBG Total Cost = $7,942,866; MPO Evaluation Score = 66 | ||||
| 2023 | 608348 | Boston Region | Beverly | BEVERLY- RECONSTRUCTION OF BRIDGE STREET | 4 | STBG | $7,942,866 | $4,942,866 | $3,954,293 | $988,573 | Construction; CMAQ+STBG Total Cost = $7,942,866; MPO Evaluation Score = 66 | ||||
| 2023 | 608707 | Boston Region | Quincy | QUINCY- RECONSTRUCTION OF SEA STREET | 6 | STBG | $5,843,442 | $5,617,188 | $4,493,750 | $1,123,438 | Construction; STBG+TAP Total Cost = $5,843,442; MPO Evaluation Score = 40; TAP Project Proponent = Quincy | ||||
| 2023 | 608707 | Boston Region | Quincy | QUINCY- RECONSTRUCTION OF SEA STREET | 6 | TAP | $5,843,442 | $226,254 | $181,003 | $45,251 | Construction; STBG+TAP Total Cost = $5,843,442; MPO Evaluation Score = 40; TAP Project Proponent = Quincy | ||||
| 2023 | 608933 | Boston Region | Peabody | PEABODY- REHABILITATION OF CENTRAL STREET | 4 | CMAQ | $15,828,654 | $3,000,000 | $2,400,000 | $600,000 | Construction; CMAQ+HSIP+STBG Total Cost = $15,828,654; MPO Evaluation Score = 61 | ||||
| 2023 | 608933 | Boston Region | Peabody | PEABODY- REHABILITATION OF CENTRAL STREET | 4 | HSIP | $15,828,654 | $1,500,000 | $1,350,000 | $150,000 | Construction; CMAQ+HSIP+STBG Total Cost = $15,828,654; MPO Evaluation Score = 61 | ||||
| 2023 | 608933 | Boston Region | Peabody | PEABODY- REHABILITATION OF CENTRAL STREET | 4 | STBG | $15,828,654 | $11,328,654 | $9,062,923 | $2,265,731 | Construction; CMAQ+HSIP+STBG Total Cost = $15,828,654; MPO Evaluation Score = 61 | ||||
| Transit Grant Program | $2,000,000 | $1,600,000 | $400,000 | ||||||||||||
| 2023 | S12114 | Boston Region | Canton | ROYALL STREET SHUTTLE | 6 | CMAQ | $534,820 | $177,177 | $141,742 | $35,435 | Operations; CMAQ Total Cost = $534,820; MPO Evaluation Score = 51; Project funded through MPO's Community Connections Program. | ||||
| 2023 | S12124 | Boston Region | Multiple | COMMUNITY CONNECTIONS PROGRAM | Regionwide | CMAQ | $7,522,281 | $1,670,823 | $1,336,658 | $334,165 | Planning, Design, or Construction; Set Aside for LRTP Community Connections Program | ||||
| 2023 | S12125 | Boston Region | Newton | NEWTON MICROTRANSIT SERVICE | 6 | CMAQ | $427,000 | $152,000 | $121,600 | $30,400 | Operations; CMAQ Total Cost = $727,000; MPO Evaluation Score = 53; Project funded over three fiscal years (2021-2023)through MPO's Community Connections Program. | ||||
| Section 1B / Earmark or Discretionary Grant Funded Projects | $51,607,808 | $41,286,246 | $10,321,562 | ||||||||||||
| Earmark Discretionary | $51,607,808 | $41,286,246 | $10,321,562 | ||||||||||||
| 2023 | 606476 | Boston Region | Boston | BOSTON- ROADWAY, CEILING, ARCH & WALL RECONSTRUCTION AND OTHER CONTROL SYSTEMS IN SUMNER TUNNEL | 6 | NHPP-E | $136,722,750 | $11,607,808 | $9,286,246 | $2,321,562 | Construction; NHPP+HSIP+Other Federal Aid Total Cost = $126,544,931; Total MPO Contribution = $22,115,687; AC schedule over 3 years (2021-2023). MPO funding has 2-year AC schedule (2021-22). | ||||
| 2023 | 607977 | Boston Region | Multiple | HOPKINTON- WESTBOROUGH- RECONSTRUCTION OF I-90/I-495 INTERCHANGE | 3 | HIP-BR | $285,366,126 | $40,000,000 | $32,000,000 | $8,000,000 | Other FA - SW HIP: $6,784,226 (FY 2022); HIP Boston: $5,176,619 (FY 2022); BUILD Grant: $26,250,000 (FY 2022); HIP BR: $40,000,000 (FY 2023); $111,166,667 WT Funding | ||||
| Section 2A / State Prioritized Reliability Projects | $82,297,337 | $68,887,030 | $13,410,307 | ||||||||||||
| Bridge On-system NHS | $19,277,046 | $15,421,637 | $3,855,409 | ||||||||||||
| 2023 | 606902 | Boston Region | Boston | BOSTON- BRIDGE RECONSTRUCTION/REHAB, B-16-181, WEST ROXBURY PARKWAY OVER MBTA | 6 | NHPP | $6,644,290 | $6,644,290 | $5,315,432 | $1,328,858 | |||||
| 2023 | 607327 | Boston Region | Wilmington | WILMINGTON- BRIDGE REPLACEMENT, W-38-002, ROUTE 38 (MAIN STREET) OVER THE B&M RAILROAD | 4 | NHPP | $13,127,334 | $12,632,756 | $10,106,205 | $2,526,551 | |||||
| Interstate Pavement | $24,419,044 | $21,977,140 | $2,441,904 | ||||||||||||
| 2023 | 608208 | Boston Region | Multiple | QUINCY- MILTON- BOSTON- INTERSTATE MAINTENANCE & RELATED WORK ON I-93 | 6 | NHPP-I | $24,419,044 | $24,419,044 | $21,977,140 | $2,441,904 | |||||
| Bridge Off-system | $3,592,584 | $2,874,067 | $718,517 | ||||||||||||
| 2023 | 608255 | Boston Region | Stow | STOW- BRIDGE REPLACEMENT, S-29-011, BOX MILL ROAD OVER ELIZABETH BROOK | 3 | STBG-BR-Off | $3,592,584 | $3,592,584 | $2,874,067 | $718,517 | |||||
| Non-Interstate Pavement | $16,481,993 | $13,185,594 | $3,296,399 | ||||||||||||
| 2023 | 608480 | Boston Region | Foxborough | FOXBOROUGH- RESURFACING AND RELATED WORK ON ROUTE 1 | 5 | NHPP | $7,169,843 | $7,169,843 | $5,735,874 | $1,433,969 | |||||
| 2023 | 608498 | Boston Region | Multiple | QUINCY- WEYMOUTH- BRAINTREE- RESURFACING AND RELATED WORK ON ROUTE 53 | 6 | NHPP | $8,178,768 | $8,178,768 | $6,543,014 | $1,635,754 | |||||
| 2023 | 608818 | Boston Region | Danvers | DANVERS- RESURFACING AND RELATED WORK ON ROUTE 114 | 4 | NHPP | $1,133,382 | $1,133,382 | $906,706 | $226,676 | |||||
| Safety Improvements | $11,116,611 | $9,500,545 | $1,616,066 | ||||||||||||
| 2023 | 608562 | Boston Region | Somerville | SOMERVILLE- SIGNAL AND INTERSECTION IMPROVEMENT ON I-93 AT MYSTIC AVENUE AND MCGRATH HIGHWAY (TOP 200 CRASH LOCATION) | 4 | HSIP | $6,122,559 | $6,072,559 | $5,465,303 | $607,256 | |||||
| 2023 | 609053 | Boston Region | Multiple | CANTON- DEDHAM- NORWOOD- HIGHWAY LIGHTING IMPROVEMENTS AT I-93 & I-95/128 | 6 | NHPP | $5,044,052 | $5,044,052 | $4,035,242 | $1,008,810 | |||||
| Bridge Systematic Maintenance | $2,228,571 | $1,782,857 | $445,714 | ||||||||||||
| 2023 | 608609 | Boston Region | Multiple | NEWTON- WESTWOOD- STEEL SUPERSTRUCTURE CLEANING (FULL REMOVAL) AND PAINTING OF 2 BRIDGES: N-12-056 & W-31-006 | 6 | NHPP | $2,228,571 | $2,228,571 | $1,782,857 | $445,714 | |||||
| Bridge On-system Non-NHS | $5,181,488 | $4,145,190 | $1,036,298 | ||||||||||||
| 2023 | 608929 | Boston Region | Wilmington | WILMINGTON- BRIDGE REPLACEMENT, W-38-003, BUTTERS ROW OVER MBTA | 4 | STBG | $5,181,488 | $5,181,488 | $4,145,190 | $1,036,298 | |||||
| Section 2B / State Prioritized Modernization Projects | $26,298,184 | $22,993,466 | $3,304,719 | ||||||||||||
| Roadway Reconstruction | $19,181,213 | $16,588,192 | $2,593,021 | ||||||||||||
| 2023 | 606476 | Boston Region | Boston | BOSTON- ROADWAY, CEILING, ARCH & WALL RECONSTRUCTION AND OTHER CONTROL SYSTEMS IN SUMNER TUNNEL | 6 | NHPP | $136,722,750 | $5,261,993 | $4,209,594 | $1,052,399 | Construction; NHPP+HSIP+Other Federal Aid Total Cost = $126,544,931; Total MPO Contribution = $22,115,687; AC schedule over 3 years (2021-2023). MPO funding has 2-year AC schedule (2021-22). | ||||
| 2023 | 607977 | Boston Region | Multiple | HOPKINTON- WESTBOROUGH- RECONSTRUCTION OF I-90/I-495 INTERCHANGE | 3 | NFP-I | $285,366,126 | $12,432,212 | $11,188,991 | $1,243,221 | Other FA - SW HIP: $6,784,226 (FY 2022); HIP Boston: $5,176,619 (FY 2022); BUILD Grant: $26,250,000 (FY 2022); HIP BR: $40,000,000 (FY 2023); $111,166,667 WT Funding | ||||
| 2023 | 609530 | Boston Region | Medway | MEDWAY- HOLLISTON STREET AND CASSIDY LANE IMPROVEMENTS (SRTS) | 3 | TAP | $1,487,008 | $1,487,008 | $1,189,606 | $297,402 | |||||
| Intersection Improvements | $7,116,971 | $6,405,274 | $711,697 | ||||||||||||
| 2023 | 607342 | Boston Region | Milton | MILTON- INTERSECTION & SIGNAL IMPROVEMENTS AT ROUTE 28 (RANDOLPH AVENUE) & CHICKATAWBUT ROAD | 6 | HSIP | $7,066,971 | $7,066,971 | $6,360,274 | $706,697 | |||||
| 2023 | 608562 | Boston Region | Somerville | SOMERVILLE- SIGNAL AND INTERSECTION IMPROVEMENT ON I-93 AT MYSTIC AVENUE AND MCGRATH HIGHWAY (TOP 200 CRASH LOCATION) | 4 | HSIP | $6,122,559 | $50,000 | $45,000 | $5,000 | |||||
| Section 2C / State Prioritized Expansion Projects | $6,677,858 | $5,342,286 | $1,335,572 | ||||||||||||
| Bicycle and Pedestrian | $6,677,858 | $5,342,286 | $1,335,572 | ||||||||||||
| 2023 | 610674 | Boston Region | Newton | NEWTON- RECONSTRUCTION OF COMMONWEALTH AVENUE (ROUTE 30), FROM EAST OF AUBURN STREET TO ASH STREET | 6 | CMAQ | $6,677,858 | $6,677,858 | $5,342,286 | $1,335,572 | |||||
| Year | MassDOT Project ID | MPO | Municipality | MassDOT Project Description | District | Funding Source | Adjusted TFPC | Total Programmed Funds | Federal Funds | Non-Federal Funds | Other Information | ||||
| Federal Fiscal Year 2024 | $216,037,614 | $178,696,769 | $37,340,845 | ||||||||||||
| Section 1A / Regionally Prioritized Projects | $110,440,638 | $89,152,510 | $21,288,128 | ||||||||||||
| Intersection Improvements | $17,456,745 | $14,215,396 | $3,241,349 | ||||||||||||
| 2024 | 603739 | Boston Region | Wrentham | WRENTHAM- CONSTRUCTION OF ROUTE I-495/ROUTE 1A RAMPS | 5 | HSIP | $16,187,418 | $2,500,000 | $2,250,000 | $250,000 | Construction; HSIP+STBG+TAP Total Cost = $16,187,418; MPO Evaluation Score = 55; TAP Proponent = MassDOT | ||||
| 2024 | 603739 | Boston Region | Wrentham | WRENTHAM- CONSTRUCTION OF ROUTE I-495/ROUTE 1A RAMPS | 5 | STBG | $16,187,418 | $13,187,418 | $10,549,934 | $2,637,484 | Construction; HSIP+STBG+TAP Total Cost = $16,187,418; MPO Evaluation Score = 55; TAP Proponent = MassDOT | ||||
| 2024 | 603739 | Boston Region | Wrentham | WRENTHAM- CONSTRUCTION OF ROUTE I-495/ROUTE 1A RAMPS | 5 | TAP | $16,187,418 | $500,000 | $400,000 | $100,000 | Construction; HSIP+STBG+TAP Total Cost = $16,187,418; MPO Evaluation Score = 55; TAP Proponent = MassDOT | ||||
| 2024 | 608436 | Boston Region | ASHLAND- REHABILITATION AND RAIL CROSSING IMPROVEMENTS ON CHERRY STREET | 3 | STBG | $1,269,327 | $1,269,327 | $1,015,462 | $253,865 | Construction; STBG Total Cost = $1,269,327; MPO Evaluation Score = 38 | |||||
| Roadway Reconstruction | $87,735,523 | $70,738,418 | $16,997,105 | ||||||||||||
| 2024 | 605743 | Boston Region | Ipswich | IPSWICH- RESURFACING & RELATED WORK ON CENTRAL & SOUTH MAIN STREETS | 4 | STBG | $5,702,076 | $5,182,526 | $4,146,021 | $1,036,505 | Construction; STBG+TAP Total Cost = $5,702,076; MPO Evaluation Score = 47; TAP Proponent = Ipswich | ||||
| 2024 | 605743 | Boston Region | Ipswich | IPSWICH- RESURFACING & RELATED WORK ON CENTRAL & SOUTH MAIN STREETS | 4 | TAP | $5,702,076 | $519,550 | $415,640 | $103,910 | Construction; STBG+TAP Total Cost = $5,702,076; MPO Evaluation Score = 47; TAP Proponent = Ipswich | ||||
| 2024 | 606226 | Boston Region | Boston | BOSTON- RECONSTRUCTION OF RUTHERFORD AVENUE, FROM CITY SQUARE TO SULLIVAN SQUARE | 6 | NHPP | $183,633,774 | $8,500,000 | $6,800,000 | $1,700,000 | Construction; NHPP+STBG+TAP Total Cost = $183,633,774; AC schedule over 5 years (2023-2027); Total funding in this TIP = $125,744,000; $25,000,000 in anticipated funding provided by City of Boston; MPO Evaluation Score = 59; TAP Proponent = Boston | ||||
| 2024 | 606226 | Boston Region | Boston | BOSTON- RECONSTRUCTION OF RUTHERFORD AVENUE, FROM CITY SQUARE TO SULLIVAN SQUARE | 6 | STBG | $183,633,774 | $20,946,838 | $16,757,470 | $4,189,368 | Construction; NHPP+STBG+TAP Total Cost = $183,633,774; AC schedule over 5 years (2023-2027); Total funding in this TIP = $125,744,000; $25,000,000 in anticipated funding provided by City of Boston; MPO Evaluation Score = 59; TAP Proponent = Boston | ||||
| 2024 | 606226 | Boston Region | Boston | BOSTON- RECONSTRUCTION OF RUTHERFORD AVENUE, FROM CITY SQUARE TO SULLIVAN SQUARE | 6 | TAP | $183,633,774 | $1,000,000 | $800,000 | $200,000 | Construction; NHPP+STBG+TAP Total Cost = $183,633,774; AC schedule over 5 years (2023-2027); Total funding in this TIP = $125,744,000; $25,000,000 in anticipated funding provided by City of Boston; MPO Evaluation Score = 59; TAP Proponent = Boston | ||||
| 2024 | 607777 | Boston Region | Watertown | WATERTOWN- REHABILITATION OF MOUNT AUBURN STREET (ROUTE 16) | 6 | STBG | $28,340,090 | $16,170,469 | $12,936,375 | $3,234,094 | Construction; HSIP+CMAQ+STBG Total Cost = $28,340,090; 2-year AC schedule (2023-2024); MPO Evaluation Score = 75 | ||||
| 2024 | 608007 | Boston Region | Multiple | COHASSET- SCITUATE- CORRIDOR IMPROVEMENTS AND RELATED WORK ON JUSTICE CUSHING HIGHWAY (ROUTE 3A), FROM BEECHWOOD STREET TO HENRY TURNER BAILEY ROAD | 5 | HSIP | $12,990,931 | $1,500,000 | $1,350,000 | $150,000 | Construction; HSIP+STBG+TAP Total Cost = $12,990,391; MPO Evaluation Score = 37; TAP Proponent = MassDOT | ||||
| 2024 | 608007 | Boston Region | Multiple | COHASSET- SCITUATE- CORRIDOR IMPROVEMENTS AND RELATED WORK ON JUSTICE CUSHING HIGHWAY (ROUTE 3A), FROM BEECHWOOD STREET TO HENRY TURNER BAILEY ROAD | 5 | STBG | $12,990,931 | $11,350,699 | $9,080,559 | $2,270,140 | Construction; HSIP+STBG+TAP Total Cost = $12,990,391; MPO Evaluation Score = 37; TAP Proponent = MassDOT | ||||
| 2024 | 608007 | Boston Region | Multiple | COHASSET- SCITUATE- CORRIDOR IMPROVEMENTS AND RELATED WORK ON JUSTICE CUSHING HIGHWAY (ROUTE 3A), FROM BEECHWOOD STREET TO HENRY TURNER BAILEY ROAD | 5 | TAP | $12,990,931 | $140,232 | $112,186 | $28,046 | Construction; HSIP+STBG+TAP Total Cost = $12,990,391; MPO Evaluation Score = 37; TAP Proponent = MassDOT | ||||
| 2024 | 609054 | Boston Region | Littleton | LITTLETON- RECONSTRUCTION OF FOSTER STREET | 3 | CMAQ | $4,146,209 | $1,000,000 | $800,000 | $200,000 | Construction; CMAQ+TAP+STBG Total Cost = $4,146,209; MPO Evaluation Score = 38; TAP Proponent = Littleton | ||||
| 2024 | 609054 | Boston Region | Littleton | LITTLETON- RECONSTRUCTION OF FOSTER STREET | 3 | STBG | $4,146,209 | $2,646,209 | $2,116,967 | $529,242 | Construction; CMAQ+TAP+STBG Total Cost = $4,146,209; MPO Evaluation Score = 38; TAP Proponent = Littleton | ||||
| 2024 | 609054 | Boston Region | Littleton | LITTLETON- RECONSTRUCTION OF FOSTER STREET | 3 | TAP | $4,146,209 | $500,000 | $400,000 | $100,000 | Construction; CMAQ+TAP+STBG Total Cost = $4,146,209; MPO Evaluation Score = 38; TAP Proponent = Littleton | ||||
| 2024 | 609252 | Boston Region | Lynn | LYNN- REHABILITATION OF ESSEX STREET | 4 | CMAQ | $18,279,000 | $6,000,000 | $4,800,000 | $1,200,000 | Construction; CMAQ+HSIP+STBG Total Cost = $18,279,000; MPO Evaluation Score = 66 | ||||
| 2024 | 609252 | Boston Region | Lynn | LYNN- REHABILITATION OF ESSEX STREET | 4 | HSIP | $18,279,000 | $4,000,000 | $3,600,000 | $400,000 | Construction; CMAQ+HSIP+STBG Total Cost = $18,279,000; MPO Evaluation Score = 66 | ||||
| 2024 | 609252 | Boston Region | Lynn | LYNN- REHABILITATION OF ESSEX STREET | 4 | STBG | $18,279,000 | $8,279,000 | $6,623,200 | $1,655,800 | Construction; CMAQ+HSIP+STBG Total Cost = $18,279,000; MPO Evaluation Score = 66 | ||||
| Bicycle and Pedestrian | $3,248,370 | $2,598,696 | $649,674 | ||||||||||||
| 2024 | 609211 | Boston Region | Peabody | PEABODY- INDEPENDENCE GREENWAY EXTENSION | 4 | CMAQ | $3,248,370 | $1,972,500 | $1,578,000 | $394,500 | Construction; CMAQ+TAP Total Cost = $3,248,370; MPO Evaluation Score = 34; TAP Proponent = Peabody | ||||
| 2024 | 609211 | Boston Region | Peabody | PEABODY- INDEPENDENCE GREENWAY EXTENSION | 4 | TAP | $3,248,370 | $1,275,870 | $1,020,696 | $255,174 | Construction; CMAQ+TAP Total Cost = $3,248,370; MPO Evaluation Score = 34; TAP Proponent = Peabody | ||||
| Transit Grant Program | $2,000,000 | $1,600,000 | $400,000 | ||||||||||||
| 2024 | S12114 | Boston Region | Canton | ROYALL STREET SHUTTLE | 6 | CMAQ | $534,820 | $148,542 | $118,834 | $29,708 | Operations; CMAQ Total Cost = $534,820; MPO Evaluation Score = 51; Project funded through MPO's Community Connections Program. | ||||
| 2024 | S12124 | Boston Region | Multiple | COMMUNITY CONNECTIONS PROGRAM | Regionwide | CMAQ | $7,522,281 | $1,851,458 | $1,481,166 | $370,292 | Planning, Design, or Construction; Set Aside for LRTP Community Connections Program | ||||
| Section 1B / Earmark or Discretionary Grant Funded Projects | $25,917,561 | $20,734,049 | $5,183,512 | ||||||||||||
| Earmark Discretionary | $25,917,561 | $20,734,049 | $5,183,512 | ||||||||||||
| 2024 | 607977 | Boston Region | Multiple | HOPKINTON- WESTBOROUGH- RECONSTRUCTION OF I-90/I-495 INTERCHANGE | 3 | HIP-BR | $285,366,126 | $25,917,561 | $20,734,049 | $5,183,512 | Other FA - SW HIP: $6,784,226 (FY 2022); HIP Boston: $5,176,619 (FY 2022); BUILD Grant: $26,250,000 (FY 2022); HIP BR: $40,000,000 (FY 2023); $111,166,667 WT Funding | ||||
| Section 2A / State Prioritized Reliability Projects | $38,102,340 | $31,602,880 | $6,499,461 | ||||||||||||
| Bridge On-system Non-NHS | $8,605,030 | $6,884,024 | $1,721,006 | ||||||||||||
| 2024 | 608197 | Boston Region | Boston | BOSTON- BRIDGE REHABILITATION, B-16-107, CANTERBURY STREET OVER AMTRAK RAILROAD | 6 | STBG | $4,678,193 | $4,678,193 | $3,742,554 | $935,639 | |||||
| 2024 | 608522 | Boston Region | Middleton | MIDDLETON- BRIDGE REPLACEMENT, M-20-003, ROUTE 62 (MAPLE STREET) OVER IPSWICH RIVER | 4 | STBG | $3,926,837 | $3,926,837 | $3,141,470 | $785,367 | |||||
| Non-Interstate Pavement | $6,930,814 | $5,544,651 | $1,386,163 | ||||||||||||
| 2024 | 609399 | Boston Region | Randolph | RANDOLPH- RESURFACING AND RELATED WORK ON ROUTE 28 | 6 | NHPP | $6,930,814 | $6,930,814 | $5,544,651 | $1,386,163 | |||||
| Bridge Off-system | $5,874,329 | $4,699,463 | $1,174,866 | ||||||||||||
| 2024 | 609438 | Boston Region | Canton | CANTON- BRIDGE REPLACEMENT, C-02-042, REVERE COURT OVER WEST BRANCH OF THE NEPONSET RIVER | 6 | STBG-BR-Off | $2,617,932 | $2,617,932 | $2,094,346 | $523,586 | |||||
| 2024 | 609467 | Boston Region | Multiple | HAMILTON- BRIDGE REPLACEMENT, H-03-002, WINTHROP STREET OVER IPSWICH RIVER | 4 | STBG-BR-Off | $3,256,397 | $3,256,397 | $2,605,118 | $651,279 | |||||
| Bridge On-system NHS | $5,482,092 | $4,385,674 | $1,096,418 | ||||||||||||
| 2024 | 610782 | Boston Region | Multiple | DANVERS-MIDDLETON - BRIDGE REPLACEMENT, D-03-009=M-20-005, ANDOVER STREET (SR 114) OVER IPSWICH RIVER | 4 | NHPP | $5,482,092 | $5,482,092 | $4,385,674 | $1,096,418 | |||||
| Interstate Pavement | $11,210,075 | $10,089,068 | $1,121,008 | ||||||||||||
| 2024 | 612034 | Boston Region | Multiple | BURLINGTON- WOBURN- INTERSTATE MAINTENANCE AND RELATED WORK ON I-95 | 4 | NHPP-I | $11,210,075 | $11,210,075 | $10,089,068 | $1,121,008 | |||||
| Section 2B / State Prioritized Modernization Projects | $41,577,075 | $37,207,330 | $4,369,745 | ||||||||||||
| Roadway Reconstruction | $35,730,602 | $31,945,505 | $3,785,097 | ||||||||||||
| 2024 | 607977 | Boston Region | Multiple | HOPKINTON- WESTBOROUGH- RECONSTRUCTION OF I-90/I-495 INTERCHANGE | 3 | NFP-I | $285,366,126 | $33,610,230 | $30,249,207 | $3,361,023 | Other FA - SW HIP: $6,784,226 (FY 2022); HIP Boston: $5,176,619 (FY 2022); BUILD Grant: $26,250,000 (FY 2022); HIP BR: $40,000,000 (FY 2023); $111,166,667 WT Funding | ||||
| 2024 | 609531 | Boston Region | Arlington | ARLINGTON- STRATTON SCHOOL IMPROVEMENTS (SRTS) | 4 | TAP | $1,072,752 | $1,072,752 | $858,202 | $214,550 | |||||
| 2024 | 610537 | Boston Region | Boston | BOSTON- ELLIS ELEMENTARY TRAFFIC CALMING (SRTS) | 6 | TAP | $1,047,621 | $1,047,620 | $838,096 | $209,524 | |||||
| Intersection Improvements | $5,846,473 | $5,261,826 | $584,647 | ||||||||||||
| 2024 | 609254 | Boston Region | Lynn | LYNN- INTERSECTION IMPROVEMENTS AT TWO INTERSECTIONS ON BROADWAY | 4 | HSIP | $5,846,473 | $5,846,473 | $5,261,826 | $584,647 | |||||
| Year | MassDOT Project ID | MPO | Municipality | MassDOT Project Description | District | Funding Source | Adjusted TFPC | Total Programmed Funds | Federal Funds | Non-Federal Funds | Other Information | ||||
| Federal Fiscal Year 2025 | $221,194,797 | $184,419,520 | $36,775,277 | ||||||||||||
| Section 1A / Regionally Prioritized Projects | $107,862,383 | $86,853,079 | $21,009,304 | ||||||||||||
| Roadway Reconstruction | $83,180,783 | $67,044,626 | $16,136,157 | ||||||||||||
| 2025 | 605168 | Boston Region | Hingham | HINGHAM- IMPROVEMENTS ON ROUTE 3A FROM OTIS STREET/COLE ROAD INCLUDING SUMMER STREET AND ROTARY; ROCKLAND STREET TO GEORGE WASHINGTON BOULEVARD. | 5 | STBG | $15,474,200 | $13,974,200 | $11,179,360 | $2,794,840 | Construction; TAP+STBG Total Cost = $15,474,200; MPO Evaluation Score = 55; TAP Proponent = Hingham | ||||
| 2025 | 605168 | Boston Region | Hingham | HINGHAM- IMPROVEMENTS ON ROUTE 3A FROM OTIS STREET/COLE ROAD INCLUDING SUMMER STREET AND ROTARY; ROCKLAND STREET TO GEORGE WASHINGTON BOULEVARD. | 5 | TAP | $15,474,200 | $1,500,000 | $1,200,000 | $300,000 | Construction; TAP+STBG Total Cost = $15,474,200; MPO Evaluation Score = 55; TAP Proponent = Hingham | ||||
| 2025 | 606226 | Boston Region | Boston | BOSTON- RECONSTRUCTION OF RUTHERFORD AVENUE, FROM CITY SQUARE TO SULLIVAN SQUARE | 6 | NHPP | $183,633,774 | $12,000,000 | $9,600,000 | $2,400,000 | Construction; NHPP+STBG+TAP Total Cost = $183,633,774; AC schedule over 5 years (2023-2027); Total funding in this TIP = $125,744,000; $25,000,000 in anticipated funding provided by City of Boston; MPO Evaluation Score = 59; TAP Proponent = Boston | ||||
| 2025 | 606226 | Boston Region | Boston | BOSTON- RECONSTRUCTION OF RUTHERFORD AVENUE, FROM CITY SQUARE TO SULLIVAN SQUARE | 6 | STBG | $183,633,774 | $18,055,959 | $14,444,767 | $3,611,192 | Construction; NHPP+STBG+TAP Total Cost = $183,633,774; AC schedule over 5 years (2023-2027); Total funding in this TIP = $125,744,000; $25,000,000 in anticipated funding provided by City of Boston; MPO Evaluation Score = 59; TAP Proponent = Boston | ||||
| 2025 | 606226 | Boston Region | Boston | BOSTON- RECONSTRUCTION OF RUTHERFORD AVENUE, FROM CITY SQUARE TO SULLIVAN SQUARE | 6 | TAP | $183,633,774 | $2,000,000 | $1,600,000 | $400,000 | Construction; NHPP+STBG+TAP Total Cost = $183,633,774; AC schedule over 5 years (2023-2027); Total funding in this TIP = $125,744,000; $25,000,000 in anticipated funding provided by City of Boston; MPO Evaluation Score = 59; TAP Proponent = Boston | ||||
| 2025 | 608051 | Boston Region | Wilmington | WILMINGTON- RECONSTRUCTION ON ROUTE 38 (MAIN STREET), FROM ROUTE 62 TO THE WOBURN C.L. | 4 | CMAQ | $25,473,225 | $6,000,000 | $4,800,000 | $1,200,000 | Construction; CMAQ+HSIP+STBG Total Cost = $25,473,225; Project has 2-year AC schedule (2025-26); MPO Evaluation Score = 59 | ||||
| 2025 | 608051 | Boston Region | Wilmington | WILMINGTON- RECONSTRUCTION ON ROUTE 38 (MAIN STREET), FROM ROUTE 62 TO THE WOBURN C.L. | 4 | HSIP | $25,473,225 | $1,000,000 | $900,000 | $100,000 | Construction; CMAQ+HSIP+STBG Total Cost = $25,473,225; Project has 2-year AC schedule (2025-26); MPO Evaluation Score = 59 | ||||
| 2025 | 608051 | Boston Region | Wilmington | WILMINGTON- RECONSTRUCTION ON ROUTE 38 (MAIN STREET), FROM ROUTE 62 TO THE WOBURN C.L. | 4 | STBG | $25,473,225 | $2,000,000 | $1,600,000 | $400,000 | Construction; CMAQ+HSIP+STBG Total Cost = $25,473,225; Project has 2-year AC schedule (2025-26); MPO Evaluation Score = 59 | ||||
| 2025 | 609257 | Boston Region | Everett | EVERETT- RECONSTRUCTION OF BEACHAM STREET | 4 | HSIP | $10,545,024 | $1,000,000 | $900,000 | $100,000 | Construction; HSIP+TAP+STBG Total Cost = $10,545,024; MPO Evaluation Score = 54; TAP Proponent = Everett | ||||
| 2025 | 609257 | Boston Region | Everett | EVERETT- RECONSTRUCTION OF BEACHAM STREET | 4 | STBG | $10,545,024 | $8,045,024 | $6,436,019 | $1,609,005 | Construction; HSIP+TAP+STBG Total Cost = $10,545,024; MPO Evaluation Score = 54; TAP Proponent = Everett | ||||
| 2025 | 609257 | Boston Region | Everett | EVERETT- RECONSTRUCTION OF BEACHAM STREET | 4 | TAP | $10,545,024 | $1,500,000 | $1,200,000 | $300,000 | Construction; HSIP+TAP+STBG Total Cost = $10,545,024; MPO Evaluation Score = 54; TAP Proponent = Everett | ||||
| 2025 | 610662 | Boston Region | Woburn | WOBURN- ROADWAY AND INTERSECTION IMPROVEMENTS AT WOBURN COMMON, ROUTE 38 (MAIN STREET), WINN STREET, PLEASANT STREET AND MONTVALE AVENUE | 4 | HSIP | $16,105,600 | $3,000,000 | $2,700,000 | $300,000 | Construction; HSIP+STBG Total Cost = $16,105,600; MPO Evaluation Score = 75 | ||||
| 2025 | 610662 | Boston Region | Woburn | WOBURN- ROADWAY AND INTERSECTION IMPROVEMENTS AT WOBURN COMMON, ROUTE 38 (MAIN STREET), WINN STREET, PLEASANT STREET AND MONTVALE AVENUE | 4 | STBG | $16,105,600 | $13,105,600 | $10,484,480 | $2,621,120 | Construction; HSIP+STBG Total Cost = $16,105,600; MPO Evaluation Score = 75 | ||||
| Intersection Improvements | $10,612,800 | $8,553,412 | $2,059,388 | ||||||||||||
| 2025 | 605857 | Boston Region | Norwood | NORWOOD- INTERSECTION IMPROVEMENTS AT ROUTE 1 & UNIVERSITY AVENUE/EVERETT STREET | 5 | CMAQ | $25,757,791 | $3,000,000 | $2,400,000 | $600,000 | Construction; HSIP+CMAQ+STBG+NHPP Total Cost = $25,757,791; 2-year AC schedule (2025-26); MPO Evaluation Score = 55 | ||||
| 2025 | 605857 | Boston Region | Norwood | NORWOOD- INTERSECTION IMPROVEMENTS AT ROUTE 1 & UNIVERSITY AVENUE/EVERETT STREET | 5 | HSIP | $25,757,791 | $631,724 | $568,552 | $63,172 | Construction; HSIP+CMAQ+STBG+NHPP Total Cost = $25,757,791; 2-year AC schedule (2025-26); MPO Evaluation Score = 55 | ||||
| 2025 | 605857 | Boston Region | Norwood | NORWOOD- INTERSECTION IMPROVEMENTS AT ROUTE 1 & UNIVERSITY AVENUE/EVERETT STREET | 5 | NHPP | $25,757,791 | $2,873,029 | $2,298,423 | $574,606 | Construction; HSIP+CMAQ+STBG+NHPP Total Cost = $25,757,791; 2-year AC schedule (2025-26); MPO Evaluation Score = 55 | ||||
| 2025 | 605857 | Boston Region | Norwood | NORWOOD- INTERSECTION IMPROVEMENTS AT ROUTE 1 & UNIVERSITY AVENUE/EVERETT STREET | 5 | STBG | $25,757,791 | $2,495,247 | $1,996,198 | $499,049 | Construction; HSIP+CMAQ+STBG+NHPP Total Cost = $25,757,791; 2-year AC schedule (2025-26); MPO Evaluation Score = 55 | ||||
| 2025 | 608067 | Boston Region | Woburn | WOBURN- INTERSECTION RECONSTRUCTION AT ROUTE 3 (CAMBRIDGE ROAD) & BEDFORD ROAD AND SOUTH BEDFORD STREET | 4 | CMAQ | $1,612,800 | $1,612,800 | $1,290,240 | $322,560 | Construction; CMAQ Total Cost = $1,612,800; MPO Evaluation Score = 52 | ||||
| Bicycle and Pedestrian | $6,568,800 | $5,255,040 | $1,313,760 | ||||||||||||
| 2025 | 610544 | Boston Region | Peabody | PEABODY- MULTI-USE PATH CONSTRUCTION OF INDEPENDENCE GREENWAY AT I-95 AND ROUTE 1 | 4 | CMAQ | $6,568,800 | $4,000,000 | $3,200,000 | $800,000 | Construction; CMAQ+TAP Total Cost = $6,568,800; MPO Evaluation Score = 53; TAP Proponent = Peabody | ||||
| 2025 | 610544 | Boston Region | Peabody | PEABODY- MULTI-USE PATH CONSTRUCTION OF INDEPENDENCE GREENWAY AT I-95 AND ROUTE 1 | 4 | TAP | $6,568,800 | $2,568,800 | $2,055,040 | $513,760 | Construction; CMAQ+TAP Total Cost = $6,568,800; MPO Evaluation Score = 53; TAP Proponent = Peabody | ||||
| Flex to FTA | $5,500,000 | $4,400,000 | $1,100,000 | ||||||||||||
| 2025 | S12113 | Boston Region | TRANSIT MODERNIZATION PROGRAM | Regionwide | CMAQ | $11,000,000 | $5,500,000 | $4,400,000 | $1,100,000 | Construction; Flex to FTA; Set aside for LRTP Transit Modernization Program | |||||
| Transit Grant Program | $2,000,000 | $1,600,000 | $400,000 | ||||||||||||
| 2025 | S12124 | Boston Region | Multiple | COMMUNITY CONNECTIONS PROGRAM | Regionwide | CMAQ | $7,522,281 | $2,000,000 | $1,600,000 | $400,000 | Planning, Design, or Construction; Set Aside for LRTP Community Connections Program | ||||
| Section 2A / State Prioritized Reliability Projects | $68,891,728 | $58,171,740 | $10,719,988 | ||||||||||||
| Bridge On-system NHS | $30,464,223 | $24,371,378 | $6,092,845 | ||||||||||||
| 2025 | 608703 | Boston Region | Wilmington | WILMINGTON- BRIDGE REPLACEMENT, W-38-029 (2KV), ST 129 LOWELL STREET OVER I 93 | 4 | NHPP | $16,542,624 | $16,542,624 | $13,234,099 | $3,308,525 | |||||
| 2025 | 610776 | Boston Region | Cambridge | CAMBRIDGE- SUPERSTRUCTURE REPLACEMENT, C-01-031, US ROUTE 3/ROUTE 16/ROUTE 2 OVER MBTA REDLINE | 6 | NHPP | $13,921,599 | $13,921,599 | $11,137,279 | $2,784,320 | |||||
| Safety Improvements | $6,440,001 | $5,796,001 | $644,000 | ||||||||||||
| 2025 | 609532 | Boston Region | Chelsea | CHELSEA- TARGETED SAFETY IMPROVEMENTS AND RELATED WORK ON BROADWAY, FROM WILLIAMS STREET TO CITY HALL AVENUE | 6 | HSIP | $6,440,001 | $6,440,001 | $5,796,001 | $644,000 | |||||
| Non-Interstate Pavement | $7,843,932 | $6,275,146 | $1,568,786 | ||||||||||||
| 2025 | 610722 | Boston Region | Multiple | ACTON- BOXBOROUGH- LITTLETON- PAVEMENT PRESERVATION ROUTE 2 | 3 | NHPP | $7,843,932 | $7,843,932 | $6,275,146 | $1,568,786 | |||||
| Interstate Pavement | $24,143,572 | $21,729,215 | $2,414,357 | ||||||||||||
| 2025 | 610726 | Boston Region | Multiple | MEDFORD- WINCHESTER- STONEHAM- INTERSTATE PAVEMENT PRESERVATION ON I-93 | 4 | NHPP-I | $24,143,572 | $24,143,572 | $21,729,215 | $2,414,357 | |||||
| Section 2B / State Prioritized Modernization Projects | $40,724,988 | $36,422,143 | $4,302,845 | ||||||||||||
| Roadway Reconstruction | $40,724,988 | $36,422,143 | $4,302,845 | ||||||||||||
| 2025 | 607977 | Boston Region | Multiple | HOPKINTON- WESTBOROUGH- RECONSTRUCTION OF I-90/I-495 INTERCHANGE | 3 | NHPP-I | $285,366,126 | $15,000,000 | $13,500,000 | $1,500,000 | Other FA - SW HIP: $6,784,226 (FY 2022); HIP Boston: $5,176,619 (FY 2022); BUILD Grant: $26,250,000 (FY 2022); HIP BR: $40,000,000 (FY 2023); $111,166,667 WT Funding | ||||
| 2025 | 607977 | Boston Region | Multiple | HOPKINTON- WESTBOROUGH- RECONSTRUCTION OF I-90/I-495 INTERCHANGE | 3 | NFP-I | $285,366,126 | $23,421,524 | $21,079,372 | $2,342,152 | Other FA - SW HIP: $6,784,226 (FY 2022); HIP Boston: $5,176,619 (FY 2022); BUILD Grant: $26,250,000 (FY 2022); HIP BR: $40,000,000 (FY 2023); $111,166,667 WT Funding | ||||
| 2025 | 611997 | Boston Region | Newton | NEWTON- HORACE MANN ELEMENTARY SCHOOL IMPROVEMENTS (SRTS) | 6 | TAP | $893,887 | $893,887 | $715,110 | $178,777 | |||||
| 2025 | 612001 | Boston Region | Medford | MEDFORD- MILTON FULLER ROBERTS ELEMENTARY SCHOOL (SRTS) | 4 | TAP | $1,058,663 | $1,058,663 | $846,930 | $211,733 | |||||
| 2025 | 612100 | Boston Region | Revere | REVERE- IMPROVEMENTS AT BEACHMONT VETERANS ELEMENTARY (SRTS) | 4 | TAP | $350,914 | $350,914 | $280,731 | $70,183 | |||||
| Section 2C / State Prioritized Expansion Projects | $3,715,698 | $2,972,558 | $743,140 | ||||||||||||
| Bicycle and Pedestrian | $3,715,698 | $2,972,558 | $743,140 | ||||||||||||
| 2025 | 610680 | Boston Region | Natick | NATICK- LAKE COCHITUATE PATH | 3 | CMAQ | $3,715,699 | $3,715,698 | $2,972,558 | $743,140 | |||||
| Year | MassDOT Project ID | MPO | Municipality | MassDOT Project Description | District | Funding Source | Adjusted TFPC | Total Programmed Funds | Federal Funds | Non-Federal Funds | Other Information | ||||
| Federal Fiscal Year 2026 | $180,904,954 | $149,472,209 | $31,432,745 | ||||||||||||
| Section 1A / Regionally Prioritized Projects | $84,712,046 | $67,869,637 | $16,842,409 | ||||||||||||
| Intersection Improvements | $16,757,791 | $13,406,233 | $3,351,558 | ||||||||||||
| 2026 | 605857 | Boston Region | Norwood | NORWOOD- INTERSECTION IMPROVEMENTS AT ROUTE 1 & UNIVERSITY AVENUE/EVERETT STREET | 5 | STBG | $25,757,791 | $16,757,791 | $13,406,233 | $3,351,558 | Construction; HSIP+CMAQ+STBG+NHPP Total Cost = $25,757,791; 2-year AC schedule (2025-26); MPO Evaluation Score = 55 | ||||
| Roadway Reconstruction | $60,454,255 | $48,463,404 | $11,990,851 | ||||||||||||
| 2026 | 606226 | Boston Region | Boston | BOSTON- RECONSTRUCTION OF RUTHERFORD AVENUE, FROM CITY SQUARE TO SULLIVAN SQUARE | 6 | NHPP | $183,633,774 | $12,000,000 | $9,600,000 | $2,400,000 | Construction; NHPP+STBG+TAP Total Cost = $183,633,774; AC schedule over 5 years (2023-2027); Total funding in this TIP = $125,744,000; $25,000,000 in anticipated funding provided by City of Boston; MPO Evaluation Score = 59; TAP Proponent = Boston | ||||
| 2026 | 606226 | Boston Region | Boston | BOSTON- RECONSTRUCTION OF RUTHERFORD AVENUE, FROM CITY SQUARE TO SULLIVAN SQUARE | 6 | STBG | $183,633,774 | $19,500,000 | $15,600,000 | $3,900,000 | Construction; NHPP+STBG+TAP Total Cost = $183,633,774; AC schedule over 5 years (2023-2027); Total funding in this TIP = $125,744,000; $25,000,000 in anticipated funding provided by City of Boston; MPO Evaluation Score = 59; TAP Proponent = Boston | ||||
| 2026 | 606226 | Boston Region | Boston | BOSTON- RECONSTRUCTION OF RUTHERFORD AVENUE, FROM CITY SQUARE TO SULLIVAN SQUARE | 6 | TAP | $183,633,774 | $2,000,000 | $1,600,000 | $400,000 | Construction; NHPP+STBG+TAP Total Cost = $183,633,774; AC schedule over 5 years (2023-2027); Total funding in this TIP = $125,744,000; $25,000,000 in anticipated funding provided by City of Boston; MPO Evaluation Score = 59; TAP Proponent = Boston | ||||
| 2026 | 608045 | Boston Region | Milford | MILFORD- REHABILITATION ON ROUTE 16, FROM ROUTE 109 TO BEAVER STREET | 3 | HSIP | $10,481,030 | $1,000,000 | $900,000 | $100,000 | Construction; HSIP+STBG Total Cost = $10,481,030; MPO Evaluation Score = 43 | ||||
| 2026 | 608045 | Boston Region | Milford | MILFORD- REHABILITATION ON ROUTE 16, FROM ROUTE 109 TO BEAVER STREET | 3 | STBG | $10,481,030 | $9,481,030 | $7,584,824 | $1,896,206 | Construction; HSIP+STBG Total Cost = $10,481,030; MPO Evaluation Score = 43 | ||||
| 2026 | 608051 | Boston Region | Wilmington | WILMINGTON- RECONSTRUCTION ON ROUTE 38 (MAIN STREET), FROM ROUTE 62 TO THE WOBURN C.L. | 4 | STBG | $25,473,225 | $16,473,225 | $13,178,580 | $3,294,645 | Construction; CMAQ+HSIP+STBG Total Cost = $25,473,225; Project has 2-year AC schedule (2025-26); MPO Evaluation Score = 59 | ||||
| Flex to FTA | $5,500,000 | $4,400,000 | $1,100,000 | ||||||||||||
| 2026 | S12113 | Boston Region | TRANSIT MODERNIZATION PROGRAM | Regionwide | CMAQ | $11,000,000 | $5,500,000 | $4,400,000 | $1,100,000 | Construction; Flex to FTA; Set aside for LRTP Transit Modernization Program | |||||
| Transit Grant Program | $2,000,000 | $1,600,000 | $400,000 | ||||||||||||
| 2026 | S12124 | Boston Region | Multiple | COMMUNITY CONNECTIONS PROGRAM | Regionwide | CMAQ | $7,522,281 | $2,000,000 | $1,600,000 | $400,000 | Planning, Design, or Construction; Set Aside for LRTP Community Connections Program | ||||
| Section 2A / State Prioritized Reliability Projects | $40,796,246 | $33,335,557 | $7,460,689 | ||||||||||||
| Safety Improvements | $6,985,601 | $6,287,041 | $698,560 | ||||||||||||
| 2026 | 607748 | Boston Region | Acton | ACTON- INTERSECTION & SIGNAL IMPROVEMENTS ON SR 2 & SR 111 (MASSACHUSETTS AVENUE) AT PIPER ROAD & TAYLOR ROAD | 3 | HSIP | $4,382,329 | $4,382,329 | $3,944,096 | $438,233 | |||||
| 2026 | 611954 | Boston Region | Boston | BOSTON- GUIDE AND TRAFFIC SIGN REPLACEMENT ON I-90/I-93 WITHIN CENTRAL ARTERY/TUNNEL SYSTEM | 6 | HSIP | $2,603,272 | $2,603,272 | $2,342,945 | $260,327 | |||||
| Non-Interstate Pavement | $22,973,988 | $18,379,190 | $4,594,798 | ||||||||||||
| 2026 | 609402 | Boston Region | Multiple | FRAMINGHAM- NATICK- RESURFACING AND RELATED WORK ON ROUTE 9 | 3 | NHPP | $14,082,878 | $14,082,878 | $11,266,302 | $2,816,576 | |||||
| 2026 | 612050 | Boston Region | Multiple | BRAINTREE- WEYMOUTH- RESURFACING AND RELATED WORK ON ROUTE 3 | 6 | NHPP | $8,891,110 | $8,891,110 | $7,112,888 | $1,778,222 | |||||
| Bridge On-system Non-NHS | $7,461,816 | $5,969,453 | $1,492,363 | ||||||||||||
| 2026 | 612075 | Boston Region | Salem | SALEM- BRIDGE REPLACEMENT, S-01-024, JEFFERSON AVENUE OVER PARALLEL STREET | 4 | STBG | $3,354,720 | $3,354,720 | $2,683,776 | $670,944 | |||||
| 2026 | 612099 | Boston Region | ASHLAND- BRIDGE REPLACEMENT, A-14-006, CORDAVILLE ROAD OVER SUDBURY RIVER | 3 | STBG | $4,107,096 | $4,107,096 | $3,285,677 | $821,419 | ||||||
| Bridge Off-system | $3,374,841 | $2,699,873 | $674,968 | ||||||||||||
| 2026 | 612076 | Boston Region | Topsfield | TOPSFIELD- BRIDGE REPLACEMENT, T-06-013, PERKINS ROW OVER MILE BROOK | 4 | STBG-BR-Off | $3,374,481 | $3,374,841 | $2,699,873 | $674,968 | |||||
| Section 2B / State Prioritized Modernization Projects | $43,722,726 | $38,927,866 | $4,794,860 | ||||||||||||
| Intersection Improvements | $8,430,871 | $7,165,197 | $1,265,674 | ||||||||||||
| 2026 | 607759 | Boston Region | Boston | BOSTON- INTERSECTION & SIGNAL IMPROVEMENTS AT THE VFW PARKWAY & SPRING STREET | 6 | STBG | $4,225,870 | $4,225,870 | $3,380,696 | $845,174 | |||||
| 2026 | 610665 | Boston Region | Stoneham | STONEHAM- INTERSECTION IMPROVEMENTS AT ROUTE 28 (MAIN STREET), NORTH BORDER ROAD AND SOUTH STREET | 4 | HSIP | $4,205,001 | $4,205,001 | $3,784,501 | $420,500 | |||||
| Roadway Reconstruction | $35,291,855 | $31,762,670 | $3,529,186 | ||||||||||||
| 2026 | 607977 | Boston Region | Multiple | HOPKINTON- WESTBOROUGH- RECONSTRUCTION OF I-90/I-495 INTERCHANGE | 3 | NFP-I | $285,366,126 | $35,291,855 | $31,762,670 | $3,529,186 | Other FA - SW HIP: $6,784,226 (FY 2022); HIP Boston: $5,176,619 (FY 2022); BUILD Grant: $26,250,000 (FY 2022); HIP BR: $40,000,000 (FY 2023); $111,166,667 WT Funding | ||||
| Section 2C / State Prioritized Expansion Projects | $11,673,936 | $9,339,149 | $2,334,787 | ||||||||||||
| Bicycle and Pedestrian | $11,673,936 | $9,339,149 | $2,334,787 | ||||||||||||
| 2026 | 607329 | Boston Region | Multiple | WAKEFIELD- LYNNFIELD- RAIL TRAIL EXTENSION, FROM THE GALVIN MIDDLE SCHOOL TO LYNNFIELD/PEABODY T.L. | 4 | CMAQ | $11,673,936 | $11,673,936 | $9,339,149 | $2,334,787 | |||||
Table 3-8
FFYs 2022-26 TIP Transit Table (MBTA Federal Capital Program)
| Federal Funding Program | ALI | 2022 | 2023 | 2024 | 2025 | 2026 | FFY22-26 Total (Federal) | FFY22-26 Total (Incl. Match) |
| 5307 | $149,839,571 | $152,401,827 | $155,007,899 | $157,658,534 | $160,354,495 | $775,262,326 | $969,077,908 | |
| Revenue Vehicle Program | 12.12.00 | $117,756,381 | $117,756,381 | $117,756,381 | $117,756,381 | $117,756,381 | $588,781,905 | $735,977,381 |
| Signals/Systems Upgrade Program | 12.63.01 | $0 | $0 | $0 | $0 | $0 | $0 | $0 |
| Stations and Facilities Program | 12.34.00 | $32,083,190 | $34,645,446 | $37,251,518 | $39,902,153 | $42,598,114 | $186,480,421 | $233,100,526 |
| 5337 | $151,084,011 | $153,667,547 | $156,295,263 | $158,967,911 | $161,686,263 | $781,700,995 | $977,126,244 | |
| Bridge & Tunnel Program | 12.24.05 | $47,231,542 | $47,231,542 | $47,231,542 | $47,231,542 | $47,231,542 | $236,157,709 | $295,197,136 |
| Revenue Vehicle Program | 12.12.00 | $12,131,862 | $12,131,862 | $12,131,862 | $12,131,862 | $12,131,862 | $60,659,309 | $75,824,136 |
| Signals/Systems Upgrade Program | 12.63.01 | $68,437,082 | $68,437,082 | $68,437,082 | $68,437,082 | $68,437,082 | $342,185,412 | $427,731,765 |
| Stations and Facilities Program | 12.34.00 | $23,283,525 | $25,867,061 | $28,494,777 | $31,167,425 | $33,885,777 | $142,698,565 | $178,373,206 |
| 5339 | $6,208,003 | $6,314,160 | $6,422,132 | $6,531,951 | $6,643,647 | $32,119,893 | $40,149,866 | |
| Bus Program | 11.14.00 | $6,208,003 | $6,314,160 | $6,422,132 | $6,531,951 | $6,643,647 | $32,119,893 | $40,149,866 |
| FFY22-26 FTA Formula Funding | $307,131,585 | $312,383,534 | $317,725,294 | $323,158,396 | $328,684,405 | $1,589,083,214 | $1,986,354,017 | |
| 5309 - GLX | $46,121,000 | $0 | $0 | $0 | $0 | $46,121,000 | $92,242,000 | |
| Green Line Extension | 13.23.03 | $46,121,000 | $0 | $0 | $0 | $0 | $46,121,000 | $92,242,000 |
| Other Federal | $586,594,981 | $316,691,912 | $284,582,391 | $147,500,000 | $125,000,000 | $1,460,369,284 | $1,460,369,284 | |
| RRIF Financing - PTC/ATC/Fiber | 12.63.01 | $439,094,981 | $169,191,912 | $137,082,391 | $0 | $0 | $745,369,284 | $745,369,284 |
| RRIF/TIFIA Financing Program | 12.24.05 | $147,500,000 | $147,500,000 | $147,500,000 | $147,500,000 | $125,000,000 | $715,000,000 | $715,000,000 |
| FFY22-26 Total Federal Funding | $939,847,566 | $629,075,446 | $602,307,685 | $470,658,396 | $453,684,405 | $3,095,573,498 | $3,538,965,301 | |
| Note: | ||||||||
| FTA formula funds (5307, 5337 and 5339) are based on estimated apportionments for FFY22-26. | ||||||||
| TIP programs and projects are based on the preliminary FY22-26 CIP and planned federal obligations as of Apr-21. Adjustments will be made to federal projects and budgets as the FY22-26 CIP process is finalized. | ||||||||
| The Activity Line Item (ALI) codes are preliminary only and generally reflect the bulk of the TIP program. Within a program there may be several different ALI codes used. | ||||||||
| Green Line Extension funding is based on the FFGA. $850.0M obligated to date and another $100.0M is expected to be obligated in FFY21, leaving a $46.1M balance. | ||||||||
| RRIF loan funding for the PTC/ATC/Fiber Resiliency project is based on the planned drawdown schedule and is subject to change. | ||||||||
| RRIF/TIFIA financing program funding is an initial estimate and will be refined as projects are identified and loans are finalized with the Build America Bureau. | ||||||||
Table 3-9
FFYs 2022-26 TIP Transit Table (MBTA Federal Capital Program – Project List and Descriptions [80% Federal Share])
| Funds | TIP Program | CIP ID# | Project Name | FFY 2021 | FFY 2022-2026 | Total (Federal) | Project Description |
| FTA Formula Funds (5307, 5337, 5339) | |||||||
| 5307 - Revenue Vehicles | |||||||
| 5307 | Revenue Vehicles | P0369 | Green Line Type 10 Light Rail Fleet Replacement | $37,801,325 | $321,808,529 | $359,609,854 | Replacement of Light Rail Vehicles to replace the existing Green Line Type 7 and 8 Fleets. |
| 5307 | Revenue Vehicles | P0653 | Procurement of Battery Electric 40ft Buses and Related infrastructure | $0 | $41,437,713 | $41,437,713 | Procurement of Battery Electric 40ft Buses and Related infrastructure |
| 5307 | Revenue Vehicles | P0618 | Delivery of 40 ft Buses - FY 2021 to FY 2025 | $0 | $133,254,827 | $133,254,827 | Procurement of 40-foot electric and hybrid buses for replacement of diesel bus fleet. |
| 5307 | Revenue Vehicles | P0619 | Dual Mode Articulated (DMA) Bus Replacement | $71,356,024 | $0 | $71,356,024 | Procurement of 60-foot DMA buses to replace the existing fleet of 32 Silver Line BRT buses and to provide for ridership expansion projected as a result of Silver Line service extension to Chelsea. |
| 5307 | Revenue Vehicles | P0649 | Option Order Procurement of 194 New Flyer Hybrid 40 ft Buses | $0 | $5,844,571 | $5,844,571 | Procurement of 40-foot buses with hybrid propulsion to replace Emission Controlled Diesel (ECD) buses that have reached the end of their service life. |
| 5307 | Revenue Vehicles | P0650 | Overhaul of 33 Kawasaki 900 Series Bi-Level Coaches | $4,800,000 | $30,560,000 | $35,360,000 | Overhaul and upgrade of existing systems on commuter rail coaches that were brought into service in 2005 to enable optimal reliability through the end of their service life. |
| 5307 | Revenue Vehicles | P0652 | Procurement of Bi-Level Commuter Rail Coaches | $0 | $35,076,265 | $35,076,265 | Procurement of bi-level commuter rail coaches to replace existing cars that have exceeded their service life. |
| 5307 | Revenue Vehicles | P0911 | 156 Hybrid, 175 CNG, 45 60ft Hybrid Bus Overhaul Program | $0 | $20,800,000 | $20,800,000 | Overhaul of MBTA bus fleet (hybrid and CNG) |
| $113,957,349 | $588,781,905 | $702,739,254 | |||||
| 5307 - Stations and Facilities | |||||||
| 5307 | Stations and Facilities | P0066e | Harvard/Central Elevator | $5,347,007 | $0 | $5,347,007 | Elevator Improvements at Harvard/Central to address station accessibility needs. |
| 5307 | Stations and Facilities | P0104 | Charlestown Bus - Seawall Rehab | $930,609 | $0 | $930,609 | Rehabilitation of existing seawall to protect bus maintenance facility from future storm and flooding events. |
| 5307 | Stations and Facilities | P0165 | Harvard Square Busway Repairs | $1,600,000 | $0 | $1,600,000 | Rehabilitation of roadway, drainage and catenary infrastructure at the Harvard Square Busway. |
| 5307 | Stations and Facilities | P0671a | Bus Facility Modernization Program - Quincy Bus Facility | $111,020,540 | $186,480,420 | $297,500,960 | Replace the existing Quincy bus facility to provide additional capacity to support future service growth and a transition to battery electric buses. |
| $118,898,155 | $186,480,420 | $305,378,575 | |||||
| 5337 - Bridge and Tunnel | |||||||
| 5337 | Bridge and Tunnel | P0006 | Gloucester Drawbridge Replacement | $4,246,758 | $8,156,224 | $12,402,982 | Replacement of Gloucester Drawbridge with two new independent/operational and functioning movable bascule bridges. |
| 5337 | Bridge and Tunnel | P0008 | Emergency Bridge Design / Inspection & Rating | $0 | $2,379,908 | $2,379,908 | Inspection of bridge assets system wide for determination of asset condition ratings and subsequent prioritization and scoping for repairs to select bridges. |
| 5337 | Bridge and Tunnel | P0009 | Bridges - Design | $0 | $10,480,489 | $10,480,489 | Design for high priority bridge repairs system wide. |
| 5337 | Bridge and Tunnel | P0037 | Emergency Bridge Repair | $0 | $2,369,753 | $2,369,753 | Repairs to bridges system wide, based on asset condition as determined by system wide inspections. |
| 5337 | Bridge and Tunnel | P0182 | Tunnel Rehab | $0 | $705,198 | $705,198 | Repair and rehabilitation of transit tunnels system wide. |
| 5337 | Bridge and Tunnel | P0495 | Bridge Bundling Contract | $0 | $47,357,564 | $47,357,564 | Replacement of 6 commuter rail bridges: Lynn Fells Parkway in Melrose (Haverhill Line); Parker Street in Lawrence (Haverhill Line); Commercial Street in Lynn (Newburyport/Rockport Line); Bacon Street in Wellesley (Worcester Line); Intervale Road in Weston (Worcester Line); and High Line Bridge in Somerville (Lowell Line). |
| 5337 | Bridge and Tunnel | P0551 | Longfellow Approach | $0 | $91,088,476 | $91,088,476 | Rehabilitation of the Longfellow Approach Viaduct, Charles/MGH Station platforms, and Span 1 of the Longfellow Bridge. |
| 5337 | Bridge and Tunnel | P0627 | Inspection and Rating of MBTA Systemwide Bridges | $0 | $43,432,800 | $43,432,800 | Inspection of bridge assets system wide for determination of asset condition ratings. |
| 5337 | Bridge and Tunnel | P0851 | Norfolk Ave & East Cottage Street Bridges | $22,173,611 | $0 | $22,173,611 | Replacement of East Cottage Street bridge with a new superstructure and substructure to meet design code/standards, as well as MBTA and FTA State of Good Repair requirements. |
| 5337 | Bridge and Tunnel | P0853 | Robert Street Bridge | $3,389,786 | $0 | $3,389,786 | Replacement of bridge carrying the Needham Line Commuter Rail service over Robert Street in Roslindale. |
| 5337 | Bridge and Tunnel | P0907 | East Street Bridge Replacement (Dedham) | $0 | $14,400,000 | $14,400,000 | Replacement of bridge carrying the Franklin Line commuter rail service and CSX freight service over East Street in Dedham. |
| 5337 | Bridge and Tunnel | R0074 | Tunnel Inspection Systemwide | $5,280,000 | $15,787,297 | $21,067,297 | Inspection to assess condition of transit tunnels systemwide. |
| $35,090,154 | $236,157,709 | $271,247,864 | |||||
| 5337 - Revenue Vehicles | |||||||
| 5337 | Revenue Vehicles | P0239 | Locomotive Overhaul | $10,000,000 | $11,906,527 | $21,906,527 | Overhaul of commuter rail locomotives to improve fleet availability and service reliability systemwide. |
| 5337 | Revenue Vehicles | P0370 | Green Line Train Protection | $10,280,463 | $48,752,782 | $59,033,245 | Installation of on-board and wayside equipment for a train monitoring system to determine allowable train separation, based on speed and location, and to prevent vehicles from passing a red signal. |
| $20,280,463 | $60,659,309 | $80,939,772 | |||||
| 5337 - Signals and Systems | |||||||
| 5337 | Signals and Systems | P0097 | 45 High Street - Data Center Upgrades | $1,200,000 | $0 | $1,200,000 | Includes new fire suppression/alarm system as well as power, fiber, HVAC and other data center improvements at the MBTA operations center at 45 High Street, Boston. |
| 5337 | Signals and Systems | P0212 | North Station Terminal Signal | $0 | $4,000,000 | $4,000,000 | Upgrades to the commuter rail signal/communication system in the North Station area required for more efficient phasing of future track alignments, including support for the future Draw1 Bridge Replacement Project. |
| 5337 | Signals and Systems | P0261 | Worcester Line Track Improvements Incl. 3rd Track Feasibility Study | $0 | $25,885,742 | $25,885,742 | Construction of a new three-track section on the Framingham/Worcester Commuter Rail line to improve capacity, efficiency of operations and to bring 4 stations into full ADA compliance. |
| 5337 | Signals and Systems | P0283 | Green Line Central Tunnel Signal - 25 Cycle | $0 | $4,000,000 | $4,000,000 | Replace 25Hz track circuits and related equipment within the Green Line central tunnel system. |
| 5337 | Signals and Systems | P0285 | Signal Program - Red/Orange Line | $37,768,206 | $72,194,222 | $109,962,427 | Various signal upgrades and improvements along both the Red and Orange Lines. |
| 5337 | Signals and Systems | P0301 | System-Wide Radio | $30,039,735 | $21,030,405 | $51,070,140 | Replacement of existing radio system for MBTA Police to support critical two-way communication for MBTA Transit Police and to support a secure and Interoperable Radio System. |
| 5337 | Signals and Systems | P0591 | Green Line Central Tunnel Track and Signal Replacement | $0 | $96,000,000 | $96,000,000 | Replacement of the existing 25 cycle signal system and associated wayside equipment at Government Center, Copley and Park Street Interlockings, and related track work. |
| 5337 | Signals and Systems | P0654 | Red Line Interlock Upgrades | $9,600,000 | $0 | $9,600,000 | Replacement of existing interlocking signal components on the Red Line to bring the assets to a state of good repair. |
| 5337 | Signals and Systems | P0705 | Power Systems Resiliency Program | $0 | $11,416,644 | $11,416,644 | Installation of new duct bank systems to replace damaged power infrastructure, including at West Fourth Street, Dudley Square, Arlington Street, Causeway Street, two locations on Commonwealth Ave and three locations on Beacon Street. |
| 5337 | Signals and Systems | P0857 | Mattapan HSL Transformation | $0 | $94,400,000 | $94,400,000 | State of good repair and accessibility improvements to all stations, improvements to the power infrastructure, strengthening of corridor bridges, improvements to corridor drainage, and other infrastructure improvements. |
| 5337 | Signals and Systems | P0904 | Systemwide Asset Management Program Phase 3 | $2,800,000 | $6,000,000 | $8,800,000 | Support the MBTA's asset management program in order to meet legislative requirements; including updates to the asset inventory for Transit Asset Management Plan (TAMP) and National Transit Database (NTD) reporting. |
| 5337 | Signals and Systems | R0117 | Alewife Crossing Improvements | $0 | $7,258,400 | $7,258,400 | As part of the Red/Orange Line Infrastructure Improvement Program, this project will upgrade of track switches at Alewife Station and associated retrofits to accomodate these new components. |
| $81,407,941 | $342,185,412 | $423,593,353 | |||||
| 5337 - Stations and Facilities | |||||||
| 5337 | Stations and Facilities | P0003 | Green Line B-Branch Consolidation | $23,422,633 | $0 | $23,422,633 | Addressing accessibility issues along the B branch of the Green Line along Commonwealth Avenue. |
| 5337 | Stations and Facilities | P0066 | Elevator Program | $0 | $12,405,121 | $12,405,121 | Installation of new redundant elevators and the replacement of existing elevators at various stations, in order to mitigate degradation of station elevators and to maintain station accessibility during elevator maintenance. |
| 5337 | Stations and Facilities | P0074 | Downtown Crossing Vertical Transportation Improvements Phase 2 | $0 | $5,926,390 | $5,926,390 | Construction of two new redundant elevators, in order to improve accessibility and to provide for future elevator maintenance without rendering the station temporarily inaccessible. |
| 5337 | Stations and Facilities | P0075 | Elevator Program Multiple Location Design | $9,499,338 | $27,035,682 | $36,535,020 | Design for the installation of new redundant elevators and the replacement of existing elevators system wide. |
| 5337 | Stations and Facilities | P0078 | Hingham Ferry Dock Modification | $400,000 | $0 | $400,000 | Capital improvements and modifications to the existing ferry dock in Hingham. |
| 5337 | Stations and Facilities | P0087 | Braintree and Quincy Adams Garage Rehab | $9,295,936 | $0 | $9,295,936 | The full repair and rehabilitation of the Red Line’s Quincy Adams Station and Braintree Station parking garages. |
| 5337 | Stations and Facilities | P0129 | Newton Highlands Green Line Station Accessibility Project | $0 | $25,642,761 | $25,642,761 | Improvements at Newton Highlands station on the D branch of the Green Line to comply with ADA accessibility standards. |
| 5337 | Stations and Facilities | P0163 | Forest Hills Improvement Project | $0 | $26,089,763 | $26,089,763 | Improvements at Forest Hills Station on the Orange Line and Needham Commuter Rail Line to comply with ADA accessibility standards. Work will also include infrastructure and other improvements. |
| 5337 | Stations and Facilities | P0168 | Symphony Station Improvements | $37,436,159 | $0 | $37,436,159 | Upgrades to the existing Symphony Station on the Green Line in order to provide a modern, accessible, code-compliant facility. |
| 5337 | Stations and Facilities | P0496 | Silver Line Gateway - Phase 2 | $0 | $4,654,574 | $4,654,574 | Includes the building of a new commuter rail station adjacent to the new Chelsea Bus Rapid Transit (BRT) Station located at the Mystic Mall, as well as decommissioning of the existing Chelsea Commuter Rail Station and signal prioritization. |
| 5337 | Stations and Facilities | P0679 | Codman Yard Expansion and Improvements | $43,822,058 | $12,088,880 | $55,910,938 | Infrastructure improvements to Codman Yard, an additional Red Line storage facility, to accommodate the new vehicle fleet. |
| 5337 | Stations and Facilities | P0856 | Ruggles Station Improvements Phase 2 | $2,599,003 | $0 | $2,599,003 | Design for state of good repair improvements to Ruggles Station on the Orange Line. |
| 5337 | Stations and Facilities | P0890 | Green Line Surface Station Accessibility I | $0 | $15,624,828 | $15,624,828 | Reconstruction of Green Line surface stations and related infrastructure to support compliance with ADA regulations and alignment with corridor capacity needs. |
| 5337 | Stations and Facilities | P0970 | Attleboro Station Improvements | $1,371,330 | $0 | $1,371,330 | State of good repair and accessibility improvements to the Attleboro commuter rail station, in coordination with GATRA for project funding and scope development. |
| 5337 | Stations and Facilities | R0071 | Lynn Station & Parking Garage Improvements Phase II | $0 | $13,230,567 | $13,230,567 | Extensive rehabilitation efforts include reconstruction of the existing commuter rail platform, upgrade of mechanical and electrical systems at the station, and structural repairs and code compliance retrofits to the garage. |
| $127,846,458 | $142,698,565 | $270,545,023 | |||||
| 5339 - Bus and Bus Facility | |||||||
| 5339 | Bus and Bus Facilities | P0653 | Procurement of Battery Electric 40ft Buses and Related infrastructure | $6,106,394 | $32,119,893 | $38,226,287 | Procurement of Battery Electric 40ft Buses and Related infrastructure |
| $6,106,394 | $32,119,893 | $38,226,287 | |||||
| Note: Project descriptions and dollar amounts are preliminary only and are provided for informational purposes. In many cases, the scopes of work and project budgets will become more fully developed as the design process proceeds and is completed. The MBTA may also opt to fund a project from a different FTA funding source based on the timing of projects and the availability of FTA funds. | |||||||
| RRIF/TIFIA Financing Program | |||||||
| Projects Potentially Funded by Federal RRIF/TIFIA Loans | |||||||
| RRIF/TIFIA Financing | P0671a | Bus Facility Modernization Program - Quincy Bus Facility | |||||
| RRIF/TIFIA Financing | P0551 | Longfellow Approach | |||||
| RRIF/TIFIA Financing | P0552 | Dorchester Avenue Bridge | |||||
| RRIF/TIFIA Financing | P0952 | Widett Layover Facility - Real Estate and Design | |||||
| RRIF/TIFIA Financing | P0018 | North Station Draw 1 Bridge Replacement | |||||
| RRIF/TIFIA Financing | P0170 | Newton Commuter Rail Stations | |||||
| RRIF/TIFIA Financing | P0178 | South Attleboro Station Improvements | |||||
| RRIF/TIFIA Financing | P0863 | South-Side CR Maintenance Facility | |||||
| Note: The MBTA is exploring the use of federal loans through the Build America Bureau to finance certain capital projects at a lower interest rate than traditional tax-exempt bonds. This includes loans under the Railroad Rehabilitation & Improvement Financing (RRIF) and Transportation Infrastructure Finance and Innovation Act (TIFIA) programs. The projects listed above are being considered for this program, subject to the approval of funding through the CIP process. Additional project and funding information will be provided through a future TIP/Amendment if federal grant funds or loans are utilized. | |||||||
Table 3-10
FFYs 2022-26 TIP Transit Table (MWRTA)
| Project Number | RTA | Program | Project Title | Notes | Fiscal Year | Total | State Funds | Federal | FTA | Section 5307 | Federal | FTA | Section 5339 | Federal | FHWA | Transportation Development Credits | Other Federal | Other Non-Federal |
| FFY 2022 | ||||||||||||
| RTD0009269 | MWRTA | Transit | RTA vehicle replacement | METROWEST RTA/REVENUE VEHICLE REPLACEMENT | MWRTA BUY REPLACEMENT VEHICLES; 7 D(b) - CNGs |
2022 | $75,000 | $15,000 | $60,000 | $0 | $0 | $0 | $0 |
| RTD0010209 | MWRTA | Transit | RTA facility and system modernization | METROWEST RTA/ACQUISITION OF BUS SUPPORT EQUIP/FACILITIES | METROWEST RTA/ACQUIRE AFTER MARKET VEHICLE ACCESSORIES (i.e., passenger counters, DVR - vehicle recorders, annunciators) | 2022 | $103,750 | $20,750 | $83,000 | $0 | $0 | $0 | $0 |
| RTD0009271 | MWRTA | Transit | RTA replacement facilities | METROWEST RTA/FEB - Front Entrance Blandin - Project | Front Entrance Blandin (FEB) Project- This project is in support of the State of Good Repair for Blandin Ave Facility and accomplishes a number of the recommendations as laid out in the 5 year Comprehensive Regional Transit Plan (CRTP). Year 2 of funding allows MWRTA to complete the project, which began with FY2020 100% RTA Cap funds, allowing us to fully leverage the current investment by MassDOT. | 2022 | $721,100 | $0 | $0 | $0 | $0 | $0 | $721,100 |
| RTD0010002 | MWRTA | METROWEST RTA/OPERATING ASSISTANCE NON FIXED ROUTE ADA PARA SERV | METROWEST RTA/OPERATING ASSISTANCE NON FIXED ROUTE ADA PARA SERV | 2022 | $2,000,000 | $400,000 | $1,600,000 | $0 | $0 | $0 | $0 | |
| RTD0010003 | MWRTA | Transit | RTA facility and vehicle maintenance | METROWEST RTA/TERMINAL, INTERMODAL (TRANSIT) - BLANDIN | MWRTA will utilize these funds to maintain a State of Good Repair value of at least 3.5 for the operations and administration facility along with all amenities and support equipment located at 15 Blandin Ave, Framingham MA | 2022 | $612,934 | $122,587 | $490,347 | $0 | $0 | $0 | $0 |
| RTD0010015 | MWRTA | Transit | RTA facility and vehicle maintenance | METROWEST RTA/TERMINAL, INTERMODAL (TRANSIT) - Framingham Commuter Rail Station (FCRS) | Framingham Intermodal Enhancements/Improvements; MWRTA applies for competitive funding for this line item as well and will reduce the RTACAP request upon award of additional funds; $100,000 Pearl Street Garage Feasibility Study; $50,000 Chrish Walsh Rail Trail Signal Crossing to bring Rail Trail into MWRTA Lot (MWRTA Crossing on the Y). | 2022 | $5,000 | $1,000 | $4,000 | $0 | $0 | $0 | $0 |
| RTD0010004 | MWRTA | Transit | RTA facility and vehicle maintenance | METROWEST RTA/TECHNOLOGY SUPPORT/CAPITAL OUTREACH | Mobility Management; IT; Call Center; Travel Training Enhancements/Improvements; MWRTA applies for competitive funding for this line item as well and will reduce the RTACAP request upon award of additional federal funds. | 2022 | $75,000 | $15,000 | $60,000 | $0 | $0 | $0 | $0 |
| RTD0010336 | MWRTA | MWRTA - Vehicle replacement - Cutaways (11) | Vehicle replacement - Cutaways (11) | 2022 | $1,043,992 | $0 | $0 | $0 | $260,998 | $1,043,992 | $0 | |
| RTD0010155 | MWRTA | Transit | RTA facility and system modernization | METROWEST RTA/2022 AFC TRANSITION - ACQUIRE - MOBILE FARE COLL EQUIP | Strategy: MWRTA will be working with our technology consultant to implement account based on board fare collection option for customers. This system will allow customers to board the vehicle using a MWRTA issued smart card or MWRTA branded application via QR code which will be linked to a back-end account for the customer. The system will utilize off the shelf components, such as tablets and HID Standard readers, and will integrate into MWRTA’s existing cashless fare system being used for paratransit. This account-based system will be an additional option to customers on top of the current S&B options available (cash or Charlie card) and will allow for MWRTA to issue more flexible fare products to customer, along with integrating demand response fare collection with Fixed Route, allowing for seamless transfers across these different modes. This system will be developed to be flexible to work with AFC 2.0 initiatives of the CharlieCard when APIs are published and available for use by RTAs. The RTA Cap request is for the associated hardware to support this initiative. | 2022 | $150,000 | $75,000 | $75,000 | $0 | $0 | $0 | $0 |
| FFY 2023 | ||||||||||||
| RTD0010005 | MWRTA | METROWEST RTA/OPERATING ASSISTANCE NON FIXED ROUTE ADA PARA SERV | METROWEST RTA/OPERATING ASSISTANCE NON FIXED ROUTE ADA PARA SERV |
2023 | $2,000,000 | $400,000 | $1,600,000 | $0 | $0 | $0 | $0 | |
| RTD0010006 | MWRTA | Transit | RTA facility and vehicle maintenance | METROWEST RTA/ACQUISITION OF BUS SUPPORT EQUIP/FACILITIES | METROWEST RTA/ACQUIRE AFTER MARKET VEHICLE ACCESSORIES (i.e., passenger counters, DVR - vehicle recorders, annunciators) | 2023 | $99,750 | $19,950 | $79,800 | $0 | $0 | $0 | $0 |
| RTD0010007 | MWRTA | Transit | RTA facility and vehicle maintenance | METROWEST RTA/TECHNOLOGY SUPPORT/CAPITAL OUTREACH | Mobility Management; IT; Call Center; Travel Training Enhancements/Improvements; Fare Collection Transition;MWRTA applies for competitive funding for this line item as well and will reduce the RTACAP request upon award of additional federal funds. |
2023 | $100,000 | $20,000 | $80,000 | $0 | $0 | $0 | $0 |
| RTD0010014 | MWRTA | Transit | RTA facility and vehicle maintenance | METROWEST RTA/TERMINAL, INTERMODAL (TRANSIT) - Framingham Commuter Rail Station (FCRS) | Framingham Intermodal Enhancements/Improvements; MWRTA applies for competitive funding for this line item as well and will reduce the RTACAP request upon award of additional federal funds. |
2023 | $5,000 | $1,000 | $4,000 | $0 | $0 | $0 | $0 |
| RTD0010008 | MWRTA | Transit | RTA facility and vehicle maintenance | METROWEST RTA/TERMINAL, INTERMODAL (TRANSIT) - BLANDIN | MWRTA will utilize these funds to maintain a State of Good Repair value of at least 3.5 for the operations and administration facility along with all amenities and support equipment located at 15 Blandin Ave, Framingham MA |
2023 | $312,500 | $62,500 | $250,000 | $0 | $0 | $0 | $0 |
| RTD0010020 | MWRTA | Transit | RTA vehicle replacement | METROWEST RTA/REVENUE VEHICLE REPLACEMENT | MWRTA BUY REPLACEMENT VEHICLES; 6 D(b)CNGs + 6 E2s Gas |
2023 | $495,000 | $165,000 | $0 | $0 | $0 | $330,000 | $0 |
| RTD0010334 | MWRTA | MWRTA - Electronic Sign Board | MWRTA - Electronic Sign Board | 2023 | $200,000 | $40,000 | $160,000 | $0 | $0 | $0 | $0 | |
| RTD0010330 | MWRTA | MWRTA - BEB - Back Entrance Blandin Project | MWRTA - BEB - Back Entrance Blandin Project | 2023 | $2,000,000 | $400,000 | $0 | $0 | $0 | $1,600,000 | $0 | |
| RTD0010333 | MWRTA | MWRTA - CRT North Framingham Bike/Pedestrian Connectivity - Cochituate Rail Trail North Framingham Feasibility Study | MWRTA - CRT North Framingham Bike/Pedestrian Connectivity - Cochituate Rail Trail North Framingham Feasibility Study | 2023 | $95,000 | $19,000 | $0 | $0 | $0 | $76,000 | $0 | |
| RTD0010338 | MWRTA | MWRTA - Vehicle Replacement - Cutaways (12) #2 of 2 | MWRTA - Vehicle Replacement - Cutaways (12) #2 of 2 | 2023 | $495,000 | $165,000 | $0 | $0 | $0 | $330,000 | $0 | |
| RTD0010169 | MWRTA | Transit | RTA facility and system modernization | METROWEST RTA/2023 ELECTRIC VEHICLE MIGRATION | Modernization Fleet Electrification - Vehicle Migration - Purchase of 5 Paratransit (Type A) Electric Vehicles. MWRTA is seeking a 8 year migration to fully electric vehicles. This request is supported in our TAM to maintain useful life benchmarks of our paratransit fleet and is in support of Gov. Baker's 2020 Transportation Climate Initiative (TCI). | 2023 | $300,000 | $150,000 | $150,000 | $0 | $0 | $0 | $0 |
| FFY 2024 | ||||||||||||
| RTD0010009 | MWRTA | METROWEST RTA/OPERATING ASSISTANCE NON FIXED ROUTE ADA PARA SERV | METROWEST RTA/OPERATING ASSISTANCE NON FIXED ROUTE ADA PARA SERV | 2024 | $2,000,000 | $400,000 | $1,600,000 | $0 | $0 | $0 | $0 | |
| RTD0010010 | MWRTA | Transit | RTA facility and vehicle maintenance | METROWEST RTA/ACQUISITION OF BUS SUPPORT EQUIP/FACILITIES | METROWEST RTA/ACQUIRE AFTER MARKET VEHICLE ACCESSORIES (i.e., passenger counters, DVR - vehicle recorders, annunciators) | 2024 | $111,750 | $22,350 | $89,400 | $0 | $0 | $0 | $0 |
| RTD0010011 | MWRTA | Transit | RTA facility and vehicle maintenance | METROWEST RTA/TECHNOLOGY SUPPORT/CAPITAL OUTREACH | Mobility Management; IT; Call Center; Travel Training Enhancements/Improvements; MWRTA applies for competitive funding for this line item as well and will reduce the RTACAP request upon award of additional federal funds. | 2024 | $200,000 | $40,000 | $160,000 | $0 | $0 | $0 | $0 |
| RTD0010012 | MWRTA | Transit | RTA facility and vehicle maintenance | METROWEST RTA/TERMINAL, INTERMODAL (TRANSIT) - BLANDIN | MWRTA will utilize these funds to maintain a State of Good Repair value of at least 3.5 for the operations and administration facility along with all amenities and support equipment located at 15 Blandin Ave, Framingham MA | 2024 | $312,500 | $62,500 | $250,000 | $0 | $0 | $0 | $0 |
| RTD0010013 | MWRTA | Transit | RTA facility and vehicle maintenance | METROWEST RTA/TERMINAL, INTERMODAL (TRANSIT) - Framingham Commuter Rail Station (FCRS) | Intermodal at the Framingham Commuter Rail Station (FCRS) Enhancements/Improvements;MWRTA applies for competitive funding for this line item as well and will reduce the RTACAP request upon award of additional federal funds. | 2024 | $5,000 | $1,000 | $4,000 | $0 | $0 | $0 | $0 |
| RTD0010022 | MWRTA | Transit | RTA vehicle replacement | METROWEST RTA/REVENUE VEHICLE REPLACEMENT | MWRTA BUY REPLACEMENT VEHICLES; 11 D(b) - CNGs + 4 E2s - Gas |
2024 | $675,000 | $225,000 | $0 | $0 | $0 | $450,000 | $0 |
| RTD0010329 | MWRTA | MWRTA - FCRS Intermodal Hub | MWRTA - FCRS Intermodal Hub | 2024 | $8,000,000 | $0 | $0 | $0 | $2,000,000 | $8,000,000 | $0 | |
| RTD0010331 | MWRTA | MWRTA - ESG - East Street Garage Project | MWRTA - ESG - East Street Garage Project | 2024 | $7,000,000 | $0 | $0 | $0 | $1,750,000 | $7,000,000 | $0 | |
| RTD0010328 | MWRTA | MWRTA - Body Shop | MWRTA - Body Shop | 2024 | $3,000,000 | $0 | $0 | $0 | $750,000 | $3,000,000 | $0 | |
| RTD0010340 | MWRTA | MWRTA - Vehicle Replacement - Cutaways (15) #2 of 2 | MWRTA - Vehicle Replacement - Cutaways (15) #2 of 2 | 2024 | $675,000 | $225,000 | $0 | $0 | $0 | $450,000 | $0 | |
| RTD0010170 | MWRTA | Transit | RTA facility and system modernization | METROWEST RTA/2024 ELECTRIC VEHICLE MIGRATION | Modernization Fleet Electrification - Vehicle Migration - Purchase of 5 Electric Vehicles | 2024 | $600,000 | $300,000 | $300,000 | $0 | $0 | $0 | $0 |
| FFY 2025 | ||||||||||||
| RTD0010016 | MWRTA | Transit | RTA facility and vehicle maintenance | METROWEST RTA/ACQUISITION OF BUS SUPPORT EQUIP/FACILITIES | METROWEST RTA/ACQUIRE AFTER MARKET VEHICLE ACCESSORIES (i.e., passenger counters, DVR - vehicle recorders, annunciators) | 2025 | $113,750 | $22,750 | $91,000 | $0 | $0 | $0 | $0 |
| RTD0010017 | MWRTA | Transit | RTA facility and vehicle maintenance | METROWEST RTA/TECHNOLOGY SUPPORT/CAPITAL OUTREACH | Mobility Management; IT; Call Center; Travel Training Enhancements/Improvements; MWRTA applies for competitive funding for this line item as well and will reduce the RTACAP request upon award of additional federal funds. | 2025 | $200,000 | $40,000 | $160,000 | $0 | $0 | $0 | $0 |
| RTD0010018 | MWRTA | Transit | RTA facility and vehicle maintenance | METROWEST RTA/TERMINAL, INTERMODAL (TRANSIT) - BLANDIN | MWRTA will utilize these funds to maintain a State of Good Repair value of at least 3.5 for the operations and administration facility along with all amenities and support equipment located at 15 Blandin Ave, Framingham MA | 2025 | $562,500 | $112,500 | $450,000 | $0 | $0 | $0 | $0 |
| RTD0010019 | MWRTA | METROWEST RTA/OPERATING ASSISTANCE NON FIXED ROUTE ADA PARA SERV | METROWEST RTA/OPERATING ASSISTANCE NON FIXED ROUTE ADA PARA SERV | 2025 | $2,000,000 | $400,000 | $1,600,000 | $0 | $0 | $0 | $0 | |
| RTD0010023 | MWRTA | Transit | RTA vehicle replacement | METROWEST RTA/REVENUE VEHICLE REPLACEMENT | MWRTA BUY REPLACEMENT VEHICLES; 3 D(b) - CNGs + 5 E2s - Gas | 2025 | $375,000 | $125,000 | $250,000 | $0 | $0 | $0 | $0 |
| RTD0008997 | MWRTA | Transit | RTA facility and vehicle maintenance | METROWEST RTA/TERMINAL, INTERMODAL (TRANSIT) - Framingham Commuter Rail Station (FCRS) | Framingham Intermodal Enhancements/Improvements; MWRTA applies for competitive funding for this line item as well and will reduce the RTACAP request upon award of additional federal funds. | 2025 | $5,000 | $1,000 | $4,000 | $0 | $0 | $0 | $0 |
| RTD0010335 | MWRTA | MWRTA - AFC TRANSITION - MOBILE FARE COLL EQUIP | MWRTA - AFC TRANSITION - MOBILE FARE COLL EQUIP | 2025 | $100,000 | $50,000 | $50,000 | $0 | $0 | $0 | $0 | |
| RTD0010342 | MWRTA | MWRTA - Vehicle Replacement - Cutaways (8) #2 of 2 | MWRTA - Vehicle Replacement - Cutaways (8) #2 of 2 | 2025 | $375,000 | $125,000 | $0 | $250,000 | $0 | $0 | $0 | |
| RTD0010332 | MWRTA | MWRTA - Public Restrooms at Blandin and FCRS Hubs | MWRTA - Public Restrooms at Blandin and FCRS Hubs | 2025 | $200,000 | $40,000 | $0 | $0 | $0 | $160,000 | $0 | |
| RTD0010171 | MWRTA | Transit | RTA facility and system modernization | METROWEST RTA/2025 ELECTRIC VEHICLE MIGRATION | Modernization Fleet Electrification - Vehicle Migration - Purchase of 5 Paratransit (Type A) Electric Vehicles. MWRTA is seeking a 8 year migration to fully electric vehicles. This request is supported in our TAM to maintain useful life benchmarks of our paratransit fleet and is in support of Gov. Baker's 2020 Transportation Climate Initiative (TCI). | 2025 | $600,000 | $300,000 | $300,000 | $0 | $0 | $0 | $0 |
| FFY 2026 | ||||||||||||
| RTD0010161 | MWRTA | METROWEST RTA/OPERATING ASSISTANCE NON FIXED ROUTE ADA PARA SERV | METROWEST RTA/OPERATING ASSISTANCE NON FIXED ROUTE ADA PARA SERV | 2026 | $2,000,000 | $400,000 | $1,600,000 | $0 | $0 | $0 | $0 | |
| RTD0010163 | MWRTA | Transit | RTA facility and vehicle maintenance | METROWEST RTA/TERMINAL, INTERMODAL (TRANSIT) - BLANDIN | MWRTA will utilize these funds to maintain a State of Good Repair value of at least 3.5 for the operations and administration facility along with all amenities and support equipment located at 15 Blandin Ave, Framingham MA | 2026 | $687,500 | $137,500 | $550,000 | $0 | $0 | $0 | $0 |
| RTD0010165 | MWRTA | Transit | RTA facility and vehicle maintenance | METROWEST RTA/TECHNOLOGY SUPPORT/CAPITAL OUTREACH | Mobility Management; IT; Call Center; Travel Training Enhancements/Improvements; MWRTA applies for competitive funding for this line item as well and will reduce the RTACAP request upon award of additional federal funds. | 2026 | $200,000 | $40,000 | $160,000 | $0 | $0 | $0 | $0 |
| RTD0010166 | MWRTA | Transit | RTA facility and vehicle maintenance | METROWEST RTA/ACQUISITION OF BUS SUPPORT EQUIP/FACILITIES | METROWEST RTA/ACQUIRE AFTER MARKET VEHICLE ACCESSORIES (i.e., passenger counters, DVR - vehicle recorders, annunciators) | 2026 | $113,750 | $22,750 | $91,000 | $0 | $0 | $0 | $0 |
| RTD0010167 | MWRTA | Transit | RTA facility and vehicle maintenance | METROWEST RTA/TERMINAL, INTERMODAL (TRANSIT) - Framingham Commuter Rail Station | Intermodal at the Framingham Commuter Rail Station (FCRS) Enhancements/Improvements;MWRTA applies for competitive funding for this line item as well and will reduce the RTACAP request upon award of additional federal funds. | 2026 | $5,000 | $1,000 | $4,000 | $0 | $0 | $0 | $0 |
| RTD0010172 | MWRTA | Transit | RTA facility and system modernization | METROWEST RTA/2026 ELECTRIC VEHICLE MIGRATION | Modernization Fleet Electrification - Vehicle Migration - Purchase of 5 Paratransit (Type A) Electric Vehicles. MWRTA is seeking a 8 year migration to fully electric vehicles. This request is supported in our TAM to maintain useful life benchmarks of our paratransit fleet and is in support of Gov. Baker's 2020 Transportation Climate Initiative (TCI). | 2026 | $300,000 | $150,000 | $150,000 | $0 | $0 | $0 | $0 |
| RTD0010344 | MWRTA | MWRTA - Vehicle Replacement - Cutaways (8) #2 of 2 | MWRTA - Vehicle Replacement - Cutaways (8) #2 of 2 | 2026 | $375,000 | $125,000 | $0 | $0 | $0 | $250,000 | $0 | |
| RTD0010196 | MWRTA | Transit | RTA vehicle replacement | METROWEST RTA/REVENUE VEHICLE REPLACEMENT | MWRTA BUY REPLACEMENT VEHICLES; 6 D(b) - CNGs + 2 E2s - Gas | 2026 | $375,000 | $125,000 | $250,000 | $0 | $0 | $0 | $0 |
Table 3-11
FFYs 2022-26 TIP Transit Table (CATA)
| Project Number | RTA | Program | Project Title | Notes | Fiscal Year | Total | Bond Cap | State | 100% State | Federal | FTA | Section 5307 | Other | Municipal and Local | Transit |
| FFY 2022 | |||||||||
| RTD0009507 | Cape Ann | Transit | RTA facility and vehicle maintenance | CATA-buy misc small capital | Miscellaneous small capital items | 2022 | $15,000 | $15,000 | $0 | $0 |
| RTD0009501 | Cape Ann | Transit | RTA facility and vehicle maintenance | CATA-Preventive Maintenance | Preventive maintenance | 2022 | $356,250 | $0 | $285,000 | $71,250 |
| RTD0009502 | Cape Ann | Transit | RTA facility and system modernization | CATA-acquire shop equip/small capital | Shop equipment, computers, software | 2022 | $37,500 | $7,500 | $30,000 | $0 |
| FFY 2023 | |||||||||
| RTD0009503 | Cape Ann | Transit | RTA facility and vehicle maintenance | CATA-Preventive Maintenance | Preventive maintenance | 2023 | $356,250 | $0 | $285,000 | $71,250 |
| RTD0007185 | Cape Ann | Transit | RTA facility and vehicle maintenance | CATA-acquire shop equip/small capital | IT equipment, shop equipment, etc. | 2023 | $37,500 | $7,500 | $30,000 | $0 |
| RTD0009504 | Cape Ann | Transit | RTA vehicle replacement | CATA-Revenue Vehicle Replacement - 2 | This project is the replacement of two 2010 30-ft low floor buses that reached the end of their useful life in 2020 (10-year ULB). The vehicles purchased with these fund will be off the 2020 MVRTA Heavy-Duty Bus Procurement, which CATA participated in. The project supports CATA's Transit Asset Management Program by keeping assets in a state of good repair and investing in assets before the asset's condition deteriorates to an unacceptable level. CATA has included a 50/50 5307/RTACAP match for this project. CATA typically receives ~$500k in 5307 funds each year and $285k is programmed for PM, leaving a balance of $215K for all other capital projects. |
2023 | $900,000 | $450,000 | $450,000 | $0 |
| RTD0009508 | Cape Ann | Transit | RTA facility and vehicle maintenance | CATA-buy misc small capital | Miscellaneous small capital items | 2023 | $15,000 | $15,000 | $0 | $0 |
| FFY 2024 | |||||||||
| RTD0009505 | Cape Ann | Transit | RTA facility and vehicle maintenance | CATA-Preventive Maintenance | Preventive maintenance | 2024 | $356,250 | $0 | $285,000 | $71,250 |
| RTD0009506 | Cape Ann | Transit | RTA facility and vehicle maintenance | CATA-repave admin/ops facility parking lot | Repave parking lot at administration and operations facility. Lot was last paved in the early 2000s during building rehabilitation | 2024 | $180,000 | $36,000 | $144,000 | $0 |
| RTD0009509 | Cape Ann | Transit | RTA facility and vehicle maintenance | CATA-buy misc small capital | Miscellaneous small capital items | 2024 | $15,000 | $15,000 | $0 | $0 |
| RTD0009512 | Cape Ann | Transit | RTA facility and system modernization | CA TA - AFC 2.0 | AFC 2.0 for RTAs | 2024 | $300,000 | $300,000 | $0 | $0 |
| RTD0010077 | Cape Ann | Transit | RTA facility and system modernization | CATA-acquire shop equip/small capital | IT equipment, shop equipment, etc. | 2024 | $37,500 | $7,500 | $30,000 | $0 |
| FFY 2025 | |||||||||
| RTD0009510 | Cape Ann | Transit | RTA facility and vehicle maintenance | CA TA-Preventive Maintenance | PM activities | 2025 | $356,250 | $0 | $285,000 | $71,250 |
| RTD0009511 | Cape Ann | Transit | RTA facility and vehicle maintenance | CATA-acquire shop equip/small capital | IT equipment, shop equipment, etc. | 2025 | $37,500 | $7,500 | $30,000 | $0 |
| RTD0009482 | Cape Ann | Transit | RTA vehicle replacement | CATA-Revenue Vehicle Replacement - 2 | Replacement of 2015 International body-on-chassis vehicles. This project is the replacement of two 2015 29-ft body-on-chassis buses that reached the end of their useful life in 2022 (7 year life). CATA has not identified a procurement for the purchase of the vehicles. The project supports CATA's Transit Asset Management Program by keeping assets in a state of good repair and investing in assets before the asset's condition deteriorates to an unacceptable level. CATA has included 100% RTACAP funding for this project as a placeholder until funding availability is more concrete, which depends on CARES Act, SCA, and 5307. CATA typically receives ~$500k in 5307 funds each year and $285k is programmed for PM, leaving a balance of $215K for all other capital projects. |
2025 | $600,000 | $600,000 | $0 | $0 |
| RTD0009513 | Cape Ann | Transit | RTA vehicle replacement | CATA-Revenue Vehicle Replacement - 1 | This project is the replacement of one 2012 30-ft low floor bus that reached the end of its useful life in 2022 (10-year ULB). The vehicle purchased with these funds will be off the MVRTA Heavy-Duty Bus Procurement, which CATA participated in. The project supports CATA's Transit Asset Management Program by keeping assets in a state of good repair and investing in assets before the asset's condition deteriorates to an unacceptable level. CATA has included a 50/50 5307/RTACAP match for this project. CATA typically receives ~$500k in 5307 funds each year and $285k are programmed for PM, leaving a balance of $215K for all other capital projects. |
2025 | $450,000 | $225,000 | $225,000 | $0 |
| FFY 2026 | |||||||||
| RTD0009480 | Cape Ann | Transit | RTA facility and vehicle maintenance | CA TA-Preventive Maintenance | PM activities | 2026 | $356,250 | $0 | $285,000 | $71,250 |
| RTD0009481 | Cape Ann | Transit | RTA vehicle replacement | CATA-Revenue Vehicle Replacement - 4 | Replacement of 2016 International body-on-chassis vehicles. This project is the replacement of four 2016 29-ft body-on-chassis buses that reached the end of their useful life in 2023 (7 year life). CATA has not identified a procurement for the purchase of the vehicles. The project supports CATA's Transit Asset Management Program by keeping assets in a state of good repair and investing in assets before the asset's condition deteriorates to an unacceptable level. CATA has included 100% RTACAP funding for this project as a placeholder until funding availability is more concrete, which depends on CARES Act, SCA, and 5307. CATA typically receives ~$500k in 5307 funds each year and $285k is programmed for PM, leaving a balance of $215K for all other capital projects. |
2026 | $1,200,000 | $1,200,000 | $0 | $0 |
Proponent: This field lists the primary advocate for each project, who is responsible for seeing the project through to completion.
ID Number: This number references the project’s identification number in MassDOT’s project-tracking system.
Project Type: This field provides the type of project programmed. For those projects programmed with Regional Target funds (projects listed in Section 1A of the TIP tables), the projects are categorized according to the MPO’s six investment programs (Bicycle and Pedestrian, Complete Streets, Intersection Improvements, Major Infrastructure, Community Connections, and Transit Modernization). For those projects programmed directly by MassDOT (projects listed in Sections 1B, 2A, 2B, and 2C), MassDOT’s STIP Program categories are applied.
Cost: This is the total project cost as programmed in the TIP across all fiscal years, including years outside of FFYs 2022–26.
Funding Source: This identifies whether a project is funded using the MPO’s Regional Target funds or MassDOT’s statewide highway funds.
Scoring Summary: This table shows the number of points awarded to the project across each of the MPO’s project evaluation categories. MPO staff has not evaluated all projects in the TIP; staff only evaluates projects that are being considered for funding with the MPO’s Regional Target funds. The field definitions for the tables are as follows:
As mentioned in Chapter 2, the MPO adopted a revised set of project selection criteria in October 2020. These new criteria were used to score new projects under consideration for funding using the MPO’s Regional Target funds this year. The point allocations detailed above are those that were in effect under the prior scoring system, as no new projects were selected for funding in the FFYs 2022–26 TIP through the MPO’s Bicycle and Pedestrian, Complete Streets, Intersection Improvements, and Major Infrastructure investment programs. Updates were made to the criteria for the MPO’s Community Connections Program; the scoring summary field denotes whether each of these projects was scored under the original or revised criteria. Further details on all of the MPO’s project selection criteria are available in Appendix A.
Project Description: The description of the project is based, in part, on the written description of the project on MassDOT’s Project Information website. In some cases, these descriptions have been modified to clarify the details of the projects. Projects evaluated by the MPO tend to have more detailed descriptions, as more complete project documentation was provided to MPO staff for these projects.
Funding Summary: Funding tables are included for each project and show the following information:
For more information on all projects please visit MassDOT’s Project Information website, https://hwy.massdot.state.ma.us/projectinfo/projectinfo.asp, the Boston Region MPO’s website, www.bostonmpo.org, or contact Matt Genova, TIP Manager, at mgenova@ctps.org.
Proponent: Acton
ID Number: 608229
Project Type: Intersection Improvements
Cost: $15,311,125
Funding Source: Regional Target Funds
Scoring Summary
| Category |
Safety |
Sys Pres |
CM/M |
CA/SC |
TE |
EV |
Total |
|---|---|---|---|---|---|---|---|
Score |
15 out of 30 |
8 out of 29 |
10 out of 29 |
8 out of 16 |
0 out of 12 |
4 out of 18 |
45 out of 134 |
Project Description
This project involves improvements to address traffic congestion and the safety of pedestrians and bicyclists through the addition of turning lanes and the reduction and consolidation of curb cuts. Full accommodations for vehicular, bicycle, and pedestrian travel and upgraded signage and wayfinding will also be established to improve accessibility for all users who travel to and from the nearby businesses.
| Source |
(FFY) 2022 |
2023 |
2024 |
2025 |
2026 |
Total |
|---|---|---|---|---|---|---|
Federal Funds |
$12,248,900 |
--- |
--- |
--- |
--- |
$12,248,900 |
Non-Federal Funds |
$3,062,225 |
--- |
--- |
--- |
--- |
$3,062,225 |
Total Funds |
$15,311,125 |
--- |
--- |
--- |
--- |
$15,311,125 |
This is a MassDOT-prioritized project and is therefore not directly evaluated using the MPO’s TIP scoring criteria.
The project will make upgrades at the intersection to improve safety. The upgrades will include signs, pavement markings, and traffic signals as identified through a Road Safety Audit process in the Town of Acton.
| Source |
(FFY) 2022 |
2023 |
2024 |
2025 |
2026 |
Total |
|---|---|---|---|---|---|---|
Federal Funds |
--- |
--- |
--- |
--- |
$3,944,096 |
$3,944,096 |
Non-Federal Funds |
--- |
--- |
--- |
--- |
$438,233 |
$438,233 |
Total Funds |
--- |
--- |
--- |
--- |
$4,382,329 |
$4,382,329 |
This project received a total score of 29 points when evaluated using the criteria for the second round of the MPO’s Community Connections Program. These criteria differ from those used during the pilot round of this program in FFY 2021, as updates were made to the criteria based on the results of that pilot. These criteria are listed in Table A-5.
This project will implement digital parking management products to improve the efficiency of permitting and enforcement processes at five commuter parking lots surrounding the MBTA South Acton commuter rail station. These highly utilized lots provide nearly 500 parking spaces. The project will support the transition from a paper-based parking management system to a cloud-based one that will be more convenient for commuters and Acton’s parking management team.
| Source |
(FFY) 2022 |
2023 |
2024 |
2025 |
2026 |
Total |
|---|---|---|---|---|---|---|
Federal Funds |
$16,000 |
--- |
--- |
--- |
--- |
$16,000 |
Non-Federal Funds |
$4,000 |
--- |
--- |
--- |
--- |
$4,000 |
Total Funds |
$20,000 |
--- |
--- |
--- |
--- |
$20,000 |
This is a MassDOT-prioritized project and is therefore not directly evaluated using the MPO’s TIP scoring criteria.
This project includes pavement preservation work on Route 2 in Acton, Boxborough, and Littleton.
| Source |
(FFY) 2022 |
2023 |
2024 |
2025 |
2026 |
Total |
|---|---|---|---|---|---|---|
Federal Funds |
--- |
--- |
--- |
$6,275,146 |
--- |
$6,275,146 |
Non-Federal Funds |
--- |
--- |
--- |
$1,568,786 |
--- |
$1,568,786 |
Total Funds |
--- |
--- |
--- |
$7,843,932 |
--- |
$7,843,932 |
This is a MassDOT-prioritized project and is therefore not directly evaluated using the MPO’s TIP scoring criteria.
This project will make upgrades to promote safety along the roadways surrounding Stratton Elementary School in Arlington through the Safe Routes to School program.
| Source |
(FFY) 2022 |
2023 |
2024 |
2025 |
2026 |
Total |
|---|---|---|---|---|---|---|
Federal Funds |
--- |
--- |
$858,202 |
--- |
--- |
$858,202 |
Non-Federal Funds |
--- |
--- |
$214,550 |
--- |
--- |
$214,550 |
Total Funds |
--- |
--- |
$1,072,752 |
--- |
--- |
$1,072,752 |
This project received a total score of 52 points when evaluated using the criteria for the pilot round of the MPO’s Community Connections Program. These criteria are listed in Table A-14.
This project will expand the regional BlueBikes bike share system in Arlington, Newton, and Watertown, adding nine new docking stations. This project is being coordinated in partnership with the Metropolitan Area Planning Council and Lyft. The principal goals of the project are to provide an alternative travel mode to promote a shift away from single-occupancy vehicles and to increase access to transit hubs, business districts, and academic institutions throughout these communities and the region.
| Source |
(FFY) 2022 |
2023 |
2024 |
2025 |
2026 |
Total |
|---|---|---|---|---|---|---|
Federal Funds |
$272,000 |
--- |
--- |
--- |
--- |
$272,000 |
Non-Federal Funds |
$68,000 |
--- |
--- |
--- |
--- |
$68,000 |
Total Funds |
$340,000 |
--- |
--- |
--- |
--- |
$340,000 |
This is a MassDOT-prioritized project and is therefore not directly evaluated using the MPO’s TIP scoring criteria.
This project will replace bridge A-14-006, which carries Cordaville Road over the Sudbury River in Ashland.
| Source |
(FFY) 2022 |
2023 |
2024 |
2025 |
2026 |
Total |
|---|---|---|---|---|---|---|
Federal Funds |
--- |
--- |
--- |
--- |
$3,285,677 |
$3,285,677 |
Non-Federal Funds |
--- |
--- |
--- |
--- |
$821,419 |
$821,419 |
Total Funds |
--- |
--- |
--- |
--- |
$4,107,096 |
$4,107,096 |
| Category |
Safety |
Sys Pres |
CM/M |
CA/SC |
TE |
EV |
Total |
|---|---|---|---|---|---|---|---|
Score |
12 out of 30 |
10 out of 29 |
5 out of 29 |
2 out of 16 |
1 out of 12 |
8 out of 18 |
38 out of 134 |
The primary purpose of the project is to improve the safety features for the roadway corridors of Cherry Street and Main Street in order to establish a Federal Railroad Administration Quiet Zone surrounding the railroad crossings on those two roadways. This goal will primarily be accomplished through the installation of roadway medians and the enhancement of existing railroad crossing signals and gates. In addition, the project addresses a critical gap in the pedestrian sidewalk network through the construction of new sidewalks. The project’s other goals include improving the existing roadway condition through pavement reconstruction and enhancing stormwater drainage in the project area.
| Source |
(FFY) 2022 |
2023 |
2024 |
2025 |
2026 |
Total |
|---|---|---|---|---|---|---|
Federal Funds |
--- |
--- |
$1,015,462 |
--- |
--- |
$1,015,462 |
Non-Federal Funds |
--- |
--- |
$253,865 |
--- |
--- |
$253,865 |
Total Funds |
--- |
--- |
$1,269,327 |
--- |
--- |
$1,269,327 |
| Category |
Safety |
Sys Pres |
CM/M |
CA/SC |
TE |
EV |
Total |
|---|---|---|---|---|---|---|---|
Score |
17 out of 30 |
4 out of 29 |
9 out of 29 |
4 out of 16 |
1 out of 12 |
1 out of 18 |
36 out of 134 |
The primary purpose of this project is to reduce angled collisions and improve the pavement condition of the intersection on Route 2A at Willow Road and Bruce Street. This goal will primarily be accomplished by reconstructing the skewed intersection and adding a new signal system. In addition, the project will also address safety for pedestrians and bicyclists through the provision of five-foot wide shoulders and the addition of crosswalks.
| Source |
(FFY) 2022 |
2023 |
2024 |
2025 |
2026 |
Total |
|---|---|---|---|---|---|---|
Federal Funds |
$2,581,028 |
--- |
--- |
--- |
--- |
$2,581,028 |
Non-Federal Funds |
$645,257 |
--- |
--- |
--- |
--- |
$645,257 |
Total Funds |
$3,226,285 |
--- |
--- |
--- |
--- |
$3,226,285 |
| Category |
Safety |
Sys Pres |
CM/M |
CA/SC |
TE |
EV |
Total |
|---|---|---|---|---|---|---|---|
Score |
7 out of 30 |
13 out of 29 |
15 out of 29 |
7 out of 16 |
1 out of 12 |
4 out of 18 |
47 out of 134 |
The Minuteman Bikeway currently ends at Depot Park, in Bedford, near the intersection of South Road and Loomis Street. This project would extend the bikeway by making a 1,665 foot portion of Railroad Avenue accessible to bikes and by constructing 8,800 feet of bikeway on the Reformatory Branch Trail, from Railroad Avenue to Concord Road. The Railroad Avenue reconstruction will include new sidewalks, bicycle accommodations, drainage, pavement markings, signs, and defined curb cuts.
| Source |
(FFY) 2022 |
2023 |
2024 |
2025 |
2026 |
Total |
|---|---|---|---|---|---|---|
Federal Funds |
$8,800,134 |
--- |
--- |
--- |
--- |
$8,800,134 |
Non-Federal Funds |
$2,200,034 |
--- |
--- |
--- |
--- |
$2,200,034 |
Total Funds |
$11,000,168 |
--- |
--- |
--- |
--- |
$11,000,168 |
| Category |
Safety |
Sys Pres |
CM/M |
CA/SC |
TE |
EV |
Total |
|---|---|---|---|---|---|---|---|
Score |
12 out of 30 |
12 out of 29 |
12 out of 29 |
5 out of 16 |
0 out of 12 |
4 out of 18 |
45 out of 134 |
The primary purpose of this project is to improve the poor curb reveal, pavement condition and the lack of facilities for pedestrians and bicyclists. The project will include full-depth pavement reclamation and the reconstruction of existing sidewalks with five-foot shoulders to accommodate bicycle travel. In addition, pedestrian signal poles and intersection warning signage will be added to improve pedestrian safety and reduce rear-end collisions on Easy Street.
| Source |
(FFY) 2022 |
2023 |
2024 |
2025 |
2026 |
Total |
|---|---|---|---|---|---|---|
Federal Funds |
$5,118,526 |
--- |
--- |
--- |
--- |
$5,118,526 |
Non-Federal Funds |
$1,279,632 |
--- |
--- |
--- |
--- |
$1,279,632 |
Total Funds |
$6,398,158 |
--- |
--- |
--- |
--- |
$6,398,158 |
| Category |
Safety |
Sys Pres |
CM/M |
CA/SC |
TE |
EV |
Total |
|---|---|---|---|---|---|---|---|
Score |
13 out of 30 |
14 out of 29 |
16 out of 29 |
9 out of 16 |
4 out of 12 |
10 out of 18 |
66 out of 134 |
The project involves reconstruction of pavement and sidewalks along the Bridge Street corridor from the Danvers town line to River Street, excluding the Hall Whitaker drawbridge. The project includes cross section improvements to accommodate on-street parking and on-street bicycle accommodations. Existing traffic signal equipment at the intersection of Bridge Street at Livingstone Avenue will be upgraded, and new traffic signals will be installed at the intersection of Bridge Street with Kernwood Avenue and the intersection of Bridge Street with River Street. Under the proposed project, continuous cement concrete sidewalks with vertical granite curb will be provided along both sides of the roadway for the full length of the project. As part of the proposed project, a seven-foot wide parking shoulder will be provided on the eastbound side of the roadway to prevent vehicles from parking on the sidewalk. In addition, a five-foot wide shoulder for a bicycle lane will be provided along the corridor. Minor realignments will be performed at the intersections of Bridge Street with Cressy Street, County Way/Bates Park Avenue, and Eastern Avenue/Dolloff Avenue.
| Source |
(FFY) 2022 |
2023 |
2024 |
2025 |
2026 |
Total |
|---|---|---|---|---|---|---|
Federal Funds |
--- |
$6,354,293 |
--- |
--- |
--- |
$6,354,293 |
Non-Federal Funds |
--- |
$1,588,573 |
--- |
--- |
--- |
$1,588,573 |
Total Funds |
--- |
$7,942,866 |
--- |
--- |
--- |
$7,942,866 |
This is a MassDOT-prioritized project and is therefore not directly evaluated using the MPO’s TIP scoring criteria.
This project will involve the reconstruction of bridge B-16-181, which carries West Roxbury Parkway over the MBTA Needham commuter rail line.
| Source |
(FFY) 2022 |
2023 |
2024 |
2025 |
2026 |
Total |
|---|---|---|---|---|---|---|
Federal Funds |
--- |
$5,315,432 |
--- |
--- |
--- |
$5,315,432 |
Non-Federal Funds |
--- |
$1,328,858 |
--- |
--- |
--- |
$1,328,858 |
Total Funds |
--- |
$6,644,290 |
--- |
--- |
--- |
$6,644,290 |
This is a MassDOT-prioritized project and is therefore not directly evaluated using the MPO’s TIP scoring criteria.
This project will replace the superstructure of bridge B-16-107, which carries Canterbury Street over the Amtrak/MBTA tracks.
| Source |
(FFY) 2022 |
2023 |
2024 |
2025 |
2026 |
Total |
|---|---|---|---|---|---|---|
Federal Funds |
--- |
--- |
$3,742,554 |
--- |
--- |
$3,742,554 |
Non-Federal Funds |
--- |
--- |
$935,639 |
--- |
--- |
$935,639 |
Total Funds |
--- |
--- |
$4,678,193 |
--- |
--- |
$4,678,193 |
This is a MassDOT-prioritized project and is therefore not directly evaluated using the MPO’s TIP scoring criteria.
The North Washington Street Bridge is a historic structure constructed in 1898. The bridge consists of 10 approach spans and a swing span, which is not operational. The bridge is structurally deficient and is posted as weight restricted. There have been extensive emergency repairs done to the bridge in the past few years. Currently the two center lanes on the swing span are closed due to steel deterioration. The City of Boston proposes to replace the bridge. The existing granite/concrete bridge piers on the approach spans will be replaced with reinforced concrete V piers and continuous trapezoidal steel box girders. The proposed deck will provide for increased bicycle and pedestrian accommodations between Kearney Square and Rutherford Avenue. This project is funded over six fiscal years (FFYs 2017-22). The total cost of the project is $176,318,433, with $28,825,727 funded in this TIP and the remainder funded in prior fiscal years.
| Source |
(FFY) 2022 |
2023 |
2024 |
2025 |
2026 |
Total |
|---|---|---|---|---|---|---|
Federal Funds |
$23,060,582 |
--- |
--- |
--- |
--- |
$23,060,582 |
Non-Federal Funds |
$5,765,145 |
--- |
--- |
--- |
--- |
$5,765,145 |
Total Funds |
$28,825,727 |
--- |
--- |
--- |
--- |
$28,825,727 |
This is a MassDOT-prioritized project and is therefore not directly evaluated using the MPO’s TIP scoring criteria.
This project will make upgrades to promote safety along the roadways surrounding Ellis Elementary School in Boston through the Safe Routes to School program.
| Source |
(FFY) 2022 |
2023 |
2024 |
2025 |
2026 |
Total |
|---|---|---|---|---|---|---|
Federal Funds |
--- |
--- |
$838,096 |
--- |
--- |
$838,096 |
Non-Federal Funds |
--- |
--- |
$209,524 |
--- |
--- |
$209,524 |
Total Funds |
--- |
--- |
$1,047,620 |
--- |
--- |
$1,047,620 |
This is a MassDOT-prioritized project and is therefore not directly evaluated using the MPO’s TIP scoring criteria.
This project involves the replacement of guide and traffic signs on Interstate 93 and Interstate 90 within the Central Artery/Tunnel system, including applicable signing on intersecting secondary roadways. The project covers approximately six miles along Interstate 90 (mile markers 132 to 138) and five miles along Interstate 93 (mile markers 15 to 20). The project area includes the Ted Williams Tunnel from the Interstate 90 terminus in East Boston westbound to the Brookline/Boston city line east of St. Mary’s Street. The project area along Interstate 93 runs between Southhampton Street north to the Mystic Avenue off ramp.
| Source |
(FFY) 2022 |
2023 |
2024 |
2025 |
2026 |
Total |
|---|---|---|---|---|---|---|
Federal Funds |
--- |
--- |
--- |
--- |
$2,342,945 |
$2,342,945 |
Non-Federal Funds |
--- |
--- |
--- |
--- |
$260,327 |
$260,327 |
Total Funds |
--- |
--- |
--- |
--- |
$2,603,272 |
$2,603,272 |
| Category |
Safety |
Sys Pres |
CM/M |
CA/SC |
TE |
EV |
Total |
|---|---|---|---|---|---|---|---|
Score |
7 out of 30 |
6 out of 29 |
15 out of 29 |
12 out of 16 |
8 out of 12 |
12 out of 18 |
60 out of 134 |
This roadway improvement project will enhance pedestrian mobility and safety by providing neck downs at intersections. In addition, exclusive bike lanes in both directions will be established along Boylston Street to encourage local and regional bicycle travel. The project also involves an upgrade of the existing geometric layout and old signal equipment to reduce vehicular congestion and increase overall safety.
| Source |
(FFY) 2022 |
2023 |
2024 |
2025 |
2026 |
Total |
|---|---|---|---|---|---|---|
Federal Funds |
--- |
$6,932,042 |
--- |
--- |
--- |
$6,932,042 |
Non-Federal Funds |
--- |
$1,733,010 |
--- |
--- |
--- |
$1,733,010 |
Total Funds |
--- |
$8,665,052 |
--- |
--- |
--- |
$8,665,052 |
This is a MassDOT-prioritized project and is therefore not directly evaluated using the MPO’s TIP scoring criteria.
The project will make upgrades at the intersection to improve safety. The upgrades will include signs, pavement markings, and traffic signals as identified through a Road Safety Audit process.
| Source |
(FFY) 2022 |
2023 |
2024 |
2025 |
2026 |
Total |
|---|---|---|---|---|---|---|
Federal Funds |
--- |
--- |
--- |
--- |
$3,380,696 |
$3,180,602 |
Non-Federal Funds |
--- |
--- |
--- |
--- |
$845,174 |
$845,174 |
Total Funds |
--- |
--- |
--- |
--- |
$4,225,870 |
$4,225,870 |
| Category |
Safety |
Sys Pres |
CM/M |
CA/SC |
TE |
EV |
Total |
|---|---|---|---|---|---|---|---|
Score |
11 out of 30 |
4 out of 29 |
9 out of 29 |
10 out of 16 |
7 out of 12 |
1 out of 18 |
42 out of 134 |
This project will provide the final northern link of the Neponset River Greenway with the addition of approximately 0.77 miles of 10-foot paved, shared-use path between Tenean Beach and Morrissey Boulevard. The extension of the greenway will improve accessibility for pedestrian and bicycle transportation to Boston from Readville, Hyde Park, Milton, Mattapan, and Dorchester and will provide ADA-accessible connections to MBTA bus Routes 201 and 202 and the Savin Hill and Fields Corner MBTA stations. This project was evaluated using the MPO’s scoring criteria because it was considered for funding using Regional Target funds. MassDOT funded the project, however.
| Source |
(FFY) 2022 |
2023 |
2024 |
2025 |
2026 |
Total |
|---|---|---|---|---|---|---|
Federal Funds |
$7,047,418 |
--- |
--- |
--- |
--- |
$7,047,418 |
Non-Federal Funds |
$1,761,854 |
--- |
--- |
--- |
--- |
$1,761,854 |
Total Funds |
$8,809,272 |
--- |
--- |
--- |
--- |
$8,809,272 |
This project is funded using Regional Target funds, but was not scored using the MPO’s TIP project selection criteria. The project was evaluated through the MPO’s Long-Range Transportation Plan process.
The reconstruction of Rutherford Avenue from Sullivan Square to the North Washington Street Bridge will make the road a multimodal urban boulevard corridor. This project will be funded over five years, starting in FFY 2023. The total project cost is estimated to be $181,647,358, and the total funding in the FFYs 2022-26 TIP is $125,744,000. The City of Boston will contribute $25,000,000 in local funding towards the project, leaving the MPO with a balance of $30,903,358 to be funded in FFY 2027.
| Source |
(FFY) 2022 |
2023 |
2024 |
2025 |
2026 |
Total |
|---|---|---|---|---|---|---|
Federal Funds |
--- |
$23,792,962 |
$24,357,470 |
$25,644,767 |
$26,800,000 |
$100,595,199 |
Non-Federal Funds |
--- |
$5,948,241 |
$6,089,368 |
$6,411,192 |
$6,700,000 |
$25,148,801 |
Total Funds |
--- |
$29,741,203 |
$30,446,838 |
$32,055,959 |
$33,500,000 |
$125,744,000 |
This is a MassDOT-prioritized project and is therefore not directly evaluated using the MPO’s TIP scoring criteria.
This project aims to repair the existing deterioration in Sumner Tunnel by reconstructing the roadway pavement and repairing cracking and corrosion on the tunnel’s walls and ceiling. The total cost of this project is $136,722,750, with $22,115,687 in Regional Target funding allocated to the project. The rest of the project cost is funded using statewide highway funds. This project is funded over three years (FFYs 2021-23), with $73,983,312 in funding allocated in FFY 2021. The remainder of the project’s funding is included in this TIP as shown below.
| Source |
(FFY) 2022 |
2023 |
2024 |
2025 |
2026 |
Total |
|---|---|---|---|---|---|---|
Federal Funds |
$36,695,710 |
$13,495,841 |
--- |
--- |
--- |
$50,191,551 |
Non-Federal Funds |
$9,173,927 |
$3,373,960 |
--- |
--- |
--- |
$12,547,887 |
Total Funds |
$45,869,637 |
$16,869,801 |
--- |
--- |
--- |
$62,739,438 |
This is a MassDOT-prioritized project and is therefore not directly evaluated using the MPO’s TIP scoring criteria.
The project is an interstate maintenance resurfacing project on the Southeast Expressway. A preservation treatment or thin-bonded overlay is proposed to extend the pavement service life and improve safety.
| Source |
(FFY) 2022 |
2023 |
2024 |
2025 |
2026 |
Total |
|---|---|---|---|---|---|---|
Federal Funds |
--- |
$21,977,140 |
--- |
--- |
--- |
$21,977,140 |
Non-Federal Funds |
--- |
$2,441,904 |
--- |
--- |
--- |
$2,441,904 |
Total Funds |
--- |
$24,419,044 |
--- |
--- |
--- |
$24,419,044 |
This is a MassDOT-prioritized project and is therefore not directly evaluated using the MPO’s TIP scoring criteria.
This project will replace the highway lighting system on Interstate 93, from Neponset Avenue to the Braintree Split.
| Source |
(FFY) 2022 |
2023 |
2024 |
2025 |
2026 |
Total |
|---|---|---|---|---|---|---|
Federal Funds |
$10,126,836 |
--- |
--- |
--- |
--- |
$10,126,836 |
Non-Federal Funds |
$2,531,709 |
--- |
--- |
--- |
--- |
$2,531,709 |
Total Funds |
$12,658,545 |
--- |
--- |
--- |
--- |
$12,658,545 |
This is a MassDOT-prioritized project and is therefore not directly evaluated using the MPO’s TIP scoring criteria.
This project involves resurfacing and related work on Route 53.
| Source |
(FFY) 2022 |
2023 |
2024 |
2025 |
2026 |
Total |
|---|---|---|---|---|---|---|
Federal Funds |
--- |
$6,543,014 |
--- |
--- |
--- |
$6,543,014 |
Non-Federal Funds |
--- |
$1,635,754 |
--- |
--- |
--- |
$1,635,754 |
Total Funds |
--- |
$8,178,768 |
--- |
--- |
--- |
$8,178,768 |
This is a MassDOT-prioritized project and is therefore not directly evaluated using the MPO’s TIP scoring criteria.
This project includes resurfacing and related work on Route 3 in Braintree and Weymouth. The project’s extents run from mile marker 37.7 to mile marker 41.8 for a total of 4.1 miles, or from the Weymouth/Hingham town line to Union Street in Braintree.
| Source |
(FFY) 2022 |
2023 |
2024 |
2025 |
2026 |
Total |
|---|---|---|---|---|---|---|
Federal Funds |
--- |
--- |
--- |
--- |
$7,112,888 |
$7,112,888 |
Non-Federal Funds |
--- |
--- |
--- |
--- |
$1,778,222 |
$1,778,222 |
Total Funds |
--- |
--- |
--- |
--- |
$8,891,110 |
$8,891,110 |
This project received a total score of 49 points when evaluated using the criteria for the second round of the MPO’s Community Connections Program. These criteria differ from those used during the pilot round of this program in FFY 2021, as updates were made to the criteria based on the results of that pilot. These criteria are listed in Table A-5.
This project will expand the TRIPPS Program (Transportation, Resources, Information, Planning and Partnership for Seniors) with the development of online training modules and other educational materials. Proposed materials include a video, a PowerPoint presentation and written training documents. Materials will focus on transportation-related smartphone applications such as Google Maps, Transit, and Routematch (targeted to customers of the MBTA’s The RIDE). The primary goal of this project is to enable older adults to travel more confidently and easily on public and private transportation modes.
| Source |
(FFY) 2022 |
2023 |
2024 |
2025 |
2026 |
Total |
|---|---|---|---|---|---|---|
Federal Funds |
$34,896 |
--- |
--- |
--- |
--- |
$34,896 |
Non-Federal Funds |
$8,724 |
--- |
--- |
--- |
--- |
$8,724 |
Total Funds |
$43,620 |
--- |
--- |
--- |
--- |
$43,620 |
This is a MassDOT-prioritized project and is therefore not directly evaluated using the MPO’s TIP scoring criteria.
This project is a pavement maintenance project that will repave 4.1 miles of Interstate 95 northbound and southbound between the Cambridge Street interchange in Burlington and the Interstate 93 interchange in Woburn.
| Source |
(FFY) 2022 |
2023 |
2024 |
2025 |
2026 |
Total |
|---|---|---|---|---|---|---|
Federal Funds |
--- |
--- |
$10,089,068 |
--- |
--- |
$10,089,068 |
Non-Federal Funds |
--- |
--- |
$1,121,008 |
--- |
--- |
$1,121,008 |
Total Funds |
--- |
--- |
$11,210,075 |
--- |
--- |
$11,210,075 |
This project received a total score of 24 points when evaluated using the criteria for the pilot round of the MPO’s Community Connections Program. These criteria are listed in Table A-14.
This project will provide wayfinding measures at the MBTA’s Alewife Station that include directional information and real-time shuttle information for 128 Business Council shuttles, alerting passengers of upcoming arrivals and departures. These improvements will help riders find, track, and plan trips on the 128 Business Council’s shuttle buses and facilitate better connections to suburban areas using alternative transportation options.
| Source |
(FFY) 2022 |
2023 |
2024 |
2025 |
2026 |
Total |
|---|---|---|---|---|---|---|
Federal Funds |
$233,824 |
--- |
--- |
--- |
--- |
$233,824 |
Non-Federal Funds |
$58,456 |
--- |
--- |
--- |
--- |
$58,456 |
Total Funds |
$292,280 |
--- |
--- |
--- |
--- |
$292,280 |
This is a MassDOT-prioritized project and is therefore not directly evaluated using the MPO’s TIP scoring criteria.
This project will rehabilitate bridge C-01-031 in Cambridge.
| Source |
(FFY) 2022 |
2023 |
2024 |
2025 |
2026 |
Total |
|---|---|---|---|---|---|---|
Federal Funds |
--- |
--- |
--- |
$11,137,279 |
--- |
$11,137,279 |
Non-Federal Funds |
--- |
--- |
--- |
$2,784,320 |
--- |
$2,784,320 |
Total Funds |
--- |
--- |
--- |
$13,921,599 |
--- |
$13,921,599 |
This project is funded using Regional Target funds, but was not scored using the MPO’s TIP project selection criteria. The project was evaluated through the MPO’s Long-Range Transportation Plan process.
The purpose of this project is to improve corridor mobility, boost transit ridership, improve regional air quality, ensure equitable distribution of transit services, and support opportunities for sustainable development. The project will extend the MBTA Green Line from a relocated Lechmere Station in East Cambridge to College Avenue in Medford, with a branch to Union Square in Somerville. FFY 2022 is the sixth and final year of the Boston Region MPO’s funding obligation to the Green Line Extension. The project is expected to be complete by late 2021.
| Source |
(FFY) 2022 |
2023 |
2024 |
2025 |
2026 |
Total |
|---|---|---|---|---|---|---|
Federal Funds |
$21,693,506 |
--- |
--- |
--- |
--- |
$21,693,506 |
Non-Federal Funds |
$5,423,377 |
--- |
--- |
--- |
--- |
$5,423,377 |
Total Funds |
$27,116,883 |
--- |
--- |
--- |
--- |
$27,116,883 |
This is a MassDOT-prioritized project and is therefore not directly evaluated using the MPO’s TIP scoring criteria.
This project will replace bridge C-02-042 (33V), which carries Revere Court over the east branch of the Neponset River.
| Source |
(FFY) 2022 |
2023 |
2024 |
2025 |
2026 |
Total |
|---|---|---|---|---|---|---|
Federal Funds |
--- |
--- |
$2,094,346 |
--- |
--- |
$2,094,346 |
Non-Federal Funds |
--- |
--- |
$523,586 |
--- |
--- |
$523,586 |
Total Funds |
--- |
--- |
$2,617,932 |
--- |
--- |
$2,617,932 |
This project received a total score of 51 points when evaluated using the criteria for the pilot round of the MPO’s Community Connections Program. These criteria are listed in Table A-14.
This project will establish a shuttle service connecting Canton’s Royall Street employment cluster with the MBTA Route 128 commuter rail station and Ashmont, Mattapan Trolley, and Quincy Adams rapid transit stations. The goal of the project is to improve access to employment centers and major transit hubs by providing peak hour shuttle services for commuters and residents. The map above shows one of three planned routes for the shuttle, the precise details of which are under development.
| Source |
(FFY) 2022 |
2023 |
2024 |
2025 |
2026 |
Total |
|---|---|---|---|---|---|---|
Federal Funds |
$167,281 |
$141,742 |
$118,834 |
--- |
--- |
$427,857 |
Non-Federal Funds |
$41,820 |
$35,435 |
$29,780 |
--- |
--- |
$106,963 |
Total Funds |
$209,101 |
$177,177 |
$148,542 |
--- |
--- |
$534,820 |
This is a MassDOT-prioritized project and is therefore not directly evaluated using the MPO’s TIP scoring criteria.
This project will make highway lighting improvements on Interstate 93 and Interstate 95/Route 128.
| Source |
(FFY) 2022 |
2023 |
2024 |
2025 |
2026 |
Total |
|---|---|---|---|---|---|---|
Federal Funds |
--- |
$4,035,242 |
--- |
--- |
--- |
$4,035,242 |
Non-Federal Funds |
--- |
$1,008,810 |
--- |
--- |
--- |
$1,008,810 |
Total Funds |
--- |
$5,044,052 |
--- |
--- |
--- |
$5,044,052 |
This is a MassDOT-prioritized project and is therefore not directly evaluated using the MPO’s TIP scoring criteria.
The project consists of stormwater drainage improvements along Route 1 and Interstate 95.
| Source |
(FFY) 2022 |
2023 |
2024 |
2025 |
2026 |
Total |
|---|---|---|---|---|---|---|
Federal Funds |
$329,426 |
--- |
--- |
--- |
--- |
$329,426 |
Non-Federal Funds |
$82,356 |
--- |
--- |
--- |
--- |
$82,356 |
Total Funds |
$411,782 |
--- |
--- |
--- |
--- |
$411,782 |
| Category |
Safety |
Sys Pres |
CM/M |
CA/SC |
TE |
EV |
Total |
|---|---|---|---|---|---|---|---|
Score |
17 out of 30 |
10 out of 29 |
5 out of 29 |
8 out of 16 |
12 out of 12 |
9 out of 18 |
61 out of 134 |
This project will reconstruct one mile of Broadway. Improvements to the roadway will include surface and subsurface work, including replacement of utilities; construction of a dedicated bike lane along Broadway; and upgrades to the existing sidewalk network, including the installation of ADA-compliant ramps at all intersections.
| Source |
(FFY) 2022 |
2023 |
2024 |
2025 |
2026 |
Total |
|---|---|---|---|---|---|---|
Federal Funds |
$9,040,941 |
--- |
--- |
--- |
--- |
$9,040,941 |
Non-Federal Funds |
$2,260,235 |
--- |
--- |
--- |
--- |
$2,260,235 |
Total Funds |
$11,301,176 |
--- |
--- |
--- |
--- |
$11,301,176 |
| Category |
Safety |
Sys Pres |
CM/M |
CA/SC |
TE |
EV |
Total |
|---|---|---|---|---|---|---|---|
Score |
23 out of 30 |
18 out of 29 |
14 out of 29 |
4 out of 16 |
10 out of 12 |
14 out of 18 |
83 out of 134 |
This project aims to enhance the safety of all users of Broadway in Chelsea while promoting economic activity along the corridor. Improvements to pedestrian and bicycle infrastructure include the widening of sidewalks, installation of tree boxes, and the implementation of dedicated bike or combined bus and bike lanes with protective barrier options. In addition, the upgrading of signals and pavement markings at each intersection along the corridor will increase safety of pedestrians through higher levels of visual indication while allowing the implementation of transit signal priority for buses and emergency vehicles. This project will upgrade the entire corridor to ADA compliance and allow for more efficient on-boarding and off-boarding of MBTA bus patrons. This project was evaluated using the MPO’s scoring criteria because it was considered for funding using Regional Target Funds. MassDOT funded the project, however.
| Source |
(FFY) 2022 |
2023 |
2024 |
2025 |
2026 |
Total |
|---|---|---|---|---|---|---|
Federal Funds |
--- |
--- |
--- |
$5,796,001 |
--- |
$5,796,001 |
Non-Federal Funds |
--- |
--- |
--- |
$644,000 |
--- |
$644,000 |
Total Funds |
--- |
--- |
--- |
$6,440,001 |
--- |
$6,440,001 |
| Category |
Safety |
Sys Pres |
CM/M |
CA/SC |
TE |
EV |
Total |
|---|---|---|---|---|---|---|---|
Score |
16 out of 30 |
4 out of 29 |
8 out of 29 |
5 out of 16 |
1 out of 12 |
3 out of 18 |
37 out of 134 |
Work on this project includes corridor improvements from the Beechwood Street intersection to the Cohasset/Scituate town line. The Route 3A/Beechwood Street intersection will be upgraded with new traffic signal equipment as well as minor geometric improvements. The Route 3A/Henry Turner Bailey Road intersection will be reviewed for meeting requirements for traffic signals as well as geometric improvements. Pedestrian and bicycle accommodation will be included along the corridor.
| Source |
(FFY) 2022 |
2023 |
2024 |
2025 |
2026 |
Total |
|---|---|---|---|---|---|---|
Federal Funds |
--- |
--- |
$10,392,745 |
--- |
--- |
$10,392,745 |
Non-Federal Funds |
--- |
--- |
$2,598,186 |
--- |
--- |
$2,598,186 |
Total Funds |
--- |
--- |
$12,990,931 |
--- |
--- |
$12,990,931 |
This is a MassDOT-prioritized project and is therefore not directly evaluated using the MPO’s TIP scoring criteria.
The project consists of resurfacing and related work on Route 2A.
| Source |
(FFY) 2022 |
2023 |
2024 |
2025 |
2026 |
Total |
|---|---|---|---|---|---|---|
Federal Funds |
$2,598,760 |
--- |
--- |
--- |
--- |
$2,598,760 |
Non-Federal Funds |
$649,690 |
--- |
--- |
--- |
--- |
$649,690 |
Total Funds |
$3,248,450 |
--- |
--- |
--- |
--- |
$3,248,450 |
This is a MassDOT-prioritized project and is therefore not directly evaluated using the MPO’s TIP scoring criteria.
The project consists of resurfacing and related work on Route 114.
| Source |
(FFY) 2022 |
2023 |
2024 |
2025 |
2026 |
Total |
|---|---|---|---|---|---|---|
Federal Funds |
--- |
$906,706 |
--- |
--- |
--- |
$906,706 |
Non-Federal Funds |
--- |
$226,676 |
--- |
--- |
--- |
$226,676 |
Total Funds |
--- |
$1,133,382 |
--- |
--- |
--- |
$1,133,382 |
This is a MassDOT-prioritized project and is therefore not directly evaluated using the MPO’s TIP scoring criteria.
This project will replace guide and traffic signs on Interstate 95/Route 128 (Task ‘A’ Interchange).
| Source |
(FFY) 2022 |
2023 |
2024 |
2025 |
2026 |
Total |
|---|---|---|---|---|---|---|
Federal Funds |
$393,930 |
--- |
--- |
--- |
--- |
$393,930 |
Non-Federal Funds |
$43,770 |
--- |
--- |
--- |
--- |
$43,770 |
Total Funds |
$437,700 |
--- |
--- |
--- |
--- |
$437,700 |
This is a MassDOT-prioritized project and is therefore not directly evaluated using the MPO’s TIP scoring criteria.
This project will fund maintenance of bridge D-03-009, which carries Andover Street over the Ipswich River between Danvers and Middleton.
| Source |
(FFY) 2022 |
2023 |
2024 |
2025 |
2026 |
Total |
|---|---|---|---|---|---|---|
Federal Funds |
--- |
--- |
$4,385,674 |
--- |
--- |
$4,385,674 |
Non-Federal Funds |
--- |
--- |
$1,096,418 |
--- |
--- |
$1,096,418 |
Total Funds |
--- |
--- |
$5,482,092 |
--- |
--- |
$5,482,092 |
| Category |
Safety |
Sys Pres |
CM/M |
CA/SC |
TE |
EV |
Total |
|---|---|---|---|---|---|---|---|
Score |
5 out of 30 |
8 out of 29 |
5 out of 29 |
5 out of 16 |
7 out of 12 |
5 out of 18 |
35 out of 134 |
Improvements along the Bussey Street corridor will include resetting and setting the curb and reconstructing ADA-compliant sidewalks and ramps on both sides of the roadway. Some pavement reconstruction may be necessary to obtain the necessary curb reveal. Minor geometric improvements are expected at the intersection with Colburn Street and Clisby Avenue to make them more pedestrian friendly, since current conditions include expansive pavement width. Shared bicycle accommodations are planned.
| Source |
(FFY) 2022 |
2023 |
2024 |
2025 |
2026 |
Total |
|---|---|---|---|---|---|---|
Federal Funds |
--- |
$4,126,051 |
--- |
--- |
--- |
$4,126,051 |
Non-Federal Funds |
--- |
$1,031,513 |
--- |
--- |
--- |
$1,031,513 |
Total Funds |
--- |
$5,157,564 |
--- |
--- |
--- |
$5,157,564 |
| Category |
Safety |
Sys Pres |
CM/M |
CA/SC |
TE |
EV |
Total |
|---|---|---|---|---|---|---|---|
Score |
19 out of 30 |
10 out of 29 |
13 out of 29 |
4 out of 16 |
7 out of 12 |
1 out of 18 |
54 out of 134 |
This Complete Streets project involves the reconstruction of Beacham Street to reduce vehicular collisions and improve bicycle travel. This project also includes the implementation of a shared-use bike path with a buffer along 0.65 miles of the Beacham Street corridor, a major connection between Boston, Somerville, and Cambridge, and Chelsea and East Boston. To promote pedestrian safety, upgrades to traffic signals, pavement markings, and sidewalk conditions will be incorporated to reduce conflict with vehicular traffic and provide an ADA-compliant travel route.
| Source |
(FFY) 2022 |
2023 |
2024 |
2025 |
2026 |
Total |
|---|---|---|---|---|---|---|
Federal Funds |
--- |
--- |
--- |
$8,436,019 |
--- |
$8,436,019 |
Non-Federal Funds |
--- |
--- |
--- |
$2,109,005 |
--- |
$2,109,005 |
Total Funds |
--- |
--- |
--- |
$10,545,024 |
--- |
$10,545,024 |
This project received a total score of 72 points when evaluated using the criteria for the second round of the MPO’s Community Connections Program. These criteria differ from those used during the pilot round of this program in FFY 2021, as updates were made to the criteria based on the results of that pilot. These criteria are listed in Table A-5.
This project will update signal equipment to enable Transit Signal Priority (TSP) on up to nine signals along Main Street in Malden and Everett. This project will improve bus travel time and reliability to points of interest including the MBTA Orange Line (Malden Center, Wellington, and Sullivan Square Stations), bus stops, and the commuter rail station at Malden Center. The corridor serves several high ridership MBTA bus routes (97, 99, 104, 105, and 106). The project will improve commutes for approximately 1,800 weekday riders traveling on this corridor.
| Source |
(FFY) 2022 |
2023 |
2024 |
2025 |
2026 |
Total |
|---|---|---|---|---|---|---|
Federal Funds |
$180,000 |
--- |
--- |
--- |
--- |
$180,000 |
Non-Federal Funds |
$45,000 |
--- |
--- |
--- |
--- |
$45,000 |
Total Funds |
$225,000 |
--- |
--- |
--- |
--- |
$225,000 |
This is a MassDOT-prioritized project and is therefore not directly evaluated using the MPO’s TIP scoring criteria.
The project consists of resurfacing on Route 1 in Foxborough, Sharon, and Walpole.
| Source |
(FFY) 2022 |
2023 |
2024 |
2025 |
2026 |
Total |
|---|---|---|---|---|---|---|
Federal Funds |
--- |
$5,735,874 |
--- |
--- |
--- |
$5,735,874 |
Non-Federal Funds |
--- |
$1,433,969 |
--- |
--- |
--- |
$1,433,969 |
Total Funds |
--- |
$7,169,843 |
--- |
--- |
--- |
$7,169,843 |
| Category |
Safety |
Sys Pres |
CM/M |
CA/SC |
TE |
EV |
Total |
|---|---|---|---|---|---|---|---|
Score |
9 out of 30 |
10 out of 29 |
7 out of 29 |
9 out of 16 |
2 out of 12 |
4 out of 18 |
41 out of 134 |
This project will improve vehicular operations and safety by installing traffic signals and geometric improvements at the intersection of Edgell Road and Central Street. The geometric improvements include realigning and widening the roadway to provide a southbound left-turn lane and a northbound right-turn lane along Edgell Road. The project also addresses pedestrian and bicyclist safety through the addition of bike lanes, crosswalks, and a new traffic signal. Sidewalks along both sides of all roadways will be ADA/Architectural Access Board (AAB) compliant.
| Source |
(FFY) 2022 |
2023 |
2024 |
2025 |
2026 |
Total |
|---|---|---|---|---|---|---|
Federal Funds |
--- |
$2,132,706 |
--- |
--- |
--- |
$2,132,706 |
Non-Federal Funds |
--- |
$533,176 |
--- |
--- |
--- |
$533,176 |
Total Funds |
--- |
$2,665,882 |
--- |
--- |
--- |
$2,665,882 |
This is a MassDOT-prioritized project and is therefore not directly evaluated using the MPO’s TIP scoring criteria.
This project consists of resurfacing and related work on Route 9.
| Source |
(FFY) 2022 |
2023 |
2024 |
2025 |
2026 |
Total |
|---|---|---|---|---|---|---|
Federal Funds |
--- |
--- |
--- |
--- |
$11,266,302 |
$11,266,302 |
Non-Federal Funds |
--- |
--- |
--- |
--- |
$2,816,576 |
$2,816,576 |
Total Funds |
--- |
--- |
--- |
--- |
$14,082,878 |
$14,082,878 |
This is a MassDOT-prioritized project and is therefore not directly evaluated using the MPO’s TIP scoring criteria.
This project will replace bridge H-03-002 (2R5), which carries Winthrop Street over the
Ipswich River.
| Source |
(FFY) 2022 |
2023 |
2024 |
2025 |
2026 |
Total |
|---|---|---|---|---|---|---|
Federal Funds |
--- |
--- |
$2,605,118 |
--- |
--- |
$2,605,118 |
Non-Federal Funds |
--- |
--- |
$651,279 |
--- |
--- |
$651,279 |
Total Funds |
--- |
--- |
$3,256,397 |
--- |
--- |
$3,256,397 |
| Category |
Safety |
Sys Pres |
CM/M |
CA/SC |
TE |
EV |
Total |
|---|---|---|---|---|---|---|---|
Score |
10 out of 30 |
16 out of 29 |
17 out of 29 |
10 out of 16 |
0 out of 12 |
2 out of 18 |
55 out of 134 |
The project improves multimodal access between Hingham Center, residential areas, and Hingham Harbor by extending the existing buffered, shared-use bike path from Rockland Street to the Hingham inner harbor. In addition, improvements to reduce vehicular accidents will be incorporated through the establishment of turn lanes and a small roundabout at the intersection of Route 3A and Summer Street.
| Source |
(FFY) 2022 |
2023 |
2024 |
2025 |
2026 |
Total |
|---|---|---|---|---|---|---|
Federal Funds |
--- |
--- |
--- |
$12,379,360 |
--- |
$12,379,360 |
Non-Federal Funds |
--- |
--- |
--- |
$3,094,840 |
--- |
$3,094,840 |
Total Funds |
--- |
--- |
--- |
$15,474,200 |
--- |
$15,474,200 |
This is a MassDOT-prioritized project and is therefore not directly evaluated using the MPO’s TIP scoring criteria.
The project would improve the interchange of Interstate 90 and Interstate 495. A number of alternatives are being developed and evaluated in a feasibility study. This project is funded over six federal fiscal years (FFYs 2022-27) for a total cost of $285,366,126.
| Source |
(FFY) 2022 |
2023 |
2024 |
2025 |
2026 |
Total |
|---|---|---|---|---|---|---|
Federal Funds |
$63,197,821 |
$43,188,991 |
$50,983,256 |
$33,079,372 |
$31,762,670 |
$222,212,110 |
Non-Federal Funds |
$11,267,630 |
$9,243,221 |
$8,544,535 |
$5,342,152 |
$3,529,186 |
$37,926,724 |
Total Funds |
$74,465,450 |
$52,432,212 |
$59,527,791 |
$38,421,524 |
$35,291,855 |
$260,138,834 |
| Category |
Safety |
Sys Pres |
CM/M |
CA/SC |
TE |
EV |
Total |
|---|---|---|---|---|---|---|---|
Score |
11 out of 30 |
10 out of 29 |
10 out of 29 |
6 out of 16 |
2 out of 12 |
8 out of 18 |
47 out of 134 |
In Ipswich, the project will reconstruct the roadway between Mineral Street and Poplar Street (3,200 feet) to improve the roadway surface. Minor geometric improvements at intersection and pedestrian crossings will be included. Sidewalks and wheelchair ramps will be improved in selected areas for ADA compliance. The drainage system is undersized and will be upgraded.
| Source |
(FFY) 2022 |
2023 |
2024 |
2025 |
2026 |
Total |
|---|---|---|---|---|---|---|
Federal Funds |
--- |
--- |
$4,561,661 |
--- |
--- |
$4,561,661 |
Non-Federal Funds |
--- |
--- |
$1,140,415 |
--- |
--- |
$1,140,415 |
Total Funds |
--- |
--- |
$5,702,076 |
--- |
--- |
$5,702,076 |
| Category |
Safety |
Sys Pres |
CM/M |
CA/SC |
TE |
EV |
Total |
|---|---|---|---|---|---|---|---|
Score |
12 out of 30 |
3 out of 29 |
11 out of 29 |
5 out of 16 |
1 out of 12 |
6 out of 18 |
38 out of 134 |
This project involves improvements to address traffic congestion and the safety of pedestrians and bicyclists through the addition of turning lanes and the reduction and consolidation of curb cuts. Full accommodations for vehicular, bicycle, and pedestrian travel and upgraded signage and wayfinding will also be established to improve accessibility for all users who travel to and from the nearby businesses.
| Source |
(FFY) 2022 |
2023 |
2024 |
2025 |
2026 |
Total |
|---|---|---|---|---|---|---|
Federal Funds |
--- |
--- |
$3,316,967 |
--- |
--- |
$3,316,967 |
Non-Federal Funds |
--- |
--- |
$829,242 |
--- |
--- |
$829,242 |
Total Funds |
--- |
--- |
$4,146,209 |
--- |
--- |
$4,146,209 |
| Category |
Safety |
Sys Pres |
CM/M |
CA/SC |
TE |
EV |
Total |
|---|---|---|---|---|---|---|---|
Score |
12 out of 30 |
9 out of 29 |
8 out of 29 |
4 out of 16 |
4 out of 12 |
4 out of 18 |
41 out of 134 |
This roadway and safety improvement project on Route 129 in Lynn includes drainage improvements, curbing, new sidewalks, wheelchair ramps, intersection improvements, pavement markings, signing, landscaping, and other incidental work. The project limits are from Colonial Avenue to about 150 feet south of Floyd Avenue (between Floyd and Cowdrey Road) for a total of 0.72 miles.
| Source |
(FFY) 2022 |
2023 |
2024 |
2025 |
2026 |
Total |
|---|---|---|---|---|---|---|
Federal Funds |
$5,079,630 |
--- |
--- |
--- |
--- |
$5,079,630 |
Non-Federal Funds |
$1,269,907 |
--- |
--- |
--- |
--- |
$1,269,907 |
Total Funds |
$6,349,537 |
--- |
--- |
--- |
--- |
$6,349,537 |
| Category |
Safety |
Sys Pres |
CM/M |
CA/SC |
TE |
EV |
Total |
|---|---|---|---|---|---|---|---|
Score |
19 out of 30 |
17 out of 29 |
9 out of 29 |
8 out of 16 |
10 out of 12 |
3 out of 18 |
66 out of 134 |
This project is focused on making key safety improvements for pedestrian and bicyclists. Existing sidewalks on Essex Street will be reconstructed to ADA/AAB standards and will be complemented by the addition of new on-street bicycle facilities. Pedestrian safety will be improved through the construction of curb bump-outs at intersections to reduce crosswalk length. In addition, operational improvements such as signal updates and pavement markings will be established to enhance safety.
| Source |
(FFY) 2022 |
2023 |
2024 |
2025 |
2026 |
Total |
|---|---|---|---|---|---|---|
Federal Funds |
--- |
--- |
$14,623,200 |
--- |
--- |
$14,623,200 |
Non-Federal Funds |
--- |
--- |
$3,655,800 |
--- |
--- |
$3,655,800 |
Total Funds |
--- |
--- |
$18,279,000 |
--- |
--- |
$18,279,000 |
| Category |
Safety |
Sys Pres |
CM/M |
CA/SC |
TE |
EV |
Total |
|---|---|---|---|---|---|---|---|
Score |
13 out of 30 |
13 out of 29 |
7 out of 29 |
2 out of 16 |
1 out of 12 |
3 out of 18 |
39 out of 134 |
This project involves multimodal safety and operational improvements at two locations on Broadway. Existing sidewalks will be reconstructed with the addition of on-street bicycle facilities close to connections to adjacent facilities. Operational improvements include traffic signal updates at Broadway’s intersections with Euclid Avenue and Jenness and Warwick Streets. Drainage improvements and pavement reconstruction will also be incorporated to improve access to businesses and schools. This project was evaluated using the MPO’s scoring criteria because it was considered for funding using Regional Target funds. MassDOT funded the project, however.
| Source |
(FFY) 2022 |
2023 |
2024 |
2025 |
2026 |
Total |
|---|---|---|---|---|---|---|
Federal Funds |
--- |
--- |
$5,261,826 |
--- |
--- |
$5,261,826 |
Non-Federal Funds |
--- |
--- |
$584,647 |
--- |
--- |
$584,647 |
Total Funds |
--- |
--- |
$5,846,473 |
--- |
--- |
$5,846,473 |
This is a MassDOT-prioritized project and is therefore not directly evaluated using the MPO’s TIP scoring criteria.
This project consists of the construction of the Route 107 (Fox Hill) bridge, which spans the Saugus River. The new bridge will serve as the permanent replacement for the proposed temporary drawbridge. The new bridge (aka Belden G. Bly Bridge) will be a single leaf bascule drawbridge. This project is funded over four years (FFYs 2019–22) for a total cost of $98,962,749.
| Source |
(FFY) 2022 |
2023 |
2024 |
2025 |
2026 |
Total |
|---|---|---|---|---|---|---|
Federal Funds |
$16,494,028 |
--- |
--- |
--- |
--- |
$16,494,028 |
Non-Federal Funds |
$4,123,507 |
--- |
--- |
--- |
--- |
$4,123,507 |
Total Funds |
$20,617,535 |
--- |
--- |
--- |
--- |
$20,617,535 |
This is a MassDOT-prioritized project and is therefore not directly evaluated using the MPO’s TIP scoring criteria.
The proposed Wakefield/Lynnfield Rail Trail extends from the Galvin Middle School in Wakefield north to the Lynnfield/Peabody town line, a distance of approximately 4.4 miles. Approximately 1.9 miles of the trail is located within Wakefield and 2.5 miles in Lynnfield. The corridor is the southern section of the former Newburyport Railroad and will connect to Peabody and the regional Border to Boston Trail.
| Source |
(FFY) 2022 |
2023 |
2024 |
2025 |
2026 |
Total |
|---|---|---|---|---|---|---|
Federal Funds |
--- |
--- |
--- |
--- |
$9,339,149 |
$9,339,149 |
Non-Federal Funds |
--- |
--- |
--- |
--- |
$2,334,787 |
$2,334,787 |
Total Funds |
--- |
--- |
--- |
--- |
$11,673,936 |
$11,673,936 |
This project received a total score of 73 points when evaluated using the criteria for the second round of the MPO’s Community Connections Program. These criteria differ from those used during the pilot round of this program in FFY 2021, as updates were made to the criteria based on the results of that pilot. These criteria are listed in Table A-5.
This project will create six new BlueBikes stations: three in Medford and three in Malden. Two stations are planned in Medford Square and Malden Center, with the other four locations determined by community engagement from the options shown on the map above. Each station will have 11 docks for its BlueBikes bicycles. The primary goals of this project are to provide a means to connect to neighboring communities and public transportation and to encourage modal shift from personal vehicles to active transportation.
| Source |
(FFY) 2022 |
2023 |
2024 |
2025 |
2026 |
Total |
|---|---|---|---|---|---|---|
Federal Funds |
$189,464 |
--- |
--- |
--- |
--- |
$189,464 |
Non-Federal Funds |
$47,366 |
--- |
--- |
--- |
--- |
$47,366 |
Total Funds |
$236,830 |
--- |
--- |
--- |
--- |
$236,830 |
This is a MassDOT-prioritized project and is therefore not directly evaluated using the MPO’s TIP scoring criteria.
This project includes pedestrian improvements at three key intersections for students approaching Roberts Elementary School. Improvements include the following: a full pedestrian signal, curb extensions, and improved lighting at the intersection of Fellsway with Paris Street and Fern Road, and sidewalk improvements from this intersection to the Roberts School along Park Street; pedestrian realignment, curb bump-outs, and pedestrian rapid-flashing beacons at the intersection of Salem Street and Hadley Place; and pedestrian rapid-flashing beacons, curb extensions, and improved lighting at the intersection of Fellsway and Grant Avenue.
| Source |
(FFY) 2022 |
2023 |
2024 |
2025 |
2026 |
Total |
|---|---|---|---|---|---|---|
Federal Funds |
--- |
--- |
--- |
$846,930 |
--- |
$846,930 |
Non-Federal Funds |
--- |
--- |
--- |
$211,733 |
--- |
$211,733 |
Total Funds |
--- |
--- |
--- |
$1,058,663 |
--- |
$1,058,663 |
This is a MassDOT-prioritized project and is therefore not directly evaluated using the MPO’s TIP scoring criteria.
This project includes pavement preservation work on Interstate 93 between Medford, Winchester, and Stoneham.
| Source |
(FFY) 2022 |
2023 |
2024 |
2025 |
2026 |
Total |
|---|---|---|---|---|---|---|
Federal Funds |
--- |
--- |
--- |
$21,729,215 |
--- |
$21,729,215 |
Non-Federal Funds |
--- |
--- |
--- |
$2,414,357 |
--- |
$2,414,357 |
Total Funds |
--- |
--- |
--- |
$24,143,572 |
--- |
$24,143,572 |
This is a MassDOT-prioritized project and is therefore not directly evaluated using the MPO’s TIP scoring criteria.
This project will make upgrades to promote safety along Holliston Street and Cassidy Lane in Medway through the Safe Routes to School program. These roadways are adjacent to Francis J. Burke Memorial Elementary School and Medway Middle School.
| Source |
(FFY) 2022 |
2023 |
2024 |
2025 |
2026 |
Total |
|---|---|---|---|---|---|---|
Federal Funds |
--- |
$1,189,606 |
--- |
--- |
--- |
$1,189,606 |
Non-Federal Funds |
--- |
$297,402 |
--- |
--- |
--- |
$297,402 |
Total Funds |
--- |
$1,487,008 |
--- |
--- |
--- |
$1,487,008 |
This is a MassDOT-prioritized project and is therefore not directly evaluated using the MPO’s TIP scoring criteria.
The project will replace the bridge that carries Route 62 (Maple Street) over the Ipswich River in Middleton.
| Source |
(FFY) 2022 |
2023 |
2024 |
2025 |
2026 |
Total |
|---|---|---|---|---|---|---|
Federal Funds |
--- |
--- |
$3,141,470 |
--- |
--- |
$3,141,470 |
Non-Federal Funds |
--- |
--- |
$785,367 |
--- |
--- |
$785,367 |
Total Funds |
--- |
--- |
$3,926,837 |
--- |
--- |
$3,926,837 |
| Category |
Safety |
Sys Pres |
CM/M |
CA/SC |
TE |
EV |
Total |
|---|---|---|---|---|---|---|---|
Score |
20 out of 30 |
7 out of 29 |
9 out of 29 |
-1 out of 16 |
3 out of 12 |
5 out of 18 |
43 out of 134 |
This project supports enhanced vehicular safety and traffic flow through the implementation of a road diet, additional roadway reconstruction, and enhanced signalization on the Route 16 (East Main Street) corridor from Route 109 (Medway Road) to Beaver Street. In addition, the project also addresses pedestrian and bicyclist safety through the addition of pavement markings for shared-use bike lanes and the construction of new six-foot sidewalks along both sides of the roadway.
| Source |
(FFY) 2022 |
2023 |
2024 |
2025 |
2026 |
Total |
|---|---|---|---|---|---|---|
Federal Funds |
--- |
--- |
--- |
--- |
$8,384,824 |
$8,384,824 |
Non-Federal Funds |
--- |
--- |
--- |
--- |
$2,096,206 |
$2,096,206 |
Total Funds |
--- |
--- |
--- |
--- |
$10,481,030 |
$10,481,030 |
This is a MassDOT-prioritized project and is therefore not directly evaluated using the MPO’s TIP scoring criteria.
This intersection ranked second in the 2008–10 Statewide Top 200 Intersection Crash List. This project addresses the high number and severity of crashes that occur at this intersection.
| Source |
(FFY) 2022 |
2023 |
2024 |
2025 |
2026 |
Total |
|---|---|---|---|---|---|---|
Federal Funds |
--- |
$6,360,274 |
--- |
--- |
--- |
$6,360,274 |
Non-Federal Funds |
--- |
$706,697 |
--- |
--- |
--- |
$706,697 |
Total Funds |
--- |
$7,066,971 |
--- |
--- |
--- |
$7,066,971 |
This is a MassDOT-prioritized project and is therefore not directly evaluated using the MPO’s TIP scoring criteria.
This project includes a 0.4-mile segment of shared-used path along Route 9 in Natick. The project limits are from Archer Drive to the Cochituate Rail Trail. No roadway crossings are proposed and the shared-use path will provide a bicycle and pedestrian connection between the Cochituate Rail Trail and the robust residential and commercial area that is located in close proximity to the project’s western terminus, filling a critical gap in the multimodal network.
| Source |
(FFY) 2022 |
2023 |
2024 |
2025 |
2026 |
Total |
|---|---|---|---|---|---|---|
Federal Funds |
--- |
--- |
--- |
$2,972,558 |
--- |
$2,972,558 |
Non-Federal Funds |
--- |
--- |
--- |
$743,140 |
--- |
$743,140 |
Total Funds |
--- |
--- |
--- |
$3,715,698 |
--- |
$3,715,698 |
This is a MassDOT-prioritized project and is therefore not directly evaluated using the MPO’s TIP scoring criteria.
This project will upgrade the intersections of Crafts Street and Albemarle Road and Albemarle Road and North Street, to improve bicycle and pedestrian accommodations near the Horace Mann Elementary School, FA Day Middle School, and the Newton Early Childhood Program. The project as proposed includes installing a fully actuated traffic signal at the Crafts Street and Albemarle Road intersection and a rapid-flashing-beacon crosswalk system at the Albemarle Road and North Street intersection. It will also require signal modifications to the existing traffic signal at Crafts Street at North Street.
| Source |
(FFY) 2022 |
2023 |
2024 |
2025 |
2026 |
Total |
|---|---|---|---|---|---|---|
Federal Funds |
--- |
--- |
--- |
$715,110 |
--- |
$715,110 |
Non-Federal Funds |
--- |
--- |
--- |
$178,777 |
--- |
$178,777 |
Total Funds |
--- |
--- |
--- |
$893,887 |
--- |
$893,887 |
This project received a total score of 53 points when evaluated using the MPO’s Community Connections Program criteria. These criteria are listed in table A-14.
This project funds a new technology-enabled transportation service that will serve all residents, students and employees in Newton. The system will provide shared, first- and last-mile rides between three MBTA rail lines and the Wells Avenue Business District before expanding citywide. The City will deliver the service using on-demand, dynamically routed microtransit technology. This system will build on Newton’s NewMo microtransit system, operated by Via, which will provide 25,000 rides to Newton seniors in its first year. This project is funded over three years (FFYs 2021-23) through the MPO’s Community Connections Program.
| Source |
(FFY) 2022 |
2023 |
2024 |
2025 |
2026 |
Total |
|---|---|---|---|---|---|---|
Federal Funds |
$220,000 |
$121,600 |
--- |
--- |
--- |
$341,600 |
Non-Federal Funds |
$55,000 |
$30,400 |
--- |
--- |
--- |
$85,400 |
Total Funds |
$275,000 |
$152,000 |
--- |
--- |
--- |
$427,000 |
| Category |
Safety |
Sys Pres |
CM/M |
CA/SC |
TE |
EV |
Total |
|---|---|---|---|---|---|---|---|
Score |
7 out of 30 |
16 out of 29 |
13 out of 29 |
6 out of 16 |
1 out of 12 |
8 out of 18 |
51 out of 134 |
The project aims to create safe bicycle and pedestrian facilities to improve the City of Newton’s connectivity to green space, trails, and other recreation opportunities. The proposed improvements to Route 30 and the adjacent carriageway begin just east of Auburn Street and end at Ash Street. For the segment from Auburn Street to Woodbine Street, the project will narrow the existing median and repurpose the space on the north side of the roadway to either a shared-use path or separated bicycle and pedestrian facilities. East of Woodbine Street, the existing 22-foot carriageway will be converted to the shared-use path or separated bicycle and pedestrian facilities. The existing cross section of Route 30 will be maintained, but five-foot shoulders will be striped to allow for on-road bicycling facilities. There will be three mid-block crossings with pedestrian beacons installed at MBTA bus stops and the Blue Heron trail entrance. The intersection at Ash Street will be reconstructed to improve pedestrian and bicycle crossings and address circulation issues at Lyons Field. This project was evaluated using the MPO’s scoring criteria because it was considered for funding using Regional Target Funds. MassDOT funded the project, however.
| Source |
(FFY) 2022 |
2023 |
2024 |
2025 |
2026 |
Total |
|---|---|---|---|---|---|---|
Federal Funds |
--- |
$5,342,286 |
--- |
--- |
--- |
$5,342,286 |
Non-Federal Funds |
--- |
$1,335,572 |
--- |
--- |
--- |
$1,335,572 |
Total Funds |
--- |
$6,677,858 |
--- |
--- |
--- |
$6,677,858 |
This is a MassDOT-prioritized project and is therefore not directly evaluated using the MPO’s TIP scoring criteria.
The work consists of cleaning and painting of structural steel on bridges N-12-0056 and W-31-006 in Newton and Westwood.
| Source |
(FFY) 2022 |
2023 |
2024 |
2025 |
2026 |
Total |
|---|---|---|---|---|---|---|
Federal Funds |
--- |
$1,782,857 |
--- |
--- |
--- |
$1,782,857 |
Non-Federal Funds |
--- |
$445,714 |
--- |
--- |
--- |
$445,714 |
Total Funds |
--- |
$2,228,571 |
--- |
--- |
--- |
$2,228,571 |
This is a MassDOT-prioritized project and is therefore not directly evaluated using the MPO’s TIP scoring criteria.
The work consists of cleaning (full removal) of the steel superstructure and painting of bridges N-12-056 and W-31-006.
| Source |
(FFY) 2022 |
2023 |
2024 |
2025 |
2026 |
Total |
|---|---|---|---|---|---|---|
Federal Funds |
$1,879,920 |
--- |
--- |
--- |
--- |
$1,879,920 |
Non-Federal Funds |
$469,980 |
--- |
--- |
--- |
--- |
$469,980 |
Total Funds |
$2,349,900 |
--- |
--- |
--- |
--- |
$2,349,900 |
| Category |
Safety |
Sys Pres |
CM/M |
CA/SC |
TE |
EV |
Total |
|---|---|---|---|---|---|---|---|
Score |
11 out of 30 |
12 out of 29 |
15 out of 29 |
11 out of 16 |
2 out of 12 |
4 out of 18 |
55 out of 134 |
This project includes traffic signal upgrades and associated geometric improvements at the intersection of Route 1 with University Avenue and Everett Street. Related improvements include constructing an additional travel lane in each direction on Route 1, upgrading of traffic signals, lengthening of left-turn lanes on Route 1, upgrading of pedestrian crossings at each leg of the intersection, and upgrading of bicycle amenities (loop detectors) at the intersection. Rehabilitation of sidewalks, curbing, median structures, lighting, and guard rails are also proposed.
| Source |
(FFY) 2022 |
2023 |
2024 |
2025 |
2026 |
Total |
|---|---|---|---|---|---|---|
Federal Funds |
--- |
--- |
--- |
$7,200,000 |
$13,406,377 |
$20,606,377 |
Non-Federal Funds |
--- |
--- |
--- |
$1,800,000 |
$3,351,594 |
$5,151,594 |
Total Funds |
--- |
--- |
--- |
$9,000,000 |
$16,757,971 |
$25,757,971 |
| Category |
Safety |
Sys Pres |
CM/M |
CA/SC |
TE |
EV |
Total |
|---|---|---|---|---|---|---|---|
Score |
13 out of 30 |
7 out of 29 |
14 out of 29 |
3 out of 16 |
3 out of 12 |
7 out of 18 |
47 out of 134 |
This project involves intersection improvements at two locations on Route 1A through the installation of traffic and pedestrian signals to support vehicle flow and roadway safety. In addition, Washington Street and Upland Road will be widened to accommodate turning lanes and existing sidewalks will be reconstructed to meet ADA/AAB standards with upgraded pavement markings.
| Source |
(FFY) 2022 |
2023 |
2024 |
2025 |
2026 |
Total |
|---|---|---|---|---|---|---|
Federal Funds |
--- |
$6,616,297 |
--- |
--- |
--- |
$6,616,297 |
Non-Federal Funds |
--- |
$1,654,074 |
--- |
--- |
--- |
$1,654,074 |
Total Funds |
--- |
$8,270,371 |
--- |
--- |
--- |
$8,270,371 |
| Category |
Safety |
Sys Pres |
CM/M |
CA/SC |
TE |
EV |
Total |
|---|---|---|---|---|---|---|---|
Score |
21 out of 30 |
17 out of 29 |
9 out of 29 |
3 out of 16 |
7 out of 12 |
4 out of 18 |
61 out of 134 |
Given the condition of the existing pavement based on a visual inspection, as well as the number of utility trenches that have exhibited signs of differential settlement, the project is currently proposed to reconstruct the pavement via full depth pavement reclamation. The project will also include the reconstruction of cement concrete sidewalks and crossings with curb extensions and new granite curbing, addition of dedicated bicycle accommodations (bike lane and/or sharrows), installation of new signage and pavement markings, streetscape enhancements and amenities, and drainage system improvements corridor-wide. For the reconstructed intersections noted, new signal equipment will be provided at all locations. All signal equipment proposed will be NEMA TS2 Type 1, with countdown pedestrian heads, vibrotactile pedestrian push buttons with audible speech messages, optical emergency vehicles preemption, and video vehicle detection.
| Source |
(FFY) 2022 |
2023 |
2024 |
2025 |
2026 |
Total |
|---|---|---|---|---|---|---|
Federal Funds |
--- |
$12,662,923 |
--- |
--- |
--- |
$12,662,923 |
Non-Federal Funds |
--- |
$3,165,731 |
--- |
--- |
--- |
$3,165,731 |
Total Funds |
--- |
$15,828,654 |
--- |
--- |
--- |
$15,828,654 |
| Category |
Safety |
Sys Pres |
CM/M |
CA/SC |
TE |
EV |
Total |
|---|---|---|---|---|---|---|---|
Score |
9 out of 30 |
4 out of 29 |
9 out of 29 |
4 out of 16 |
4 out of 12 |
4 out of 18 |
34 out of 134 |
This project will extend the Independence Greenway 1.3 miles east from its present terminus at the North Shore Mall to the intersection of the Warren Street Extension and Endicott Street in central Peabody. When complete, the project will bring the greenway’s total length to eight miles. This project makes use of an existing rail corridor as it runs parallel to Lowell Street.
| Source |
(FFY) 2022 |
2023 |
2024 |
2025 |
2026 |
Total |
|---|---|---|---|---|---|---|
Federal Funds |
--- |
--- |
$2,598,696 |
--- |
--- |
$2,598,696 |
Non-Federal Funds |
--- |
--- |
$649,674 |
--- |
--- |
$649,674 |
Total Funds |
--- |
--- |
$3,248,370 |
--- |
--- |
$3,248,370 |
| Category |
Safety |
Sys Pres |
CM/M |
CA/SC |
TE |
EV |
Total |
|---|---|---|---|---|---|---|---|
Score |
15 out of 30 |
13 out of 29 |
11 out of 29 |
4 out of 16 |
4 out of 12 |
6 out of 18 |
53 out of 134 |
The project includes construction of a new 12-foot wide multi-use paved path along the abandoned railbed between two existing segments of the Independence Greenway in Peabody. The project also includes a connection to the existing Border to Boston trailhead at Lowell Street. The work includes full-depth pavement construction, minor drainage improvements, vegetative privacy screening, new and reset granite curb, new cement concrete sidewalk and hot mix asphalt, signal upgrades at the intersections of Lowell and Bourbon Streets and Route 1 northbound and Lowell Street, a new two-span steel pedestrian bridge, and various curb, walking, and parking improvements to the existing parking lot at 215 Newbury Street.
| Source |
(FFY) 2022 |
2023 |
2024 |
2025 |
2026 |
Total |
|---|---|---|---|---|---|---|
Federal Funds |
--- |
--- |
--- |
$5,255,040 |
--- |
$5,255,040 |
Non-Federal Funds |
--- |
--- |
--- |
$1,313,760 |
--- |
$1,313,760 |
Total Funds |
--- |
--- |
--- |
$6,568,800 |
--- |
$6,568,800 |
| Category |
Safety |
Sys Pres |
CM/M |
CA/SC |
TE |
EV |
Total |
|---|---|---|---|---|---|---|---|
Score |
10 out of 30 |
16 out of 29 |
7 out of 29 |
4 out of 16 |
2 out of 12 |
1 out of 18 |
40 out of 134 |
This project involves traffic and safety improvements for all users along Sea Street through the reconstruction of sidewalks with ADA-compliant ramps, the provision of bicycle accommodations, and the construction of median islands. Geometric modifications of the roadway and upgraded traffic signal systems will also be established to enhance safety.
| Source |
(FFY) 2022 |
2023 |
2024 |
2025 |
2026 |
Total |
|---|---|---|---|---|---|---|
Federal Funds |
--- |
$4,674,754 |
--- |
--- |
--- |
$4,674,754 |
Non-Federal Funds |
--- |
$1,168,688 |
--- |
--- |
--- |
$1,168,688 |
Total Funds |
--- |
$5,843,442 |
--- |
--- |
--- |
$5,843,442 |
This is a MassDOT-prioritized project and is therefore not directly evaluated using the MPO’s TIP scoring criteria.
This project involves the resurfacing of 13.2 lane miles of Route 28 in Randolph. The project includes two sections of Route 28, from mile marker 105.8 to 107.4 and from mile marker 107.6 to 109.3.
| Source |
(FFY) 2022 |
2023 |
2024 |
2025 |
2026 |
Total |
|---|---|---|---|---|---|---|
Federal Funds |
--- |
--- |
$5,544,651 |
--- |
--- |
$5,544,651 |
Non-Federal Funds |
--- |
--- |
$1,386,163 |
--- |
--- |
$1,386,163 |
Total Funds |
--- |
--- |
$6,930,814 |
--- |
--- |
$6,930,814 |
The scoring criteria for the Community Connections Program are listed in Appendix A. Scores for projects funded in the FFYs 2022-26 TIP through this program are available on those projects’ pages within this chapter.
The Community Connections (CC) Program is the MPO’s funding program for first- and last-mile solutions, community transportation, and other small, nontraditional transportation projects such as those that upde transit technology and improve bicycle and pedestrian facilities. The CC program is one of the investment programs included in the MPO’s current Long-Range Transportation Plan, Destination 2040, and is funded at a level of $2 million per year in Regional Target funds beginning in FFY 2021. Ten projects are funded in the FFYs 2022-26 TIP through this program, the details of which are available in this chapter. Remaining funding in FFYs 2023 through 2026 will be allocated during future TIP cycles.
| Source |
(FFY) 2022 |
2023 |
2024 |
2025 |
2026 |
Total |
|---|---|---|---|---|---|---|
Federal Funds |
--- |
$1,336,658 |
$1,481,166 |
$1,600,000 |
$1,600,000 |
$6,017,825 |
Non-Federal Funds |
--- |
$334,165 |
$370,292 |
$400,000 |
$400,000 |
$1,504,456 |
Total Funds |
--- |
$1,670,823 |
$1,851,458 |
$2,000,000 |
$2,000,000 |
$7,522,281 |
No projects have yet been scored using the Transit Modernization criteria. Projects will be evaluated by the MPO in future TIP cycles for funding within this investment program.
The MPO’s Transit Modernization Program was established in Destination 2040, the MPO’s current Long-Range Transportation Plan. This program will allocate a portion of the MPO’s Regional Target Highway funds to transit projects that advance the MPO’s goals in the region, including upgrades to stations and facilities and the purchase of vehicles for transit providers. Scoring criteria are being developed for this program during FFY 2020 and specific projects
will be funded through this program during a future TIP cycle. The MPO anticipates allocating
five percent of its funding, or approximately $5,500,000 annually, to this program beginning in FFY 2025.
| Source |
(FFY) 2022 |
2023 |
2024 |
2025 |
2026 |
Total |
|---|---|---|---|---|---|---|
Federal Funds |
--- |
--- |
--- |
$4,400,000 |
$4,400,000 |
$8,800,000 |
Non-Federal Funds |
--- |
--- |
--- |
$1,100,000 |
$1,100,000 |
$2,200,000 |
Total Funds |
--- |
--- |
--- |
$5,500,000 |
$5,500,000 |
$11,000,000 |
This project received a total score of 64 points when evaluated using the criteria for the second round of the MPO’s Community Connections Program. These criteria differ from those used during the pilot round of this program in FFY 2021, as updates were made to the criteria based on the results of that pilot. These criteria are listed in Table A-5.
This project will create 750 new bicycle parking spaces and 2,400 bicycle parking spots in cages. The new bicycle facilities will be more secure and accessible for riders. These infrastructure upgrades and modernization work will be conducted at up to 40 MBTA rapid transit and commuter rail stations and their adjoining parking lots. Sixteen stations have high utilization rates of their bicycle racks that often exceed capacity during the warmer months, and the remaining 24 stations have underdeveloped bicycle parking in areas that would highly benefit from increased capacity.
| Source |
(FFY) 2022 |
2023 |
2024 |
2025 |
2026 |
Total |
|---|---|---|---|---|---|---|
Federal Funds |
$220,592 |
--- |
--- |
--- |
--- |
$220,592 |
Non-Federal Funds |
$55,148 |
--- |
--- |
--- |
--- |
$55,148 |
Total Funds |
$275,740 |
--- |
--- |
--- |
--- |
$275,740 |
This is a MassDOT-prioritized project and is therefore not directly evaluated using the MPO’s TIP scoring criteria.
This Safe Routes to School project proposes pedestrian improvements at several intersections surrounding Beachmont Veterans Elementary School in Revere. This project will reconstruct sections of sidewalk and curbing, improve markings at several crosswalks, and add tactile warning panels at some locations.
| Source |
(FFY) 2022 |
2023 |
2024 |
2025 |
2026 |
Total |
|---|---|---|---|---|---|---|
Federal Funds |
--- |
--- |
--- |
$280,731 |
--- |
$280,731 |
Non-Federal Funds |
--- |
--- |
--- |
$70,183 |
--- |
$70,183 |
Total Funds |
--- |
--- |
--- |
$350,914 |
--- |
$350,914 |
This is a MassDOT-prioritized project and is therefore not directly evaluated using the MPO’s TIP scoring criteria.
This project will replace bridge S-01-024, which carries Jefferson Avenue over Parallel Street in Salem.
| Source |
(FFY) 2022 |
2023 |
2024 |
2025 |
2026 |
Total |
|---|---|---|---|---|---|---|
Federal Funds |
--- |
--- |
--- |
--- |
$2,683,776 |
$2,683,776 |
Non-Federal Funds |
--- |
--- |
--- |
--- |
$670,944 |
$670,944 |
Total Funds |
--- |
--- |
--- |
--- |
$3,354,720 |
$3,354,720 |
This is a MassDOT-prioritized project and is therefore not directly evaluated using the MPO’s TIP scoring criteria.
The project includes traffic signal upgrades and safety improvements at the following locations: Mystic Avenue northbound and Route 28 (Fellsway); Route 38 (Mystic Avenue) southbound and Route 28 (McGrath Highway) southbound; Route 38 (Mystic Avenue) southbound and Route 28 (McGrath Highway) northbound; and Route 38 (Mystic Avenue) southbound at Wheatland Street.
| Source |
(FFY) 2022 |
2023 |
2024 |
2025 |
2026 |
Total |
|---|---|---|---|---|---|---|
Federal Funds |
--- |
$5,510,303 |
--- |
--- |
--- |
$5,510,303 |
Non-Federal Funds |
--- |
$612,256 |
--- |
--- |
--- |
$612,256 |
Total Funds |
--- |
$6,122,559 |
--- |
--- |
--- |
$6,122,559 |
This is a MassDOT-prioritized project and is therefore not directly evaluated using the MPO’s TIP scoring criteria.
This project will replace the bridge deck and repair the superstructure on bridge S-27-006 (2L2), carrying Fellsway West over Interstate 93 in Stoneham.
| Source |
(FFY) 2022 |
2023 |
2024 |
2025 |
2026 |
Total |
|---|---|---|---|---|---|---|
Federal Funds |
$2,400,000 |
--- |
--- |
--- |
--- |
$2,400,000 |
Non-Federal Funds |
$600,000 |
--- |
--- |
--- |
--- |
$600,000 |
Total Funds |
$3,000,000 |
--- |
--- |
--- |
--- |
$3,000,000 |
This is a MassDOT-prioritized project and is therefore not directly evaluated using the MPO’s TIP scoring criteria.
This project will make intersection improvements at Route 28 (Main Street), North Border Road, and South Street in Stoneham.
| Source |
(FFY) 2022 |
2023 |
2024 |
2025 |
2026 |
Total |
|---|---|---|---|---|---|---|
Federal Funds |
--- |
--- |
--- |
--- |
$3,784,501 |
$3,784,501 |
Non-Federal Funds |
--- |
--- |
--- |
--- |
$420,500 |
$420,500 |
Total Funds |
--- |
--- |
--- |
--- |
$4,205,001 |
$4,205,001 |
This is a MassDOT-prioritized project and is therefore not directly evaluated using the MPO’s TIP scoring criteria.
Bridge S-29-11, which carries Box Mill Road over Elizabeth Brook, is a structurally deficient bridge. The full replacement will include new substructure, steel beams, and concrete deck. One sidewalk will be added to the structure.
| Source |
(FFY) 2022 |
2023 |
2024 |
2025 |
2026 |
Total |
|---|---|---|---|---|---|---|
Federal Funds |
--- |
$2,874,067 |
--- |
--- |
--- |
$2,874,067 |
Non-Federal Funds |
--- |
$718,517 |
--- |
--- |
--- |
$718,517 |
Total Funds |
--- |
$3,592,584 |
--- |
--- |
--- |
$3,592,584 |
| Category |
Safety |
Sys Pres |
CM/M |
CA/SC |
TE |
EV |
Total |
|---|---|---|---|---|---|---|---|
Score |
7 out of 30 |
3 out of 29 |
16 out of 29 |
9 out of 16 |
1 out of 12 |
4 out of 18 |
40 out of 134 |
The proposed project involves construction of a 4.6 mile trail in Sudbury, from the Concord town line to Station Road. The proposed work includes improvements to two structures and upgrades to several at-grade crossings, including Route 117 (North Road), Pantry Road, and Route 27 (Hudson Road). Related work includes pavement markings, installation of guardrails, and landscaping. Construction of this phase will accompany the completion of Phase 2C of the trail, closing the gap between Powder Mill Road in Concord and the Sudbury town line to create one contiguous path.
| Source |
(FFY) 2022 |
2023 |
2024 |
2025 |
2026 |
Total |
|---|---|---|---|---|---|---|
Federal Funds |
$10,309,341 |
--- |
--- |
--- |
--- |
$10,309,341 |
Non-Federal Funds |
$2,577,335 |
--- |
--- |
--- |
--- |
$2,577,335 |
Total Funds |
$12,886,676 |
--- |
--- |
--- |
--- |
$12,886,676 |
This is a MassDOT-prioritized project and is therefore not directly evaluated using the MPO’s TIP scoring criteria.
This project will replace T-06-013, which carries Perkins Row over Mile Brook in Topsfield.
| Source |
(FFY) 2022 |
2023 |
2024 |
2025 |
2026 |
Total |
|---|---|---|---|---|---|---|
Federal Funds |
--- |
--- |
--- |
--- |
$2,699,873 |
$2,699,873 |
Non-Federal Funds |
--- |
--- |
--- |
--- |
$674,968 |
$674,968 |
Total Funds |
--- |
--- |
--- |
--- |
$3,374,841 |
$3,374,841 |
| Category |
Safety |
Sys Pres |
CM/M |
CA/SC |
TE |
EV |
Total |
|---|---|---|---|---|---|---|---|
Score |
18 out of 30 |
14 out of 29 |
18 out of 29 |
12 out of 16 |
3 out of 12 |
10 out of 18 |
75 out of 134 |
The project will reconstruct approximately 9,300 feet of Mount Auburn Street, from the Cambridge city line to the intersection with Summer Street, just east of Watertown Square. The project involves revisions to the roadway geometry, including a roadway diet to reduce the number of lanes; safety improvements; multimodal accommodations, including shared or exclusive bike lanes; improvements to the existing traffic signal equipment; and improved ADA amenities at intersections.
| Source |
(FFY) 2022 |
2023 |
2024 |
2025 |
2026 |
Total |
|---|---|---|---|---|---|---|
Federal Funds |
--- |
$9,735,697 |
$12,936,375 |
--- |
--- |
$22,936,072 |
Non-Federal Funds |
--- |
$2,433,924 |
$3,243,094 |
--- |
--- |
$5,468,018 |
Total Funds |
--- |
$12,169,621 |
$16,170,469 |
--- |
--- |
$28,340,090 |
This project received a total score of 42.75 points when evaluated using the criteria for the second round of the MPO’s Community Connections Program. These criteria differ from those used during the pilot round of this program in FFY 2021, as updates were made to the criteria based on the results of that pilot. These criteria are listed in Table A-5.
This project will improve bicycle facilities at Wellesley Middle School by installing four covered bicycle racks. These facilities will be available to over 1,200 middle school students plus teachers and administrators at Wellesley Middle School. The primary goal of the project is to encourage bicycling to/from school and to nearby activities, facilitating mode shift in the transportation system from single-occupancy vehicles to active transportation.
| Source |
(FFY) 2022 |
2023 |
2024 |
2025 |
2026 |
Total |
|---|---|---|---|---|---|---|
Federal Funds |
$68,043 |
--- |
--- |
--- |
--- |
$68,043 |
Non-Federal Funds |
$17,011 |
--- |
--- |
--- |
--- |
$17,011 |
Total Funds |
$85,054 |
--- |
--- |
--- |
--- |
$85,054 |
| Category |
Safety |
Sys Pres |
CM/M |
CA/SC |
TE |
EV |
Total |
|---|---|---|---|---|---|---|---|
Score |
6 out of 30 |
3 out of 29 |
9 out of 29 |
4 out of 16 |
2 out of 12 |
0 out of 18 |
24 out of 134 |
This project would create a multi-use trail connection, from Recreation Road to Upper Charles River Greenway including reconstruction of pedestrian bridge N-12-078=W-29-062. This project was evaluated using the MPO’s scoring criteria because it was considered for funding using Regional Target funds. MassDOT funded the project, however.
| Source |
(FFY) 2022 |
2023 |
2024 |
2025 |
2026 |
Total |
|---|---|---|---|---|---|---|
Federal Funds |
$2,542,301 |
--- |
--- |
--- |
--- |
$2,542,301 |
Non-Federal Funds |
$635,575 |
--- |
--- |
--- |
--- |
$635,575 |
Total Funds |
$3,177,876 |
--- |
--- |
--- |
--- |
$3,177,876 |
This is a MassDOT-prioritized project and is therefore not directly evaluated using the MPO’s TIP scoring criteria.
This project will replace bridge W-38-029 (2KV), which carries Route 129 (Lowell Street) over Interstate 93.
| Source |
(FFY) 2022 |
2023 |
2024 |
2025 |
2026 |
Total |
|---|---|---|---|---|---|---|
Federal Funds |
--- |
--- |
--- |
$13,234,099 |
--- |
$13,234,099 |
Non-Federal Funds |
--- |
--- |
--- |
$3,308,525 |
--- |
$3,308,525 |
Total Funds |
--- |
--- |
--- |
$16,542,624 |
--- |
$16,542,624 |
This is a MassDOT-prioritized project and is therefore not directly evaluated using the MPO’s TIP scoring criteria.
This project will replace bridge W-38-003, which carries Butters Row over the MBTA commuter rail tracks.
| Source |
(FFY) 2022 |
2023 |
2024 |
2025 |
2026 |
Total |
|---|---|---|---|---|---|---|
Federal Funds |
--- |
$4,145,190 |
--- |
--- |
--- |
$4,145,190 |
Non-Federal Funds |
--- |
$1,036,298 |
--- |
--- |
--- |
$1,036,298 |
Total Funds |
--- |
$5,181,488 |
--- |
--- |
--- |
$5,181,488 |
| Category |
Safety |
Sys Pres |
CM/M |
CA/SC |
TE |
EV |
Total |
|---|---|---|---|---|---|---|---|
Score |
13 out of 30 |
12 out of 29 |
16 out of 29 |
9 out of 16 |
1 out of 12 |
2 out of 18 |
53 out of 134 |
This project involves traffic safety and efficiency improvements at the intersection of Lowell Street (Route 129) and Woburn Street. The improvements include geometric modification of the roadway along the eastbound approach of Lowell Street to improve intersection visibility. The construction of new pedestrian signals and crosswalks for all approaches will address current pedestrian safety issues in the intersection. In addition, bicycle lanes will be constructed on both roadways within the project limits.
| Source |
(FFY) 2022 |
2023 |
2024 |
2025 |
2026 |
Total |
|---|---|---|---|---|---|---|
Federal Funds |
--- |
$3,761,377 |
--- |
--- |
--- |
$3,761,377 |
Non-Federal Funds |
--- |
$940,344 |
--- |
--- |
--- |
$940,344 |
Total Funds |
--- |
$4,701,721 |
--- |
--- |
--- |
$4,701,721 |
| Category |
Safety |
Sys Pres |
CM/M |
CA/SC |
TE |
EV |
Total |
|---|---|---|---|---|---|---|---|
Score |
15 out of 30 |
12 out of 29 |
13 out of 29 |
10 out of 16 |
1 out of 12 |
8 out of 18 |
59 out of 134 |
This project includes the addition of five-foot bicycle lanes along both sides of the roadway along the Route 38 corridor. Sidewalks will also be provided along both sides of the roadway between Route 62 and Route 129. In addition, improved traffic signals and the reconstruction of turn lanes will enhance pedestrian safety and improve vehicular flow.
| Source |
(FFY) 2022 |
2023 |
2024 |
2025 |
2026 |
Total |
|---|---|---|---|---|---|---|
Federal Funds |
--- |
--- |
--- |
$7,200,000 |
$13,178,580 |
$20,378,580 |
Non-Federal Funds |
--- |
--- |
--- |
$1,800,000 |
$3,294,645 |
$5,094,645 |
Total Funds |
--- |
--- |
--- |
$9,000,000 |
$16,473,225 |
$25,473,225 |
| Category |
Safety |
Sys Pres |
CM/M |
CA/SC |
TE |
EV |
Total |
|---|---|---|---|---|---|---|---|
Score |
11 out of 30 |
14 out of 29 |
12 out of 29 |
8 out of 16 |
4 out of 12 |
5 out of 18 |
54 out of 134 |
This project will include pavement reconstruction and reclamation, sidewalk reconstruction, and intersection improvements at key locations along the corridor. Improvements to the bicycle and pedestrian conditions will be implemented.
| Source |
(FFY) 2022 |
2023 |
2024 |
2025 |
2026 |
Total |
|---|---|---|---|---|---|---|
Federal Funds |
--- |
$4,745,562 |
--- |
--- |
--- |
$4,745,562 |
Non-Federal Funds |
--- |
$1,186,391 |
--- |
--- |
--- |
$1,186,391 |
Total Funds |
--- |
$5,931,953 |
--- |
--- |
--- |
$5,931,953 |
| Category |
Safety |
Sys Pres |
CM/M |
CA/SC |
TE |
EV |
Total |
|---|---|---|---|---|---|---|---|
Score |
22 out of 30 |
15 out of 29 |
16 out of 29 |
10 out of 16 |
4 out of 12 |
8 out of 18 |
75 out of 134 |
The primary goals for this project are to improve safety for drivers, pedestrians, and bicyclists while improving congestion within the Woburn Common area. The project consists of safety and operational improvements and includes the reconfiguration of the Woburn Common rotary to a more traditional configuration. The project will include roadway reconstruction, roadway realignment, sidewalk reconstruction, and the addition of bicycle lanes. One new signal will be added and two existing signals will be replaced. The project will be consistent with Woburn’s adopted Complete Streets policy.
| Source |
(FFY) 2022 |
2023 |
2024 |
2025 |
2026 |
Total |
|---|---|---|---|---|---|---|
Federal Funds |
--- |
--- |
--- |
$12,884,480 |
--- |
$12,884,480 |
Non-Federal Funds |
--- |
--- |
--- |
$3,221,120 |
--- |
$3,221,120 |
Total Funds |
--- |
--- |
--- |
$16,105,600 |
--- |
$16,105,600 |
| Category |
Safety |
Sys Pres |
CM/M |
CA/SC |
TE |
EV |
Total |
|---|---|---|---|---|---|---|---|
Score |
9 out of 30 |
11 out of 29 |
19 out of 29 |
7 out of 16 |
2 out of 12 |
4 out of 18 |
52 out of 134 |
The intersection of U.S. Route 3 (Cambridge Street) at South Bedford Street and Bedford Road has been identified as a high-crash location in the Boston region. The existing geometry and traffic operations can often present challenges for motorists, pedestrians, and bicyclists. This project will reconstruct the intersection and all traffic signal equipment. Geometry enhancements will be made to accommodate exclusive turn lanes for all approaches to the intersection. The project will include reconstruction of the sidewalk along the east side of Cambridge Street and both sides of the Bedford Road westbound approach, and new sidewalk will be constructed on the south side of South Bedford Street. Bicycle accommodations consisting of five-foot wide bicycle lanes (with two-foot wide buffers where feasible) will be provided, as will ADA-compliant MBTA bus stops on Cambridge Street.
| Source |
(FFY) 2022 |
2023 |
2024 |
2025 |
2026 |
Total |
|---|---|---|---|---|---|---|
Federal Funds |
--- |
--- |
--- |
$1,290,240 |
--- |
$1,290,240 |
Non-Federal Funds |
--- |
--- |
--- |
$322,560 |
--- |
$322,560 |
Total Funds |
--- |
--- |
--- |
$1,612,800 |
--- |
$1,612,800 |
| Category |
Safety |
Sys Pres |
CM/M |
CA/SC |
TE |
EV |
Total |
|---|---|---|---|---|---|---|---|
Score |
23 out of 30 |
11 out of 29 |
12 out of 29 |
9 out of 16 |
0 out of 12 |
0 out of 18 |
55 out of 134 |
This project consists of the construction of ramps at the interchange of Route 1A and Interstate 495 to accommodate increased volumes resulting from development at the interchange. The design may proceed by developers and, depending on cost and scale of development proposals, MassDOT may incorporate ramp construction into a highway project. Future mitigation packages for developers may involve a median island to meet MassDOT’s and the Town of Wrentham’s long-range plan for the interchange.
| Source |
(FFY) 2022 |
2023 |
2024 |
2025 |
2026 |
Total |
|---|---|---|---|---|---|---|
Federal Funds |
--- |
--- |
$12,949,934 |
--- |
--- |
$12,949,934 |
Non-Federal Funds |
--- |
--- |
$3,237,484 |
--- |
--- |
$3,237,484 |
Total Funds |
--- |
--- |
$16,187,418 |
--- |
--- |
$16,187,418 |
| Category |
Safety |
Sys Pres |
CM/M |
CA/SC |
TE |
EV |
Total |
|---|---|---|---|---|---|---|---|
Score |
22 out of 30 |
15 out of 29 |
16 out of 29 |
10 out of 16 |
4 out of 12 |
8 out of 18 |
75 out of 134 |
The primary goals for this project are to improve safety for drivers, pedestrians, and bicyclists while improving congestion within the Woburn Common area. The project consists of safety and operational improvements and includes the reconfiguration of the Woburn Common rotary to a more traditional configuration. The project will include roadway reconstruction, roadway realignment, sidewalk reconstruction, and the addition of bicycle lanes. One new signal will be added and two existing signals will be replaced. The project will be consistent with Woburn’s adopted Complete Streets policy.
| Source |
(FFY) 2022 |
2023 |
2024 |
2025 |
2026 |
Total |
|---|---|---|---|---|---|---|
Federal Funds |
--- |
--- |
--- |
$12,884,480 |
--- |
$12,884,480 |
Non-Federal Funds |
--- |
--- |
--- |
$3,221,120 |
--- |
$3,221,120 |
Total Funds |
--- |
--- |
--- |
$16,105,600 |
--- |
$16,105,600 |
A performance-based approach to making transportation investments can help metropolitan planning organizations (MPOs), states, and other entities achieve desired outcomes for the people and places they serve. Performance-based planning and programming (PBPP) applies data and performance management principles to inform decision-making. The purpose of PBPP is to ensure that transportation investment decisions—both for long-term planning and short-term funding—are oriented toward meeting established goals. PBPP principles are credited with improving project and program delivery and providing greater transparency and accountability to the public, among other benefits.
Performance-based planning and programming activities include the following:
The Boston Region MPO’s PBPP process is shaped by both federal transportation performance management requirements and the MPO’s goals and objectives, which are established as part of the MPO’s Long-Range Transportation Plan (LRTP). This chapter discusses how these two frameworks shape the MPO’s PBPP process; describes the MPO’s current set of performance measures and targets; and explains how the MPO anticipates the projects included in this Transportation Improvement Program (TIP) will support improvements in various performance areas and make progress toward targets.
The Moving Ahead for Progress in the 21st Century Act (MAP-21) directed states, MPOs, and public transportation providers to carry out a performance and outcome-based surface transportation program. These requirements have been continued under the current federal transportation funding law, the Fixing America’s Surface Transportation (FAST) Act. MAP-21 identified seven national goals for the nation’s highway system, which are described in detail in Appendix E. Table 4-1 shows the relationship between these national goal areas and the MPO’s goal areas. The MPO’s goals and related objectives, as approved by the MPO in the LRTP, Destination 2040, are described in more detail in Chapter 1 of this document.
Table 4-1
National and Boston Region MPO Goal Areas
National Goal Area |
Boston Region MPO Goal Area(s) |
Safety |
Safety |
Infrastructure Condition |
System Preservation and Modernization |
System Reliability |
Capacity Management and Mobility |
Congestion Reduction |
Capacity Management and Mobility |
Environmental Sustainability |
Clean Air and Sustainable Communities |
Freight Movement/Economic Vitality |
Capacity Management and Mobility, Economic Vitality |
Reduced Project Delivery Delays |
Not Applicable |
Not Applicable |
Transportation Equity |
Source: Boston Region MPO.
MAP-21 and the FAST Act’s federal PBPP mandate is also designed to help the nation’s public transportation systems provide high-quality service to all users, including people with disabilities, seniors, and individuals who depend on public transportation.
The US Department of Transportation (USDOT), in consultation with states, MPOs, and other stakeholders, has established measures in performance areas relevant to the aforementioned national goals through a series of federal rulemakings. Table 4-2 lists federally required performance measures for the transit system and Table 4-3 lists federally required performance measures for the roadway system.
Table 4-2
Federally Required Transit Performance Measures
National Goal Area |
Transit Performance Area or Asset Category |
Performance Measures |
Relevant MPO Goal Area |
Safety |
Fatalities |
|
Safety |
Safety |
Injuries |
|
Safety |
Safety |
Safety Events |
|
Safety |
Safety |
System Reliability |
|
Safety |
Infrastructure Condition |
Equipment |
|
System Preservation and Modernization |
Infrastructure Condition |
Rolling Stock |
|
System Preservation and Modernization |
Infrastructure Condition |
Infrastructure |
|
System Preservation and Modernization |
Infrastructure Condition |
Facilities |
|
System Preservation and Modernization |
ULB = useful life benchmark. VRM = vehicle-revenue miles.
Sources: National Public Transportation Safety Plan (January 2017), the Public Transportation Agency Safety Plan Rule (Title 49 Code of Federal Regulations [CFR] Part 673), and the Transit Asset Management Rule (49 CFR Part 625).
Table 4-3
Federally Required Roadway Performance Measures
National Goal Area |
Roadway |
Performance Measures |
Relevant MPO Goal Area |
Safety |
Injuries and Fatalities |
• Number of fatalities |
Safety |
Infrastructure Condition |
Pavement Condition |
• Percent of pavements on the Interstate System in good condition |
System Preservation and Modernization |
Infrastructure Condition |
Bridge Condition |
• Percent of NHS bridges by deck area classified as in good condition |
System Preservation and Modernization |
System Reliability |
Performance of the National Highway System |
• Percent of the person-miles traveled on the Interstate System that are reliable |
Capacity Management/ Mobility |
System Reliability, Freight Movement and Economic Vitality |
Freight Movement on the Interstate System |
• Truck Travel Time Reliability Index (for truck travel on Interstate highways) |
Capacity Management/ Mobility, Economic Vitality |
Congestion Reduction |
Congestion Mitigation and Air Quality |
• Annual hours of peak hour excessive delay per capita (for travel on NHS roadways) |
Capacity Management/ Mobility |
Environmental Sustainability |
Congestion Mitigation and Air Quality |
• Total emissions reduction for applicable pollutants and precursors for CMAQ-funded projects in designated nonattainment and maintenance areas* |
Clean Air/Sustainable Communities |
* As of the Federal Highway Administration’s 2019 CMAQ Program performance requirements applicability determination, the Boston Region MPO area contains an area designated as in maintenance for carbon monoxide, the MPO is currently required to monitor and set targets for this performance measure.
CMAQ = Congestion Mitigation and Air Quality Improvement Program. MPO = metropolitan planning organization. NHS = National Highway System.
Sources: Highway Safety Improvement Program Rule (23 CFR 924), National Performance Management Measures Rule (23 CFR 490), and the Boston Region MPO staff.
These performance measures and relevant performance targets are discussed in more detail later in this chapter.
The MPO’s PBPP process must respond to the federal performance management requirements established in MAP-21 and the FAST Act, but it can also address other areas that pertain to its federally mandated responsibilities or relate to the MPO’s goals and objectives. For example, MAP-21 and the FAST Act do not specify transportation equity performance measures for states and MPOs to monitor. However, the MPO has established a transportation equity goal and a set of objectives to ensure that all people receive comparable benefits from, and are not disproportionately burdened by, MPO investments, regardless of race, color, national origin, age, income, ability, or sex.
To comply with relevant federal regulations, which are described in Chapter 6 and Appendix E, the MPO systematically addresses the concerns of populations that these regulations protect—referred to here as transportation equity populations—throughout the planning process, including when selecting projects through the TIP process. Regular equity performance monitoring enables the MPO to better understand how transportation equity populations in the region may be affected by transportation investment decisions, so that it can decide whether and how to adjust its investment approach. More details about transportation equity monitoring for projects in the FFYs 2022−26 TIP are included in Chapter 6.
To build a comprehensive PBPP practice, the MPO can also choose to monitor or set targets for additional performance measures, which are not federally required, that apply to its goal areas. For example, while the federally required travel time reliability measures discussed in Table 4-3 apply to the MPO’s Capacity Management and Mobility goal, the MPO may wish to examine measures that account for roadways that are not on the National Highway System (NHS) or other travel modes. Over the coming years, the MPO will examine whether and how to incorporate other performance measures and practices into its PBPP process.
States, MPOs, and public transportation providers integrate federally required performance measures—and other measures, as desired—into their respective PBPP processes, which involve three key phases focused on (1) planning, (2) investing, and (3) monitoring and evaluating performance outcomes.
In the planning phase, agencies set goals and objectives for the transportation system, identify performance measures, and set performance targets that will guide their decision-making. They identify and acquire data and conduct analyses necessary to support these processes. They also outline the frameworks they will use to make decisions in key planning documents.
The Commonwealth of Massachusetts creates performance-based plans, such as the Strategic Highway Safety Plan (SHSP) for improving roadway safety and the Transportation Asset Management Plan (TAMP) for improving infrastructure condition, particularly for NHS roads and bridges. Similarly transit providers—including the Massachusetts Bay Transportation Authority (MBTA), MetroWest Regional Transit Authority (MWRTA), and Cape Ann Transportation Authority (CATA)—create Transit Asset Management (TAM) plans and Public Transportation Agency Safety Plans (PTASPs) that describe the data and processes these agencies will use to address transit state of good repair and safety needs. The Commonwealth is responsible for setting performance targets for the federally required roadway performance measures described in Table 4-3, while transit agencies must set targets for the measures described in Table 4-2.
The Boston Region MPO’s activities in the planning phase include creating a goals-and-objectives framework in its LRTP and other performance-based plans—such as Congestion Mitigation and Air Quality Improvement (CMAQ) Program Performance Plans—as necessary. MPOs integrate elements of state and transit agency performance plans, such as their goals and performance targets, into MPO planning processes. MPOs also establish targets for federally required performance measures. To set these targets, the Boston Region MPO may elect to support performance targets set by the Massachusetts Department of Transportation (MassDOT) or public transit providers (depending on the measure), or it may set separate targets for the MPO’s planning area. MassDOT and the transit agencies will update their performance targets based on defined cycles, which vary for each measure. More information about the update cycles for these measures is included in Section 4.3 of this chapter.
In the investing phase, agencies use the PBPP framework established in the planning phase to create strategies for investing transportation funding. When updating the LRTP, the MPO establishes investment programs and funding guidelines to help direct Regional Target funds to priority areas (see Chapter 2 for details). When updating the TIP, the MPO selects projects that it will fund through these programs. MPO members rely on several sets of information when making these decisions:
Meanwhile, MassDOT, the MBTA, CATA, and MWRTA follow their respective processes to select projects and programs for inclusion in the MassDOT Capital Investment Plan (CIP). The federally funded investments that are included in the CIP are also documented in the MPO’s TIP and in the State Transportation Improvement Program (STIP).
Once the MPO board allocates its Regional Target dollars to specific investments and considers capital programs submitted by MassDOT, MBTA, and the region’s RTAs, it documents the full set of investments for the Boston region in the TIP. The TIP describes links between these short-term capital investment priorities and performance measures and targets. It also discusses, to the extent practicable, how the MPO anticipates these investments will help the MPO achieve its targets. States must provide similar information in their STIPs.
After making plans and investments, agencies take stock of their progress by reviewing and reporting on their performance outputs and outcomes. Activities in the monitoring and evaluating phase include tracking trends, collecting data to understand the results of investment decisions, and comparing targets to actual performance. For example, the MPO can compare information from the TIP about the expected performance outcomes of its investments with information about past and current performance, which is collected for the LRTP, to determine if its investments are helping it make progress towards its goals, objectives, and performance targets. The MPO may also conduct TIP Before-and-After studies to learn more about how the actual outcomes of TIP projects compare to expectations. These evaluation methods allow the MPO to make necessary trade-offs or adjust its investment approach in the future.
In addition to reporting measures, targets, and performance progress in its LRTP, the Boston Region MPO describes performance on transportation metrics through its Congestion Management Process (CMP) and tools such as the MPO’s Performance Dashboard. MassDOT reports performance targets and progress to the Federal Highway Administration (FHWA) through an online reporting tool, through the STIP and other required reports, and on the MassDOT Performance Management Tracker website. Public transit providers report their targets and performance progress information to the Federal Transit Administration (FTA), including through the National Transit Database (NTD).
To support the activities discussed above, federal transportation agencies require states, public transit operators, and MPOs to coordinate with one another and to share information and data to ensure consistency across processes. In Massachusetts, these coordination responsibilities are outlined in the 2019 Performance-Based Planning and Programming Agreement between MassDOT, Massachusetts MPOs and transportation planning organizations, the MBTA, and RTAs operating in Massachusetts.
Staff from Massachusetts MPOs, MassDOT staff, and other stakeholders coordinate on PBPP implementation through the Transportation Program Managers Group, including through its subcommittee on performance measures. For performance measures that states and MPOs track at the Boston MA-NH-RI Urbanized Area (UZA) level, coordination responsibilities are documented in the 2018 Boston MA-NH-RI UZA Memorandum of Understanding.4-1
This section discusses investments in the federal fiscal years (FFYs) 2022−26 TIP and how they may relate to elements of the MPO’s PBPP framework, including the MPO’s goals and performance measures and targets. For each goal area, existing performance targets are identified and information on relevant trends, performance measures, TIP investments, and related planning activities is provided. These descriptions generally focus on investments of the MPO’s Regional Target funds, although they may also describe MassDOT or transit agency-funded investments, where applicable. Information specific to the MPO’s Transportation Equity goal area is included in Chapter 6 and details about investments that will be made by the MPO, MassDOT, the MBTA, CATA, and MWRTA are included in Chapter 3. Appendix A includes a table summarizing the impacts each Regional Target project is expected to have on performance areas discussed in this chapter.
One of the MPO’s goals is that transportation by all modes will be safe. The MPO has committed to investing in projects and programs that aim to reduce the number and severity of crashes for all modes, and the number of serious injuries and fatalities occurring on the transportation system. Similarly, the Massachusetts SHSP includes a long-term goal to move “towards zero deaths” by eliminating fatalities and serious injuries on the Commonwealth’s roadways.4-2
The Massachusetts SHSP is a statewide, coordinated plan that addresses requirements for the federal Highway Safety Improvement Program (HSIP) and provides a comprehensive framework for improving safety on all public roads in the Commonwealth. It outlines interim and long-term goals for improving safety performance and identifies strategies and policies for addressing safety emphasis areas. The Commonwealth’s Bicycle Transportation and Pedestrian Transportation Plans also include initiatives and actions intended to make walking and biking safer.4-3
Similar to the SHSP, the major transit providers in the Boston region—the MBTA, MWRTA, and CATA—produce PTASPs that describe how they will implement safety management systems (SMS).4-4 SMS is a “formal, top-down, organization-wide data-driven approach to managing safety risks and assuring the effectiveness of safety risk mitigations [that] includes systematic procedures, practices, and policies for managing risks and hazards.”4-5 Transit providers support SMS through safety management policies, safety risk management strategies, safety assurance methods (which include performance monitoring), and safety promotion (including training and communication practices). These PTASPs also describe the performance targets these agencies set for measures outlined in the National Public Transportation Safety Plan.
The Commonwealth of Massachusetts and the Boston Region MPO track traffic incidents, fatalities, and injuries involving motor vehicles using information from the Massachusetts Crash Data System and the National Highway Traffic Safety Administration’s (NHTSA’s) Fatality Analysis and Reporting System (FARS). These data inform the targets the Commonwealth and the MPO must set each calendar year (CY) for five federally required roadway safety performance measures, which are also listed in Table 4-3:
These measures pertain to fatalities and serious injuries from traffic incidents involving motor vehicles and apply to all public roads. Values for these measures are expressed as five-year rolling annual averages. States and MPOs update targets for these measures annually. When establishing targets for these measures, the MPOs in Massachusetts can elect to support targets the Commonwealth has set or they can set separate targets for their respective MPO regions.
The Commonwealth set its most current set of roadway safety performance targets to reflect a CY 2017–21 rolling annual average, as required by FHWA. When setting these targets, the Commonwealth considered the following factors:
Table 4-4 shows the Commonwealth’s CY 2021 roadway safety performance targets and reiterates the Commonwealth’s long-term targets. MPO memoranda describing the Commonwealth’s safety targets from prior years are available at bostonmpo.org/performance-archive.
Table 4-4
Massachusetts Safety Performance Targets
Performance Measure |
CY 2021 Target |
MA Long-Term Target |
Number of Fatalities |
339.00 |
0.00 |
Fatality Rate (per 100M VMT) |
0.55 |
0.00 |
Number of Serious Injuries |
2,580.00 |
0.00 |
Serious Injury Rate (per 100M VMT) |
4.23 |
0.00 |
Number of Nonmotorized Fatalities and Serious Injuries |
506.00 |
0.00 |
* These targets are expressed as five-year rolling annual averages.
CY = calendar year. M = million. MA = Massachusetts. MPO = metropolitan planning organization. VMT = vehicle-miles traveled.
Sources: Federal Highway Administration, Commonwealth of Massachusetts, Boston Region MPO staff.
Figures 4-1 through 4-5 display actual and draft data, projections, and CY 2021 targets for Massachusetts for each of the roadway safety performance measures. These figures show information that was available in spring and summer 2020, when the Commonwealth was setting CY 2021 targets. In February 2021, the Boston Region MPO reviewed and voted to support the Commonwealth’s CY 2021 roadway safety performance targets. This approach reflects the way the MPO will need to collaborate with the Commonwealth on safety strategies to reduce fatalities and injuries in the Boston region, which include education campaigns and driver behavior laws, in addition to the infrastructure investments the MPO may make. Actual and draft data about safety outcomes in the Boston region are also shown in these figures.
Figure 4-1 shows data, projections, and the CY 2021 target for the number of fatalities, while Figure 4-2 shows data and targets pertaining to the fatality rate per 100 million VMT. As shown in the table, five-year rolling averages for the fatality-oriented measures have gradually decreased over time at both the Massachusetts level and the Boston region level. The Commonwealth sought to (1) create targets for the number of fatalities and the fatality rate that were lower than those set for CY 2020, and (2) account for the changes in VMT prompted by the COVID-19 pandemic. Massachusetts’ VMT decreased in CY 2020 compared to prior years and is likely to remain lower than pre-pandemic levels in CY 2021. For more details about the Commonwealth’s target-setting approach, see the MPO’s February 4, 2021, memo titled “Federally Required Calendar Year 2021 Safety Targets.”4-7
Figure 4-1
Number of Fatalities from Motor Vehicle Crashes
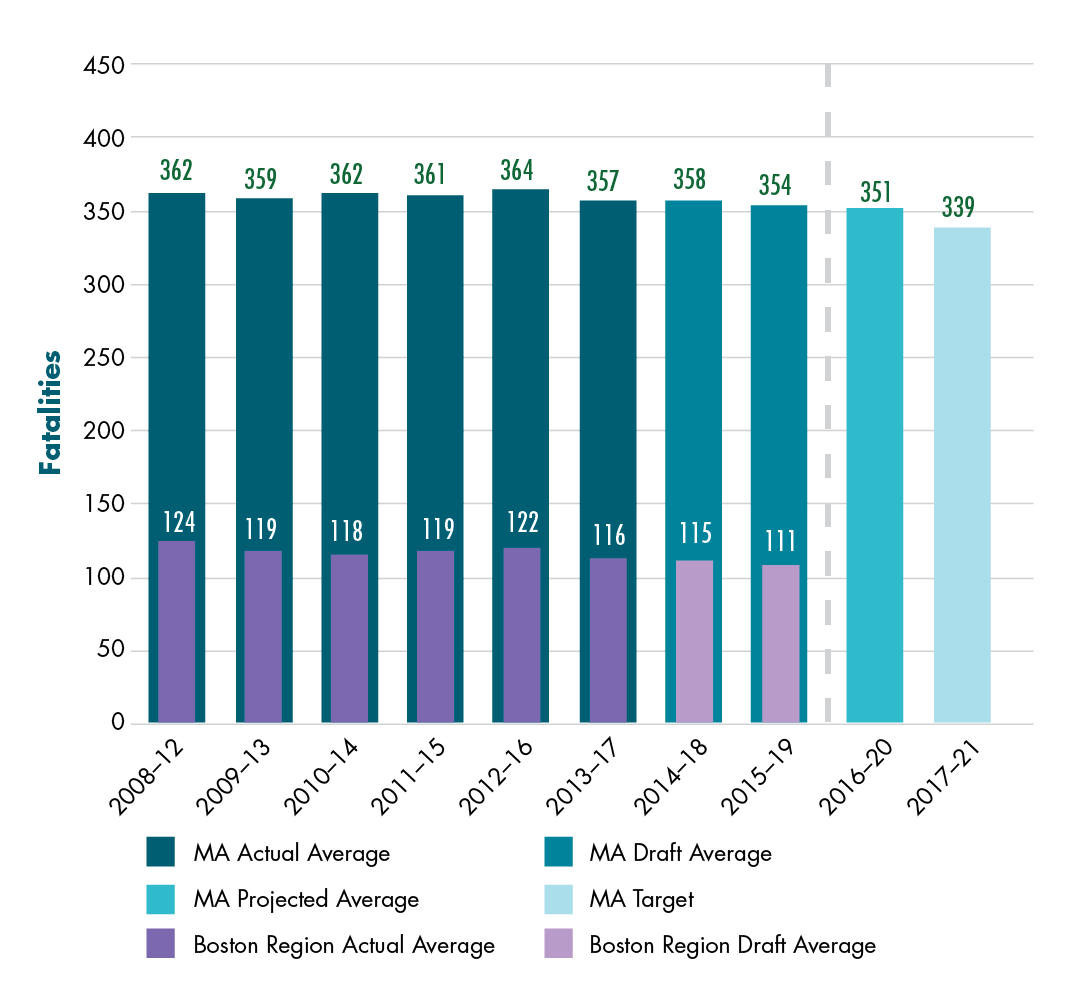
Notes: Values reflect five-year rolling annual averages and have been rounded to the nearest integer. Draft
2018 and 2019 data in these averages are from July 2020.
MA = Massachusetts. MPO = metropolitan planning organization.
Sources: National Highway Traffic Safety Administration Fatality Analysis and Reporting System,
MassDOT, and Boston Region MPO staff.
Figure 4-2
Fatality Rate per 100 Million VMT
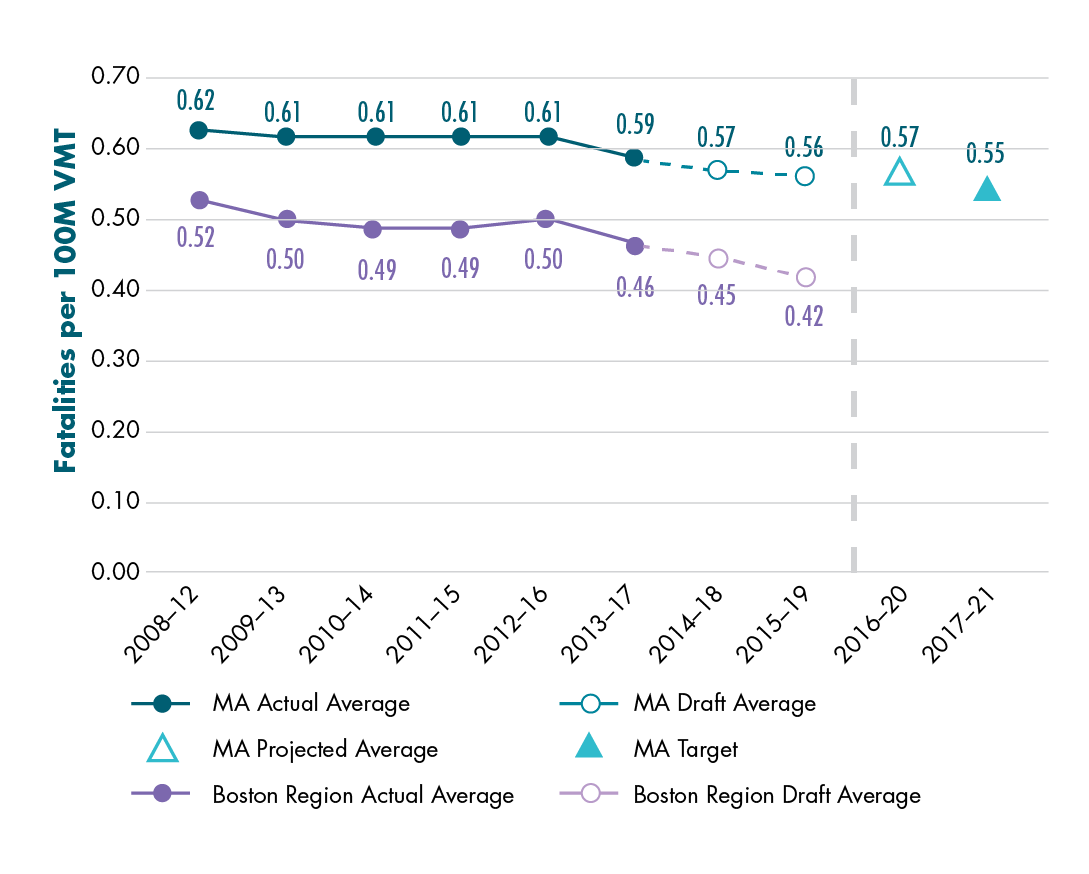
Notes: Values reflect five-year rolling annual averages and have been rounded to the hundredths decimal place. Draft 2018 and 2019 data in these averages are from July 2020. MassDOT plans to revisit 2018 VMT data for future target setting activities.
MA = Massachusetts. MPO = metropolitan planning organization. VMT = vehicle-miles traveled.
Sources: National Highway Traffic Safety Administration Fatality Analysis and Reporting System, MassDOT, and Boston Region MPO staff.
Figure 4-3 shows data, projections, and the CY 2021 target for the number of serious injuries, while Figure 4-4 shows data and targets pertaining to the serious injury rate per 100 million VMT. For Massachusetts as a whole and the Boston region in particular, the average number of serious injuries and the average serious injury rate has decreased over time. The Commonwealth followed a process like the one used to set targets for the number of fatalities and the fatality rate per 100 million VMT, which involved setting lower targets compared to prior years while accounting for travel behavior changes in response to the COVID-19 pandemic.
Figure 4-3
Number of Serious Injuries
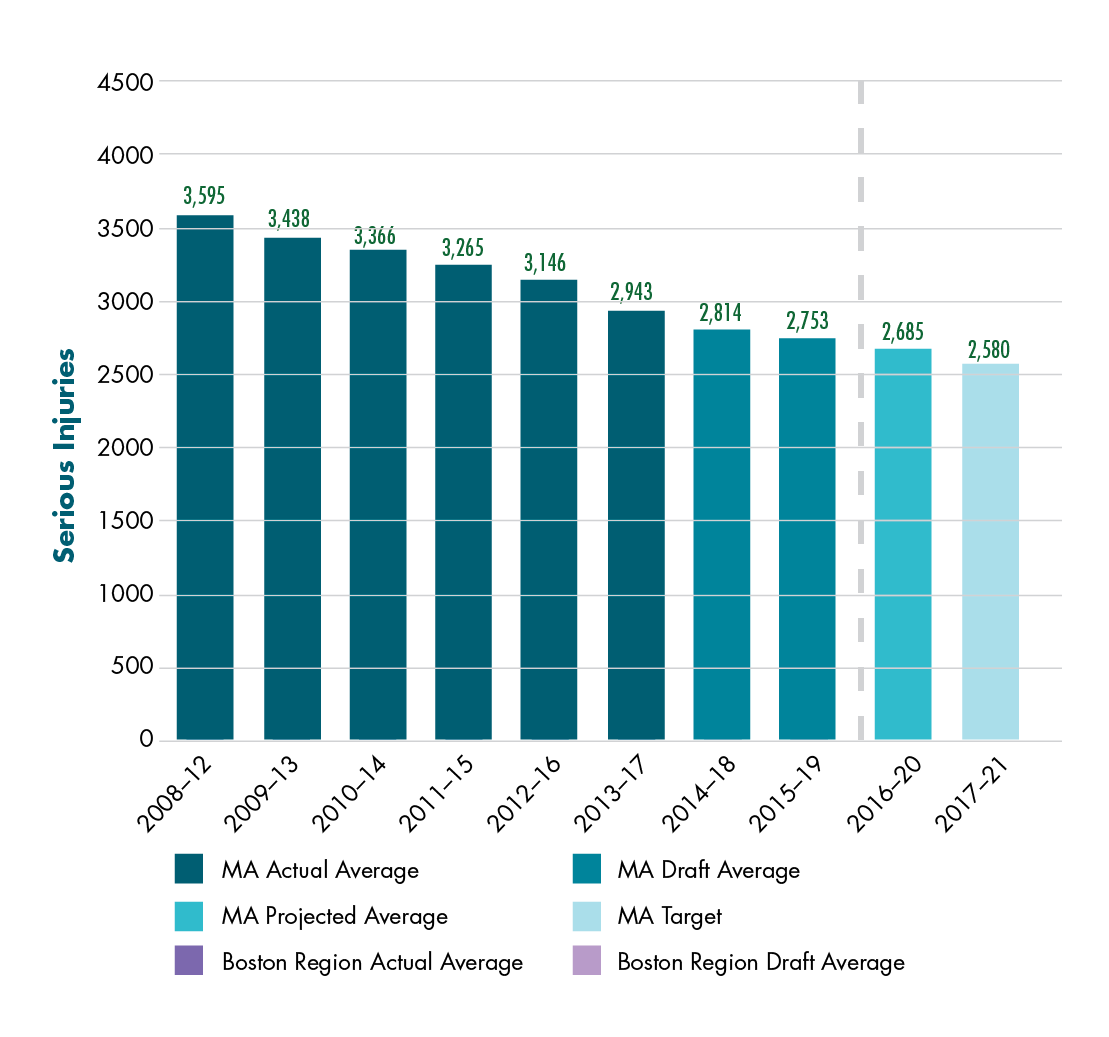
Notes: Values reflect five-year rolling annual averages and have been rounded to the nearest integer. Draft 2018 and 2019 data in these averages are from July 2020.
MA = Massachusetts. MPO = metropolitan planning organization. VMT = vehicle-miles traveled.
Sources: MassDOT and Boston Region MPO staff.
Figure 4-4
Serious Injury Rate per 100 Million VMT
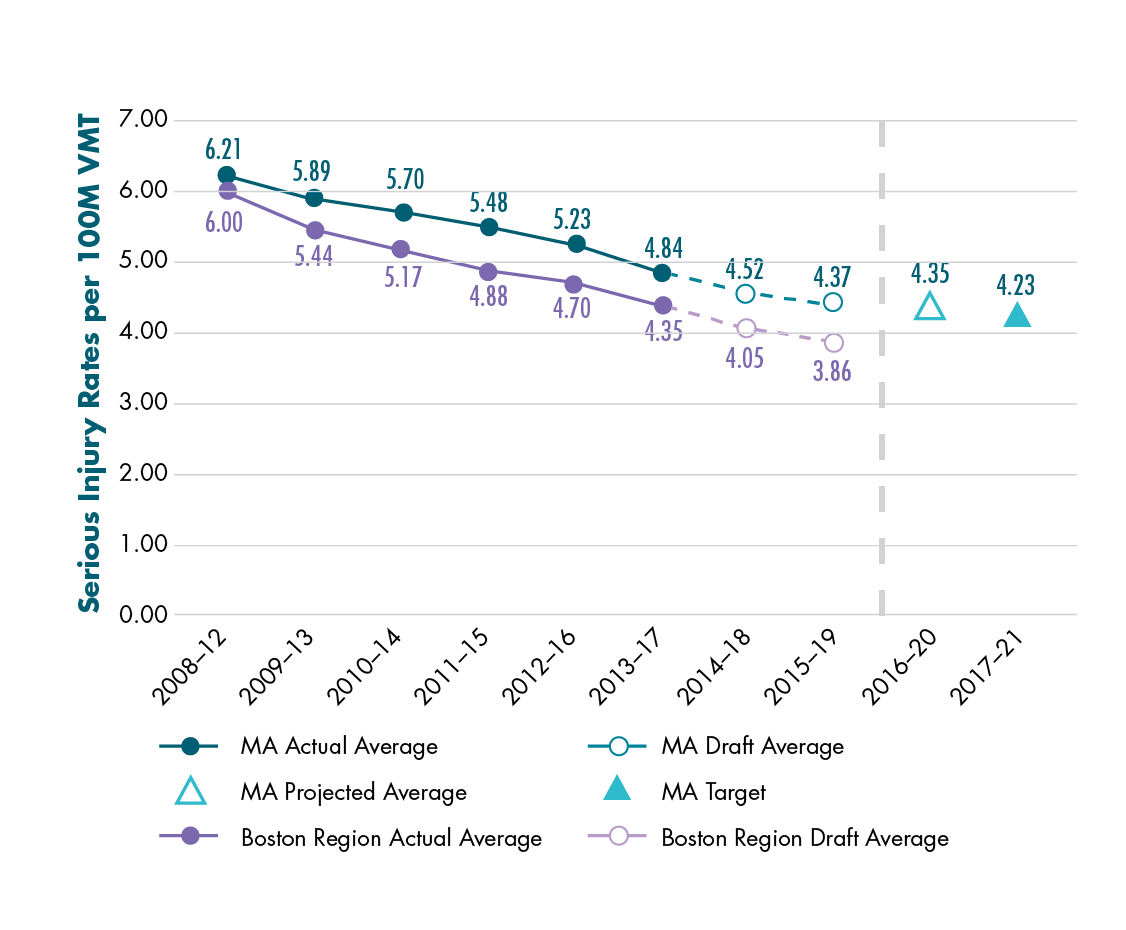
Note: Values reflect five-year rolling annual averages and have been rounded to the hundredths decimal place. Draft 2018 and 2019 data in these averages are from July 2020. MassDOT plans to revisit 2018 VMT data for future target-setting activities.
MA = Massachusetts. MassDOT = Massachusetts Department of Transportation. MPO = metropolitan planning organization. VMT = vehicle-miles traveled.
Sources: MassDOT and Boston Region MPO staff.
Figure 4-5 shows data, projections, and the CY 2021 target for the number of nonmotorized fatalities and serious injuries. As shown in the figure, the average number of nonmotorized fatalities and serious injuries in the Commonwealth had increased in the years leading up to 2016 and has since declined. For CY 2021, the Commonwealth established a target by assuming modest decreases in nonmotorized fatalities and serious injuries from CY 2019 to 2021. While the resulting target value for CY 2021 (the 2017–21 rolling annual average) is not lower than the Commonwealth’s CY 2020 target for this measure (505.4), it is lower than the draft 2015–19 average and the projected 2016–20 average. As previously mentioned, counts of nonmotorized fatalities and serious injuries now reflect more comprehensive information related to people who skate, use wheelchairs and other mobility devices, bike, or walk, which has affected data used to calculate targets.
Figure 4-5 also shows recent decreases in the five-year rolling average of nonmotorized fatalities and serious injuries for both Massachusetts and the Boston region. However, on average, the Boston region’s proportion of Massachusetts’ nonmotorized fatalities and serious injuries is larger than the region’s proportion of Massachusetts’ total fatalities or total serious injuries. This safety performance area in particular should be addressed through coordinated planning, investment, and strategy implementation between the MassDOT, the Boston Region MPO, the region’s municipalities, and other stakeholders.
Figure 4-5
Number of Nonmotorized Fatalities and Serious Injuries
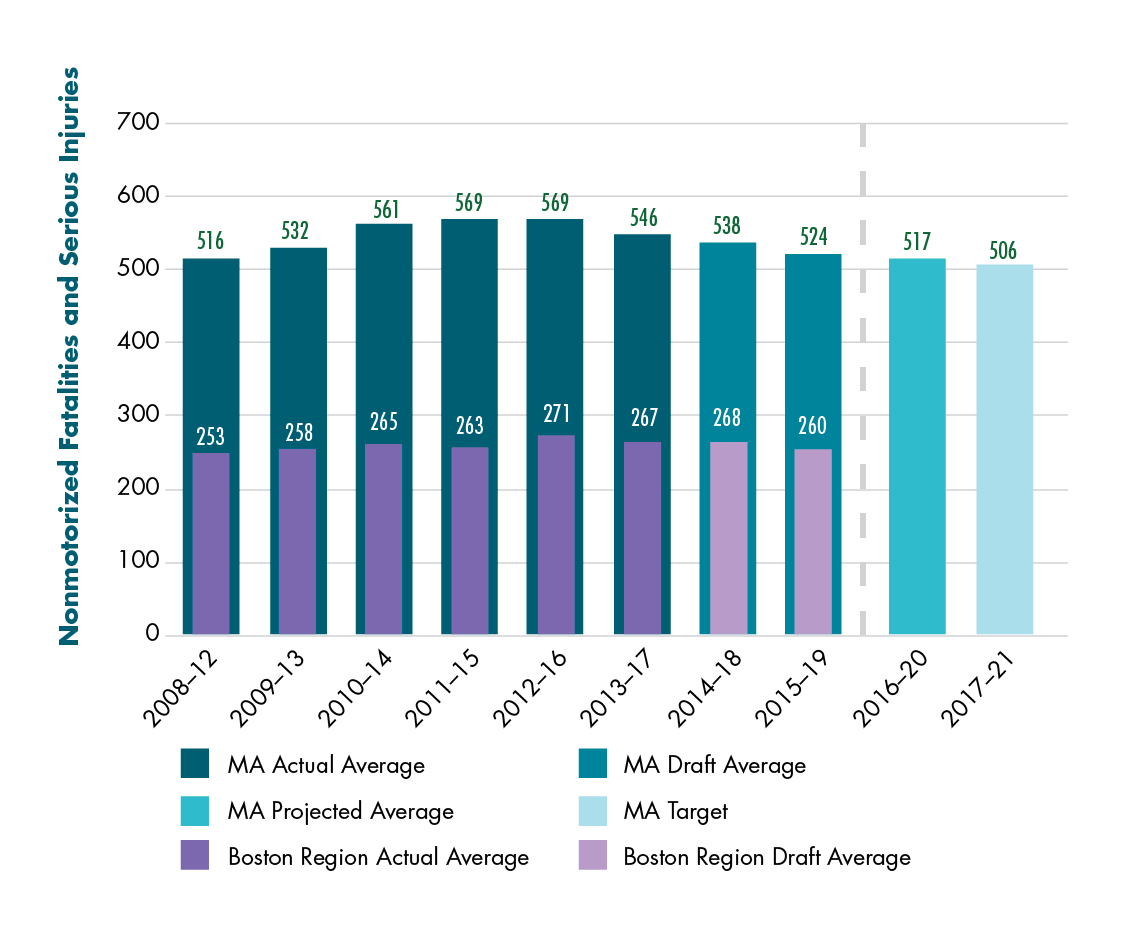
Notes: Values reflect five-year rolling annual averages and have been rounded to the nearest integer. Draft 2018 and 2019 data in these averages are from July 2020.
MA = Massachusetts. MPO = metropolitan planning organization.
Sources: National Highway Traffic Safety Administration Fatality Analysis and Reporting System, MassDOT, and Boston Region MPO staff.
By electing to support the Commonwealth’s roadway safety targets, the MPO agreed to plan and program projects so that they contribute to achieving those targets. Anticipating the ability of transportation projects to reduce fatalities and serious injuries from motor-vehicle crashes is a challenge, as crashes may be a consequence of many factors other than infrastructure condition, such as driver behavior—including seatbelt use, driver distraction, or intoxication—and weather conditions. When investing its Regional Target funds, the MPO aims to identify projects likely to have maximum safety benefits by using its TIP project selection criteria, which account for crash activity within the project area and the types of safety countermeasures included in the proposed project. As part of its most recent criteria update, the MPO has tailored safety criteria for each of its investment programs. For more detail on these criteria, see Appendix A.
When conducting project evaluations, the MPO considers crash rates within the vicinity of projects and the Equivalent Property Damage Only (EPDO) value associated with those crashes. The EPDO index assesses the severity of crashes by assigning weighted values to crashes involving fatalities, injuries, and property damage. MassDOT has recently adjusted its formula for calculating EPDO to significantly increase the weights for crashes involving fatalities or injuries.4-8
All of the corridor and intersection improvement projects included in the MPO’s Regional Target Program include safety countermeasures or features that the MPO expects will improve safety for motorists, bicyclists, and pedestrians. The MPO’s roadway investments in its Intersection Improvement, Complete Streets, and Major Infrastructure programs are expected to support safety improvements on roadways supporting multiple travel modes, while its Bicycle Network and Pedestrian Connections projects will support safety for those traveling by nonmotorized means by providing pedestrian signals and separated facilities for bicyclists and pedestrians.
The MPO also examines whether projects would improve safety at MassDOT-identified Highway Safety Improvement Program (HSIP) crash cluster locations. MassDOT identified crash clusters using a procedure for processing, standardizing, matching, and aggregating locations and data for crashes that have occurred at intersections.4-9 MassDOT’s HSIP clusters are those that ranked in the top five percent of crash clusters within each regional planning agency area based on EPDO values. MassDOT created a set of HSIP clusters that include all crashes involving motor vehicles, as well as sets of clusters that reflect motor-vehicle crashes that involved bicyclists or pedestrians. Projects in locations with HSIP clusters are eligible for funding through MassDOT’s HSIP program.
Table 4-5 shows values for MPO staff-identified metrics that relate to how FFYs 2022–26 Regional Target-funded corridor, intersection, and bicycle and pedestrian projects may address safety performance; similar tables for other MPO goal areas appear throughout this chapter. Table 4-5 shows that many of these projects are located in areas that overlap with HSIP clusters. The MPO expects that this combination of safety countermeasures and improvements focused on priority locations will help the MPO and the Commonwealth progress towards reducing fatalities and serious injuries on the roadway network. Table A-2 in Appendix A summarizes the impacts each Regional Target project is expected to have on performance areas discussed throughout this chapter, including safety performance.
Table 4-5
Regional Target Projects: Roadway Safety Performance Metrics
Metric |
Value |
Regional Target projects that address all-mode HSIP clusters1 |
12 projects |
All-mode HSIP cluster locations addressed by Regional Target projects1 |
18 locations |
Regional Target projects that address HSIP Pedestrian clusters2 |
5 projects |
HSIP pedestrian cluster locations addressed by Regional Target projects2 |
9 locations |
Regional Target projects that address HSIP bicycle clusters2 |
2 projects |
HSIP bicycle cluster locations addressed by Regional Target projects2 |
2 locations |
Project areas where fatal crashes have occurred3 |
4 areas |
Project areas where injury crashes have occurred3 |
32 areas |
Project areas where crashes involving pedestrians have occurred3 |
18 areas |
Project areas where crashes involving bicyclists have occurred3 |
12 areas |
Note: The group of projects reflected in this table does not include the Green Line Extension, Community Connections investments, or Transit Modernization investments.
1 All-mode HSIP clusters are based on crash data from 2015 to 2017.
2 HSIP bicycle clusters and HSIP pedestrian clusters are based on data from 2008 to 2017.
3 Analysis of crashes in Regional Target project areas is based on crash data from 2015 to 2017.
Sources: Massachusetts Crash Data System, Massachusetts Department of Transportation, and the Boston Region MPO.
The projects in the FFYs 2022–26 TIP programmed by MassDOT, summarized in Chapter 3, will also support safety and are expected to reduce fatalities and serious injuries on the region’s roadways. The Reliability and Modernization programs included in MassDOT’s CIP are geared toward maintaining and upgrading infrastructure, which will help make travel safer on the region’s roadways. MassDOT’s Intersection Improvements, Roadway Improvements, Roadway Reconstruction, and Safety Improvements programs most directly address safety considerations, although its Bridge and Pavement Improvement programs may also support safety by supporting asset maintenance and state of good repair. Moreover, MassDOT’s Bicycle and Pedestrian projects may reduce nonmotorized fatalities and injuries by improving separated facilities for bicyclists and pedestrians.
As previously mentioned, the National Public Transportation Safety Plan details performance measures for which transit agencies subject to the PTASP rule must set targets. These measures, which are also listed in Table 4-2, include the following4-10 :
The FTA provides transit agencies with flexibility to set their targets to meet the specific context of their transit service. These agencies can choose (1) the reporting timeframe they use (calendar, fiscal, or NTD reporting year), (2) the VRM denominator values for the rate measures, and (3) the methodologies for picking target values. Transit agencies revisit their performance targets when updating their PTASPs each year.
MPOs have their own responsibilities pertaining to transit safety, as outlined in the PTASP rule (49 CFR Part 673) and the Statewide and Nonmetropolitan Transportation Planning and Metropolitan Transportation Planning rule, which defines MPOs’ and states’ planning and performance management responsibilities. In particular, MPOs must set regional targets for these transit safety performance measures in coordination with relevant transit agencies and states. MPOs document these targets in the LRTPs and TIPs and can consider proposed transit investments in the context of how they may improve transit safety.
The Boston Region MPO adopted its initial set of transit safety performance targets on April 8, 2021. This set includes the MBTA’s, MWRTA’s, and CATA’s safety targets and presents each agency’s targets separately, as they reflect each agency’s understanding of the factors that will affect safety outcomes in their service areas. These factors include the characteristics of their local operating environments and contexts and their planned investment, policies, and safety-management activities. This first set of targets will provide a baseline for future coordination on improving transit safety outcomes in the region.
The MBTA monitors performance and sets federally required targets for four modes: heavy rail (Red, Orange, and Blue Lines), light rail (Green Line and the Mattapan High Speed Line), bus, and The RIDE paratransit system. Based on CY 2017–19 averages, the MBTA runs approximately 23,391,000 VRM of service on its heavy rail system; 5,817,000 VRM on its light rail system; 23,692,000 VRM on its bus network; and 16,379,000 VRM for The RIDE. Its commuter rail network and ferry service are not subject to these FTA requirements and are addressed outside of the PTASP process.
Table 4-6 shows past averages for the federally required transit safety measures for MBTA heavy rail, light rail, bus, and The RIDE, based on data provided by the MBTA. These averages reflect safety data from CYs 2017 to 2019.
Table 4-6
Past Safety Performance Data for
MBTA Transit Services (CYs 2017–19 Averages)
MBTA Mode |
Average Fatalities |
Average Fatality Rate |
Average Injuries |
Average Injury Rate |
Average Safety Events |
Average Safety Event |
Average System Reliability Value |
Heavy Rail |
0.33 |
0.01 |
232.67 |
9.95 |
24.67 |
1.06 |
49,732.00 |
Light Rail |
0.33 |
0.06 |
105.67 |
18.16 |
35.67 |
6.13 |
7,660.00 |
Bus |
1.00 |
0.04 |
386.33 |
16.31 |
149.33 |
6.32 |
19,451.00 |
The RIDE |
0.33 |
0.02 |
40.00 |
2.43 |
38.67 |
2.34 |
66,134.00 |
Notes: Fatality, injury, and safety event rates are expressed per one million VRM. Values have been rounded to the nearest hundredth. The system reliability measure is expressed as mean VRM traveled per major mechanical failure. This table reflects data available at the time the MBTA developed its targets. CY = calendar year. MBTA = Massachusetts Bay Transportation Authority. VRM = vehicle-revenue miles. Source: MBTA and the Boston Region MPO staff.
The MBTA established its initial set of performance targets for CY 2020 and chose to maintain these targets for CY 2021. These targets are shown in Table 4-7. The MBTA targets for rate measures are expressed per one million VRM. When setting targets, the MBTA varied its approach by measure:
Table 4-7
MBTA CY 2021 Safety Performance Targets
MBTA Mode |
Fatalities Target |
Fatality Rate Target |
Injuries Target |
Injury Rate Target |
Safety Events Target |
Safety Event Target |
System Reliability Target |
Heavy Rail |
0.00 |
0.00 |
221.00 |
9.45 |
24.00 |
1.00 |
47,000.00 |
Light Rail |
0.00 |
0.00 |
100.00 |
17.25 |
34.00 |
5.83 |
7,000.00 |
Bus |
0.00 |
0.00 |
367.00 |
15.50 |
142.00 |
6.00 |
18,000.00 |
The RIDE |
0.00 |
0.00 |
36.00 |
2.30 |
37.00 |
2.22 |
66,000.00 |
Note: Fatality, injury, and safety event rates are expressed per one million VRM. Values have been rounded to the nearest hundredth. The system reliability measure is expressed as mean VRM traveled per major mechanical failure. CY = calendar year. MBTA = Massachusetts Bay Transportation Authority. VRM = vehicle-revenue miles. Source: MBTA and the Boston Region MPO staff.
CATA monitors performance and sets federally required targets for its fixed-route bus service and its demand-response service. According to averages calculated using CYs 2016-19 data, CATA’s demand-response system runs about 127,000 VRM annually, and its fixed-route bus system runs about 212,000 VRM annually. CATA has established targets for state fiscal year (SFY) 2021 (July 2020 to June 2021), and it expresses its rate targets per one million vehicle miles traveled.
Table 4-8 shows past averages for the federally required transit safety measures for CATA’s fixed-route and demand-response services. While this historic data is shown in calendar years, as opposed to state fiscal years, this table does provide details about expected fatalities, injuries, safety events and expected system reliability within a 12-month period.
Table 4-8
Past Safety Performance Data for CATA Transit Services
CATA Mode |
2016–19 Average Fatalities |
2016–19 Average Fatality Rate |
2016–19 Average Injuries |
2016–19 Average Injury Rate |
2016–19 Average Safety Events |
2016–19 Average Safety Event Rate |
2016–19 Average System Reliability Value* |
Fixed- Route Bus |
0.00 |
0.0 |
1.00 |
4.72 |
0.75 |
3.54 |
57,865.39 |
Demand Response |
0.00 |
0.0 |
0.25 |
1.98 |
0.25 |
1.98 |
126,913.25 |
Notes: Fatality, injury, and safety event rates are expressed per one million VRM. Values have been rounded to the nearest hundredth. The system reliability measure is expressed as mean VRM traveled per major mechanical failure. These values reflect data that have been updated since the development of CATA’s ASP and targets. For previous values, see CATA’s ASP.
* CATA used 2016–18 averages as a basis for its system reliability targets, as 2019 data on major mechanical failures were not available at the time the draft ASP and targets were developed. The 2016–18 averages are 68,068.00 for fixed-route bus and 125,340.00 for demand-response service.
ASP = agency safety plan. CATA = Cape Ann Transportation Authority. CY = calendar year VRM = vehicle-revenue miles.
Sources: CATA, Cambridge Systematics, and the Boston Region MPO staff.
In general, CATA used past data and averages as the basis for determining its transit safety performance targets. When CATA set targets, it reviewed data for years when injuries or safety events did take place and reflected those values when setting injury and safety event rate targets for SFY 2021. Table 4-9 provides a summary of CATA’s SFY 2021 performance targets.
Table 4-9
CATA SFY 2021 Safety Performance Targets
CATA Mode |
Fatalities Target |
Fatality Rate Target |
Injuries Target |
Injury Rate Target |
Safety Events Target |
Safety Event Target |
System Reliability Target |
Fixed- Route Bus |
0.0 |
0.0 |
1.0 |
4.8 |
1.0 |
4.8 |
70,000.0 |
Demand Response |
0.0 |
0.0 |
1.0 |
8.2 |
1.0 |
8.2 |
125,000.0 |
CATA = Cape Ann Transportation Authority. SFY = state fiscal year. VRM = vehicle-revenue miles.
Source: CATA and the Boston Region MPO staff.
Like CATA, MWRTA monitors performance and sets federally required targets for fixed-route bus service and demand-response services, and the agency has set targets for SFY 2021. However, MWRTA expresses its fatality, injury, and safety event rates per 100,000 vehicle-revenue miles to align with data that it reports to MassDOT. MWRTA runs, on average, approximately 1,201,000 VRM of fixed-route service per calendar year and approximately 1,058,000 VRM of demand-response service per calendar year, based on NTD safety data for CYs 2018–19.
Table 4-10 shows agency data for SFYs 2019 and 2020 that MWRTA considered when developing its SFY 2021 performance targets. In addition to information about fatalities and injuries, Table 4-10 provides information about preventable accidents, which MWRTA and other RTAs report annually to MassDOT. Preventable accidents are defined as “those accidents in which the transit driver is typically deemed responsible or partly responsible for the occurrence of the accident.”4-15
Table 4-10
Past Safety Performance Data for MWRTA Transit Services (SFYs 2019–20)
MWRTA Mode |
SFY 2019 Fatalities |
SFY 2019 Injuries |
SFY 2019 Preventable Accidents |
SFY 2020 Fatalities |
SFY 2020 Injuries |
SFY 2020 Preventable Accidents |
Fixed- Route Bus |
0 |
2 |
16 |
0 |
0 |
10 |
Demand Response |
0 |
0 |
18 |
0 |
0 |
10 |
MPO = metropolitan planning organization. MWRTA = MetroWest Regional Transit Authority. SFY = state fiscal year.
Sources: MWRTA and Boston Region MPO staff.
Table 4-11 shows past averages for the federally required transit safety measures for MWRTA’s fixed-route and demand-response services in calendar year format, which is similar to the data presented for the MBTA and CATA. MPO staff collected this information from the NTD Safety and Security Time Series data files and the NTD Annual Vehicle Database files for CYs 2018 and 2019, which overlap the period covered by the data in Table 4-10.4-16 As with the data shown for CATA, this NTD data is shown in calendar years, as opposed to state fiscal years, but it does provide details about expected fatalities, injuries, safety events and expected system reliability within a 12-month period. As previously mentioned, MWRTA’s rate values are expressed in 100,000 VRM.
Table 4-11
Past Safety Performance Data for
MWRTA Transit Services (CYs 2018–19 Averages)
MWRTA Mode |
Average Fatalities |
Average Fatality Rate |
Average Injuries |
Average Injury Rate |
Average Safety Events |
Average Safety Event Rate |
Average System Reliability Value |
Fixed- Route Bus |
0.00 |
0.00 |
0.50 |
0.04 |
1.50 |
0.12 |
65,050.15 |
Demand Response |
0.00 |
0.00 |
3.00 |
0.28 |
3.50 |
0.34 |
82,148.70 |
Notes: Fatality, injury, and safety event rates are expressed per 100,000 VRM. Values have been rounded to the nearest hundredth. The system reliability measure is expressed as mean VRM traveled per major mechanical failure.
CY = calendar year. MWRTA = MetroWest Regional Transit Authority. NTD = National Transit Database. VRM = vehicle-revenue miles.
Sources: NTD Safety and Security Time Series Data files (as of November 2020, published March 4, 2021), NTD 2018 and 2019 Annual Vehicle Database Files, and the Boston Region MPO staff.
Table 4-12 provides a summary of MWRTA’s SFY 2021 performance targets. MWRTA sought to set attainable values for these federally required performance measures. These target values maintain zero fatalities on MWRTA’s fixed-route bus and demand-response systems and are somewhat higher than recent actual values for other performance measures.
Table 4-12
MWRTA SFY 2021 Safety Performance Targets
MWRTA Mode |
Fatalities Target |
Fatality Rate Target |
Injuries Target |
Injury Rate Target |
Safety Events Target |
Safety Event Target |
System Reliability Target |
Fixed- Route Bus |
0.00 |
0.00 |
12.00 |
1.00 |
24.00 |
2.00 |
75,000.00 |
Demand Response |
0.00 |
0.00 |
8.00 |
1.00 |
16.00 |
2.00 |
75,000.00 |
Note: Fatality, injury, and safety event rates are expressed per 100,000 VRM. Values have been rounded to the nearest tenth. The system reliability measure is expressed as mean VRM traveled per major mechanical failure.
MWRTA = MetroWest Regional Transit Authority. SFY = state fiscal year. VRM = vehicle-revenue miles.
Sources: MWRTA and the Boston Region MPO staff.
During FFY 2021, the MBTA, MWRTA, and CATA plan to make a number of investments that may enhance transit safety performance, which could support their ability to meet current performance targets. The MBTA plans to improve a number of its facilities to support safety performance, including Ruggles Station, the parking garages at Braintree and Quincy Adams Stations, Attleboro Station (in coordination with the Greater Attleboro Taunton Regional Transit Authority), the MBTA operations center on High Street in Boston, and the Charlestown bus facility (by rehabilitating the sea wall). It also plans to improve rail infrastructure, particularly through its Green Line Train Protection project, which involves the installation of equipment for a train-monitoring system that will determine allowable separation and prevent vehicles from passing a red signal. Other MBTA investments include those in its Bridge and Tunnel Program, such as replacement of several bridges, including the Gloucester Drawbridge, and inspection and rehabilitation of MBTA tunnels.
Meanwhile, CATA will use its federal and state dollars to fund preventative maintenance activities and to purchase a new van and capital maintenance items. Similarly, MWRTA will replace a van and invest in improvements to its Blandin terminal facility and the operations center at the commuter rail station in Framingham, which it manages and maintains under contract with the MBTA. These types of investments help keep RTA assets in a state of good repair, which in turn supports safe and reliable transit service.
Undesirable safety outcomes on transit systems—such as fatalities, injuries, collisions or other unsafe events—can result from a variety of factors, such as human error and asset condition. As previously mentioned, the Safety Management Systems (SMS) that transit agencies implement rely upon a combination of strategies and processes, some of which relate to transit asset management (TAM). For example, the asset condition data that agencies collect and the analyses they perform as part of TAM can help identify potential safety issues, assess risks, and develop proactive responses. Meanwhile, safety risk assessment and monitoring can inform the amount of resources transit agencies put towards TAM and the way they prioritize specific assets for repair or replacement.4-17
MassDOT and the transit agencies in the Boston region account for safety when selecting projects for capital investment programs, including the TIP. MassDOT includes safety as part of its Reliability priority area and sizes investment programs to support MBTA and RTA asset condition in that area using data on performance and asset condition. Safety issues are also considered at the level of individual investments. For example, members of the MBTA Safety team review all candidate projects to determine whether they may address documented existing or potential safety hazards, safety regulatory mandates, or corrective actions.
The FFYs 2022–26 TIP includes the MBTA’s, MWRTA’s, and CATA’s planned infrastructure investments, which support improvements in safety outcomes, asset condition, and system reliability. Because of the timing of these investments, they are not expected to affect the MPO’s current transit safety performance targets; however, they are expected to help improve performance on these measures over time. The MBTA plans to improve a number of its facilities to support safety performance, including Forest Hills Station, the Lynn commuter rail station and parking garage, and a number of Green line surface stations. It also plans to improve rail infrastructure, particularly through its Green Line Train Protection project. Other planned MBTA investments include those in its Bridge and Tunnel Program, which will support bridge design, repair, inspection, rehabilitation, and replacement. This program will support projects such as the replacement of the Gloucester Drawbridge; and the replacement of several bridges that carry MBTA commuter rail lines. This program also supports inspection and rehabilitation of tunnels systemwide.
CATA and MWRTA also plan to make investments that will support safety. CATA will use its federal and state dollars to fund preventative maintenance activities and purchase new revenue vehicles to replace those that have reached the end of their useful life. Similarly, MWRTA will purchase replacement vehicles and invest in improvements to its Blandin terminal facility and the operations center at the commuter rail station in Framingham. Transit agency investments are also discussed in the section of this chapter, titled “System Preservation and Modernization Performance,” and additional details about these investments are available in Chapter 3.
The Boston Region MPO’s FFYs 2022–26 corridor and intersection projects can also help improve safety outcomes for bus and paratransit services by making the region’s roadways safer for all users. The MPO has also set aside $5.5 million in funding for its Transit Modernization investment program starting in FFY 2025. While the MPO continues to work with MassDOT and the region’s transit agencies to define the scope of this program, in October 2020 the MPO established baseline transit safety evaluation criteria for this program, which mirror the evaluation criteria used by the MBTA. More details about these criteria are included in Appendix A.
Going forward, the MPO will work with its planning partners and other stakeholders to better understand and measure safety performance and to invest in projects that will reduce fatalities, injuries, and other negative safety outcomes as much as possible. In the future, the MPO will
One of the MPO’s goals is to maintain and modernize the transportation system and plan for its resiliency. System preservation and modernization policies for the Boston region apply to bridges, pavement, sidewalks, and transit system assets. They address existing maintenance and state-of-good-repair needs, necessary updates to infrastructure to meet customer needs, and preparations for existing or future extreme conditions such as sea level rise and flooding.
The MPO’s Regional Target projects support asset condition improvements, which complement MassDOT’s and transit agencies’ more extensive state-of-good-repair and modernization projects. MassDOT uses information from its internal asset management systems to guide decisions about asset maintenance and modernization and considers investment priorities from its TAMP.4-18 The TAMP is a federally required risk-based asset management plan that includes asset inventories, condition assessments, and investment strategies to improve the condition and performance of the NHS, particularly its bridges and pavements. Similarly, transit agencies that receive FTA funding must produce TAM plans that describe transit system assets and their condition, along with the tools and investment strategies these agencies will use to improve these assets.4-19
To meet federal performance monitoring requirements, states and MPOs must track and set performance targets for the condition of bridges on the NHS, a network that includes the Interstate Highway System and other roadways of importance to the nation’s economy, defense, and mobility. The Massachusetts TAMP reports that as of 2019, Massachusetts had 2,263 bridges on the NHS, which have a combined deck area of approximately 29,660,000 square feet.4-20 The Commonwealth reports that “approximately 44 percent (2,263 bridges) of the Massachusetts National Bridge Inventory (NBI) are on the NHS; however, due to the geometric requirements of the higher speed and multilane facilities typified by the NHS, over 70 percent of the bridge area is located on the NHS.”4-21 The overwhelming majority of these NHS bridges, by count, are owned by MassDOT (approximately 96 percent), followed by municipalities (three percent), and a combination of the MBTA, Massachusetts Port Authority (Massport), and the Massachusetts Department of Conservation and Recreation (DCR) (less than one percent).
Based on 2020 data from the MassDOT Highway Division Bridge Inspection Management System, MPO staff estimate that there are 862 NHS bridges in the Boston region. Most of these bridges are owned by MassDOT (96 percent), and about four percent are owned by municipalities, while less than one percent are owned by other entities. The MassDOT or municipally-owned NHS bridges in the Boston region have a combined deck area of approximately 14,123,000 square feet, which accounts for 48 percent of NHS bridge deck area in Massachusetts.
As noted in Table 4-3, FHWA bridge condition performance measures include the following:
These performance measures classify NHS bridge condition as good or poor based on the condition ratings of three bridge components: the deck, the superstructure, and the substructure.4-22 The lowest rating of the three components determines the overall bridge condition.4-23 The measures express the share of NHS bridges in a certain condition by deck area out of the total deck area of NHS bridges in the applicable geographic area (calculated for the state or MPO region).
Table 4-13 shows performance baselines for NHS bridge condition in Massachusetts and the Boston region, which were calculated around the time that the Commonwealth set its initial targets. As of 2017, Massachusetts had 2,246 NHS bridges, which MassDOT analyzed to understand their current condition with respect to the federal bridge-condition performance measures. In 2018, the Boston Region MPO performed a similar analysis on the 859 NHS bridges in the region. According to these baseline values, the Boston region had a larger share of NHS bridge deck area considered to be in good condition and a slightly smaller share of NHS bridge deck area considered to be in poor condition, compared to Massachusetts overall.
Table 4-13
NHS Bridge Condition Baselines for Massachusetts and the Boston Region
Geographic Area |
Total NHS Bridges |
Total NHS Bridge Deck Area (square feet) |
Percent of NHS Bridge Deck Area in Good Condition |
Percent of NHS Bridge Deck Area in PoorCondition |
Massachusetts1 |
2,246 |
29,457,351 |
15.2% |
12.4% |
Boston Region2 |
859 |
14,131,094 |
19.2% |
11.8% |
1 Massachusetts baseline data is based on a MassDOT analysis conducted in 2018.
2 Boston region comparison data is based on a Boston Region MPO analysis conducted in 2018.
MassDOT = Massachusetts Department of Transportation. MPO = metropolitan planning organization. NHS = National Highway System.
Sources: MassDOT and the Boston Region MPO staff.
USDOT has established 10 percent as a threshold for NHS bridge deck area that is in poor condition, and departments of transportation for states that exceed that threshold must direct a defined minimum amount of National Highway Performance Program (NHPP) funding toward improving NHS bridges. Because more than 10 percent of Massachusetts NHS bridge deck area is in poor condition, MassDOT programs this minimum amount.
States must set performance targets for these NHS bridge and pavement condition measures at two-year and four-year intervals. Table 4-14 shows the baseline Massachusetts value discussed in Table 4-13, along with an updated value calculated in July 2019, which is included in MassDOT’s 2019 TAMP. The table also shows MassDOT’s current NHS bridge performance targets, which it established in 2018. The two-year target reflects conditions as of the end of CY 2019, and the four-year target reflects conditions as of the end of CY 2021. These targets reflect MassDOT’s anticipated NHS bridge condition based on historic trends, as well as planned bridge investments. As shown in the table, MassDOT expects there will be a small increase in the share of NHS bridge deck area in good condition by the end of CY 2021, while it expects that the share of NHS bridge deck area in poor condition in CY 2021 will be slightly lower than the baseline. Finally, the table shows MassDOT’s long-term targets for NHS bridge condition, which can be viewed as state-of-good-repair targets.4-24
Table 4-14
Massachusetts NHS Bridge Condition Targets
Federally Required Bridge Condition Performance Measure |
Baseline |
2019 Value* |
Two-Year Target |
Four-Year Target |
MA Long Term Target |
Percent of NHS Bridges [by deck area] that are in good condition |
15.2% |
16.1% |
15.0% |
16.0% |
>18% |
Percent of NHS Bridges [by deck area] that are in poor condition |
12.4% |
12.5% |
13.0% |
12.0% |
< 10% |
* The 2019 values for bridge condition are as of July 1, 2019. These values are published in the 2019 MassDOT Transportation Asset Management Plan.
MassDOT = Massachusetts Department of Transportation. MPO = metropolitan planning organization. NHS = National Highway System.
Sources: Massachusetts Department of Transportation and the Boston Region MPO staff.
In its 2019 TAMP, MassDOT also set a long-term target of less than 10 percent for the percent of NBI bridges statewide whose overall condition would be considered poor.
MPOs are required to set four-year NHS bridge performance targets by either electing to support state targets or setting separate quantitative targets for the region. The Boston Region MPO elected to support MassDOT’s four-year targets for these measures in November 2018. This approach reflects the ways that each entity supports NHS and other bridge improvements in the Boston region. The MPO’s Regional Target program typically makes modest contributions to bridge improvements in the Boston region, while the MassDOT Bridge Program remains the region’s primary funding source for replacement or rehabilitation of substandard bridges.
As with NHS bridges, USDOT’s performance-management framework requires states and MPOs to monitor and set targets for the condition of pavement on NHS roadways. According to the 2018 Massachusetts’ Road Inventory Year End Report, 10,492 lane miles (about 15 percent of statewide lane mileage) are part of the NHS.4-25 This includes 2,253 lane miles on the Interstate System and 7,567 lane miles of non-Interstate NHS roadways. All Interstate roadways in Massachusetts are owned by MassDOT, which also owns 4,756 lane miles (63 percent) of non-Interstate NHS roadways. Of the 2,808 accepted lane miles remaining, 2,572 lane miles (92 percent) are owned by municipalities, while another 236 lane miles (eight percent) are owned by a combination of DCR, Massport, state institutions (e.g., colleges and universities), and the federal government.
Within the Boston region, 3,701 lane miles (16 percent all of roadway lane miles) are part of the NHS. Of these, 1,138 lane miles (31 percent) are on the Interstate system, which is owned by MassDOT. Of accepted non-Interstate NHS roadway miles, 1,231 lane miles (48 percent) are owned by MassDOT, 1,103 lane miles (43 percent) are owned by municipalities, and 228 lane miles (nine percent) are owned by other entities.
Applicable federal performance measures for NHS pavements, which are also listed in Table 4-3, include the following:
The Interstate performance measures classify Interstate pavements as in good or poor condition based on the pavements’ International Roughness Index (IRI) value and one or more pavement distress metrics (cracking and/or rutting and faulting) depending on the pavement type (asphalt, jointed concrete, or continuous concrete). FHWA sets thresholds for each metric that determine whether the metric value is good, fair, or poor, along with thresholds that determine whether the pavement segment as a whole is considered to be in good or poor condition. Non-Interstate NHS pavements are subject to the same thresholds for IRI values. As of 2020, states are required to collect both IRI data and values for complementary distress metrics for non-Interstate NHS pavements, which will be incorporated into future performance monitoring.
MassDOT tracks the condition of roadways in Massachusetts, including NHS network, through its Pavement Management Program.
In 2018, MassDOT established performance targets for these NHS pavement condition performance measures. As with the NHS bridge condition performance targets, the two-year target reflects conditions as of the end of CY 2019, and the four-year target reflects conditions as of the end of CY 2021. While MassDOT has collected IRI data in past years, these federally required performance measures also require other types of distress data that have not previously been required as part of pavement-monitoring programs.4-26 At the time of target setting, MassDOT noted that setting targets for these pavement-condition measures is challenging given the lack of complete historic data. MassDOT’s approach when setting targets was to use past pavement indicators to identify trends and to set conservative targets. Table 4-15 shows MassDOTs performance targets for these measures along with baseline data as of 2017 and updated data as of early 2019.
Table 4-15
Massachusetts NHS Pavement Condition Targets
Federally Required Pavement Condition Performance Measure |
2017 |
2019 |
Two-Year Target |
Four-Year Target |
Percent of Interstate Highway System pavements that are in good condition1 |
74.2% |
70.1% |
70.0% |
70.0% |
Percent of Interstate Highway System pavements that are in poor condition1 |
0.1% |
0.3% |
4.0% |
4.0% |
Percent of non-Interstate NHS pavements that are in good condition |
32.9% |
32.9%3 |
30.0% |
30.0% |
Percent of non-Interstate NHS pavements that are in poor condition |
31.4% |
31.4%3 |
30.0% |
30.0% |
1 For the first federal performance monitoring period (CY 2018–21), the Federal Highway Administration only required states to report four-year targets for pavement condition on the Interstate Highway System. MassDOT developed both two-year and four-year targets for internal consistency.
2 The 2019 values for bridge condition are as of January 1, 2019. These values are published in the 2019 MassDOT Transportation Asset Management Plan.
3These values reflect the International Roughness Index only. Other distress metrics will be incorporated into monitoring as of 2020, per federal regulations.
MassDOT = Massachusetts Department of Transportation. MPO = metropolitan planning organization. NHS = National Highway System.
Sources: MassDOT and the Boston Region MPO staff.
As with NHS bridge condition performance measures, MPOs are required to set four-year Interstate and non-Interstate NHS pavement-condition performance targets by either supporting state targets or setting separate quantitative targets for the region. The Boston Region MPO elected to support MassDOT’s four-year targets for these NHS pavement-condition measures in November 2018. The MPO will work with MassDOT to meet these targets through its Regional Target investments. This approach reflects the ways that each entity supports NHS and other pavement improvements in the Boston region. The MPO’s policy has been to not use Regional Target funds for projects that only resurface pavement. MassDOT’s pavement-improvement programs, along with its other corridor and intersection improvement programs, provide the majority of funding for pavement improvements in the Boston region. However, the MPO does fund roadway reconstruction projects that include pavement improvements in addition to other design elements, and through this process the MPO will work with MassDOT to make progress towards these NHS pavement-condition targets.
When prioritizing capital investments for the TIP, the MPO uses its project-evaluation criteria to assess how well each project funded with Regional Target dollars may help maintain or modernize the Boston region’s roadway infrastructure. The MPO’s set of criteria has included, and continues to include, items that award points to projects that improve substandard bridges, pavement, sidewalks, and signals, or that improve the network’s ability to support emergency response and respond to extreme conditions.4-27 In October 2020, the MPO adopted an updated set of project selection criteria that
More information about the MPO’s current TIP criteria is available in Appendix A. Information about the MPO’s previous criteria, which was used in the evaluations of the Regional Target-funded corridor, intersection, and bicycle and pedestrian projects included in the FFYs 2022–26 TIP, is described in the FFYs 2021–25 TIP document, which is available at bostonmpo.org/tip.
Table 4-16 displays metrics that describe how the MPO’s FFYs 2022–26 Regional Target projects are expected to improve infrastructure on the region’s roadways. MPO staff developed estimated values for these metrics using available data from MassDOT’s Bridge Inventory and Road Inventory files; project proponent information such as functional design reports; results from TIP project evaluations; and other sources.4-28 The MPO expects that these FFYs 2022–26 investments will help make progress towards statewide NHS bridge and pavement condition targets and will also help improve the overall condition of the region’s roadways and bridges and address resiliency needs.
Table 4-16
Regional Target Projects: Roadway System Preservation and Modernization Performance Metrics
Metric |
Value |
Bridge structures improved |
7 structures |
NHS bridge structures improved |
4 structures |
New bridge structures to be constructed |
5 structures |
Lane miles of substandard pavement improved1,2 |
62 lane miles |
Lane miles of substandard NHS pavement improved1,2 |
42 lane miles |
Miles of substandard sidewalk improved |
31 miles |
Projects that improve emergency response |
20 projects |
Projects that improve the ability to respond to extreme conditions2 |
7 projects |
Note: The group of projects reflected in this table does not include the Green Line Extension or Transit Modernization investments. Community Connections projects do not include system preservation and modernization elements.
1 Substandard pavement and sidewalk designations are based on data provided by MassDOT and project proponents and on MPO assessments conducted for TIP evaluations. The estimated lane miles of substandard NHS pavement improved is based on the pavement condition assessment for the project and the MPO’s assessment of the portion of the project on the NHS. The IRI thresholds used to classify pavement are based on FFYs 2021–25 TIP criteria: 190 or less (good), 191 to 320 (fair or substandard), greater than 320 (poor or substandard).
2 MPO staff estimated values for this metric using the TIP criteria in effect when the FFYs 2021–25 TIP was developed (before October 2020).
MassDOT = Massachusetts Department of Transportation. MPO = metropolitan planning organization. NHS = National Highway System.
Sources: MassDOT and the Boston Region MPO staff.
Many of MassDOT’s FFYs 2022–26 TIP investments address bridge and pavement condition. MassDOT’s Bridge programs include 18 projects that will improve or replace 25 bridge structures, 16 of which are NHS bridge structures. MassDOT’s Interstate Pavement program will improve pavement on Interstate 93 in Boston, Milton, Quincy, Medford, Winchester, and Stoneham and on Interstate 95 in Burlington and Woburn. Meanwhile, its non-Interstate pavement program includes eight projects that will improve pavements on MassDOT-owned NHS roadways in 16 Boston region municipalities. These projects are expected to help MassDOT make progress toward its NHS bridge and pavement performance targets by addressing condition gaps identified in its TAMP, as well as generally improve the bridge and pavement condition in the Boston region. Chapter 3 describes the funding that MassDOT will commit to the Boston-region projects included in these programs. Projects in MassDOT’s other Reliability and Modernization programs—including its Intersection Improvements, Roadway Improvements, Roadway Reconstruction, and Safety Improvements programs—include elements that will improve pavement and roadway infrastructure condition in the Boston region.
Through its Transit Asset Management rule, which focuses on achieving and maintaining a state of good repair for the nation’s transit systems, FTA requires transit agencies to submit progress reports and updated performance targets for federally required TAM performance measures. These relate to transit rolling stock, nonrevenue service vehicles, facilities, and rail fixed-guideway infrastructure. Transit agencies develop these performance targets based on their most recent asset inventories and condition assessments, along with their capital investment and procurement expectations, which are informed by their TAM plans. MBTA, MWRTA, and CATA share their asset inventory and condition data and their performance targets with the Boston Region MPO, so that the MPO can monitor and set TAM targets for the Boston region. The MPO revisits its targets in these performance areas each year when updating its TIP.
The following sections discuss the MPO’s current performance targets (adopted in January 2021) for each of the TAM performance measures, which are listed in Table 4-2. These performance targets reflect the MBTA’s, CATA’s, and MWRTA’s SFY 2021 TAM performance targets (for July 2020 through June 2021). MPO staff has aggregated some information for asset subgroups.
FTA’s TAM performance measure for evaluating whether rolling stock (vehicles that carry passengers) and equipment vehicles (service support, maintenance, and other nonrevenue vehicles) are in a state of good repair is the percent of vehicles that meet or exceed their useful life benchmark (ULB). This performance measure uses vehicle age as a proxy for state of good repair (which may not necessarily reflect actual asset condition or performance), with the goal being to bring this value as close to zero as possible. FTA defines ULB as “the expected lifecycle of a capital asset for a particular transit provider’s operating environment, or the acceptable period of use in service for a particular transit provider’s operating environment.”4-29 For example, FTA’s default ULB value for a bus is 14 years.4-30 For its SFY 2021 targets, the MBTA has used FTA default ULBs for all vehicle types except for paratransit autos, minivans and vans, which are measured using MBTA-defined ULBs. The MWRTA uses FTA default ULBs for vans and equipment vehicles (excluding automobiles), and it uses ULBs from MassDOT’s Fully Accessible Vehicle Guide for its cutaway vehicles and revenue and nonrevenue automobiles.4-31 CATA uses useful life criteria as defined in FTA Circular 5010.1E (Award Management Requirements) for ULB values for its vehicles.4-32
Table 4-17 describes SFY 2020 baselines and the MPO’s SFY 2021 targets for rolling stock. As shown below, the MBTA, CATA, and MWRTA are improving performance for a variety of rolling-stock-vehicle classes. Transit agencies can make improvements on this measure by expanding their rolling-stock fleets or replacing vehicles within those fleets.
Table 4-17
TAM Performance Values and SFY 2021 Targets
for Transit Rolling Stock
|
|
|
SFY 2020 Performance |
SFY 2021 Targets |
||||
|---|---|---|---|---|---|---|---|
| Agency |
Asset Type |
Number of Vehicles |
Number of Vehicles Meeting or Exceeding |
Percent of Vehicles Meeting or Exceeding |
Expected Number of Vehicles |
Expected Number of Vehicles Meeting or Exceeding |
Target Percent of Vehicles Meeting or Exceeding |
MBTA |
Buses |
1,138 |
339 |
30% |
1,154 |
263 |
23%1 |
MBTA |
Light Rail Vehicles |
213 |
86 |
40% |
221 |
86 |
39%1 |
MBTA |
Vintage Trolleys2 |
10 |
10 |
100% |
10 |
10 |
100% |
MBTA |
Heavy Rail Vehicles |
436 |
240 |
55% |
462 |
240 |
52%1 |
MBTA |
Commuter Rail Locomotives |
88 |
21 |
24% |
88 |
21 |
24% |
MBTA |
Commuter Rail Coaches |
420 |
55 |
13% |
420 |
55 |
13% |
MBTA |
Ferry Boats3 |
3 |
0 |
0% |
3 |
0 |
0% |
MBTA |
Paratransit Vehicles4 |
556 |
288 |
52% |
779 |
231 |
30%1 |
CATA |
Buses |
8 |
0 |
0% |
8 |
2 |
25% |
CATA |
Cutaway Vehicles5 |
21 |
3 |
14% |
23 |
3 |
13%1 |
CATA |
Trolleys (simulated)6 |
2 |
2 |
100% |
2 |
2 |
100% |
MWRTA |
Automobiles7 |
8 |
8 |
100% |
8 |
8 |
100% |
MWRTA |
Vans8 |
3 |
0 |
0% |
4 |
0 |
0% |
MWRTA |
Cutaway vehicles5, 7 |
102 |
18 |
18% |
104 |
26 |
25% |
1 The SFY 2021 target anticipates improved performance compared to SFY 2020 performance.
2 MBTA vintage trolleys are used on the Ashmont-Mattapan High Speed Line.
3 One of the MBTA’s four ferryboats will be out of active service and in overhaul into SFY 2022.
4 The MBTA The RIDE paratransit vehicle data and target reflect automobiles, vans, and minivans.
5 The NTD defines a cutaway vehicle as a vehicle in which a bus body is mounted on a van or light-duty truck chassis, which may be reinforced or extended. CATA uses these vehicles to provide fixed route and demand response service.
6 Simulated trolleys, also known as trolley-replica buses, have rubber tires and internal combustion engines, as opposed to steel-wheeled trolley vehicles or rubber-tire trolley buses that draw power from overhead wires.
7 MWRTA uses cutaway vehicles to provide fixed-route and demand-response service, and uses automobiles to provide demand-response service.
8 MWRTA’s vans are used to provide demand-response service.
CATA = Cape Ann Transportation Authority. MBTA = Massachusetts Bay Transportation Authority. MPO = metrpolitan planning organization. MWRTA = MetroWest Regional Transit Authority. NTD = National Transit Database. = SFY = State Fiscal Year. TAM = Transit Asset Management. ULB = useful life benchmark.
Sources: CATA, MBTA, MWRTA, and the Boston Region MPO staff.
The MBTA’s planned SFY 2021 investments in revenue vehicles include ongoing replacements for the bus fleet and The RIDE paratransit fleet, the continuation of its ferryboat overhaul program, continued procurement of Red and Orange Line (heavy rail) vehicles, and the procurement of Type 9 Green Line cars to support the Green Line Extension. During FFY 2021, MWRTA will receive federal funds to replace one of its vans, and during that same time frame, CATA will receive state funds to replace one of its vans.
Table 4-18 shows SFY 2020 baselines and the MPO’s SFY 2021 targets for transit-equipment vehicles. MPO staff has aggregated targets for nonrevenue vehicle subtypes for each of the three transit agencies, although MBTA commuter rail and transit system vehicle fleets are listed separately. Similar to transit rolling stock, transit agencies can make improvements on these measures by expanding their fleets or replacing vehicles within those fleets. The MBTA notes that some of its equipment vehicles are stored indoors and used sporadically, and therefore can perform adequately even if they are well beyond their ULBs. Also, the MBTA’s non-revenue vehicle program focuses on replacing the vehicles that have the highest impact on service, including those used for winter response and track maintenance, which may not always be the oldest vehicles in the fleet.
Table 4-18
TAM Performance Values and SFY 2021 Targets
for Transit Equipment
|
|
|
SFY 2020 Performance |
SFY 2021 Targets |
||||
|---|---|---|---|---|---|---|---|
| Agency |
Asset Type |
Number of Vehicles |
Number of Vehicles |
Percent of Vehicles Meeting or Exceeding ULB |
Expected Number of Vehicles |
Expected Number of Vehicles |
Target Percent of Vehicles |
MBTA |
Transit Equipment |
797 |
157 |
20% |
798 |
225 |
28% |
MBTA |
Commuter Rail Equipment1 |
631 |
150 |
24% |
631 |
197 |
31% |
CATA |
All Equipment |
3 |
1 |
33% |
3 |
3 |
100% |
MWRTA |
All Equipment2 |
11 |
6 |
55% |
11 |
6 |
55% |
1 MBTA commuter rail equipment only includes assets owned by the MBTA.
2 MWRTA equipment vehicles include both trucks and automobiles.
CATA = Cape Ann Transportation Authority. MBTA = Massachusetts Bay Transportation Authority. MPO = metrpolitan planning organization. MWRTA = MetroWest Regional Transit Authority. SFY = state fiscal year revenue year. TAM = transit asset management. ULB = useful life benchmark.
Sources: CATA, MBTA, MWRTA, and the Boston Region MPO staff.
FTA assesses the condition for passenger stations, parking facilities, and administrative and maintenance facilities to determine if they are in a state of good repair by using the FTA Transit Economic Requirements Model (TERM) scale, which generates a composite score based on assessments of facility components. Facilities with scores below three are considered to be in marginal or poor condition (though this score is not a measure of facility safety or operational performance). The goal is to bring the share of facilities that meet this criterion to zero. Infrastructure projects focused on individual systems may improve performance gradually, while more extensive facility improvement projects may have a more dramatic effect on a facility’s TERM scale score.
Table 4-19 shows SFY 2020 measures and the MPO’s SFY 2021 targets for MBTA, CATA, and MWRTA facilities
Table 4-19
TAM Performance Values and SFY 2021 Targets for Facilities
|
|
|
SFY 2020 Performance |
SFY 2021 Targets |
||||
|---|---|---|---|---|---|---|---|
| Agency |
Asset Type |
Number of Facilities |
Number of Facilities in Marginal or Poor Condition2 |
Percent of Facilities in Marginal or Poor Condition |
Expected Number of Facilities |
Expected Number of Facilities in Marginal or Poor Condition |
Target Percent of Facilities in Marginal or Poor Condition |
MBTA |
Transit: Passenger/ Parking Facilities |
162 |
22 |
14% |
162 |
19 |
12%1 |
MBTA |
Transit: Administrative/Maintenance Facilities3 |
166 |
113 |
68% |
166 |
113 |
68% |
MBTA |
Commuter Rail: Passenger/ Parking Facilities |
224 |
8 |
4% |
224 |
7 |
3%1 |
MBTA |
Commuter Rail: Administrative/Maintenance Facilities4 |
166 |
37 |
22% |
166 |
37 |
22% |
CATA |
Administrative/Maintenance Facilities |
1 |
0 |
0% |
1 |
0 |
0% |
MWRTA |
Administrative/Maintenance Facilities |
1 |
0 |
0% |
1 |
0 |
0% |
1 The SFY 2021 target anticipates improved performance compared to SFY 2020 performance.
2 Facilities that have a score of three or less on the FTA TERM scale are considered to be in marginal or poor condition.
3 The number of facilities in this category includes 31 facilities that will undergo an initial condition assessment in SFY 2021.
4 The number of facilities in this category includes one facility that will undergo an initial condition assessment in SFY 2021.
CATA = Cape Ann Transportation Authority. FTA = Federal Transit Administration. MBTA = Massachusetts Bay Transportation Authority. MPO = metropolitan planning organization. MWRTA = MetroWest Regional Transit Authority. SFY = state fiscal year. TAM = transit asset management. TERM = Transit Economic Requirements Model.
Sources: CATA, MBTA, MWRTA, and the Boston Region MPO staff.
The MBTA’s activities in SFY 2021 to improve facilities include equipment and safety upgrades at the Lynn and Quincy bus garages; accelerated work to improve parking facilities at Braintree, Quincy Adams, Wellington, West Natick, and Route 128 Stations, and improvements at the Iron Horse Operations Control Center. CATA will continue to maintain and improve its facility, while MWRTA will continue to improve and enhance its Blandin terminal and the operations center at the commuter rail station in Framingham.
Table 4-20 describes SFY 2020 baselines and SFY 2021 targets for infrastructure condition, specifically rail fixed-guideway condition. The MBTA is the only transit agency in the Boston region with this asset type. The performance measure that applies to these assets is the percentage of track that is subject to performance or speed restrictions. The MBTA samples the share of track segments with speed restrictions throughout the year. These performance restrictions reflect the condition of track, signal, and other supporting systems, which the MBTA can improve through maintenance, upgrades, and replacement and renewal projects. Again, the goal is to bring the share of MBTA track systems subject to performance restrictions to zero.
Table 4-20
TAM Performance Values and SFY 2021
Targets for Infrastructure (Fixed Guideway), MBTA
|
|
SFY 2020 Performance |
SFY 2021 Targets |
||||
|---|---|---|---|---|---|---|
|
|
Number of Miles |
Number of Miles with Performance Restrictions |
Percent of Miles with Performance Restrictions |
Expected Number of Miles |
Expected Number of Miles with Performance Restrictions |
Target Percent of Miles with Performance Restrictions |
MBTA Transit Fixed Guideway1 |
130.23 |
6.18 |
5% |
130.23 |
4.60 |
4%2 |
MBTA Commuter Rail Fixed Guideway |
663.84 |
7.54 |
1% |
663.84 |
5.55 |
1% |
Note: For this performance measure, the term “miles” refers to “directional route miles,” which represents the miles managed and maintained by the MBTA with respect to each direction of travel (for example, northbound and southbound) and excludes nonrevenue tracks such as yards, turnarounds, and storage tracks. The baseline and target percentages represent the annual average number of miles meeting this criterion over the 12-month reporting period.
1 The MBTA’s Transit Fixed Guideway information reflects light rail and heavy rail fixed guideway networks.
2 The SFY 2021 target anticipates improved performance compared to SFY 2020 performance.
MBTA = Massachusetts Bay Transportation Authority. MPO = metropolitan planning organization. SFY = state fiscal year. TAM = transit asset management.
Sourcse: CATA, MBTA, MWRTA, and the Boston Region MPO staff.
The MBTA’s SFY 2021 fixed-guideway infrastructure investments include improvements to the Blue Line Harbor Tunnel, Red and Orange Line track modernization work, Green Line D Branch track improvements and tree removal, and ongoing investment on the Franklin, Framingham/Worcester, and Haverhill commuter rail lines.
Many types of transit investments may affect the TAM vehicle, facility, or fixed-guideway performance measures described in the previous section, because these investments may either improve or replace assets already included in transit agency inventories, or because they may expand those inventories. These investments may improve assets gradually over time by upgrading specific asset subsystems, or they may generate more dramatic changes in performance by overhauling or replacing assets.
The FFYs 2022–26 TIP includes a variety of transit infrastructure improvement initiatives, funded both by the MPO’s Regional Targets and dollars that the MBTA, MWRTA, and CATA program in coordination with MassDOT. Many of the MBTA and CATA investments appear in the priority investment lists these agencies include in their TAM plans. Because of the timing of these investments, they are not expected to affect the MPO’s current (SFY 2021) TAM performance targets; however, they are expected to help improve performance on the TAM measures over time.
During FFYs 2022 to 2026, the MBTA will be investing in vehicles to replace or expand its fleets through its Revenue Vehicles and Bus Programs. Procurements will include the following:
The MBTA will also overhaul hybrid and compressed-natural-gas (CNG) buses, commuter rail locomotives, and part of its bi-level commuter rail coach fleet to ensure these vehicles remain reliable through the end of their service life. In addition, the Green Line Extension project, which the MPO is helping to support with its Regional Target funds, includes investments in vehicles to support the new service.
Meanwhile, CATA plans to purchase several buses, including both body-on-chassis and low-floor buses, to replace those that have reached the end of their useful life. The MWRTA plans to purchase vans to replace vehicles that have reached the end of their useful life. This includes expected purchases of CNG-powered vehicles and electric vehicles for MWRTA’s paratransit system. Collectively, these investments will help improve the condition of the fleets and make progress with respect to the TAM rolling stock performance measure.
During FFYs 2022 to 2026, the MBTA will invest in several of its transit stations and parking facilities through its stations and facilities program. These investments will improve specific subsystems or components of facilities, or they will make more extensive repairs or upgrades to bring the facilities into a state of good repair and address ADA accessibility and other needs. This set of investments includes the construction of a new commuter rail station in Chelsea (and the decommissioning of the existing station); improvements to Forest Hills Station, Newton Highlands Station, Lynn Station and its parking garage, and stations along the Mattapan High Speed Line; and reconstruction of Green Line surface stations. The MBTA will also be funding the design and installation of new redundant elevators and replacing existing elevators at various stations. In addition, the Green Line Extension project includes investment in new stations as part of the expansion of service.
The MBTA will also fund improvements for its administration and maintenance facilities. This includes continued investment to modernize the Quincy bus facility, which will support the MBTA’s transition to battery-electric buses and provide additional capacity to support future service growth. The MBTA will also make infrastructure improvements at its Codman Yard facility, in part to accommodate new Red Line vehicles.
While MWRTA and CATA’s facilities are currently in a state of good repair, these agencies will continue to maintain and upgrade them during FFYs 2022 to 2026. CATA plans to repave the parking lot of its maintenance and operations facility. MWRTA plans to improve its Blandin Hub facility—including its amenities, front entrance, and support equipment—and enhance the facility’s ability to maintain and manage vehicles. MWRTA will also fund improvements and enhancements for the operations center at the commuter rail station in Framingham.
The MBTA’s investments in track signals and systems through its Signals and System Upgrade Program during FFYs 2022 to 2026 will, over time, help reduce the need for performance restrictions on fixed guideways. Projects that address this area include the following:
The installation of new track and systems as part of the Green Line Extension project will also affect fixed-guideway infrastructure performance measures in the future.
Other planned MBTA investments during FFYs 2022 to 2026 include those in its Bridge and Tunnel Program, which will support bridge design, repair, inspection, rehabilitation, and replacement, along with tunnel inspection and rehabilitation. For example, this program will support the rehabilitation of Longfellow Bridge components. Inspection and rating work completed through this program supports MBTA prioritization of future investments. In addition, the MBTA will also be replacing its radio system to support MBTA police communication.
Meanwhile, CATA will invest in shop equipment, software, and other capital maintenance items, while MWRTA will invest in bus support equipment and information technology infrastructure. Both agencies will also be funding improvements to their fare-collection systems.
Additional refinements may be made to MBTA, CATA, and MWRTA programming after MassDOT’s CIP is finalized in summer 2021. For example, the MBTA may pursue funding through federal loan programs to support other projects. Also, CATA and MWRTA coordinate with MassDOT’s Rail and Transit Division to maintain vehicle condition in a state of good repair through competitive grant applications, including to the Commonwealth’s Community Transit Grant Program. The Rail and Transit Division awards funding, including FTA 5310 funds, through this program on an annual basis; award announcements are typically made in the third quarter of the calendar year. Vehicle purchases and other investments supported by this program may improve transit condition in the Boston region.
As mentioned previously, the MPO has set aside $5.5 million in funding for its Transit Modernization investment program starting in FFY 2025. While the MPO continues to work with MassDOT and the region’s transit agencies to define the scope of this program, in October 2020 the MPO established baseline transit system preservation and modernization evaluation criteria for this program. These include criteria that award points for
The MPO’s updated criteria for corridor and intersection projects also award points that improve or modernize transit supporting infrastructure. More details about these criteria are included in Appendix A. These new criteria will support the MPO as it explores opportunities to invest in maintaining transit assets in a state of good repair and in modernization in future years.
The MPO will continue to work to improve the links between transportation investments and system preservation and modernization, and will coordinate with MassDOT, the MBTA, MWRTA, and CATA, and other stakeholders on that process. This work may include the following activities:
The MPO’s capacity management and mobility goal focuses on using existing facility capacity more efficiently and increasing transportation options. The MPO’s objectives in this area encompass a variety of modes and aspects of mobility, including access to and the accessibility of different transportation modes, connectivity between modes and systems, and support for reliable travel and congestion mitigation. Much of the Boston region is densely developed, which creates both opportunities and challenges to addressing these access, reliability, and congestion mitigation needs.
Several different planning processes come together to address capacity management and mobility performance, issues, and needs. Through its CMP, the MPO does extensive analysis of congestion and mobility constraints in the region. The MPO also produces periodic CMAQ Performance Plans and progress reports to address requirements related to the federal Congestion Mitigation and Air Quality Improvement Program; these describe other congestion-oriented measures and targets.4-33 The MPO combines this work with ongoing system-level analyses that support its long-range planning, which are documented in its LRTP Needs Assessment. MassDOT conducts its own analyses of mobility performance and needs, which it documents in modal plans such as its Freight Plan, Bicycle Transportation Plan, and Pedestrian Transportation Plan, its Congestion in the Commonwealth report and accompanying studies, and its MassDOT Performance Management Tracker tool.4-34 Meanwhile, the MBTA tracks and analyzes mobility metrics and uses these to support planning processes, such as Focus40, its current long-term investment plan.4-35 The exchange and integration of these plans help agencies in the Boston region coordinate to improve mobility across modes.
The MPO examines a variety of different metrics to understand congestion and mobility issues, several of which are discussed below.
Table 4-3 highlights several federally required performance measures pertaining to the NHS system, including measures related to infrastructure condition and travel reliability. FHWA requires states and MPOs to monitor and set targets for two performance measures that pertain to all travelers on NHS roadways:
These measures capture (1) whether travel times on an NHS segment are consistent (reliability); and (2) the extent to which NHS users’ travel may be affected by those conditions (percent of person miles). Several component metrics make up this measure:
States or MPOs identify the person-miles of travel for each NHS segment and divide the total person-miles on the relevant NHS network that are reliable by the total person-miles on the relevant NHS network. To support this analysis, FHWA provides travel-time and traffic-volume data as part of the National Performance Management Research Data Set (NPMRDS), in which travel-time data are reported by traffic messaging channel (TMC) segments. These data, along with a set of analysis tools, are available through the Regional Integrated Transportation Information System (RITIS), which is developed and maintained by the Center for Advanced Transportation Technology Laboratory at the University of Maryland. MassDOT has obtained access to the RITIS platform and grants access to MPOs and transportation planning organizations in the Commonwealth.
States are required to set two-year and four-year targets for these measures. In 2018, MassDOT calculated baselines and established targets for these measures for the Massachusetts Interstate and non-Interstate NHS networks. When establishing baseline values, MassDOT only examined NPMRDS travel-time data from CY 2017 because the NPMRDS from prior years was assembled using different data collection methods and has some different features. Because historic data were limited, MassDOT considered FHWA guidance and recommendations for establishing initial targets with this limited historic data, and it set initial targets for Massachusetts equal to CY 2017 baseline values.4-37
Table 4-21 shows MassDOT’s CY 2017 baselines and two-year and four-year targets for these measures. The Boston Region MPO, like all MPOs, was required to establish four-year targets for these measures by either supporting state targets or setting its own quantitative targets for the Boston region. In 2018, the MPO board voted to support the state’s four-year targets. As noted in previous sections, MassDOT owns and manages the Interstate network in Massachusetts and implements strategies to improve its performance. As with the roadway safety performance targets previously discussed, this approach reflects the way the Commonwealth and the MPO will need to collaborate to make and keep the non-Interstate NHS in the region reliable. Some relevant strategies include designing and funding roadway infrastructure improvements and supporting signal retiming, which fall under the purview of both the MPO and MassDOT. Others include regulating vehicle volumes using approaches such as ramp metering or managed lanes, which would fall under the Commonwealth’s purview.
Table 4-21 also shows CY 2017 baselines for the Boston region’s Interstate and non-Interstate NHS networks for comparison. As the table shows, the Boston region’s share of reliable person-miles traveled on its Interstate and non-Interstate NHS networks is lower than those values for Massachusetts as a whole.
Table 4-21
Massachusetts Targets for Travel Time Reliability
Network |
Measure |
Cumulative Traffic |
2017 Measure |
Two-Year Target |
Four-Year Target |
Massachusetts—Interstate Highway System |
Percent of person-miles on the |
1,150 |
68.0% |
68.0% |
68.0% |
Massachusetts—Non-Interstate NHS System |
Percent of person-miles on the |
5,257 |
80.0% |
80.0% |
80.0% |
Boston Region—Interstate Highway System |
Percent of person-miles on the |
354 |
47.2% |
N/A |
N/A |
Boston Region—Non-Interstate NHS System |
Percent of person-miles on the |
1,799 |
69.0% |
N/A |
N/A |
Note: The two-year target reflects conditions as of the end of CY 2019, and the four-year target reflects conditions as of the end of CY 2021.
CY = calendar year. MPO = metropolitan planning organization. N/A = not applicable. NHS = National Highway System.
Sources: National Performance Management Research Data Set, Cambridge Systematics, Massachusetts Department of Transportation, and the Boston Region MPO staff.
The 2019 NPRMDS data available in the RITIS platform show that the travel time reliability measures for the NHS in Massachusetts were close to or better than the Commonwealth’s two-year targets: 69.1 percent of person miles on the Interstate System and 82.8 percent on the non-Interstate NHS were considered reliable. In the Boston region, 2019 values were slightly better than baselines: 47.7 percent of person miles on the Interstate System and 74.7 percent on the non-Interstate NHS were considered reliable.
The share of reliable person-miles on the NHS network increased significantly in 2020 for both the Boston region and Massachusetts as a whole, primarily because of reduced travel in response to the COVID-19 pandemic. Massachusetts’ share of reliable person miles rose to 94.4 percent for the Interstate network, and 91.3 percent for the non-Interstate NHS. In the Boston region, the share of reliable person miles rose to 89.3 percent for the Interstate network, and 86.9 percent for the non-Interstate NHS. As the region and the Commonwealth adjust to post-pandemic travel patterns and levels of demand, the MPO will work with the Commonwealth, municipalities, and other stakeholders to support reliable travel on the NHS and other roadways.
FHWA requires states and MPOs to track truck travel time reliability on the Interstate System to better understand the performance of the nation’s freight system. The applicable measure in this case is the Truck Travel Time Reliability Index (TTTR). Like the LOTTR, this measure compares longer (95th percentile) truck travel times to average (50th percentile) truck travel times. The greater the difference between these two travel times on an interstate segment, the less reliable truck travel on that segment is considered to be. For each Interstate segment, states and MPOs calculate TTTR values for different day-and-time periods and weight the segment length by the maximum applicable TTTR value.4-38 They then sum these weighted segment lengths for all Interstate segments and divide that total value by the length of the full interstate network for the applicable geographic area. Like segment-specific TTTR values, the greater this aggregate value is, the more unreliable the network is with respect to truck travel.
In 2018, MassDOT calculated baseline TTTR Index values and established performance targets using CY 2017 truck travel-time data included in the NPMRDS. As with the all-vehicle travel time reliability targets, MassDOT set its two-year and four-year targets equal to the CY 2017 baseline. Table 4-22 displays these values. MPOs are required to set four-year targets for this measure, and the Boston Region MPO board voted to support MassDOT’s four-year TTTR Index target in 2018. Table 4-22 also includes the Boston region’s CY 2017 baseline index value. As the table shows, the Boston region’s TTTR baseline value is higher than the one for Massachusetts, indicating that truck travel on the region’s interstate network is generally less reliable than on Massachusetts’s interstates as a whole.
Table 4-22
Massachusetts Targets for Truck Travel Time Reliability
Network |
Measure |
Cumulative Traffic |
2017 Measure |
Two-Year Target |
Four-Year Target |
Massachusetts—Interstate Highway System |
Truck Travel Time Reliability Index |
1,150 |
1.85 |
1.85 |
1.85 |
Boston Region—Interstate Highway System |
Truck Travel Time Reliability Index |
354 |
2.55 |
N/A |
N/A |
Note: The two-year target reflects conditions as of the end of CY 2019, and the four-year target reflects conditions as of the end of CY 2021.
CY = calendar year. MPO = metropolitan planning organization. N/A = not applicable.
Sources: National Performance Management Research Data Set, Cambridge Systematics, MassDOT, and the Boston Region MPO staff.
The 2019 NPRMDS data shows that truck travel time reliability on interstates in Massachusetts (TTTR value of 1.84) was slightly better than the two-year target value (1.85). Similarly, the 2019 truck travel time reliability value for interstates in the Boston region (2.47) was better than the 2017 baseline value (2.55).
As with the all-vehicle travel time reliability measures, TTTR values dropped for both the Boston region (1.85) and Massachusetts as a whole (1.44) in 2020. Performance monitoring will enable the Commonwealth and other stakeholders to respond to post-pandemic changes in truck travel time reliability.
MassDOT and the Boston Region MPO also examine mobility using measures they must monitor to meet CMAQ requirements. These measures are designed to help FHWA, states, and MPOs better understand the impacts of CMAQ investments, which are intended to contribute to air quality improvements and provide congestion relief. CMAQ performance measures related to traffic congestion apply to urbanized areas (UZAs) that contain geographic areas designated as nonattainment areas because they do not meet the US Environmental Protection Agency (EPA) standards for criteria air pollutants and precursors from mobile sources.4-39 The measures also apply to geographic areas, designated as maintenance areas, that have a history of being in nonattainment and are thus required to maintain air quality monitoring and standard conformity processes.
States must be involved in setting targets for CMAQ traffic performance measures if (1) they have mainline highways on the NHS that cross part of a UZA with a population of more than one million; and (2) that UZA contains part of a nonattainment or maintenance area for relevant criteria pollutants. Similarly, MPOs must participate in target setting for the traffic congestion measures if (1) the region contains mainline highways on the NHS that cross part of a UZA with a population of more than one million; and (2) the part of the MPO area that overlaps the UZA contains part of a nonattainment or maintenance area for relevant criteria pollutants. Massachusetts and the Boston Region MPO each meet these respective criteria and, therefore, must be involved in monitoring and setting targets for traffic congestion performance measures for the Boston MA-NH-RI UZA, which encompasses several MPO areas in eastern Massachusetts, New Hampshire, and Rhode Island. Agencies in each UZA that are responsible for these traffic congestion measures set two-year and four-year targets.
The first of these CMAQ traffic congestion measures is annual hours of peak hour excessive delay (PHED) per capita, which estimates the excessive delay experienced by a UZA’s population from travel on the NHS during peak periods. States and MPOs calculate this measure using several component metrics:
The PHED per capita measure is calculated at the Boston MA-NH-RI UZA level by multiplying the hours of excessive delay during peak periods by the number of travelers during peak periods, and then dividing that total by the UZA population.
To understand baseline performance and set targets for this measure, MassDOT and the New Hampshire Department of Transportation (NH DOT) worked with analysts at Cambridge Systematics and, using 2017 NPMRDS data, calculated annual hours of PHED per capita for travel on the NHS in their respective portions of the Boston MA-NH-RI UZA.4-42 In 2018, the agencies in the Boston MA-NH-RI UZA that are subject to CMAQ performance monitoring requirements—MassDOT, NH DOT, the Boston Region MPO, and the Northern Middlesex Council of Governments (NMCOG)—established two-year and four-year targets that maintain this 2017 baseline value for the annual hours of PHED per capita measure, as shown in Table 4-23.
Table 4-23
Baseline Value and Targets for Annual Hours of Peak Hour Excessive Delay Per Capita in the Boston MA-NH-RI UZA
Geographic Area |
Massachusetts and New |
Boston MA-NH-RI UZA Population (MA and NH only)1 |
2017 Measure Value (Baseline) |
Two-Year Target |
Four-Year Target -21)2 |
Boston Urbanized Area |
80,053,183 |
4,371,476 |
18.30 |
18.30 |
18.30 |
1 Cambridge Systematics aggregated 2012–16 American Community Survey population estimates from the US Census Bureau at the block group level to estimate the population for the portion of the UZA in Massachusetts and New Hampshire, and then inflated this estimate for 2017 by applying information on expected population growth in the Boston Metropolitan Statistical Area between 2016 and 2017.
2 The two-year target reflects conditions as of the end of CY 2019, and the four-year target reflects conditions as of the end of CY 2021.
CY = calendar year. FHWA = Federal Highway Administration. MA = Massachusetts. MPO = metropolitan planning organization. NH = New Hampshire. PHED = peak hours of excessive delay.
Sources: National Performance Management Research Data Set, US Census Bureau, FHWA, the Massachusetts Department of Transportation, the New Hampshire Department of Transportation, and Cambridge Systematics, and the Boston Region MPO staff.
The 2018 and 2019 estimates of PHED per capita in the Boston MA-NH-RI UZA show increases compared to the baseline value of 18.3 hours of delay per capita from 2017 (22.9 hours per person in 2018 and 25.2 in 2019). As previously mentioned, the initial value and targets for this measure were calculated with a limited amount of historic data, given differences between the NPMRDS data that were available for 2017 compared to 2016 and earlier. Also, MassDOT staff notes that several data-related factors may affect these more recent estimates. For example, the segments included on the NHS network in the NPMRDS vary from set to set, which affects the amount of excessive delay that states and MPOs can account for in their calculations.
While congestion may have increased in the Boston MA-NH-RI UZA over the past several years, the aforementioned issues complicate any analysis of trends. Also, the COVID-19 pandemic, along with related public and private sector responses, impacted travel behavior on all modes in 2020 and 2021 to date. Given these circumstances and uncertainty, when revisiting targets in 2020, the agencies in the Boston MA-NH-RI UZA maintained the existing four-year performance target of 18.3 hours of PHED per capita.
States and MPOs that meet applicability criteria for CMAQ performance requirements must also monitor and set targets for the share of non-single-occupant-vehicle (non-SOV) travel. This measure is calculated at the UZA level. The percent of non-SOV travel performance measure describes the extent to which people are using alternatives to single-occupancy vehicles to travel and, thus, helping to reduce traffic congestion and air pollution from mobile sources.
Collectively, MassDOT, NH DOT, the Boston Region MPO, and NMCOG use American Community Survey (ACS) data from the US Census Bureau to estimate the percent of workers ages 16 and older who commuted to work using an option other than driving alone. These ACS five-year period estimates are rolling annual averages. When these agencies first established targets for this measure in 2018, they examined changes in the percentage of workers using non-SOV commuting options in the Boston MA-NH-RI UZA between 2012 (2008–12 ACS estimate) and 2016 (2012–16 ACS estimate). These data showed an increase in use of non-SOV commuting options over time. MassDOT calculated a linear trend line using these values for the Boston MA-NH-RI UZA and used that trend line to project expected values as of the end of CY 2019 (the expected 2015–19 ACS estimate) and CY 2021 (the expected 2017–21 ACS estimate). These initial targets are described in the MPO’s 2018 CMAQ Performance Plan.4-43
In 2020, MassDOT, NH DOT, the Boston Region MPO, and NMCOG revisited its targets for the percent of non-SOV travel measure. These agencies examined 2013–17 and 2014–18 ACS data and found that the values reported in the data for these years were higher than the projections they made when setting their initial targets. Because of this, they suggested that averages for CY 2019 and CY 2021 would exceed the performance targets established in 2018.
When revisiting existing targets, these agencies considered that the COVID-19 pandemic, along with related public and private sector responses, has affected 2020 travel patterns across modes and would likely have impacts on travel in 2021 as well. Fluctuations in SOV traffic volumes, transit ridership, and carpool, taxi, and rideshare travel introduce some uncertainty. However, some changes, such as increased teleworking, may complement the ongoing investments by MassDOT, NH DOT, the Boston Region MPO, the NMCOG, and other agencies in the Boston MA-NH-RI UZA in projects that encourage travelers to use alternatives to SOVs when traveling to work and other destinations. Also, the five-year rolling average value associated with the four-year target (2017–21) will capture increases in non-SOV travel prior to 2020, even if uncertainties will affect travel choices in 2020 and 2021.
Given the aforementioned updated data points and assumptions, MassDOT and NH DOT—in consultation with the Boston Region MPO and NMCOG staff—updated the Boston MA-NH-RI UZA’s four-year performance target for the percent of non-SOV travel measure from 35.1 percent to 35.8 percent. The Boston Region MPO formally adopted this revised target in November 2020. Figure 4-6 shows past values and projections, updated actual values and projections, and initial and adjusted performance targets for this measure.
Figure 4-6
Performance Values and Targets for the Percent of Non-SOV Travel in the Boston MA-NH-RI UZA
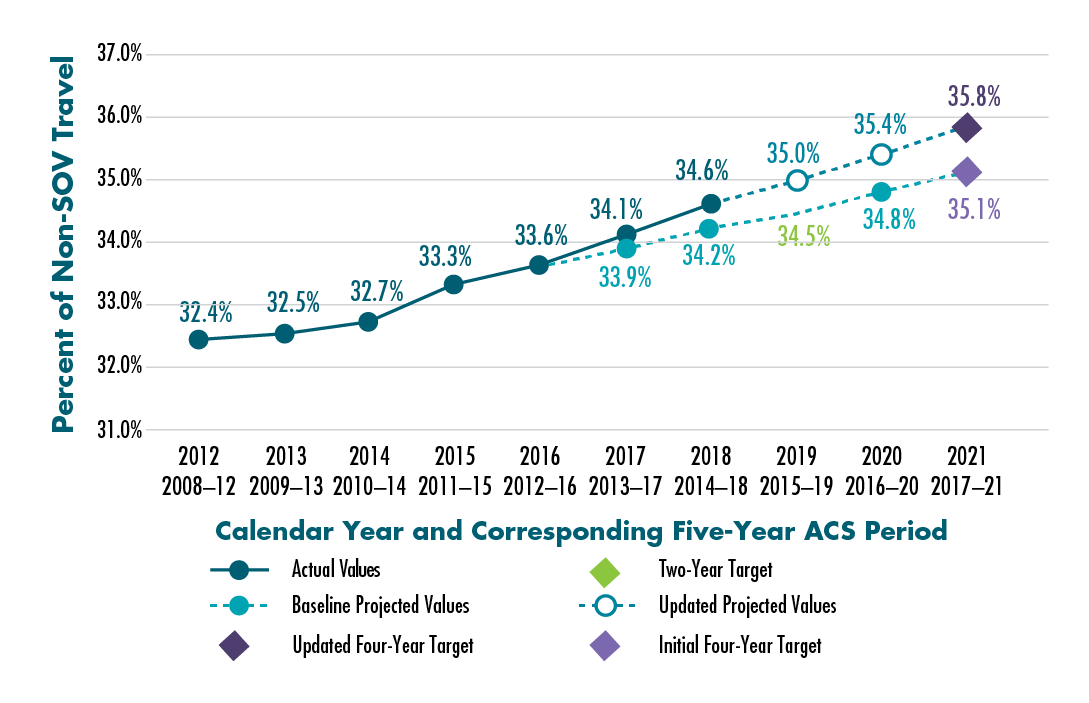
Notes: Values in this figure reflect five-year rolling averages for the percent of non-SOV travel to work for workers ages 16 and older. This chart was developed in September 2020.
ACS = American Community Survey. MA = Massachusetts. NH = New Hampshire. Non-SOV = non-single-occupancy vehicle. RI = Rhode Island. UZA = urbanized area.
Sources: US Census Bureau, ACS Five-Year Estimates (Table DP03, “Selected Economic Characteristics”); the Massachusetts Department of Transportation; the New Hampshire Department of Transportation; and the Boston Region MPO staff.
Table 4-24 lists the baseline and performance targets for this measure.
Table 4-24
Performance Values and Targets for the Percent of Non-SOV Travel in the Boston MA-NH-RI UZA
Geographic Area |
Baseline Value (CYs 2012–16 average) |
Two-Year Target (CYs 2015–19 average) |
Projected Two-Year Value (CYs 2015–19 average) |
Adjusted Four-Year Target (CYs 2017–21 average) |
Boston UZA |
33.6% |
34.5% |
35.0% |
35.8% |
Note: Values in this table reflect five-year rolling averages for the percent of non-SOV travel to work.
ACS = American Community Survey. CY = calendar year. MA = Massachusetts. MPO = metropolitan planning organization. N/A = not applicable. NH = New Hampshire. Non-SOV = non-single-occupancy vehicle. RI = Rhode Island. UZA = urbanized area.
Sources: US Census Bureau, ACS Five-Year Estimates (Table DP03, “Selected Economic Characteristics”); the Massachusetts Department of Transportation; the New Hampshire Department of Transportation; and the Boston Region MPO staff.
The MPO seeks to make investments that help manage capacity on the transportation network and improve mobility options for travelers in a variety of ways, including the following:
When prioritizing projects for funding with Regional Target dollars, the MPO uses evaluation criteria to assess how well each project expands transportation options and mode choice and how it supports mobility. These sets of criteria have included, and continue to include, items that award points to projects that enhance bicycle and pedestrian accommodations and connections to transit, and that support truck movement. The MPO’s criteria prior to October 2020, which was used for the evaluations of the Regional Target-funded corridor, intersection, and bicycle and pedestrian projects in the FFYs 2021–25 TIP, granted points to projects that reduced vehicle congestion and delay for transit vehicles. In October 2020, the MPO adopted an updated set of project selection criteria that
The MPO’s Community Connections investment program, which funds first- and last-mile solutions, community transportation, and other related projects, has its own set of evaluation criteria. These criteria focus on connectivity to transit and key destinations and supporting shifts in travel to non-SOV modes. Details about the MPO’s current TIP criteria, including Community Connections Program criteria, are available in Appendix A, while information about the MPO’s previous criteria is available in the FFYs 2021–25 TIP document.
By electing to support the Commonwealth’s targets for federally required reliability measures and agreeing to the Boston MA-NH-RI UZA targets for the federally required annual hours of PHED per capita and non-SOV travel measures, the MPO agrees to plan and program projects so that they contribute to achieving those targets. It can be challenging to anticipate how transportation projects may affect these performance measures, as they track outcomes that are not only affected by transportation investments but also traveler choices and demand, among other factors. The MPO developed estimates for MPO staff-identified project-related metrics to see how its Regional Target roadway projects could improve the transportation system in ways that contribute to more reliable, less congested travel on the NHS or that encourage more non-SOV travel:
Table 4-25 summarizes these estimates for Regional Target corridor, intersection, bicycle and pedestrian, and Community Connections projects. MPO staff developed estimated values for these metrics using available data from functional design reports and other materials provided by project proponents; results from the MPO’s TIP evaluations; 2019 NPMRDS data available in the RITIS platform; and other sources. These estimates aggregate changes in vehicle hours of delay using project-level information on vehicle volumes and changes in delay times at intersections from project improvements.
Table 4-25
Regional Target Projects: Capacity Management and Mobility Performance Metrics
Metric |
Value |
Projects that overlap unreliable NHS segments and that will improve roadway signalization or geometry1 |
13 projects |
Projects that overlap any NHS segments and that will improve roadway signalization or geometry1 |
16 projects |
Net reduction in vehicle hours of delay per day2 |
9,700 hours reduced per day |
Net reduction in vehicle hours of delay per day for projects that overlap the NHS2 |
,7,700 hours reduced per day |
Miles of new sidewalks added |
16 miles |
Lane miles of new bicycle accommodations and shared-use paths |
52 lane miles |
Number of new shuttle services |
2 shuttle services |
Number of new bikeshare stations |
15 stations |
Projects that improve intermodal connections or access to transit |
31 projects |
Note: The group of projects reflected in this table does not include the Green Line Extension. No projects have been selected for the MPO’s Transit Modernization Program.
1 The MPO staff identified reliable and unreliable segments on the NHS using the 2019 NPMRDS data in the RITIS platform and federal travel time reliability performance thresholds.
2 This aggregate estimate for reduced hours of vehicle delay per day also excludes Project 606226–Reconstruction of Rutherford Avenue in Boston, which was included in the air quality modeling results in Destination 2040. This aggregate estimate is based on projected future conditions for project locations and has been rounded to the nearest hundred.
MPO = metropolitan planning organization. NHS = National Highway System. NPMRDS = National Performance Management Research Data Set.
Source: The Boston Region MPO staff.
Other Regional Target investments not reflected in the measures shown in Table 4-25 will also support the availability of non-SOV options. By contributing to the Green Line Extension project, the MPO supports the expansion of light-rail service to more areas within the Boston region. Funding is also available for the MPO’s new Transit Modernization Program beginning in FFY 2025. These projects have not yet been selected but could enhance transit service and encourage people to take transit instead of traveling alone in their cars, which may in turn make roadways less congested and more reliable.
MassDOT, MBTA, and RTA projects, which are described in Chapter 3, also address capacity management and mobility in the Boston region and may also support improvements on federally required reliability, congestion, and non-SOV travel performance measures. In particular, MassDOT’s Bicycle and Pedestrian projects expand the region’s bicycle and pedestrian networks, which support non-SOV travel and support the High Comfort Bike network described in the Bicycle Transportation Plan. MassDOT’s Intersection Improvement Program includes four intersection and signal projects, which may address delay and congestion. One of its Roadway Reconstruction projects addresses a freight bottleneck identified in the MassDOT’s Freight Plan, the Interstate 90/Interstate 495 interchange in Hopkinton and Westborough, which will likely improve truck travel time reliability. Meanwhile, MBTA and RTA investments enhance the region’s transit systems and make them attractive alternatives to SOV travel, which may in turn help reduce congestion and improve reliability.
The MPO will continue to work with MassDOT, the MBTA, the region’s RTAs, other transit service providers, and other stakeholders in the region to improve capacity management and mobility performance. These activities may include the following:
The MPO aims to support clean air and sustainable communities in the Boston region by creating an environmentally friendly transportation system. It pursues this goal by investing in projects that reduce greenhouse gases (GHGs) and other pollutants generated by the transportation sector and minimizing negative environmental impacts from the system.
The MPO recognizes that GHG emissions contribute to climate change. If climate change trends continue as projected, the conditions in the Boston region will include a rise in sea level coupled with storm-induced flooding, and warmer temperatures that would affect the region’s infrastructure, economy, human health, and natural resources. The Commonwealth of Massachusetts is responding to this challenge by taking action to reduce the GHGs produced in the state, including those generated by the transportation sector. To that end, Massachusetts passed its Global Warming Solutions Act (GWSA), which requires reductions of GHGs by 2020, and further reductions by 2050, relative to 1990 baseline conditions. To meet GWSA requirements, the MPO works with MassDOT and other stakeholders to anticipate the GHG impacts of projects included in the TIP, specifically by examining additions or reductions in carbon dioxide (CO2). More details on the MPO’s GHG tracking and evaluation processes are included in Appendix B.
Transportation projects may also help reduce other air pollutants and precursors and support reductions in CO2, volatile organic compounds (VOCs), nitrogen oxides (NOx) and carbon monoxide (CO) by improving traffic flow and bicycle and pedestrian travel. The Boston Region MPO contains a maintenance area for CO in Waltham and also is required to track VOCs and NOx to meet EPA requirements. (More detailed information about the MPO’s air quality status and related requirements is available in Chapter 5).
The MPO tracks the air quality benefits of transportation projects to identify projects that may be eligible for CMAQ funds. It describes these CMAQ-funded projects in its CMAQ Performance Plans and progress reports; these documents include performance targets for the annual PHED per capita and share of non-SOV travel measures described in the previous section, along with targets for the amount of applicable emissions the MPO expects will be reduced because of CMAQ-funded projects in the region. The MPO must note how it expects its CMAQ-funded projects to support improvements in these performance measures, which reinforces the connection between planning, investments, and expected performance outcomes.
The federally required CMAQ emissions reduction measure, identified in Table 4-3, is the total emissions reduction for applicable pollutants and precursors for CMAQ-funded projects in designated nonattainment and maintenance areas. FHWA requires states and MPOs subject to these CMAQ performance management requirements to establish a baseline for this measure by identifying emissions reductions associated with any CMAQ-funded projects programmed in air quality nonattainment or maintenance areas between FFY 2014 and FFY 2017. These states and MPOs were also required to set two-year and four-year targets for the emissions reductions expected from CMAQ-funded projects programmed in nonattainment or maintenance areas.
In the Boston Region MPO’s case, this CMAQ emissions performance measure would capture the anticipated CO emissions reductions from any CMAQ-funded projects that the MPO has programmed specifically in the carbon monoxide maintenance area in Waltham.4-44 Table 4-26 shows the Boston Region MPO’s baseline and target values for this measure. Neither the MPO nor MassDOT programmed any CMAQ-funded projects in Waltham during FFYs 2014 to 2017, and at the time of target setting the MPO’s TIP did not reflect any CMAQ-funded projects programmed in Waltham from FFYs 2018 to 2021. The FFYs 2022–26 TIP does not include any CMAQ-funded projects in Waltham.
Table 4-26
Baseline Value and Targets for Emissions Reduction from CMAQ Projects in the Boston Region
Performance Measure |
FFYs 2014–17 Measure Value (Baseline) |
Two-Year Target |
Four-Year Target |
Daily kilograms of carbon monoxide emissions reduction from CMAQ projects in Boston region nonattainment or maintenance areas |
0 |
0 |
0 |
CMAQ = Congestion Mitigation and Air Quality Improvement. FFY = federal fiscal year. MPO = metropolitan planning organization.
Source: Boston Region MPO staff.
The MPO uses evaluation criteria to assess the projected transportation-related emissions from each project that is a candidate for Regional Target funding, both for CO2 and other air quality pollutants and precursors, among other environmental considerations. Transportation projects can support reductions in CO2, VOCs, NOx, and CO by improving traffic flow and providing alternatives to SOV travel, including bicycle, walking, and transit options.
Table 4-27 displays the CO2 and other emissions reductions the MPO expects from projects it has programmed using its Regional Target funds. MPO staff estimates emissions associated with projects using MassDOT’s air quality analysis worksheets for each project type and the EPA’s MOtor Vehicle Emission Simulator (MOVES) emission factors.
Table 4-27
Regional Target Projects: Clean Air and Sustainable Communities Performance Metrics
Metric |
Value |
Annual kilograms of CO2 reduced |
9,380,000 kilograms |
Annual kilograms of other emissions (VOCs, NOx, and CO) reduced |
19,600 kilograms |
Note: The group of projects reflected in this table does not include the Green Line Extension. No projects have been selected for the MPO’s Transit Modernization Program. These aggregate estimates Project 606226–Reconstruction of Rutherford Avenue in Boston, which was included in the air quality modeling results in Destination 2040. These aggregate estimates are based on projected future conditions for project locations and have been rounded to the nearest hundred.
CO = carbon monoxide. CO2 = carbon dioxide. MPO = metropolitan planning organization. NOx = nitrogen oxide. VOC = volatile organic compounds.
Source: Boston Region MPO staff.
While not reflected in Table 4-27, the Green Line Extension will provide a non-SOV travel alternative, which can help reduce CO2 and other transportation related emissions. This TIP also includes funding for the MPO’s Transit Modernization Program beginning in FFY 2025. While projects have not been selected for this program yet, in general, modern transit assets may help reduce emissions by encouraging non-SOV travel or by changing the amount or type of energy these assets use.
MassDOT, MBTA, and RTA projects and programs also support improvements to air quality and the environment. Appendix B provides more detailed information and assessments of the GHG impacts of MassDOT, MBTA, CATA, and MWRTA projects and programs. MassDOT sets separate CMAQ emissions reduction performance targets and tracks the relationship between its projects and those targets.
The GWSA and FHWA’s CMAQ performance management requirements create frameworks that reinforce coordination between the MPO, MassDOT, and the region’s transit providers as they make investments to support clean air and sustainable communities. Future performance activities in this area may include the following:
The MPO seeks to ensure that the Boston region’s transportation network provides a strong foundation for economic vitality. Transportation investments can support economic vitality in a variety of ways, such as by supporting freight movement, improving connections to key freight and economic development sites, and supporting compact development. The MPO’s approach to addressing freight needs is guided in large part by MassDOT’s Freight Plan, which identifies key freight facilities and needs, strategies to improve freight movement, and priority projects.
The Metropolitan Area Planning Council’s (MAPC) regional land use plan also identifies economic vitality goals and strategies that influence MPO investments. For example, a strategy in MAPC’s current regional land use plan, MetroFuture, is to coordinate transportation investments to guide economic growth in the region.4-45 MAPC worked with its state-level partners at the Executive Office of Housing and Economic Development (EOHED) and the Executive Office of Energy and Environmental Affairs (EOEEA), as well as municipalities, to identify locations throughout the region appropriate for building housing stock and siting employers. These agencies identified the infrastructure improvements required to support the outcomes planned for these local, regional, and state-level priority development areas, and this work helps MAPC, the MPO, and state agencies to respond with their investments and technical assistance.
States and MPOs track the federally required truck travel time reliability measure for the Interstate Highway System, listed in Table 4-3, by using the Truck Travel Time Reliability Index. This measure has the most direct implications for the MPO’s capacity management and mobility goal area; however, this measure is also relevant to the Boston region’s economic vitality. For more details about this measure and associated targets, see the Capacity Management and Mobility Performance section of this chapter. The MPO has not yet established other performance measures specific to freight or economic vitality, such as measures that could be used to track the coordination of land use development and transportation investments.
When evaluating TIP projects using its TIP criteria, the MPO assesses how well each project may advance MetroFuture’s land use planning objectives. This evaluation accounts for how a project serves areas identified for economic development by state, regional, and local planning as well as areas with a relatively high density of existing development. These assessments are based on MAPC-provided information on targeted development sites and project relationships to areas of concentrated development, along with project data from functional design reports and other sources.
Table 4-28 provides some highlights of how Regional Target-funded projects in this TIP address economic vitality.
Table 4-28
Regional Target Projects: Economic Vitality Performance Metrics
Metric |
Value |
Projects that improve access to |
22 projects |
Projects that provide multimodal access to an activity center |
32 projects |
Note: The group of projects reflected in this table does not include the Green Line Extension or Project 606476–Sumner Tunnel Improvements in Boston. No projects have been selected for the MPO’s Transit Modernization program.
MPO = metropolitan planning organization.
Source: Boston Region MPO staff.
MAPC’s regional land use plan and economic vitality initiatives, USDOT’s freight directives, and MassDOT’s freight planning will all influence strategies that the MPO uses to monitor economic vitality performance going forward. The MPO’s ongoing freight planning work will also play an important role in this process. Future activities may include the following:
Figure 4-7 highlights some of the ways that the MPO’s FFYs 2022–26 Regional Target-funded projects support improved performance in the MPO’s various goal areas.
Figure 4-7
FFYs 2022–26 TIP Target Program: Projects by the Numbers
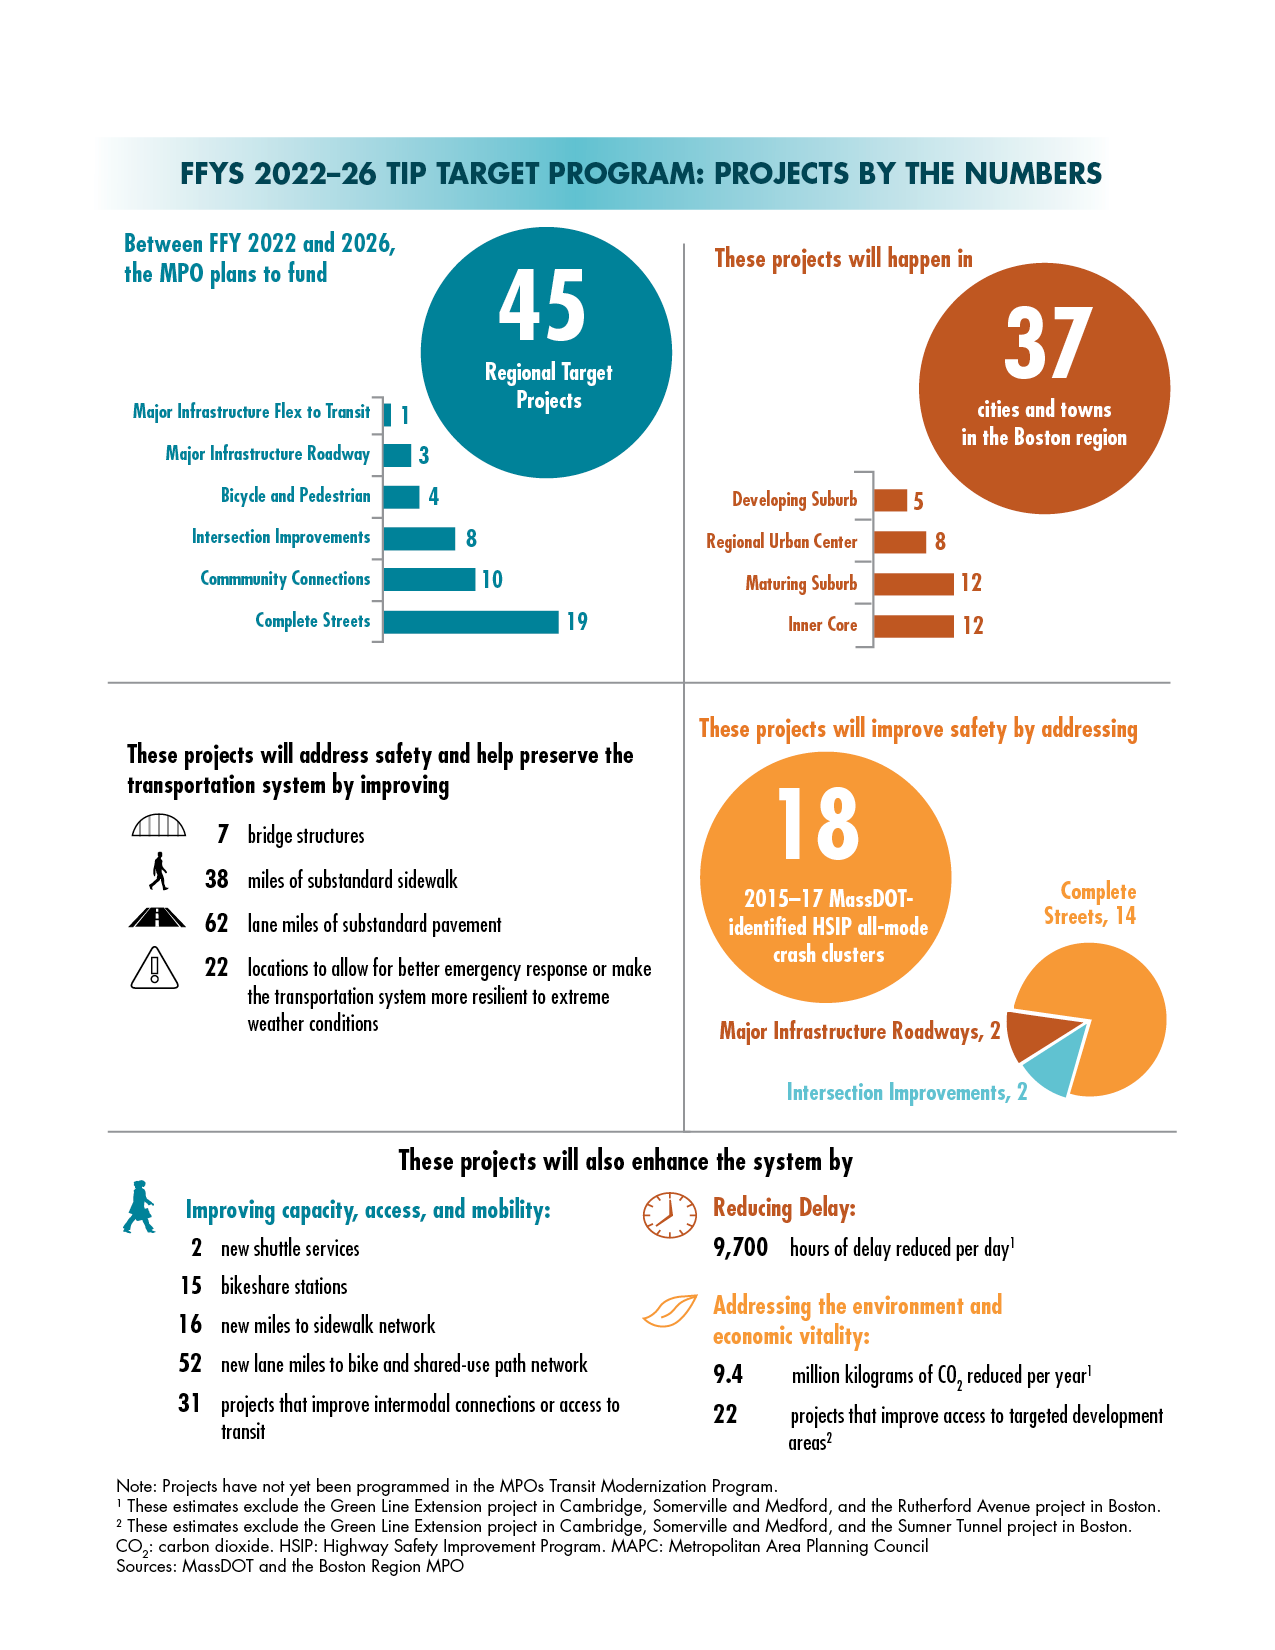
The three key phases in the MPO’s PBPP process—planning, investing, and monitoring and evaluating—were discussed earlier in this chapter. Within this framework, the MPO’s TIP relates primarily to the first two phases, focusing on the relationship between the goals and objectives and performance requirements in the MPO’s planning framework and ways the MPO will invest its capital dollars in upcoming federal fiscal years. Other MPO activities relate more directly to the monitoring and evaluation phase of PBPP:
The Commonwealth and the region’s transit agencies also have reporting and evaluation responsibilities. MassDOT and the Commonwealth’s Executive Office of Public Safety and Security report roadway safety target information annually to FHWA and NHTSA. MassDOT reports other statewide performance targets and related information to FHWA on a biennial basis via FHWA’s Performance Management Form. The MBTA, MWRTA, and CATA must report their asset inventory and condition data to the NTD and provide information about the progress that has been made with respect to performance measures and targets as compared to previous reports. These transit agencies also regularly report data about safety outcomes to the NTD, and their annual reviews of their PTASPs and safety targets also create opportunities for them to evaluate their performance.
Going forward, the MPO will put the results of these reports and evaluations to use in its future planning and investment activities. These activities may include identifying new ways to bring information about performance into the MPO’s LRTP and TIP development processes, such as by updating project selection criteria or providing information through other means. This work would help the MPO develop scenarios to explore how various transportation investments made through the LRTP would support various goals and performance areas. Over time, the MPO expects that these actions will help ensure that the MPO’s investments are helping to meet its vision and goals for the region’s transportation system.
4-1Urbanized Areas (UZAs) are defined by the US Census Bureau to represent the urban cores of metropolitan areas. The Boston Urbanized Area includes the 97 municipalities in the Boston Region MPO and includes portions of neighboring MPOs in eastern Massachusetts, New Hampshire, and Rhode Island.
4-2 Massachusetts Department of Transportation, Massachusetts Strategic Highway Safety Plan (2018), pg. I. https://www.mass.gov/files/documents/2019/01/18/ dot_SHSP_2018.pdf
4-3 The Commonwealth of Massachusetts’ 2019 Bicycle Transportation Plan is available at mass.gov/service-details/bicycle-plan, and its 2019 Pedestrian Transportation Plan is available at mass.gov/service-details/pedestrian-plan.
4-4 MBTA, CATA, and MWRTA PTASPs are available on the April 8, 2021, page of the MPO
meeting calendar. See bostonmpo.org/calendar/day/2021-04-08.
4-5 MBTA, MBTA Transit Safety Plan (June 15, 2020), pg. 14
4-6 As of April 15, 2019, states are required to define serious injuries using the definition of “Suspected Serious Injury (A),” as detailed in the Model Minimum Uniform Crash Criteria 4th Edition. The Massachusetts Department of Transportation implemented this change in its statewide crash data system as of January 1, 2019.
4-7 Boston Region MPO staff, “Federally Required Calendar Year 2021 Safety Targets” (February 4, 2021). https://www.ctps.org/data/pdf/programs/performance/CY2021-Federally-Required-Highway-Safety-Targets.pdf.
4-8 Commonwealth of Massachusetts, “Highway Safety Improvement Program,” accessed April 16, 2021. https://www.mass.gov/service-details/highway-safety-improvement-program.
4-9 For more information, see MassDOT’s 2017 Top Crash Location Report (September 2020). https://www.mass.gov/doc/2017-top-crash-locations-report/download.
4-10 For more information about the definitions of these performance measures—including deaths, injuries, or events that may be excluded from totals—see Boston Region MPO staff,
“Transit Safety Performance Requirements and Targets” (April 8, 2021). https://www.ctps.org/data/calendar/pdfs/2021/MPO_0408_Memo_Transit_Safety_Performance_Targets.pdf.
4-11 MBTA Transit Safety Plan, pg. 34.
4-12 MBTA Transit Safety Plan, pg. 34.
4-13 MBTA Transit Safety Plan, pg. 36.
4-14 MBTA Transit Safety Plan, pg. 36.
4-15 Massachusetts Department of Transportation, Tracker 2020, accessed March 29, 2021. https://www.massdottracker.com/wp/?p=4488.
4-16 The NTD Safety and Security Time series data shown in these tables is current as of November 2020 and were published on March 4, 2021. For more information, see NTD, “Safety and Security Time Series Data” at transit.dot.gov/ntd/data-product/safety-security-time-series-data and NTD, “Safety and Security Major-Only Time Series Data” at transit.dot.gov/ntd/data-product/safety-security-major-only-time-series-data. For the 2018 and 2019 Annual Vehicle Maintenance files, see https://www.transit.dot.gov/ntd/data-product/2018-annual-database-vehicle-maintenance and https://www.transit.dot.gov/ntd/data-product/2019-annual-database-vehicle-maintenance.
4-17 Federal Transit Administration, “Nexus of Transit Asset Management and Safety Management Systems,” accessed on April 16, 2021. https://www.transit.dot.gov/sites/fta.dot.gov/files/docs/regulations-and-guidance/safety/public-transportation-agency-safety-program/117291/nexus-transit-asset-management-and-safety-management-systems.pdf.
4-18 See MassDOT’s Transportation Asset Management Plan (September 2019). https://www.mass.gov/doc/2019-transportation-asset-management-plan/download.
4-19 The MBTA’s, CATA’s, and MWRTA’s 2018 TAM Plans are available on the March 21, 2019, page of the MPO meeting calendar (https://www.ctps.org/calendar/day/2019-03-21).
4-20 Federal guidelines for bridge performance monitoring define bridges using National Bridge Inspection standards, which define a bridge as a structure with a span length of over 20 feet.
4-21 Massachusetts Department of Transportation, Transportation Asset Management Plan (2019), pg. 8, accessed April 17, 2021. https://www.mass.gov/doc/2019-transportation-asset-management-plan/download.
4-22 National Bridge Inventory data is used to rate these components on a scale of zero (worst) to nine (best). The FHWA has classified these bridge ratings into good (seven, eight, or nine on the scale), fair (five or six), or poor (four or less).
4-23 Culverts are assigned an overall condition rating.
4-24 Massachusetts Department of Transportation, Transportation Asset Management Plan (2019), pg. 18, accessed April 17, 2021. https://www.mass.gov/doc/2019-transportation-asset-management-plan/download.
4-25 Massachusetts Department of Transportation, 2018 Massachusetts Roadway Inventory Year End Report (January 2019), pg. 55-70, accessed April 17, 2021. www.mass.gov/doc/2018-road-inventory-year-end-report/download.
4-26 MassDOT continues to measure pavement quality and to set statewide short-term and long-term targets in the MassDOT Performance Management Tracker using the Pavement Serviceability Index (PSI), which is a different index than IRI.
4-27 Under the TIP project selection criteria used before October 2020, staff awarded points to projects that were expected to improve a facility’s ability to function in instances of flooding; protected a facility from sea level rise; strengthened infrastructure against seismic activity; addressed critical transportation infrastructure; protected freight network elements; or implemented hazard mitigation or climate adaptation plans. Staff also awarded points to projects that were expected to improve evacuation or diversion routes or to improve access routes to or near emergency support locations.
4-28 Unless otherwise specified, performance metrics estimated for these projects are based on the criteria used in development of the FFYs 2021–25 TIP. More information about these criteria is included in Appendix A of the FFYs 2021–25 TIP document, which is available at bostonmpo.org/tip.
4-29 Federal Transit Administration, “Performance Management” (January 8, 2020). www.transit.dot.gov/PerformanceManagement.
4-30 Federal Transit Administration, “Default Useful Life Benchmark Cheat Sheet” (October 26, 2016). www.transit.dot.gov/TAM/ULBcheatsheet.
4-31 Massachusetts Department of Transportation, MassDOT Fully Accessible Vehicle Guide: An Overview of Accessible Vehicle Specifications (May 2020), accessed January 9, 2021. https://www.mass.gov/doc/massdot-fully-accessible-vehicle-guide/download.
4-32 Federal Transit Administration, FTA C 5010.E “Award Management Requirements” (July 16, 2018), accessed January 9, 2021. https://www.transit.dot.gov/regulations-and-guidance/fta-circulars/awardmanagement-requirements-circular-50101e.
4-33 The MPO’s CMAQ Performance Plans and progress reports are available at bostonmpo.org/performance.
4-34 The 2017 Massachusetts Freight Plan is available at www.mass.gov/doc/2017-massachusetts-freight-plan/download. MassDOT’s 2019 Congestion in the Commonwealth report and accompanying studies are available at www.mass.gov/service-details/congestion-in-the-commonwealth
4-35 The MBTA’s Focus40 plan is available at https://www.mbtafocus40.com/.
4-36 States and MPOs must calculate LOTTR values for four time periods: weekdays from 6:00 AM to 10:00 AM, weekdays from 10:00 AM to 4:00 PM, weekdays from 4:00 PM to 8:00 PM, and weekend days from 6:00 AM to 8:00 PM.
4-37 FHWA, “Frequently Asked Questions: Target Setting,” accessed April 26, 2021. https://www.fhwa.dot.gov/tpm/faq.cfm#targ.
4-38 States and MPOs must calculate TTTR Index Values for five time periods: weekdays from 6:00 AM to 10:00 AM, weekdays from 10:00 AM to 4:00 PM, weekdays from 4:00 PM to 8:00 PM, weekend days from 6:00 AM to 8:00 PM, and all days from 8:00 PM to 6:00 AM.
4-39 A precursor is a chemical compound that reacts with other chemical compounds in the presence of solar radiation to form pollutants.
4-40 FHWA requires state DOTs and MPOs to use 60 percent of the posted speed limit for the segment or 20 miles per hour, whichever is greater.
4-41 FHWA requires states and MPOs to use the period from 6:00 AM to 10:00 AM to represent the morning peak period, but it allows these agencies to choose either 3:00 PM to 7:00 PM or 4:00 PM to 8:00 PM to represent the evening peak period. MassDOT and NH DOT selected the period from 3:00 PM to 7:00 PM to represent the evening peak period for the Boston MA-NH-RI UZA.
4-42 Rhode Island was not included in the calculation of this measure because it does not include any portion of the Boston MA-NH-RI UZA’s NHS network. See FHWA’s Applicability Determination: CMAQ Traffic Congestion and CMAQ On-Road Mobile Source Emissions Measures (23 CFR 490.707 and 490.807), and Change Log: Applicability Determination for CMAQ Measures,” May 22, 2018.
4-43 Boston Region MPO staff, “Boston Region MPO Baseline CMAQ Performance Plan (2018)” (October 1, 2018). https://www.ctps.org/data/pdf/programs/performance/2018-PBPP-Boston-MPO-CMAQ-Performance-Plan.pdf.
4-44 FHWA regularly assesses the CMAQ performance management requirements that apply to states and MPOs. FHWA conducted its most recent assessment in 2019, at which time the MPO was only subject to emissions performance management requirements for its carbon monoxide maintenance area in Waltham.
4-45 For more information about MetroFuture, visit www.mapc.org/get-involved/metrofuture-our-regional-plan/. MAPC is currently working on an update to this plan, MetroCommon 2050.
This chapter documents the latest Transportation Improvement Program (TIP) air quality conformity determination for the 1997 Ozone National Ambient Air Quality Standards (NAAQS) and carbon monoxide (CO) NAAQS in the Boston Region Metropolitan Planning Organization (MPO) area. It covers the applicable conformity requirements according to the latest regulations, regional designation status, legal considerations, and federal guidance.
The 1990 Clean Air Act Amendments (CAAA) require MPOs within nonattainment and maintenance areas to perform air quality conformity determinations prior to the approval of Long-Range Transportation Plans (LRTPs) and TIPs, and at such other times as required by regulation. CAAA Section 176(c) (Title 42, United States Code [USC], Section 7506 [c]) requires that federally funded or approved highway and transit activities are consistent with (“conform to”) the purpose of the State Implementation Plan (SIP). Conformity to the purpose of the SIP means that Federal Highway Administration (FHWA) and Federal Transit Administration (FTA) funding and approvals are given to highway and transit activities that
The United States Environmental Protection Agency’s (EPA) transportation conformity rules establish the criteria and procedures for determining whether metropolitan transportation plans, TIPs, and federally supported highway and transit projects conform to the SIP (Title 40, Code of Federal Regulations [CFR], Parts 51.390 and 93).
A nonattainment area is one that the EPA has designated as not meeting certain air quality standards. A maintenance area is a nonattainment area that now meets the standards and has been redesignated as maintaining the standard. A conformity determination is a demonstration that plans, programs, and projects are consistent with the SIP for attaining the air quality standards. The CAAA requirement to perform a conformity determination ensures that federal approval and funding go to transportation activities that are consistent with air quality goals.
The Commonwealth of Massachusetts was previously classified as a nonattainment area for ozone and was divided into two nonattainment areas. The Eastern Massachusetts ozone nonattainment area included Barnstable, Bristol, Dukes, Essex, Middlesex, Nantucket, Norfolk, Plymouth, Suffolk, and Worcester counties. The Western Massachusetts ozone nonattainment area included Berkshire, Franklin, Hampden, and Hampshire counties. With these classifications, the 1990 CAAA required the Commonwealth to reduce its emissions of volatile organic compounds (VOCs) and nitrogen oxides (NOx), the two major precursors to ozone formation, to achieve attainment of the ozone standard.
The 1970 Clean Air Act defined a one-hour NAAQS for ground-level ozone. The 1990 CAAA further classified degrees of nonattainment of the one-hour standard based on the severity of the monitored levels of the pollutant. The Commonwealth of Massachusetts was classified as being in serious nonattainment of the one-hour ozone standard and was required to achieve attainment by 1999. The attainment date was later extended, first to 2003 and a second time to 2007.
In 1997, the EPA proposed a new eight-hour ozone standard that replaced the one-hour standard, effective June 15, 2005. Scientific research had shown that ozone could affect human health at lower levels and over longer exposure times than one hour. The new standard was challenged in court and, after a lengthy legal battle, the courts upheld it. The new standard was finalized in June 2004. The new eight-hour standard is 0.08 parts per million (ppm) averaged over eight hours, and this level is not to be exceeded more than once per year. With this new standard, nonattainment areas were again further classified based on the severity of the eight-hour values. Massachusetts was classified as being in moderate nonattainment for the eight-hour standard and again was separated into two nonattainment areas—Eastern Massachusetts and Western Massachusetts.
In March 2008, the EPA published revisions to the eight-hour ozone NAAQS, establishing a level of 0.075 ppm (Volume 73, Federal Register [FR], page 16438; March 27, 2008). In 2009, EPA announced it would reconsider this standard because it fell outside of the range recommended by the Clean Air Scientific Advisory Committee. However, EPA did not take final action on the reconsideration, keeping the standard as 0.075 ppm.
After reviewing data from Massachusetts monitoring stations, EPA sent a letter on December 16, 2011, proposing that only Dukes County be designated as nonattainment for the new proposed 0.075 ppm ozone standard. The Commonwealth of Massachusetts concurred with these findings.
On May 21, 2012, the final rule (77 FR 30088) was published in the Federal Register. This rule defined the 2008 NAAQS as 0.075 ppm, the standard that was promulgated in March 2008. A second rule (77 FR 30160) published on May 21, 2012, revoked the 1997 ozone NAAQS effective one year after the July 20, 2012, effective date of the 2008 NAAQS.
Also, on May 21, 2012, the Federal Register published the air quality designation areas for the 2008 NAAQS. Dukes County was the only area in Massachusetts designated as a nonattainment area. All other Massachusetts counties were designated as attainment/unclassified for the 2008 standard.
On March 6, 2015, EPA published the final rulemaking, “Implementation of the 2008 National Ambient Air Quality Standards (NAAQS) for Ozone: State Implementation Plan Requirements; Final Rule” (80 FR 12264), effective April 6, 2015. This rulemaking confirmed the removal of transportation conformity to the 1997 ozone NAAQS and the replacement with the 2008 ozone NAAQS, which actually set a stricter level of allowable ozone concentration than the 1997 standards and classified Massachusetts (except for Dukes County) as attainment/unclassifiable.
However, on February 16, 2018, the United States Court of Appeals for the District of Columbia Circuit in South Coast Air Quality Mgmt. District v. EPA (“South Coast II,” 882 F.3d 1138) held that transportation conformity determinations must be made in areas that were designated either as nonattainment or maintenance areas for the 1997 ozone NAAQS and attainment for the 2008 ozone NAAQS when the 1997 ozone NAAQS was revoked.
On November 29, 2018, EPA issued Transportation Conformity Guidance for the South Coast II Court Decision (EPA-420-B-18-050, November 2018), which addressed how transportation conformity determinations could be made in these areas. According to the guidance, both Eastern and Western Massachusetts, along with several other areas across the country, were defined as orphan nonattainment areas—areas that were designated as nonattainment areas for the 1997 ozone NAAQS at the time of its revocation (80 FR 12264, March 6, 2015) and as attainment areas for the 2008 ozone NAAQS in EPA’s original designation rule for this NAAQS (77 FR 30160, May 21, 2012). As of February 16, 2019, conformity determinations are required in these areas.
After February 16, 2019, as a result of the court ruling and the subsequent federal guidance, transportation conformity for the 1997 NAAQS—intended as an anti-backsliding measure—now applies to both Massachusetts orphan areas. Therefore, a conformity determination was made for the 1997 ozone NAAQS in all of the Massachusetts MPOs’ FFYs 2020–40 LRTPs. This conformity determination was finalized in July 2019 following all of the MPOs’ endorsements of their LRTPs, and approved by the Massachusetts Divisions of FHWA and FTA on October 15, 2019. This conformity determination continues to be valid for the Boston Region MPO’s FFYs 2022–26 TIP, and Massachusetts’ FFYs 2022–26 State Transportation Improvement Program, as each is developed from the conforming 2020–40 Long Range Transportation Plans.
The transportation conformity regulation in 40 CFR § 93.109 sets forth the criteria and procedures for determining conformity. The conformity criteria for TIPs and LRTPs include a demonstration of fiscal constraint (§ 93.108), a basis on the latest planning assumptions (§ 93.110), use of the latest emissions model (§ 93.111), consultation (§ 93.112), provision for the timely implementation of transportation control measures (TCMs) (§ 93.113[b] and [c]), and consistency with an emissions budget and/or interim emissions tests (§ 93.118 and/or § 93.119).
For the 1997 ozone NAAQS areas, transportation conformity for TIPs and LRTPs for the 1997 ozone NAAQS can be demonstrated without a regional emissions analysis, per 40 CFR § 93.109(c). This provision states that the regional emissions analysis requirement applies one year after the effective date of EPA’s nonattainment designation for a NAAQS and until the effective date of revocation of such NAAQS for an area. The 1997 ozone NAAQS revocation was effective on April 6, 2015, and the court for South Coast II upheld the revocation. As no regional emission analysis is required for this conformity determination, there is no requirement to use the latest emissions model, budget, or interim emissions tests.
Therefore, transportation conformity for the 1997 ozone NAAQS for the Boston Region MPO’s FFYs 2022–26 TIP can be demonstrated by showing that the remaining requirements in 40 CFR § 93.109 have been met. The following requirements regarding the use of the latest planning assumptions, consultation, timely implementation of TCMs, and fiscal constraint are defined in Section 2.4 of that guidance and are addressed in the following sections.
The requirement to use the latest planning assumptions in 40 CFR § 93.110 generally applies to regional emissions analyses. In the areas subject to the 1997 ozone NAAQS, the use of latest planning assumptions requirement applies to assumptions about TCMs in an approved SIP. (See the section titled Timely Implementation of Transportation Control Measures below).
The consultation requirements in 40 CFR § 93.112 for interagency consultation and public consultation were addressed. Interagency consultation was conducted with FHWA, FTA, EPA Region 1, the Massachusetts Department of Environmental Protection (DEP), and the other Massachusetts MPOs on March 6, 2019, to discuss the latest conformity-related court rulings and resulting federal guidance. Regular and recurring interagency consultations have been held on (at least) an annual schedule, with the most recent conformity consultation held on January 21, 2021. Ongoing consultation is conducted in accordance with the following items:
Public consultation was conducted consistent with planning rule requirements in 23 CFR § 450. Title 23 CFR § 450.324 and 310 CMR 60.03(6)(h) requires that the development of the TIP, LRTP, and related certification documents provide an adequate opportunity for public review and comment. Section 450.316(b) also establishes the outline for MPO public participation programs. The Boston Region MPO's Public Participation Plan was formally adopted in October 2014 and amended in April 2019 and is available at https://www.ctps.org/public_involvement. The Public Participation Plan ensures that the public will have access to the TIP and LRTP and all supporting documentation, provides for public notification of the availability of the TIP and LRTP and the public's right to review the document and comment thereon, and provides a 21-day public review and comment period prior to the adoption of the TIP and LRTP and related certification documents.
The public comment period for this conformity determination commenced on May 10, 2021. During the 21-day public comment period, any comments received will be incorporated into this TIP. This process will allow sufficient opportunity for public comment and for the MPO board to review the draft document. The public comment period will close on May 31, 2021, and the Boston Region MPO is expected to endorse this air quality conformity determination on June 3, 2021. These procedures comply with the associated federal requirements.
TCMs were submitted to EPA as SIP revisions in 1979 and 1982, and as part of the Central Artery/Tunnel (CA/T) project. The TCMs in the 1979 and 1982 submissions were accomplished through construction of ongoing projects or implementation of ongoing programs.
The TCMs submitted as part of the mitigation for the CA/T project have been documented in the LRTP as recommended or completed projects, except for the Fairmount Line Improvement Project and the Green Line Extension.
MassDOT works with the DEP to implement TCMs documented in the SIP. The Boston Region MPO will continue to include relevant projects in the LRTP and TIP, including those projects implemented to provide equal or better emissions outcomes when the primary TCMs do not meet deadlines, until the process for completing all active TCMs has concluded. When the process has been completed, the MPO will amend the LRTP and future TIPs and their conformity determinations to document any changes (including any interim projects or programs).
The status of the TCMs has been updated in the SIP Transit Commitments Status Report, which MassDOT submitted to DEP in June 2020. Highlights from the report are presented below. For a detailed description of the status of these projects, please visit the MassDOT website at https://www.mass.gov/doc/state-implementation-plan-transit-commitments-2020-status-report/download report/download.
The Four Corners and Newmarket Stations on the Fairmount commuter rail line opened for service on July 1, 2013. All change orders have been paid and the project is officially closed out. The Talbot Avenue Station opened in November 2012.
The Blue Hill Avenue Station was redesigned and the 100 percent design plans were submitted to MassDOT in March 2016. The MBTA advertised the project in December 2016 and the Notice to Proceed was issued in February 2017. Construction was completed and the station opened for service in February 2019.
Given the delays in final completion of the project, MassDOT and the Massachusetts Bay Transportation Authority (MBTA) prepared a Petition to Delay and an Interim Emission Offset Plan to be implemented for the duration of the delay of the Fairmount Line Improvement Project. Both the petition and the offset plan were submitted to DEP in July 2011. MassDOT estimated the amount of emission reduction that would be expected from the implementation of the new Fairmount Line stations. With input from Fairmount Line stakeholders, MassDOT proposed offset measures that would meet emission reduction targets while the project remained under construction. The measures include providing shuttle bus service in Boston connecting Andrew Square to Boston Medical Center and increasing weekday service on MBTA bus Route 31, which serves the Boston neighborhoods of Dorchester and Mattapan. These measures were implemented on January 2, 2012. The offset measures have been removed now that the project is complete and regular service has resumed.
Funding Source: The Commonwealth
The Green Line Extension project is a 4.7-mile light rail line, which will extend the current Green Line service from a relocated Lechmere Station in East Cambridge to a terminus at College Avenue in Medford, with a spur to Union Square in Somerville. This project is moving forward with a new cost estimate of $2.289 billion. Funding is in place, including a combined $1.99 billion in federal and state funds and pledged contributions totaling approximately $296 million from the Cities of Cambridge and Somerville ($75 million), the Boston Region MPO ($157.1 million), and MassDOT ($64.3 million through Special Obligation Bonds).
In early 2017, the MBTA initiated a procurement process for a design-build entity to design and construct the project. In November 2017, approval was received to execute a design-build contract with Green Line Extension contractors. The notice to proceed under the contract was issued in December 2017. The FTA obligated an initial portion ($100 million) of the Capital Investment Grant funds for the project in December 2017, under the 2015 Full Funding Grant Agreement. Additional funds have since followed. The contract with Green Line Extension contractors is in the amount of $999.7 million.
The primary goals of the project are to improve corridor mobility, boost transit ridership, improve regional air quality, ensure equitable distribution of transit services, and support opportunities for sustainable development in Cambridge, Somerville, and Medford. In addition to the light rail service on two new branches extending from Lechmere Station to Union Square Station and College Avenue Station, the project includes the construction of a vehicle maintenance facility and a multiuse path.
By filing an Expanded Environmental Notification Form, procuring multiple design consultants, and publishing both Draft and Final Environmental Impact Reports, MassDOT met the first four interim milestones associated with the Green Line Extension project. Since those filings, MassDOT has committed substantial resources to the Green Line Extension project, a top transportation priority of the Commonwealth and the largest expansion of the MBTA rapid transit system in decades. The project then transitioned from the planning and environmental review phases to the design, engineering, and construction phases, and the tasks associated with programming federal funding began.
The timeline for overall project completion, however, has been substantially delayed. In the 2011 SIP Status Report, MassDOT reported that the Green Line Extension project would not meet the legal deadline for completion by December 31, 2014. The delay triggered the requirement to provide interim emission reduction offset projects and measures for the period of the delay (beginning January 1, 2015). Working with the Central Transportation Planning Staff, MassDOT and the MBTA calculated the value for reductions of non-methane hydrocarbons, CO, and NOx that would be equal to or greater than the reductions projected to result from the operation of the Green Line Extension during the period of the delay, as specified in the SIP regulation.
In June 2012, MassDOT released a list of potential mitigation ideas received from the public that could be used as offset measures. In the summer and fall of 2012, MassDOT elicited public comments on these potential measures. Then the MBTA created an internal working group to determine a final portfolio of interim mitigation measures to implement by December 31, 2014, the legal deadline for the implementation of the Green Line Extension.
This work resulted in a recommendation to implement the following three interim mitigation measures, which collectively would meet the emissions reduction target for the project:
The Petition to Delay was submitted to the DEP on July 22, 2014, and expanded further on the analysis and determination of the interim offset measures. In a letter dated July 16, 2015, the DEP conditionally approved MassDOT's request to delay the Green Line Extension project and the implementation of the above interim mitigation measures. Both the 2014 Petition to Delay and the July 2015 Conditional Approval are available on MassDOT's website. Interim offset measures will remain in place for as long as is necessary.
Funding Source: The Commonwealth, FTA via the Full Funding Grant Agreement, the Boston Region MPO, the City of Cambridge, and the City of Somerville
Transportation conformity requirements in 40 CFR § 93.108 state that TIPs and LRTPs must be fiscally constrained so as to be consistent with the United States Department of Transportation’s metropolitan planning regulations (23 CFR part 450). The Boston Region MPO’s FFYs 2022–26 TIP is consistent with the required fiscal constraints, as demonstrated in Chapter 3.
In addition to ozone, the requirement to perform a conformity determination for CO for several cities in the Boston region has expired. On April 1, 1996, the EPA classified the cities of Boston, Cambridge, Chelsea, Everett, Malden, Medford, Quincy, Revere, and Somerville as in attainment (in compliance) for CO emissions. Subsequently, a CO maintenance plan was set up through the Massachusetts SIP to ensure that emission levels did not increase. While the maintenance plan was in effect, past TIPs and LRTPs included an air quality conformity analysis for these communities. As of April 1, 2016, however, the 20-year maintenance period for this CO maintenance area expired and transportation conformity is no longer required for this pollutant in these communities. This ruling is documented in a letter from the EPA dated May 12, 2016.
On April 22, 2002, the City of Waltham was redesignated as being in attainment for CO emissions with an EPA-approved limited-maintenance plan. In areas that have approved limited-maintenance plans, federal actions requiring conformity determinations under the EPA’s transportation conformity rule are considered to satisfy the budget test (as budgets are not treated as being constraining in these areas for the length of the initial maintenance period). Any requirements for future project-level conformity determinations for projects located within this community will continue to use a hot-spot analysis to ensure that any new transportation projects in this area do not cause or contribute to violations of the NAAQS for CO.
In summary and based on the entire process described above, the Boston Region MPO has prepared this conformity determination for the 1997 ozone NAAQS in accordance with EPA’s and the Commonwealth of Massachusetts’ latest conformity regulations and guidance. This conformity determination process demonstrates that the FFYs 2022–26 TIP meets the Clean Air Act and Transportation Conformity Rule requirements for the 1997 ozone NAAQS, and has been prepared following all the guidelines and requirements of these rules during this period.
Therefore, the implementation of the Boston Region MPO’s FFYs 2022–26 TIP is consistent with the air quality goals of, and in conformity with, the Massachusetts SIP.
The Boston Region Metropolitan Planning Organization (MPO) monitors how the transportation projects it funds, as a group, affect the region’s most vulnerable populations and those who have been disproportionately affected by the transportation system. This monitoring helps ensure that these populations are not disproportionately burdened by or receive disproportionately fewer benefits from MPO-selected projects. This chapter provides the results of analyses conducted for monitoring projects funded with Regional Target funds, in the federal fiscal years (FFYs) 2022–26 Transportation Improvement Program (TIP).6-1
The Boston Region MPO’s transportation equity (TE) goal is to ensure that all people receive comparable benefits from, and are not disproportionately burdened by, MPO investments, regardless of race, color, national origin, age, income, ability, or sex. The MPO’s practices to achieve this goal are shaped by various federal nondiscrimination and environmental justice laws and regulations, including Title VI of the Civil Rights Act of 1964; the Americans with Disabilities Act of 1990; Executive Order 13166—Improving Access to Services for Persons with Limited English Proficiency; and the Age Discrimination Act of 1975. (More information on these mandates can be found in Appendix E.)
In response to these regulations, the MPO considers six population groups to be TE populations—populations that are covered by the above federal directives and that have been disproportionately underserved and burdened by the transportation system:6-2
The MPO systematically integrates the transportation needs and interests of TE populations into its planning processes and strives to improve their transportation outcomes. With regards to the TIP, this is done through the evaluation and selection of transportation projects, as well as analyses of the entire group of projects that are funded with Regional Target dollars.
Prior to the development of the FFYs 2022–26 TIP, MPO staff revised the criteria used to evaluate projects being considered for funding with Regional Target funds. In October 2020, the MPO approved a new set of project evaluation criteria for each of the six MPO goal areas, including the TE goal area (see Chapter 2). The criteria were developed over the course of a year through an extensive public outreach process that prioritized gathering input from TE populations. During the first round of public engagement, staff gathered input about the transportation challenges and burdens that people experience. Staff then used that information to develop preliminary criteria that addressed these burdens and challenges. Then, staff returned to the public to get feedback on whether the new criteria captured the challenges and burdens that they had previously discussed.
As a result of this process, supported by extensive discussions with the MPO board, the TE criteria were revised and expanded in several key ways:
Table 6-1 shows the criteria within the other goal areas for which projects are scored based on their impacts to TE populations, grouped by investment program.
Table 6-1
Criteria Used in Transportation Equity Scoring
| MPO Goal Area |
Bicycle Network and Pedestrian Connections Program |
Complete Streets Program |
Intersection Improvements Program |
Major Infrastructure Program |
|---|---|---|---|---|
Capacity Management and Mobility |
|
|
|
|
Clean Air and Sustainable Communities |
|
|
|
|
Safety |
|
|
|
|
System Preservation |
|
|
|
|
Note: The Community Connections Program is not included here as projects are evaluated using a separate set of criteria. The Transit Modernization Program is not included here as evaluation criteria have not yet been developed for that program.
ADA = Americans with Disabilities Act. CO = carbon monoxide. PM = particulate matter. VOC = volatile organic compounds.
As required by federal regulations, the MPO assesses the impacts of all of the Regional Target-funded projects, as a group, in each TIP on TE populations. In addition, these analyses help the MPO to better understand the extent to which investments meet the MPO’s stated TE goal and objectives. This information can inform future changes or updates to MPO work or decision-making. New to this TIP are additional data on how performance has changed during several TIP development cycles. As new tools are identified and analyses are developed, they will be added to subsequent TIPs.
Most of the MPO’s FFYs 2022–26 Regional Target funds are invested in highway projects (which includes all roadway projects and off-street paths), except for $10 million for the Community Connections Program, $11 million for the Transit Modernization Program, and $27 million allocated to the Massachusetts Bay Transportation Authority’s Green Line Extension. While the TIP has reserved Regional Target funds for the Transit Modernization Program, projects have not yet been identified and so are not included in this TIP. This is also the case for the funding allocated to the outer years of the Community Connections Program for which projects have not yet been identified. As a standard practice, the MPO reserves funds for these programs with the expectation that they will be allocated when projects are ready to be funded. Additionally, the analyses in this chapter do not include roadway projects in the region that are funded by the Massachusetts Department of Transportation or public transit projects funded by regional transit authorities.
Table 6-2 shows the total number of people in the Boston region who belong to each TE population, as well as their percentage of the Boston region’s population.
Table 6-2
Transportation Equity Populations in the Boston Region
| TE Population Group |
TE Population |
Boston Region Population |
Percentage of Total Boston Region Population |
|---|---|---|---|
Minority Population |
870,459 |
3,087,796 |
28.2% |
People with Low Incomes |
683,548 |
2,973,530 |
23.0% |
People with LEP |
308,770 |
2,915,559 |
10.6% |
People Age 75 or Older |
206,578 |
3,087,796 |
6.7% |
People Age 17 or Younger |
636,761 |
3,087,796 |
20.6% |
People with Disabilities |
306,776 |
3,056,697 |
10.0% |
LEP = limited English proficiency. TE = transportation equity.
Sources: 2010 US Census and 2010–14 American Community Survey.
Figures 6-1 to 6-6 show the percentage of each equity population throughout the Boston region. In general, the minority population, people with low incomes, and people with LEP tend to live closer to or in Boston. On the other hand, people age 75 or older, people 17 or younger, and people with disabilities are dispersed throughout the region.
Figure 6-1
Percentage of the Minority Population in the Boston Region
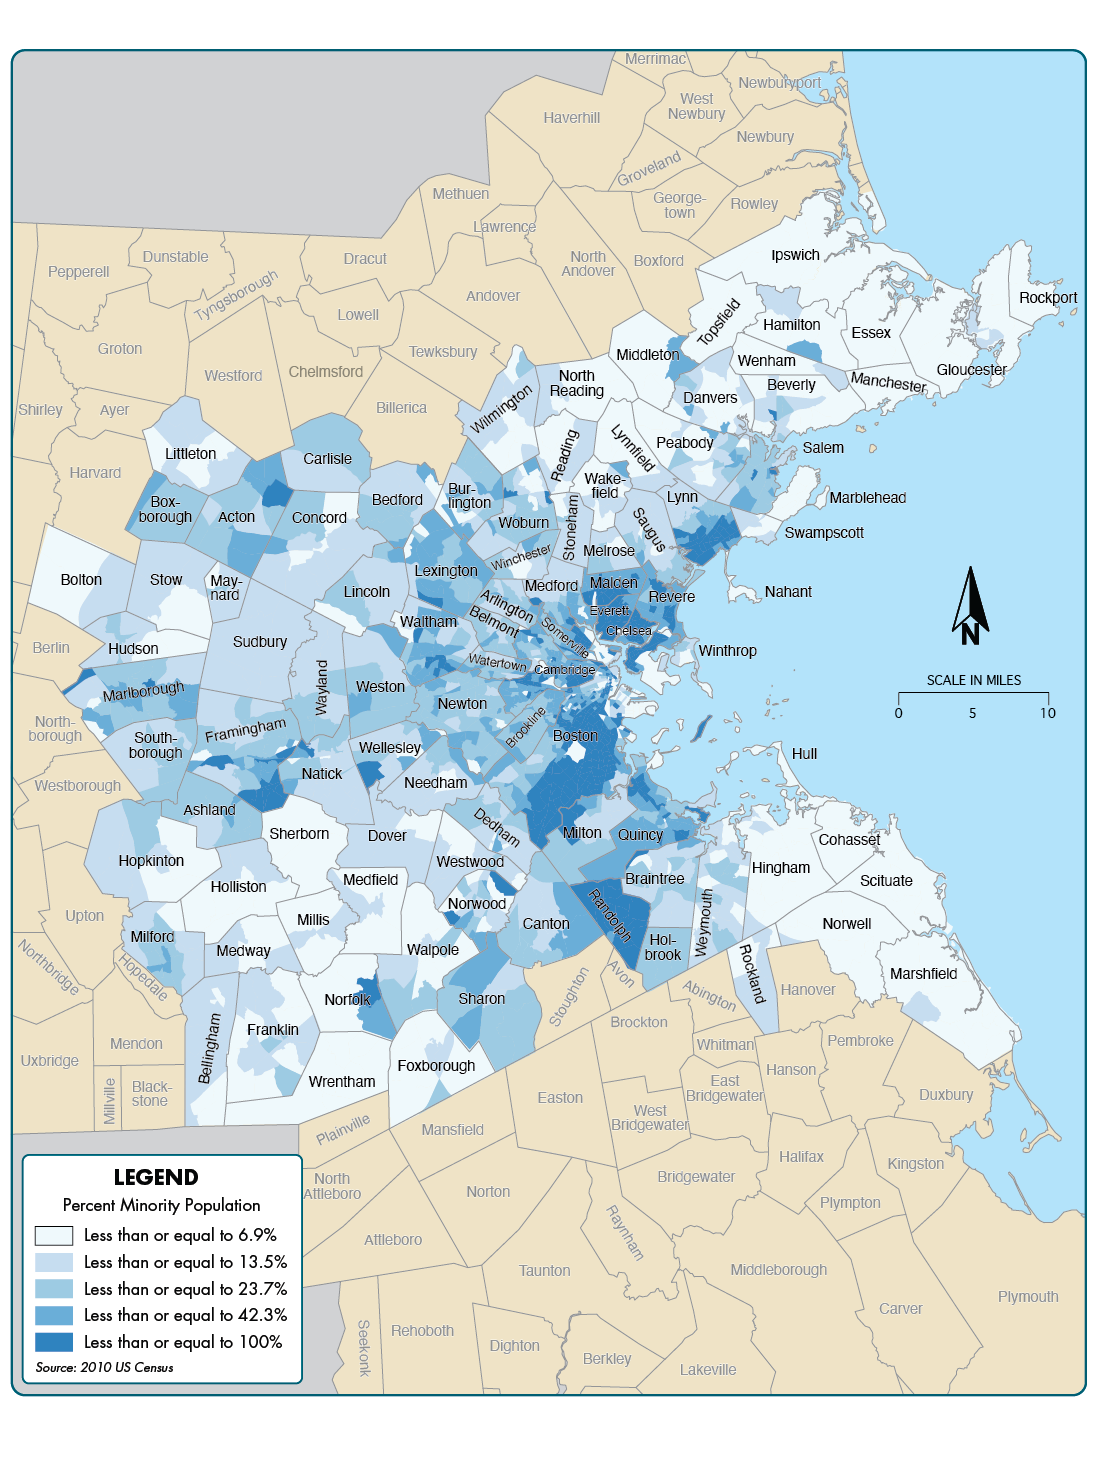
Figure 6-2
Percentage of People with Low Incomes in the Boston Region
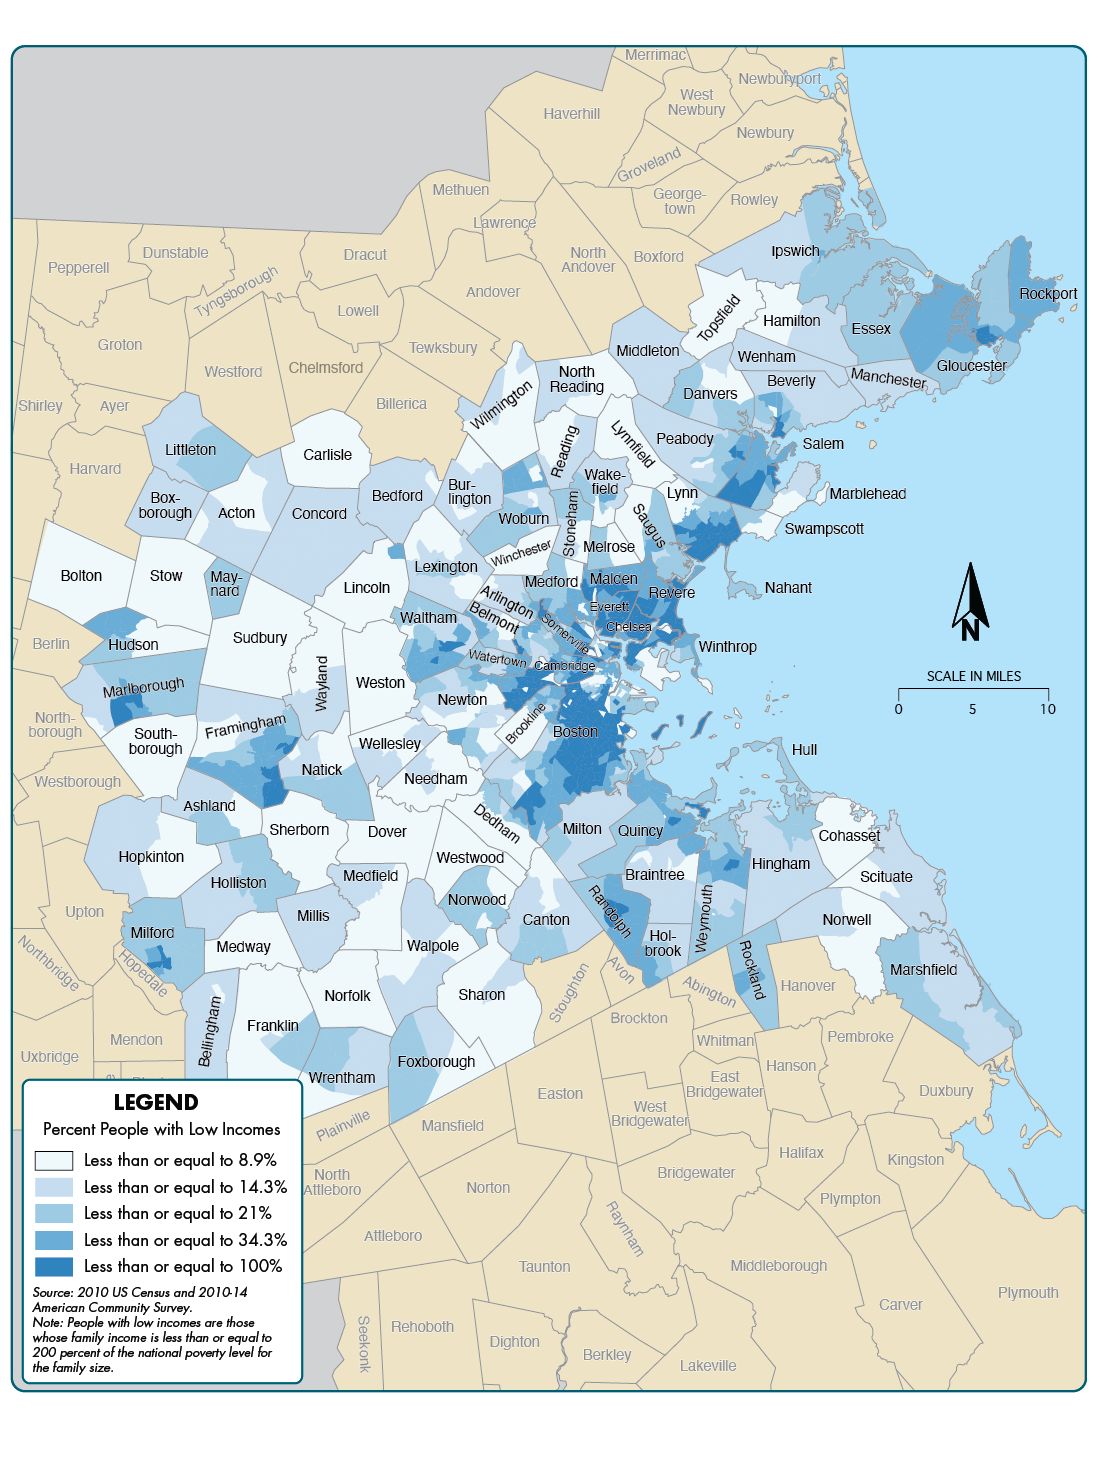
Figure 6-3
Percentage of People with LEP in the Boston Region
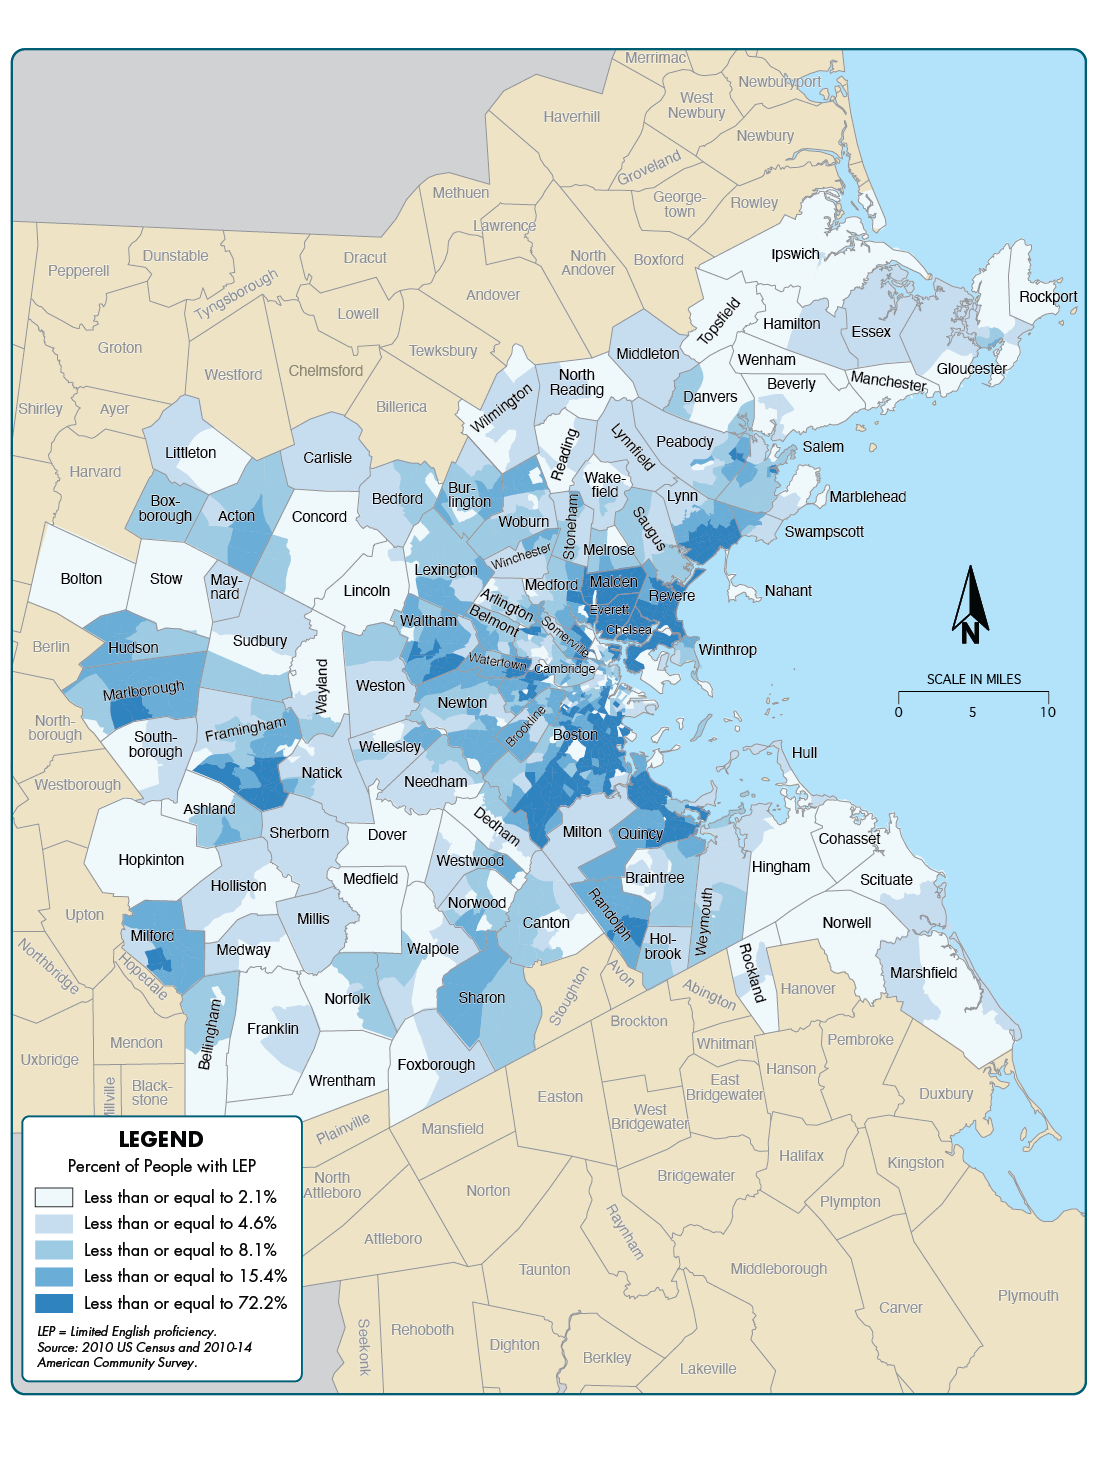
Figure 6-4
Percentage of People Age 75 or Older in the Boston Region
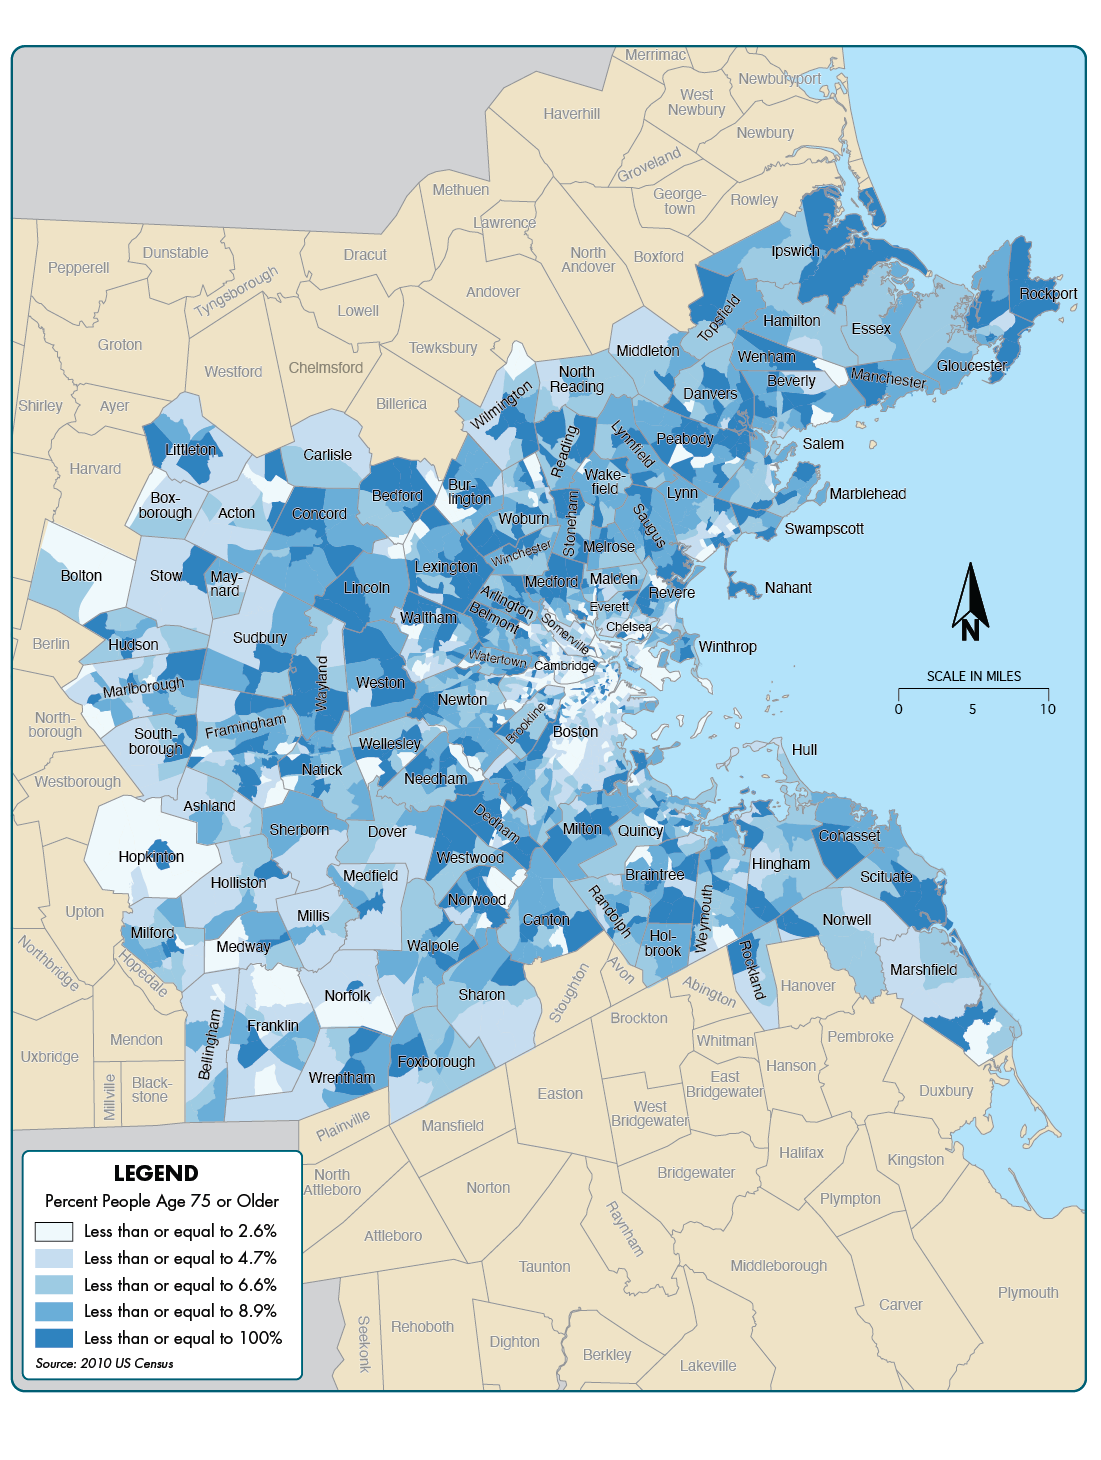
Figure 6-5
Percentage of People Age 17 or Younger in the Boston Region
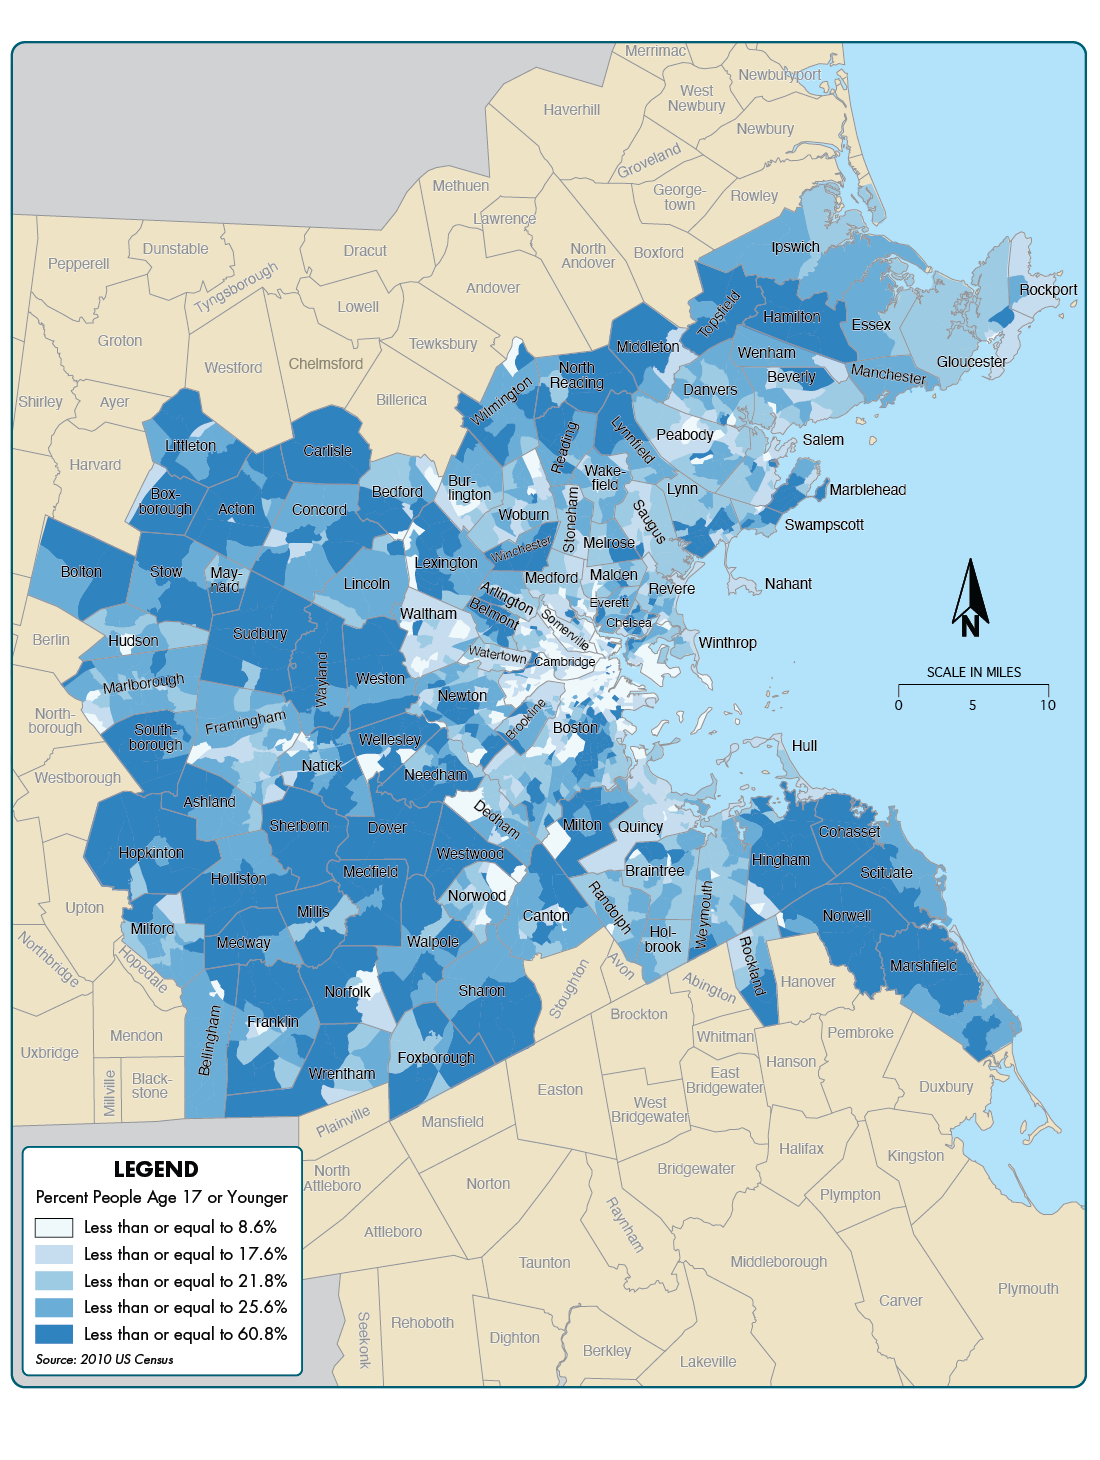
Figure 6-6
Percentage of People with Disabilities in the Boston Region

The analyses in this section assess which TE populations are likely served or impacted by Regional Target-funded projects. Affected populations are considered those who live in close proximity, defined as one-half mile from project extents. Geographic proximity is an approximation that helps determine who is likely to use and be impacted by a project. For some projects, such as those in the Bicycle Network and Pedestrian Connections and Complete Streets Programs, this measure is likely a fairly accurate representation as these projects are often designed and located in such a way so as to serve local residents. For other projects, such as those in the Major Infrastructure Program, this may be a less accurate representation, given that many users of these types of roadways or public transit lines live outside of the half-mile boundary. Some impacts, however, are localized regardless of investment program, such as carbon monoxide (CO) and other transportation-related emissions. Despite drawbacks, geographical analyses are a readily available approximation of who may be most served and affected by projects funded by the MPO.
Table 6-3 shows the percentage of TE populations who live within a half-mile of Regional Target-funded projects. The results show that for the minority population, people with low incomes, people with LEP, and people age 17 or younger, the percentage of people within a half-mile exceeds the regionwide average. For people age 75 or older and people with disabilities, it is slightly below the regionwide average.
Table 6-3
Transportation Equity Populations Served or Impacted by Regional Target-funded Projects
| TE Population Group |
TE Population |
Total Population |
Percentage of TE Population |
Percentage of Boston Region Total Population |
|---|---|---|---|---|
Minority Population |
257,600 |
693,564 |
37.1% |
28.2% |
People with Low Incomes |
200,607 |
658,975 |
30.4% |
23.0% |
People with LEP |
108,171 |
655,124 |
16.5% |
10.6% |
People Age 75 or Older |
41,359 |
693,564 |
6.0% |
6.7% |
People Age 17 or Younger |
122,819 |
693,564 |
17.7% |
16.1% |
People with Disabilities |
67,889 |
687,851 |
9.9% |
10.0% |
Note: This table does not include projects in the Transit Modernization Program, as those projects have not yet been identified, or those in the outer years of the Community Connections Program that have yet to be identified.
LEP = limited English proficiency. TE = transportation equity.
Sources: 2010 US Census, 2010–14 American Community Survey, and the Boston Region MPO.
Figure 6-7 shows the percentage of TE populations served or impacted (out of the entire population served or impacted) by Regional Target projects in the FFYs 2018–22, 2019–23, 2020–24, 2021–25, and 2022–26 TIPs.6-6 In general, funding allocated to TE populations based on their proximity to Regional Target-funded projects has held steady over the past five years. For the minority population and people with LEP, funding has increased slightly in the current TIP over previous years. For people with low incomes, there has been a few percentage points decrease since the FFYs 2018–22 TIP, although it has remained above the average for the region. The decrease largely reflects changes to the methodology used to determine the number of people with low incomes. (See the note in Figure 6-7.) For people age 75 or older and people with disabilities, the percentage has continued to hover around the regionwide average over the past five years. (Data for people age 17 or younger were not included in the analysis prior to the FFYs 2022–26 TIP, so temporal data are not available.)
Figure 6-7
Change in the Percentage of Transportation Equity Populations Served or Impacted by Regional Target Projects
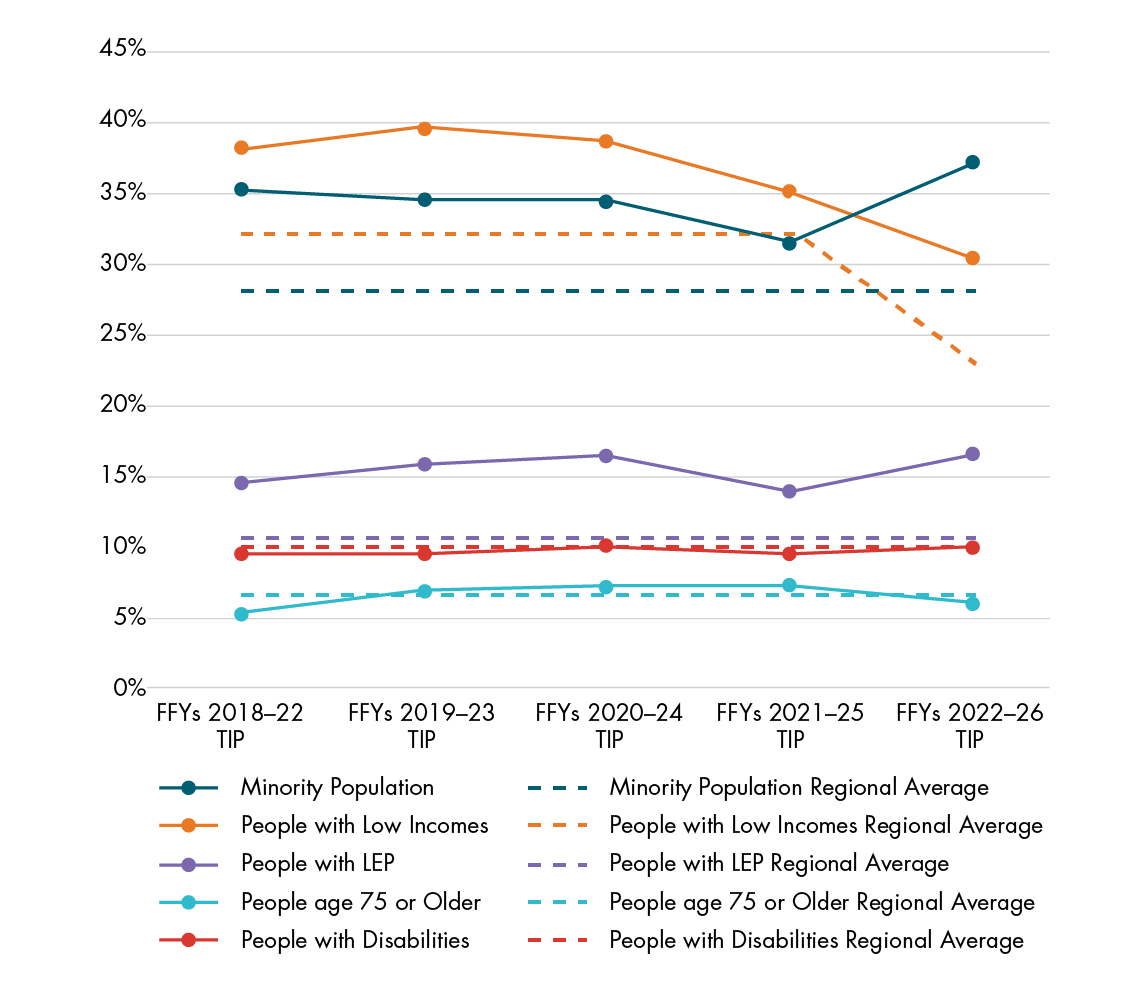
Notes: People age 17 or younger were not considered a TE population until the FFYs 2022–26 TIP, so are not included here. Additionally, starting in the FFYs 2022–26 TIP, people with low incomes are defined based on their poverty status for their family size. (Formerly it was based on household income.) The decrease in the percentage of people with low incomes served or impacted by projects in the FFYs 2022–26 TIP is largely due to this change. The change in the regional average shown in the figure reflects this change as well. For information about the data for the FFYs 2018–22, 2019–23, 2020–24, and 2021–25 TIPs, see the respective documents.
For the FFYs 2021–25 and 2022–26 TIPs, the figure does not include projects in the Transit Modernization Program, as those projects have not yet been identified, or projects in the outer years of the Community Connections Program that also have yet to be identified.
FFY = federal fiscal year. LEP = limited English proficiency. TE = transportation equity. TIP = Transportation Improvement Program.
Sources: 2010 US Census, 2010–14 American Community Survey, and the Boston Region MPO.
Table 6-4 shows the percentage of the population served or impacted by Regional Target-funded projects that are TE populations in each investment program. Numbers in orange indicate values below the average for all Regional Target-funded projects, while numbers in green indicate values above the average. Numbers in grey indicate values equal to the average. The percentage varies across investment programs. Relative to the average of all Regional Target-funded projects, Bicycle Network and Pedestrian Connections serve or impact a greater share of people age 75 or older (13.3 percent), people age 17 or younger (19.5 percent), and people with disabilities (12.9 percent). Complete Streets projects serve or impact a greater share across all TE populations except people age 75 or older (5.7 percent). Intersection Improvement projects serve or impact a greater share of people age 75 or older (10.4 percent) and people age 17 or younger (20.3 percent). Major Infrastructure projects serve or impact a greater share of people with low incomes (30.6 percent) and people with LEP (17.4 percent). Finally, Community Connections projects serve or impact a greater share of the minority population (38.7 percent), people age 75 or older (6.1 percent), and people age 17 or younger (18.9 percent). Overall, Complete Streets projects serve or impact the greatest share of TE populations among the investment programs.
Table 6-4
Percentage of Transportation Equity Populations Served or Impacted by Regional Target Projects, by Investment Program
| Investment Program |
Number of Projects |
Percentage of Minority Population |
Percentage of People with Low Incomes |
Percentage of People with LEP |
Percentage of People Age 75 or Older |
Percentage of People Age 18 or Younger |
Percentage of People with Disabilities |
|---|---|---|---|---|---|---|---|
Bicycle Network and Pedestrian Connections |
4 |
13.7% orange |
17.1% orange |
15.8% orange |
13.3% green |
19.5% green |
12.9% green |
Complete Streets |
21 |
38.0% green |
36.4% green |
17.3% green |
5.7% orange |
17.8% green |
10.6% green |
Intersection Improvements |
8 |
17.1% orange |
15.6% orange |
5.3% orange |
10.4% green |
20.3% green |
9.4% orange |
Major Infrastructure1 |
3 |
33.6% orange |
30.6% green |
17.4% green |
4.8% orange |
12.7% orange |
9.3% orange |
Community Connections |
10 |
38.7% green |
28.9% orange |
16.5% gray |
6.1% green |
18.9% green |
9.7% orange |
All Regional Target-funded Projects |
46 |
37.1% |
30.4% |
16.5% |
6.0% |
17.7% |
9.9% |
Notes: The Major Infrastructure Program includes both roadway and public transit projects. This analysis does not include figures for the Transit Modernization Program, as those projects have not yet been identified, or for projects in the outer years of the Community Connections Program that also have yet to be identified.
LEP = limited English proficiency. TIP = Transportation Improvement Program.
Sources: 2010 U S Census, 2010–14 American Community Survey, and the Boston Region MPO.
Table 6-5 shows projected changes in emissions for CO, volatile organic compounds (VOC), and nitrogen oxides (NOx) that would result from the implementation of Regional Target-funded projects for TE populations and their non-TE counterparts. Reductions are reported in kilograms per 1,000 people and are aggregate figures for all projects. The table also shows the percentage change in emissions since the FFYs 2021–25 TIP went into effect. The results show that the minority population, people with low incomes, people with LEP, and people with disabilities would experience a 100 percent decrease in emissions compared to the previous year’s TIP. However, in this year’s TIP the minority population, people with low incomes, people with LEP, and people ages 17 or under would continue to experience less of an absolute decrease in emissions than their non-TE counterparts. While the data show a decrease in emissions exposure over the previous year’s TIP, there is still an opportunity for improvement so that TE populations receive a comparable decrease relative to their non-TE counterparts.
Table 6-5
Reduction in Carbon Monoxide, Volatile Organic Compounds, and Nitrogen Oxide Emissions per 1,000 People
| Population Group |
Emissions Reduction per 1,000 People (kilograms) |
Percentage Change Compared to Emissions in FFYs 2021–25 TIP |
|---|---|---|
Minority Population |
-47.6 |
-109% |
Nonminority Population |
-51.6 |
-81% |
People with Low Incomes |
-51.2 |
-134% |
People with Medium to High Incomes |
-53.4 |
-42% |
People with LEP |
-49.1 |
-173% |
People Fluent in English |
-53.8 |
-81% |
People age 75 or Older |
-60.0 |
-67% |
People Under the Age of 75 |
-49.5 |
-90% |
People age 17 or Younger |
-47.4 |
N/A |
People age 18 or Older |
-50.7 |
N/A |
People with Disabilities |
-51.2 |
-101% |
People without Disabilities |
-50.5 |
-86% |
Notes: This analysis does not include projects in the Transit Modernization Program, as those projects have not yet been identified, or projects in the outer year of the Community Connections Program that also have yet to be identified. Emissions for the youth population was not analyzed in the FFYs 2021–25 TIP.
FFY = federal fiscal year. LEP = limited English proficiency. N/A = not applicable. TIP = Transportation Improvement Program.
Source: Boston Region MPO’s Congestion Mitigation and Air Quality analyses.
The results of the analyses reported in this section show how Regional Target funds are distributed to TE populations based on the percentage of the population served by the Regional Target-funded projects. The MPO has programmed approximately $518 million in Regional Target funding in the FFYs 2022–26 TIP. Like the geographical analyses shown above, this funding distribution analysis assumes that funds allocated to TE populations indicate a benefit. While the MPO strives to ensure that projects selected for funding provide significant transportation improvements to and mitigate potential burdens on TE populations, the complexity of projects and their varied impacts limit the degree to which these outcomes can be ensured.
Table 6-6 shows how this funding is allocated to TE populations relative to their shares of the regionwide population. The data show mixed results. The percentage of funding benefiting the minority population, people with LEP, people age 17 or younger, and people with disabilities is less than their shares of the regionwide population. The minority population in particular receives disproportionately less funding—21.3 percent—even though this population makes up 28.2 percent of the regionwide population. Conversely, people with low incomes and people age 75 or older receive a higher percentage of funding than their share of the regionwide population.
Table 6-6
Percent of Funding Allocated to Transportation Equity Populations
| TE Population Group |
Percentage of Funding |
Percentage of Regionwide Population |
|---|---|---|
Minority Population |
21.3% |
28.2% |
People with Low Incomes |
22.7% |
20.3% |
People with LEP |
9.5% |
10.6% |
People Age 75 or Older |
7.8% |
6.7% |
People Age 17 or Younger |
17.9% |
20.6% |
People with Disabilities |
9.5% |
10.0% |
Note: This analysis does not include funds allocated to the Transit Modernization Program, as individual projects have not been identified, or funds that are allocated to the outer years of the Community Connections Program for which projects have yet to be identified.
LEP = limited English proficiency. TE = transportation equity. TIP = Transportation Improvement Program.
Sources: 2010 U S Census, 2010–14 American Community Survey, and the Boston Region MPO.
Figure 6-8 shows the percentage of funding allocated to TE populations based on the percent of people who live in the project areas (within one-half mile) for the FFYs 2019–23, 2020–24, 2021–25, and 2022–26 TIPs. Funding has generally remained steady around the regionwide average for people with low incomes, people age 75 or older, people with disabilities, and people with LEP. However, for the minority population it has decreased slightly during the past two TIP funding cycles, and it remains several percentage points below the regionwide average. For people with low incomes, the nine-percentage-point decrease since the FFYs 2018–22 TIP largely reflects changes to the methodology used to determine the number of people with low incomes starting in the FFYs 2022–26 TIP. (See the note in Figure 6-8 for more details.)
Figure 6-8
Change in the Percentage of Funding Allocated to Transportation Equity Populations

Notes: People age 17 or younger were not considered as a TE population until the FFYs 2022–26 TIP cycle, so they are not included in the figure. Additionally, starting in the FFYs 2022–26 TIP, people with low incomes are defined based on their poverty status for their family size. (Formerly it was based on household income.) The decrease in percent of the low-income population served in FFYs 2022–26 is largely due to this change, as is the change in the regionwide average. For more information about the data for the FFYs 2019–23, 2020–24, and 2021–25 TIPs, see the respective documents.
This analysis does not include funds allocated to the Transit Modernization Program, as individual projects have not been identified, or funds that are allocated to the outer years of the Community Connections Program for which projects have yet to be identified.
FFY = federal fiscal year. LEP = limited English proficiency. TE = transportation equity. TIP = Transportation Improvement Program.
Sources: 2010 U S Census, 2010–14 American Community Survey, and the Boston Region MPO.
6-1 Regional Target funds are those federal funds provided to MPOs that are programmed for projects at the discretion of each MPO. The Boston Region MPO typically receives about $110 million each year in Regional Target funds.
6-2 TE populations are identified using US Census and American Community Survey data. LEP status is calculated for the population age five and older, disability status is calculated for the noninstitutionalized population, and poverty status is calculated for those whose poverty status can be determined. All other TE populations are tabulated from the entire MPO region population.
6-3 For conciseness, people who identify as minority are referred to as the “minority population” in the remainder of this document. The minority population includes those who identify as Hispanic or Latino/a/x and/or a race other than White.
6-4 A person is considered to have a low income if their annual family income is less than or equal to 200 percent of the poverty level for their family size.
6-5 This scoring system is different from that used for the MPO’s Community Connections Program, which has a different set of evaluation criteria.
6-6 Starting in the FFYs 2022–26 TIP, the methodology for determining the population within a half-mile of projects was updated—a half mile is now measured along the roadway network (excluding limited access highways) rather than as-the-crow-flies as was done for previous TIPs.