 Innovations in Estimating Trip Generation
Innovations in Estimating Trip Generation
Project Managers
Sandy Johnston
Ariel Patterson
Project Principal
Paul Christner
Cover Design
Kate Parker-O’Toole
The preparation of this document was supported by the Unified Planning Work Program through MPO Planning and §5303 Contract #108217.
Central Transportation Planning Staff is
directed by the Boston Region Metropolitan
Planning Organization (MPO). The MPO is composed of
state and regional agencies and authorities, and
local governments.

For general inquiries, contact
Central Transportation Planning Staff 857.702.3700
State Transportation Building 617.570.9192 (fax)
Ten Park Plaza, Suite 2150 617.570.9193 (TTY)
Boston, Massachusetts 02116 ctps@ctps.org
The Boston Region Metropolitan Planning Organization (MPO) operates its programs, services, and activities in compliance with federal nondiscrimination laws including Title VI of the Civil Rights Act of 1964 (Title VI), the Civil Rights Restoration Act of 1987, and related statutes and regulations. Title VI prohibits discrimination in federally assisted programs and requires that no person in the United States of America shall, on the grounds of race, color, or national origin (including limited English proficiency), be excluded from participation in, denied the benefits of, or be otherwise subjected to discrimination under any program or activity that receives federal assistance. Related federal nondiscrimination laws administered by the Federal Highway Administration, Federal Transit Administration, or both, prohibit discrimination on the basis of age, sex, and disability. The Boston Region MPO considers these protected populations in its Title VI Programs, consistent with federal interpretation and administration. In addition, the Boston Region MPO provides meaningful access to its programs, services, and activities to individuals with limited English proficiency, in compliance with U.S. Department of Transportation policy and guidance on federal Executive Order 13166. The Boston Region MPO also complies with the Massachusetts Public Accommodation Law, M.G.L. c 272 sections 92a, 98, 98a, which prohibits making any distinction, discrimination, or restriction in admission to, or treatment in a place of public accommodation based on race, color, religious creed, national origin, sex, sexual orientation, disability, or ancestry. Likewise, the Boston Region MPO complies with the Governor's Executive Order 526, section 4, which requires that all programs, activities, and services provided, performed, licensed, chartered, funded, regulated, or contracted for by the state shall be conducted without unlawful discrimination based on race, color, age, gender, ethnicity, sexual orientation, gender identity or expression, religion, creed, ancestry, national origin, disability, veteran's status (including Vietnam-era veterans), or background. A complaint form and additional information can be obtained by contacting the MPO or at http://www.bostonmpo.org/mpo_non_discrimination. To request this information in a different language or in an accessible format, please contact Title VI Specialist 857.702.3700 (voice) |
Abstract
This report summarizes research conducted by the Central Transportation Planning Staff (CTPS), the staff to the Boston Region Metropolitan Planning Organization (MPO), into innovative practices in the analysis of trip generation (the study of predicting to what extent and how people travel to and from developments and other locations) and seeks to create a framework for ongoing research and efforts into developing improved methods. This research proceeds from the widely shared understanding that the standard trip generation rates provided by the Institute of Transportation Engineers often perform poorly in dense urban areas and inadequately capture travel by modes other than single-occupancy vehicles. Trip generation rates are commonly used in the development and infrastructure review processes, as well as travel demand modeling. This research focused on the use of these data in the development review process. The report includes a literature review covering the need for improving trip generation analysis and methods of doing so. We present case studies of municipalities using alternative methods of trip generation analysis that encompass all modes of transportation, as well as research on policy frameworks that use or proceed from these methods. We document current and potential applications of trip generation rates by CTPS, including its ongoing work with partner agencies. The report concludes by documenting next steps to be taken in the field generally and in the Boston Region MPO’s planning area in particular.
Chapter 1—Introduction and Background....................................................... 7
Background.................................................................................... 7
Current Trip Generation Rate Methods................................................ 8
Strengths and Weaknesses of the ITE-Based Method............................. 8
1.2...... Related Trip Generation Studies in the Boston Region........................... 10
How this Study Contributes to Regionwide Efforts................................. 10
Current CTPS Use of Trip Generation Rates....................................... 10
Chapter 2—Approaches to Trip Generation Rates.......................................... 13
2.2...... Adjusting Existing ITE Trip Generation Rates....................................... 14
EPA MXD Model............................................................................ 15
MXD+ Method............................................................................... 16
Rate Adjustment Case Study 1: Montgomery County, Maryland.............. 17
Rate Adjustment Case Study 2: Boston, Massachusetts........................ 18
2.3...... Create New Trip Generation Rates.................................................... 19
Rate Creation Case Study 1: Washington, DC..................................... 19
Rate Creation Case Study 2: New York City........................................ 22
Rate Creation Case Study 3: San Francisco........................................ 24
Rate Creation Case Study 4: Cambridge, Massachusetts....................... 26
3.1...... Direction of Trip Generation Analysis................................................. 29
3.2...... Applicability to Future Work in the Boston Region................................. 30
Figure 1 Montgomery County Local Area Transportation Review Process
Figure 2 Sample TripsDC Application Output
Figure 3 New York City Transportation Impact Analysis Zones and Exemptions
Chapter 1—Introduction and Background
The Central Transportation Planning Staff (CTPS), the staff to the Boston Region Metropolitan Planning Organization (MPO), conducted research into practices in trip generation analysis to provide a thorough background on current and innovative practices in estimating and analyzing trip generation rates, with a focus on non-automobile modes. A better understanding of how trip generation rates are used in transportation and land use planning will help the Boston Region MPO improve its own state of practice and offer expertise to its member municipalities. This initial exploration of trip generation rates supplements an ongoing study by CTPS’s Transportation Systems Analysis and Travel Model Development groups and complementary studies led by the Metropolitan Area Planning Council (MAPC) and the Massachusetts Department of Transportation (MassDOT).
Since the field of trip generation has been heavily studied and well-documented over the past decade, MPO staff charted this research project to fit within the context of the MPO planning area’s diverse land use patterns. At the core of the Boston region is a dense urban area, and—as staff learned from interviews with local stakeholders—current trip generation practices in the region are often thought to be imperfect, reflecting many of the challenges identified nationally. To frame this project, MPO staff was guided by the following questions:
Trip generation rates are commonly used as the first step in several important planning processes, including development review, infrastructure project review, and travel demand modeling. 1 During the research process, MPO staff determined that the most useful and relevant element to focus on would be the use of trip generation rates in the development review process. The latter two items, infrastructure project review and travel demand modeling, will be addressed more fully in later phases of CTPS’s ongoing work with MAPC and MassDOT. As part of the development review process, trip generation data and analysis methods are used to conduct traffic or transportation impact analyses that estimate the relevant travel demand, the number of new trips that would be generated from or attracted to the development, and the relative transportation impact of new development projects. Trip generation rate data are also commonly used throughout the United States for impact fee assessments and environmental reviews.
The most widely used method to determine trip generation rates is based on data provided by the Institute of Transportation Engineers (ITE). ITE’s standards were first developed when the transportation planning field was more automobile-centric than it is today. Its Trip Generation Manual currently contains trip generation data points collected between the years 1980 and 2017. The data found in the ITE Trip Generation Manual are based on vehicle trips in suburban settings with distinct land uses. The applications for those data are clearly outside the control of ITE (Millard-Ball 2015). Nevertheless, the current method fails to capture compact, mixed-use and transit-oriented development with access to multimodal transportation options. These types of development have accelerated in recent decades.
Criticisms of the current predominant method of determining trip generation rates are well documented in peer-reviewed literature. The predominant issue with standard, ITE-based practices is that the application of suburban data in urban settings can overestimate motor vehicle demand, later resulting in consequences for the community and region at large. The strengths and weaknesses of the standard ITE-based method, as documented in the literature reviewed by MPO staff, are summarized below.
The strengths of the ITE-based method are as follows:
The weaknesses of the ITE-based method, which have been mitigated to some extent but not entirely in recent editions of the ITE Trip Generation Manual (see section 2.1 below), are as follows:
This research will inform and support several ongoing and upcoming efforts in the region to improve the trip generation rates used to project travel by all modes:
This study provides a comprehensive review of the available literature on trip generation and summarizes broad trends in existing practices and in innovation. It identifies state-of-the-practice approaches and creates an intellectual framework that staff executing work on trip generation at CTPS and other agencies in the Boston area can draw from. Especially of interest to staff is the evolution of trip generation rate analyses for non-automobile modes.
Additionally, staff interviewed planners in several municipalities in the MPO planning area—Boston, Cambridge, Everett, Framingham, and Watertown—who struggle to varying degrees with the inadequacy of existing trip generation practices. Their input can help guide priorities for ongoing work. Finally, MPO staff established numerous connections nationwide with planners and consultants involved in state-of-the-practice trip generation modeling, thus creating an index of contacts with whom CTPS and other interested staff can continue to be in contact with technical and policy questions.
CTPS’s travel demand model does not use ITE rates in its core work. The trip generation rates in the CTPS travel demand model are based on the 2011 Massachusetts Household Travel Survey (HTS). In the survey, more than 15,000 households were recruited to prepare daily travel logs for all members of the household, more than 10,000 of which were processed by CTPS modelers to develop trip generation rates for the CTPS model at the production, or household end only (e.g., not at the attraction or destination end of the trip). However, as part of the Massachusetts Environmental Policy Act (MEPA) environmental review process, developers are required to use ITE rates, so CTPS is sometimes required to evaluate products that use those rates as part of contracted client work. CTPS’s Traffic Analysis and Design (TAD) group also occasionally uses ITE rates.
The use of HTS data in trip generation evaluation is not uncommon, but it does not replicate all of the functions of ITE data, especially for non-residential locations, and is therefore more typically used as a mode share adjustment to ITE rates (when treated as person-trips) or as part of the data that inform a complex model using locally observed data. As such, ITE rates are not deeply embedded at the core of CTPS’s work, but the agency could consider incorporating a broader variety of data, as discussed in this study, into its modeling work. CTPS’s modeling groups currently have near-term plans to analyze data collected through the Massachusetts Department of Environmental Protection’s Rideshare Program and compare it to mode share estimates from the travel demand model and the 2011 HTS.
Chapter 2—Approaches to Trip Generation Rates
A number of factors have caused the practice of trip generation to evolve over the last four decades. Recognizing the shortcomings of the standard process, ITE, local and regional planners, and other stakeholders have worked to create tools that use newly available data and more accurately analyze the world as it exists. The same tools can help foster progress toward policy goals such as mode shift and smart growth. The adoption of different tools and a desire to improve methodologies are becoming more common, as evidenced by the case studies discussed in Section 2.3 of this report.
Since the ITE Trip Generation Manual and its accompanying Trip Generation Handbook were released in 1976, there has been a shift in the type of trip generation data collected. The new types of data collected include person-trip rates, mode shares (and mode-specific count estimates), contextual information (e.g., density, diversity, design, multimodal facilities, parking, and sociodemographics), and site-specific information such as cost of dwelling units, available bike parking, year built, and use of transportation demand management (TDM) strategies (Currans 2017). Although current methods of trip generation analysis allow for some internal capture, they do not adequately account for the effects of compact development, mixed-use development, site design, walkability, available transit, and regional accessibility (United States Environmental Protection Agency 2019).2 These methodologies are instead generally based on data collected from single-use, automobile-dependent, suburban sites and are inappropriate for planning in dense urban cores.
There is much work being done to improve trip generation rate methodologies, and the outlook is quite promising. ITE states that users now have access to a significantly expanded and enhanced data set with more than 1,700 new data points—a 30 percent increase—and new urban, person-based trip data in the most recent edition of the Trip Generation Manual (ITE 2020). By shifting the focus to person-trips, instead of vehicle-trips, planners can facilitate sustainable growth by permitting new development projects better suited to local conditions and mobility trends, especially those not based on automobile use.
Despite this evolution, even contemporary methods have a limited capability to accurately determine trip generation rates for transportation modes such as walking, bicycling, and transit. No consensus has emerged about the best approach. The research and the interviews conducted by MPO staff identified two basic approaches: 1) sophisticated adjustments to ITE rates and 2) the complete replacement of ITE rates with locally observed data. For the most part, both approaches rely on estimating person-trips and then applying mode splits from other data sources, rather than specifically modeling trips by each mode. Mode splits can be based on United States census data, including American Community Survey (ACS) data, HTS data, or observed data. None of these approaches is perfect, but they represent a significant improvement over previous iterations that primarily analyzed—and therefore favored—personal vehicles.
There is some literature on trip generation rate analysis for modes of transportation other than single-occupancy vehicles (SOVs), but it is mainly for four-step modeling applications rather than impact evaluation, which is the main use of trip generation analysis. The more innovative and modern methods, that account for all travel modes, are categorized into three groupings that 1) adjust existing trip generation rates, 2) create new trip generation rates, and 3) implement policy measures. There is ongoing work on this topic by ITE and others.
For any of these methodologies, a significant amount of data collection is needed. Data collection efforts, especially intercept surveys, can be very costly for many agencies, hence there are so few examples of localities that have created entirely new trip generation rates. Our research led us to four examples of cities in the United States that have created new trip generation rates.3 Adjusting existing trip generation rates, on the other hand, is typically a more cost effective and well documented approach that allows for easier replication within a local context. High-quality adjustments can be done with locally collected data, but the basic approach can be used with a publicly available method using data from across the country.
The basic process of estimating internal capture rates for mixed-use developments is outlined in the ITE Trip Generation Handbook. MXD trip generation analysis begins with standard ITE trip generation rates based on land use. A 2011 report by Reid Ewing and his co-authors describes the general process for adjusting ITE trip estimates in step-by-step instructions summarized below:
The United States Environmental Protection Agency’s (EPA) MXD Model and the MXD+ method are just two examples of methodologies that capture trip generation rates for alternate modes of transportation. Our team chose to document these methodologies because, according to the literature, they are widely accepted, well-documented, and have a high degree of accuracy. In short, they appear to be the industry standard, and the methods have been iteratively improved since their initiation. Additionally, our team documented Montgomery County, Maryland, and Boston, Massachusetts, as two case studies of localities that adjust their trip generation rates.
In 2010, the EPA, in collaboration with the consulting firm Fehr & Peers and ITE, developed a mixed-use trip generation model. The MXD model is an open source, spreadsheet-based tool that calculates reductions in trips based on ITE rates for any geographic context. The tool’s linked models estimate internal capture of trips within MXDs as well as walking and transit use for trips starting or ending in MXDs (US EPA 2019). The EPA MXD model captures characteristics most influential in trip generation analysis, commonly referred to as the seven “Ds”: density, diversity, design, destination accessibility, development scale, demographics, and distance to transit. Quantifying these characteristics results in a richer set of variables with which to measure a development site (DDOT 2015).
The tool’s spreadsheet format makes it easy for local government staff, consultants, and developers to input data that will retrieve trip generation rates for MXDs. Another major benefit of the EPA MXD model is that while it includes default national parameters for trip generation, it allows for the use of local values if available. Although the EPA MXD method is more accurate than traditional ITE-based ones, the EPA acknowledges its shortfalls by these disclosures:
The method was developed primarily to address the effects of mixed-use development and, though it does account for some effects of transit availability and regional accessibility, special care should be used when applying the method to transit-oriented developments (particularly adjacent to premium bus or rail service) and to development within the regional core (downtown) (U.S. EPA 2014).
The method does not account for the effects of changing the spatial separation among uses within the development site, nor with changing the mix of specific types of retail and services uses such as entertainment, restaurant, and hotel (U.S. EPA 2014).
Since the EPA MXD open source tool was released in 2010, several firms have used it as basis for developing more advanced modeling tools. One example is the MXD+ model, a proprietary tool developed by the consulting firm Fehr & Peers, the same firm that helped create the EPA MXD tool. The MXD+ method is a new analytical approach that combines the strengths of the methodologies presented in the EPA MXD model and in the National Cooperative Highway Research Program (NCHRP) Report 684.4 The approach relies on built environment variables, or the “D” variables, to measure the degree of interactivity within the site and adjust the conventional ITE and modeling methods (Fehr & Peers).
According to the DDOT MXD+ Method Development Report, the MXD+ method represents a dramatic improvement over current methods of estimating trip generation for mixed-use developments (2015). The method produces reliable, though still somewhat conservative, estimates of trip generation that are highly sensitive to the context of any given development. The MXD+ method explains 97 percent of the variation in trip generation among mixed-use sites studied, compared with 65 percent for the ITE method, and all but eliminates the ITE systematic overestimation of traffic (Walters, Bochner and Ewing 2013). Fehr & Peers can create a locally calibrated version of the MXD+ tool for communities. However, unlike the EPA MXD tool, the MXD+ tool is not open source and there is a fee.
In 2016, Montgomery County, Maryland developed a new approach to its review process for determining transportation impacts of site development that previously did not incorporate a set of context-sensitive, multimodal trip generation rates (Hardy, Graye, and Van Nostrand 2018). Since Montgomery County has a wide variety of land use patterns, ranging from farmland to dense urban areas, it was important to update vehicle-trip generation rates and develop a set of person-trip generation rates that reflect the diversity of land use patterns and travel behavior (Montgomery County Planning Department 2017). The county adopted an approach similar to the one described in the NCHRP Report 758, “Trip Generation Rates for Transportation Impact Analyses of Infill Developments.” 5
The new approach produces a series of trip generation rates by mode and land use for each of the 38 “policy areas” in the county. In the 1980s, Montgomery County established a series of transportation policy areas to recognize that transportation needs for the more urban, transit-oriented districts differed substantially from the suburban and rural areas of the county (Hardy, Graye, and Van Nostrand 2018). The county’s Local Area Transportation Review (LATR) Guidelinesidentifies the mode split assumptions, known as the “ITE Vehicle-Trip Generation Rate Adjustment Factors,” to be used for each of the policy areas. The revised transportation review process is depicted in Figure 1 below.
Figure 1
Montgomery County Local Area Transportation Review Process
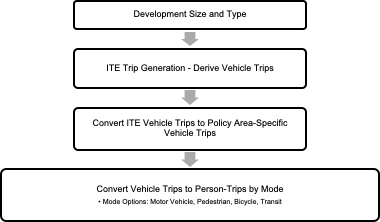
Source: Local Area Transportation Review Guidelines, Montgomery County, Maryland.
Employing new trip generation methodologies has not been an issue in Montgomery County as there is ample support from stakeholders and neighboring areas. Regional collaboration between Maryland, Virginia, and the District of Columbia carries great potential, but coordinating efforts continue to be discussed by the states. In the upcoming fiscal year, planners in Montgomery County want to build a county-focused trip generation tool geared towards its MXD sites. However, the project is temporarily on hold due to high costs of collecting data—demonstrating one of the advantages of the MXD and MXD+ models, and a drawback to the alternative of collecting data locally.
Recognizing that during the past 15 years planners have become more focused on alternative modes of transportation, the City of Boston is shifting away from its reliance on ITE trip generation rates to obtain more accurate internal capture rates and refine mode splits between active transportation modes that are better suited to neighborhoods. Boston is actively working to amend its current ITE-based methodology, to one more suitable for the local context. Ongoing efforts include the following: 1) shifting away from trip generation rates for bicycles by partnering with a consultant to develop a bicycle Level of Traffic Stress (LTS) system map, 2) refining the split between bicycles and pedestrians and better estimations of private automobiles and ride-hailing options, 3) creating new development review guidelines with specific thresholds for ITE rates, 4) developing a standardized list of mitigation goals for developers since now mitigation is sometimes done on a case-by-case basis, and 5) submitting new parking ratios derived from parcel-based analysis instead of neighborhood-based analysis.
Prominent goals for Boston are to more accurately forecast developments’ traffic impacts and require developers to conduct analyses for each transportation mode. A mode-specific analysis would help city planners determine appropriate mitigation measures. A major barrier to achieving both goals is the lack of capacity to conduct extensive data collection. Although Boston’s city planners cite the benefits of using ITE’s large set of historical data for single-use projects and for the more common land uses, there is a need for a more streamlined system that can be replicated across the region.
Within the last 15 years, planners at the Boston Planning and Development Agency (BPDA)—formerly the Boston Redevelopment Authority (BRA)—and the Boston Transportation Department (BTD) were able to collect mode share data for the heavily developed Seaport district with greater accuracy. Drawing on experience from the Seaport, in March 2020 the BPDA launched the PLAN: South Boston Dorchester Avenue Planning Initiative’s Transportation Plan to further refine and advance the proposed multimodal network recommendations from the 2016 approved Dorchester Avenue Plan (BPDA 2020). Consultants working on the 2020 Plan will integrate the rate adjustments from the MXD Model into the project. The project is not yet completed but it could be a good local case study for the Boston Region MPO’s planning area.
Compared to ITE rate adjustments, creating new trip generation rates based on local data is the ideal option. However, based on interviews conducted, we found that the high cost of local data collection is a barrier for many cities. Examples of localities that created new trip generation rates include Washington, DC, New York City, San Francisco, and Cambridge, Massachusetts.
The District of Columbia’s method of determining trip generation rates is based on the MXD+ method with modifications appropriate for the dense urban core. Originally conceived as an Excel spreadsheet-based tool, the District Department of Transportation (DDOT) now offers a web-based tool for evaluating multimodal travel behavior during development review and estimating trip generation for residential-over-retail development projects. The web-based tool, called TripsDC, is a locally calibrated and validated trip generation tool that allows users to input project parameters to retrieve outputs in person-trips (for AM and PM peak hours) and mode splits (for AM and PM peak hours). The webtool is based on data from more than 50 residential-over-retail developments within the District of Columbia and is preloaded with variables to apply the model at any address in the city to estimate trips by automobile, walking, biking, and transit. Inputs include transit competitiveness and employment within one mile of the relevant parcel (DDOT 2020). Figure 2 displays a TripsDC scenario for a sample residential-over-retail site.
DDOT’s model directly estimates total person-trips and is sensitive to the amount of parking provided on site (DDOT 2020). TripsDC produces more accurate rates than the traditional ITE methods, which, according to the DDOT“Trip Generation and Data Analysis Study,” were found to be a complete mismatch for the District (Porter et al 2015). DDOT now requires this tool be used to develop trip generation estimates for residential-over-retail projects that meet certain parameters.
Figure 2
Sample TripsDC Application Output
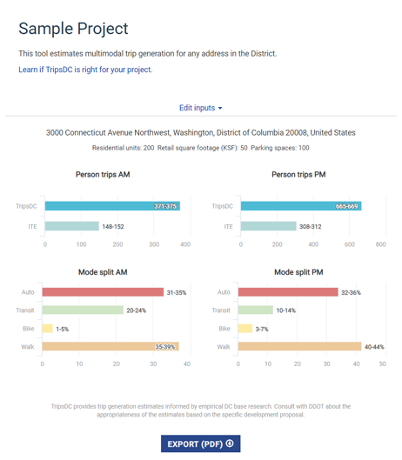
Source: District Department of Transportation.
The District’s Guidance for Comprehensive Transportation Review, requires project proponents to develop and validate travel assumptions as part of the DDOT scoping process. Mode split assumptions used in the analysis must be informed by a variety of sources including the most recent Census Transportation Planning Products, the 2017 National Household Travel Survey, the 2005 Washington Metropolitan Area Transit Authority’s Development-Related Ridership Survey, the 2016 Transportation Planning Board’s “Commuter Connections State of the Commute Survey Report,” or other recent planning studies or comprehensive transportation reviews in the area (DDOT 2019). Proposed trip generation estimates must be provided by mode (rail and bus transit, bicycle, walk, and automobile), type of trip, land use, and development phase. Existing site trips must be included in the trip generation table and based on actual counts, when possible, and not on estimated trip generation calculations.
DDOT will accept local trip generation rates, rates of comparable urban areas, or national rates adjusted for the local context. Regardless of which trip generation data source and methodology are ultimately selected, trips should always be provided by mode in person-trips. Another notable point is that the industry standard practice of applying an internal-capture reduction or a TDM reduction for MXDs is not permissible because these reductions are built into its multimodal trip generation methodology (DDOT 2019).
New York City reviews many developments under the City Environmental Quality Review (CEQR) process, per the State Environmental Quality Review Act’s requirements. Projects subject to the CEQR are those that require discretionary approvals or permits from any city agency, are supported by city funding, or are undertaken by a city agency, and that are presumed to produce a significant adverse environmental impact. Basic information about the CEQR process is available on the website of the Mayor’s Office of Environmental Coordination.6 Transportation guidelines for CEQR review are contained in Chapter 16 of the CEQR Technical Manual, published in 2014 and revised in 2016. 7
As befits New York City’s status as the most multimodal city in the United States, the guidelines address not only traffic impacts but a wide variety of transportation-related impacts, including traffic conditions, rail service and capacity, bus service, pedestrian and bicycle facilities and safety, parking, and freight delivery. Like many cities, New York City exempts developments of a certain size, use, or density from complete review, depending on the location of the developments in the city, as defined in Figure 3 below.
Figure 3
New York City Transportation Impact Analysis Zones and Exemptions
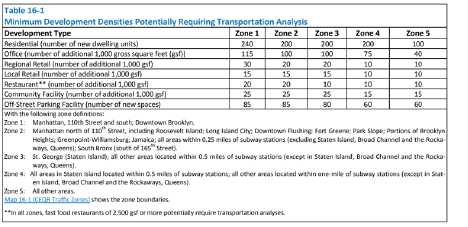
Source: New York City CEQR Technical Manual, Chapter 16.
The zones and thresholds depicted in Figure 3 were derived from locally collected data and represent scenarios in which a development is unlikely to cause a significant adverse impact. Typically, a project will require further review, including a trip generation analysis, if it is expected to induce more than 50 peak hour vehicle trip-ends; 200 peak hour subway, rail, or bus transit trips; or 200 peak hour pedestrian trips.
New York City encourages project proponents to draw from its extensive library of locally collected trip generation data, mostly supplied from previous environmental reviews or other research. Proponents are required to find data collected for a comparable land use type, in a comparable area. If they are unable to, or if such data exists but is “stale” (out of date), city officials recommend conducting an original survey of a comparable location or site. Proponents can use ITE trip generation rates if no parallel site is available. However, they must first consult with New York City Department of Transportation (NYCDOT) staff, since the agency recognizes the general unsuitability of those rates for its dense, transit-rich city. If need be, NYCDOT staff can help proponents appropriately adjust the rates for usage in the city.
The trip generation rates that New York City provides are coded as absolute numbers of person-trips for both peak and all-day trips. To determine exactly how people will travel, the review process applies modal split percentages based on land use type and location in the city, derived from a wide variety of sources. Data are required to be no more than 10 years old. Sources for generating mode split data include the following:
Analysts then multiply the mode split percentages by the absolute person-trip numbers provided by New York City or generated in the previous step to yield absolute estimates of trips by mode. Depending on the results of the trip generation analysis, a complex set of modal reviews may be required for the development. While beyond the scope of this research, the modal review process depends on many of the same datasets that are used in the mode split phase to assign trips across the road, transit, and pedestrian and bicycle networks. Then there is an analysis of capacity and other impacts, and mitigation actions are recommended accordingly. Notably, the detailed review process may include a parking analysis, but impacts to parking (i.e. reduction of parking availability in the neighborhood or insufficient on-site parking) are completely exempt from consideration as an impact in NYC’s densest areas. The CEQR Technical Manual also recommends, but does not require, a Traffic Monitoring Plan for medium- and large-sized developments that could generate a significant amount of valuable data for future analysis efforts.
The San Francisco Planning Department conducts environmental reviews to screen development projects for potential impacts on the environment pursuant to the California Environmental Quality Act (CEQA) and Chapter 31 of the San Francisco Administrative Code. The environmental review process requires project proponents to submit technical studies, such as transportation impact studies, for their proposed developments. If a project triggers any of its “significance criteria,” then applicants conduct and submit a travel demand analysis.
As stated in its Transportation Impact Analysis Guidelines for Environmental Review, a project’s travel demand refers to the number, type, and common origins and destinations of new trips that people would make to and from the development. For existing trips to a site, proponents may include trip credits, based on empirical data collection at the site. The methodology may then subtract or credit the existing site trips from the trips the new development would generate for net new trips. To estimate trips generated by the new development, the methodology in a travel demand analysis for environmental review is a four-step process resembling that of a traditional four-step model.
To complete a travel demand analysis and determine trip generation rates, project proponents use the city’s web-based tool called SF Travel Demand. Released in 2019, the SF Travel Demand tool estimates the number, type, and common destinations of new trips that people would make to and from a new development project (San Francisco County Transportation Authority 2020). Based on locally observed data, the tool allows users to input project parameters of the proposed development and retrieve outputs in a spreadsheet format.
Previously, the city used locally observed rates from its 2002 Transportation Impact Analysis Guidelines, Citywide Travel Behavior Surveys, and ITE trip generation rates for its environmental review processes and associated travel demand estimates. San Francisco still uses ITE rates for evaluating very large developments such as Treasure Island. Based on an interview with a staffer for the San Francisco Planning Department, one caveat of the tool is its inability to account for all land use types, so users must substitute a similar land use type. The Planning Department is currently updating its estimates of freight loading rates (deliveries and truck trips) and racial and social inequities markers to incorporate into the tool.
The Planning Department’s screening tool works in tandem with the State of California’s requirements to use vehicle miles-traveled (VMT) metrics instead of automobile-oriented level-of-service (LOS) standards to evaluate a project’s transportation impacts. San Francisco also has a robust TDM program, to which site developers must regularly report travel conditions, and does not impose parking minimums. Furthermore, through its Transportation Sustainability Program, the city requires developers pay transportation sustainability fees to help offset the growth created by their projects and fund public transit projects (San Francisco Planning 2020).
In 1992, the City of Cambridge adopted the Vehicle Trip Reduction Ordinance after determining that new measures must be implemented by the city and the Commonwealth of Massachusetts to reduce vehicle and traffic congestion, and that these measures must involve the participation of all sectors of the community on a local and regional basis to make more efficient use of mass transit, bicycling, walking, and other alternatives to trips by single-occupancy vehicles (City of Cambridge, Chapter 10.17.020, 1992). Since then, Cambridge has made significant strides in the field of trip generation rate analysis. A large portion of vehicle traffic on Cambridge streets is attributed to through trips, or trips that neither originate nor end in Cambridge (City of Cambridge 2020).
Cambridge has well-established practices aimed at achieving the city’s growth objectives, including calculation of employment densities and mode splits through extensive reporting requirements. Cambridge reviews development projects to determine capacity levels and exceedances as part of the traffic impact analyses. Exceedance levels are connected to mitigation measures. Cambridge’s planning department has collected driveway counts and mode share data for many properties during the past 20 or more years. Recently, the department expanded the collection to include other mode types, including scooters, shared scooters, transportation network companies (TNCs) such as Uber and Lyft, and taxis.
Using the city’s methodology, analysts divide person-trips by mode split percentages, which are determined by aggregating data gathered from Cambridge’s Parking and Transportation Demand Management (PTDM) reports (described in greater detail below). Over 45,000 people participate in PTDM reporting, representing 45 percent of Cambridge’s workforce, and it has been a reliable source of data since the PTDM Ordinance was adopted over 20 years ago. As a result, Cambridge no longer relies upon the US Census Bureau’s ACS data.
In addition to creating new trip generation rates, Cambridge has also implemented policy measures to reduce vehicle trips and traffic congestion. In 1998, the city adopted the PTDM Planning Ordinance (Chapter 10.18), later made permanent in 2006, that formalizes parking and TDM planning and program requirements. Non-residential parking facilities larger than a specified size trigger the PTDM Ordinance and are subject to a PTDM plan.
PTDM plans are designed to minimize demand for parking and reduce SOV trips. They contain mandatory commitments to achieve specified numeric or percent reductions in vehicle trips. Project proponents must have an approved PTDM plan prior to obtaining any additional permits. The PTDM Ordinance is enforced through regular monitoring via annual surveys of its committed TDM measures, known as PTDM reports, and violators are subject to fines and facility closures. Sample TDM measures include transit subsidies, financial incentives for walking or biking, and a market-rate parking fee charged directly to employees or patrons.
Parking availability is key to trip generation rate analysis in Cambridge. The Cambridge planners with whom we spoke concluded that the number of parking spots ultimately determines the number of trips generated for a new development. Therefore, limiting the amount of parking spaces to deter automobile usage, primarily SOVs, has been an effective way to foster sustainable growth and development patterns.
The intention of this study is ultimately to provide MPO stakeholders, especially partner agencies and member municipalities, with actionable information that can improve transportation and general planning practices. This section summarizes and clarifies some of the pathways that our research indicates these improvements may take in the coming years.
While the primary focus of this study was on improving or replacing ITE rate estimates used in trip generation analysis, some of the research and interviews that staff conducted for this study introduced a wide variety of policy concepts integrally tied to the question of better trip generation analysis. Indeed, our interviewees made it clear that trip generation analysis does not exist in a vacuum. Methods that improve on ITE rates, in particular, frequently rely on data generated by local, regional, or state policy frameworks. And in turn, improved trip generation analysis allows planners and elected officials to explore policy frameworks that may not have been possible under the traditional ITE regime. While an intensive analysis of policy measures was outside the scope of this study, staff look forward to continuing to explore these frameworks through another avenue in the future.
Implementing policy measures to support and supplement trip generation methodologies may be beneficial to many municipal and state planning departments. Introducing policy levers may help fill the gap for planning departments that face local resistance to best practices or have budget constraints. Our research revealed that parking supply is a major force in trip generation analyses. There is a strong connection between parking supply and the number of vehicle trips, and both research and interviews established a direct relationship between policies that manage parking supply and policies that manage vehicle trip generation.
Local data collection is a smart idea when developing locally calibrated tools, but its high cost can be an impediment for many municipalities. Interestingly, the ITE Urban and Person Trip Generation Panel disagrees with most of the interviewees, stating that “a person-trip data collection effort for most sites is still within a similar scale of effort (many hundreds of dollars) as a simple vehicle count (a few hundred dollars). At its most complex for a mixed-use site, person-trip generation surveys may require interviews at some access points to determine primary mode of travel” (2016). The differences between the Panel and our interviewees likely reflect differences between a relatively simple suburban environment and the complexity of an urban core.
There are many governance structures in the United States. In Massachusetts, planning governance is primarily located at the municipal level and is therefore highly fragmented. Strong leadership and political will are necessary elements in planning processes, but certain elements in its structural components are working against the state. Massachusetts is a home rule state where there is no comprehensive master plan to guide planning efforts. In Washington, DC, DDOT operates as the equivalent of a state agency, meaning it has some significant power over the process. On the other hand, MEPA review—which applies to large projects—is highly centralized in Massachusetts, with virtually all transportation impact assessments following guidelines promulgated by MassDOT and the Executive Office of Energy an Environmental Affairs. Changes in those centralized guidelines could resonate strongly across the region.
Interviewees expressed interest in sharing information across cities and curiosity about their counterparts’ work in this field. Most Boston-based interviewees agreed that there should be a unified approach to analyzing trip generation in the Inner Core area. One approach that would sidestep the complexity and expense of data collection and management is the policy-based approach described above, in which complex analysis is regarded as less important than planning to minimize factors that are likely to yield significant SOV mode share, first and foremost parking.
In the coming years, this research will inform and support a number of ongoing and upcoming efforts in the Boston region to improve the trip generation rates used to project travel by all modes. Some examples of such efforts include the following:
Together with MAPC and MassDOT, CTPS staff are analyzing data from approximately 30 developments to verify the accuracy of ITE trip generation rates. Locally collected travel monitoring data suggests high degree of variability relative to ITE rates. The group is working collaboratively with ITE and preparing locally collected travel data to be included in the upcoming edition of the Trip Generation Manual. Trip generation rates specific to the Boston region will give more confidence in regional development analysis. As part of this effort, CTPS modelers recently added five new land use classifications for greater precision. One project goal is to develop a database, based on state-specific data from a wide range of project types and land use classifications, to analyze new developments more accurately than existing methods.
Our interviewees from the Boston area expressed hope that the results of this study and the other ongoing research efforts would be helpful in their work to improve municipal development review processes. We concentrated interviews in municipalities where better accounting for non-SOV travel in trip generation analysis is important—those in the Inner Core, and in one instance (Framingham) a municipality with an urban core and suburban fringes, and a relatively high level of transit service.
Some municipalities do not generate their own trip generation estimates for development review and rely solely on the developer and its consultants to provide estimates (usually based on ITE rates). Others have rate estimates at the level of the entire municipality but expressed hope that the work carried out by the MPO, MAPC, MassDOT, and others could provide estimates at a more geographically exact level. Interviewees expressed enthusiasm about online, publicly available trip generation tools such as those developed in San Francisco and Washington, DC.
While some Boston Region MPO member municipalities are experimenting with improved approaches to trip generation analysis—such as Cambridge’s buildout of locally observed rates, or Boston’s use of the MXD method for PLAN: South Boston Dorchester Avenue Planning Initiative— staff capacity remains a major constraint for smaller municipalities. Provision of improved analysis methods or trip generation rates by a regional- or state-level agency could prove a major boon to development review practices in these municipalities. Availability of such tools could also make municipalities less dependent on the work of consultants, allowing municipal staff to negotiate the development process more confidently and from a place of knowledgeable, verified analytical rigor. It is our hope that this report represents the first step in creating a framework for ongoing analysis and research to provide the tools needed at both the state and local levels.
Bochner, Brian, Kevin Hooper, Benjamin Sperry, and Robert Dunphy. “National Cooperative Highway Research Program (NCHRP) Report 684: Enhancing Internal Trip Capture Estimation for Mixed-Use Developments.” Washington, DC. Transportation Research Board, 2011.
Boston Planning and Development Agency (BPDA). PLAN: South Boston Dot Ave. Accessed August 26, 2020.
http://www.bostonplans.org/planning/planning-initiatives/plan-south-boston-dorchester-ave.
Central Transportation Planning Staff (CTPS). “Unified Planning Work Program (UPWP) Federal Fiscal Year 2020.” Boston Region Metropolitan Planning Organization (MPO). Endorsed by the MPO on July 18, 2019. https://www.ctps.org/data/calendar/pdfs/2020/UPWP_0625_FFY20_UPWP_Full_Document_With_Amendment_Two_Redlined.pdf.
City of Cambridge. Code of Ordinances Title 10 - Vehicles and Traffic Chapter 10.17 - Vehicle Trip Reduction Ordinance. (Ord. 1139 (part), 1992). Version July 23, 2020. https://library.municode.com/ma/cambridge/codes/code_of_ordinances?nodeId=TIT10VETR_CH10.17VETRREOR.
City of Cambridge. Code of Ordinances Title 10 - Vehicles and Traffic Chapter 10.18 - Parking and Transportation Demand Management Planning; Parking Space Registration. Version July 23, 2020. https://library.municode.com/ma/cambridge/codes/code_of_ordinances?nodeId=TIT10VETR_CH10.18PATRDEMAPLPASPRE.
City of Cambridge. Parking and Transportation Demand Management Ordinance. Accessed August 17, 2020. https://www.cambridgema.gov/CDD/Transportation/fordevelopers/ptdm.
City of New York, Mayor’s Office of Environmental Coordination. “Chapter 16-Transportation.” CEQR Technical Manual. 2014 Edition. http://www.nyc.gov/html/oec/downloads/pdf/2014_ceqr_tm/16_Transportation_2014.pdf.
Currans, Kristina M. “Issues in Trip Generation Methods for Transportation Impact Estimation of Land Use Development: A Review and Discussion of the State-of-the-Art Approaches.” Journal of Planning Literature 32, no. 4 (2017): 335-345.
https://doi.org/10.1177/0885412217706505.
Currans, Kristina M. and Kelly J. Clifton. “Using Household Travel Surveys to Adjust ITE Trip Generation Rates.” Journal of Transport and Land Use 8, no. 1 (2015): 85-119.
https://doi.org/10.5198/jtlu.2015.470.
District Department of Transportation (DDOT). “About.” TripsDC. Accessed August 2020.
https://tripsdc.org/.
District Department of Transportation (DDOT). “Guidance for Comprehensive Transportation Review.” Version 1.0. June 2019. https://ddot.dc.gov/sites/default/files/dc/sites/ddot/publication/attachments/CTR%20Guidance%20-%20June%202019%20Version%201.0.pdf.
Ewing, Reid. “Research You Can Use: Traffic Generated by MXD” Planning April 2011. pp 48-49. American Planning Association. Chicago.
Ewing, Reid, Michael Greenwald, Ming Zhang, Jerry Walters, Robert Cervero, Lawrence Frank, Senait Kassa, and John Thomas. “Traffic Generated by Mixed-Use Developments – A Six- Region Study Using Consistent Built Environmental Measures.” Journal of Urban Planning and Development 137, no.3 (September 2011): 248-61.
https://doi.org/10.1061/(ASCE)UP.1943-5444.0000068.
Fehr & Peers. “mxd+” Accessed August 2020. https://www.fehrandpeers.com/mxd/.
Governor’s Office of Planning and Research, State of California. “SB 743 Frequently Asked Questions,”
https://opr.ca.gov/ceqa/updates/sb-743/faq.html#lead-agencies-requirements.
Governor’s Office of Planning and Research, State of California. “Technical Advisory on Evaluating Transportation Impacts in CEQA,” December 2018. https://opr.ca.gov/docs/20190122-743_Technical_Advisory.pdf.
Hardy, Daniel, Eric Graye, and Caleb Van Nostrand. “Facilitating Smart Growth with Context-Sensitive Transportation Review of Site Development.” Transportation Research Record 2672, no. 3 (December 2018): 46–55. https://doi.org/10.1177/0361198118788191.
Henson, Jamie, Westrom, Ryan; Chamberlain, Anna; Rogers, Jonathan; Dock, Stephanie; Kilim, Giri; Paradkar, Raj; Ridgway, Matthew; Bottigheimer, Nat; Watten, Mackenzie; Bakhru, Anjuli; Ziebarth, Jennifer; Kao, Michael. “DDOT MXD+ Method Development Report,” September 2015.
Corporate Creators: CH2M Hill, inc.; District of Columbia Department of Transportation; Fehr & Peers.
https://rosap.ntl.bts.gov/view/dot/30949.
Institute of Transportation Engineers (ITE). “Trip and Parking Generation.” Technical Resources. Accessed August 2020.
https://www.ite.org/technical-resources/topics/trip-and-parking-generation/.
Institute of Transportation Engineers (ITE). “Urban and Person Trip Generation” White Paper. Prepared by ITE Urban and Person Trip Generation Panel (Panel members: McCourt, Randy, Brian Bochner, Stephanie Dock, Kelly Clifton, Kristi Currans, Patrick Gibson, Daniel Hardy, Lee-Jung Kim, Don Samdahl, Gary Sokolow, Garrett Donaher, Kevin Hooper, and Lisa Tierney).
(October 2016): 1-6.
https://www.ite.org/pub/?id=a3b0272a%2Daa7e%2D11a2%2D45b9%2D51f2353dd32e.
Massachusetts Department of Environmental Protection (MassDEP). “Massachusetts Rideshare Program- Guidance on Complying with the Regulation.” Revision 2019. Accessed September 2020. https://www.mass.gov/doc/guidance-on-complying-with-the-massachusetts-rideshare-regulation/download.
Millard-Ball, Adam. “Phantom Trips: Overestimating the Traffic Impacts of New Development.” Journal of Transport and Land Use 8, no. 1 (2015): 31-49. https://doi.org/10.5198/jtlu.2015.384.
Montgomery County Planning Department, “Local Area Transportation Review Guidelines,” Fall 2017. The Maryland-National Capital Park and Planning Commission. Silver Spring, Maryland.
https://montgomeryplanning.org/wp-content/uploads/2017/12/LATR-Guidelines-Production-Final_122017-PRODUCTION-WEB.pdf.
Nguyen, Jessica and Tina Yuen. “How Measuring Vehicle Miles Traveled Can Promote Health Equity.” ChangeLab Solutions. 2019. https://www.changelabsolutions.org/sites/default/files/2019-10/CLS-BG216-VMT_GUIDE_FINAL_v05-ACCESS_20191015.pdf.
Porter, Christopher, Dan Hardy, Jeremy Goldstein, Rob Schiesel, and Peter Kaufmann. “Trip Generation and Data Analysis Study,” September 2015. Corporate Authors: District Department of Transportation; Cambridge Systematics, Incorporated; Renaissance Planning Group; Gorove/Slade Associates.
http://d92016.eos-intl.net/eLibSQL14_D92016_Documents/FR1_DCDOT_TripGen_Report_Oct15_complete.pdf.
San Francisco County Transportation Authority. SF Travel Demand. Website version: 0.3.2. Data version: 0.3. Accessed August 2020. https://sftraveldemand.sfcta.org/.
San Francisco Planning Department. Transportation Impact Analysis Guidelines for Environmental Review. February 2019. Updated October 2019. https://sfplanning.org/project/transportation-impact-analysis-guidelines-environmental-review-update#impact-analysis-guidelines.
San Francisco Planning Department. Transportation Sustainability Program. Accessed September 16, 2020.
https://sfplanning.org/transportation-sustainability-program.
United States Environmental Protection Agency (U.S. EPA). “Mixed-Use Developments Trip Generation Tool (Excel),” 2014. https://www.epa.gov/sites/production/files/2014-07/mxd_trip_generation_model.xlsx.
United States Environmental Protection Agency (U.S. EPA). “Mixed-Use Trip Generation Model.” Updated December 2019. https://www.epa.gov/smartgrowth/mixed-use-trip-generation-model.
Walters, Jerry, Brian Bochner, and Reid Ewing. “Getting Trip Generation Right: Eliminating the Bias Against Mixed Use Development.” American Planning Association. PAS Memo. (May 2013): 1-14. https://www.planning.org/publications/document/9139902/.
MPO staff conducted interviews for this study with the following people. We thank them for their time.
Name |
Affiliation |
Alison Felix |
MAPC |
Chris Porter |
Cambridge Systematics |
Alex Rixey |
Fehr & Peers |
Erika Jerram |
City of Framingham, MA |
Eric Graye |
Montgomery County, Maryland Planning Department |
Stephanie Groll |
City of Cambridge, MA |
Jamie Henson |
Kittelson Associates |
Alaa Mukahhal |
Boston Transportation Department |
Jim Fitzgerald |
BPDA |
Joseph Blankenship |
BPDA |
Laura Weiner |
Town of Watertown, MA |
Adam Schulman |
City of Cambridge, MA |
Jenny Delumo |
San Francisco Planning Department |
Aaron Zimmerman |
DDOT |
Stephanie Dock |
DDOT |
Lionel Lucien |
MassDOT |
Catrina Meyer |
MassDOT |
Jay Monty |
City of Everett, MA |
Jen Roberton |
NYC Mayor's Office of Sustainability |
In addition, the following CTPS staff lent their time and patience to this study:
Ed Bromage
Drashti Joshi
Marty Milkovits
1 As discussed later in the report, travel demand modeling can itself also serve as an alternative method for developing trip generation rates, especially for large-scale projects.
2 Internal trip capture is defined as the percentage of total trips (normally, but not always, vehicle trips when used for typical traffic impact studies) that are made internally to the development without using roads that are external to the site being analyzed. The internal trip capture is most frequently expressed in terms of a percentage or rate, but can be described in other forms such as equations (Bochner et al 2011).
3 Washington, DC; New York City; San Francisco, California; and Cambridge, Massachusetts.
4 NCHRP Report 684, “Enhancing Internal Trip Capture Estimation for Mixed Use Developments,” analyzed internal-capture relationships of MXD sites and examined the travel interactions among six individual types of land uses: office, retail, restaurant, residential, cinema, and hotel. The product of the study is a series of tables and spreadsheets that balance and apply the discovered use-to-use visitation percentages to the land uses within the project site under study. The interaction percentages are then used to discount ITE trip-generation rates and to reduce what would otherwise represent the number of trips entering and leaving the entire site (Walters, Bochner and Ewing 2013).
5 https://www.nap.edu/catalog/22458/trip-generation-rates-for-transportation-impact-analyses-of-infill-developments
8 Because the HIS data cover suburban areas as well as the core city, the CEQR Technical Manual recommends it only be used in consultation with NYCDOT staff.
9 Proponents may only use this option in consultation with NYCDOT staff.