Technical Memorandum
DATE: September 20, 2018
TO: Boston Region Metropolitan Planning Organization
FROM: Michelle Scott and Anne McGahan, MPO Staff
RE: CMAQ Program Performance Targets
This memorandum discusses federally required performance measures, targets, and related requirements for the federal Congestion Mitigation and Air Quality Improvement (CMAQ) Program. CMAQ performance measures pertain to
Boston Region Metropolitan Planning Organization (MPO) staff recommends that the Boston Region MPO take action to adopt the performance targets described herein at the September 20, 2018, MPO meeting.
A series of federal rules designed to focus the federal surface transportation program on achieving performance outcomes was initiated under the Moving Ahead for Progress in the 21st Century (MAP-21) legislation and continued under the Fixing America’s Surface Transportation (FAST) Act.1 These rules identify performance measures that relate to goals for the nation’s highway and transit systems and define state, MPO, and transit provider roles and responsibilities with respect to performance management. The set of federally required performance measures for highway systems include a set of measures to be used to assess progress toward achieving the goals of the CMAQ Program. This federal funding program provides states and MPOs with funds for transportation investments that contribute to air quality improvements and provide congestion relief. Examples of CMAQ-funded projects include roadway and intersection improvements that address congestion chokepoints and help reduce vehicle idling, and bicycle and pedestrian paths that enhance travel for non-motorized modes. The National Performance Management Measures rule—23 Code of Federal Regulations (CFR) Part 490—identifies traffic congestion and emissions reduction performance measures that pertain to the CMAQ Program, which are shown in Table 1.
Table 1
Congestion Mitigation and Air Quality Improvement (CMAQ) Program Performance Measures
Topic Area |
Performance Measure |
Applicable Geographic Area |
Traffic congestion |
Percent of non-SOV travel |
Boston Urbanized Area |
|
|
|
Traffic congestion |
Annual hours of peak hour excessive delay (PHED) per capita for travel on the NHS system |
Boston Urbanized Area |
|
|
|
Emissions reduction |
Total emissions reduction for applicable pollutants and precursors for CMAQ-funded projects in designated nonattainment and maintenance areas |
Air Quality Nonattainment or Maintenance Areas in the Boston Region MPO area |
NHS = National Highway System. SOV = single-occupancy vehicle.
States and MPOs are responsible for setting targets for the emissions reduction measure if they contain or overlap areas that are designated as not attaining EPA standards for criteria air pollutants and precursors from mobile sources (also known as nonattainment areas)2; or if they contain or overlap areas that have a history of being in nonattainment of these standards such that air quality monitoring and standard conformity processes must be carried out (also known as maintenance areas).
States are responsible for participating in target setting for the traffic congestion measures if 1) they have mainline highways on the National Highway System (NHS) that cross part of an urbanized area (UZA) with a population of more than one million; and 2) that UZA contains part of a nonattainment or maintenance area for relevant criteria pollutants.3 Similarly, MPOs must participate in target setting for the traffic congestion measures if 1) they have mainline highways on the NHS that cross part of an UZA with a population of more than one million; and 2) the part of the MPO area that overlaps the UZA contains part of a nonattainment or maintenance area for relevant criteria pollutants.
Based on a Federal Highway Administration (FHWA) applicability determination, the Boston Region MPO must participate in processes to set targets for and monitor all three CMAQ performance measures listed in Table 1.4 When this applicability determination was made in October 2017, the Boston region included—and still includes—an area (Waltham) designated as being in maintenance for air pollutant standards for carbon monoxide, one of the applicable EPA criteria pollutants. The Boston region also includes part of the NHS network in the Boston UZA, which includes portions of neighboring MPOs in Massachusetts, New Hampshire, and Rhode Island and exceeds the one million population threshold. Appendix 1 includes a map of the Boston UZA and lists the states and MPO areas that overlap the UZA.
The sections that follow discuss each of the measures in Table 1 in more detail and explain how the MPO meets the applicability criteria for addressing each set of CMAQ measures. These sections also describe existing or proposed targets for each set of measures, along with the processes and the data sources that were used to establish those targets.
State departments of transportation (DOTs) and MPOs that meet the aforementioned applicability criteria for traffic congestion measures must coordinate with one another to set single, unified targets for the entire UZA—as opposed to targets for areas covered by individual states and MPOs—and they must report those single, unified targets consistently to FHWA. Because it meets all relevant criteria, the Boston Region MPO is required to participate in these target-setting processes; meanwhile some states or MPOs in the UZA are encouraged, but not required, to participate in establishing targets.5 Other agencies in the Boston region that are required to participate in this traffic congestion target-setting process include the Massachusetts Department of Transportation (MassDOT), the New Hampshire Department of Transportation (NH DOT), and the Northern Middlesex Council of Governments. A full list of the agencies operating in the Boston UZA is available in Appendix 1.
The percent of non-SOV travel performance measure describes the extent to which people are using alternatives to single-occupancy vehicles; greater use of alternatives to SOVs may help reduce traffic congestion and air pollution from mobile sources. For this first FHWA-designated performance period, which lasts from calendar year (CY) 2018 through 2021, states and MPOs in the Boston UZA must set
States and MPOs can measure non-SOV travel using one of three data sources:
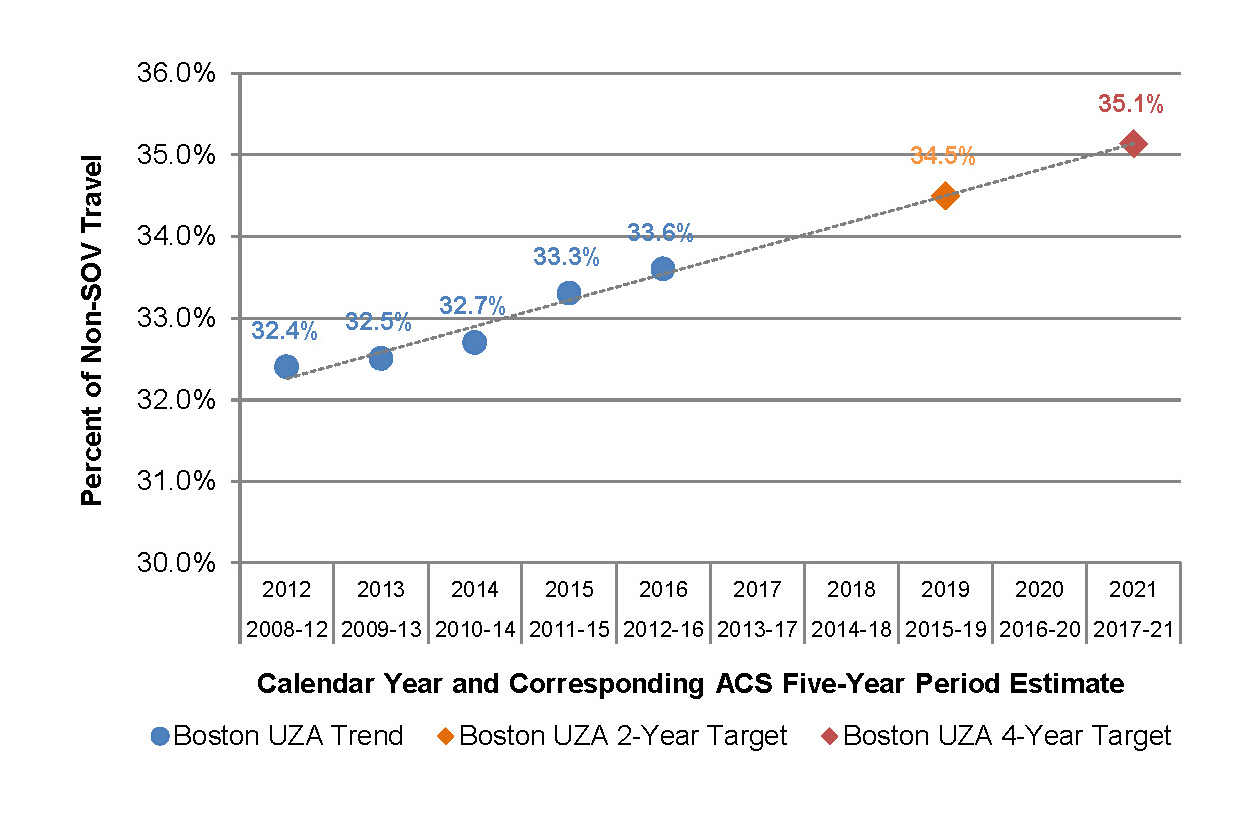
Targets for the Boston UZA were established using ACS five-year period estimates of the percent of workers age 16 and older who commuted to work using an option other than driving alone. These ACS five-year period estimates are constructed as rolling annual averages. Appendix 2 shows estimates of the share of workers age 16 and older who used various commuting options, based on ACS data. Figure 1 shows how the percentage of workers using non-SOV commuting options in the Boston UZA has increased between 2012 (2008–12 ACS estimate) and 2016 (2012-16 ACS estimate). MassDOT calculated a linear trend line using these values for the Boston UZA and used that trend line to project expected values as of the end of CY 2019 (the expected 2015–19 ACS estimate) and CY 2021 (the expected 2017–21 ACS estimate). MassDOT and NH DOT selected these projected values as the Boston UZA targets for the percent of non-SOV travel, and established targets for the UZA.
Figure 1
Historic Values and Targets for the Percent of Non-SOV Travel in the Boston UZA
ACS = US American Community Survey. SOV = single-occupancy vehicle. UZA = urbanized area.
Sources: US Census Bureau, 2012-16 American Community Survey Five-Year Estimates; MassDOT; and NH DOT.
The annual hours of peak hour excessive delay (PHED) per capita measure describes the amount of excessive delay that travelers experience per year from traveling on NHS roadways during peak travel periods. Weekday peak travel periods for the Boston UZA have been defined as 6:00 AM to 10:00 AM for the morning peak period and 3:00 PM to 7:00 PM for the evening peak period.7 This measure can be calculated using the following steps:
The computation process described above requires several types of data. Travel-time data for NHS segments is available in the National Performance Management Research Data Set (NPMRDS), which is used by federal agencies to monitor system performance. The NPMRDS also includes traffic volumes for the NHS, which originally come from volume data that state DOTs submit to the FHWA’s Highway Performance Monitoring System. FHWA provides state DOTs and MPOs with average vehicle-occupancy factors that can be used to convert vehicle volumes into estimates of the numbers of people traveling on the NHS.8 Finally, the US Census provides estimates of UZA populations that can be used to estimate per capita values.
For this first FHWA-designated performance period, which lasts from CY 2018 through 2021, states and MPOs in the Boston UZA are required to set a four-year target that reflects expected performance as pertains to the annual hours of PHED per capita measure as of the end of CY 2021. To understand baseline performance and set targets for this measure, MassDOT and NH DOT worked with analysts at Cambridge Systematics and, using NPMRDS data, calculated annual hours of PHED for travel on the NHS in their respective portions of the Boston UZA.9 Table 2 shows the results of this calculation for the entire Boston UZA for CY 2017. These results show that on average a person in the Boston UZA would experience 18.3 hours of excessive delay per year from traveling on the NHS during peak periods.
Table 2
Data Components: 2017 Annual Hours of
Peak Hour Excessive Delay Per Capita
Massachusetts and New Hampshire Annual PHED |
Boston UZA Population (MA and NH only)a |
Annual PHED Per Capita for the Boston UZA |
|
80,053,183 |
4,371,476 |
18.3 |
|
a Cambridge Systematics aggregated 2012-2016 ACS population estimates at the block group level to estimate the population for the portion of the UZA in Massachusetts and New Hampshire. They then inflated this estimate for 2017 by applying information on expected population growth in the Boston Metropolitan Statistical area between 2016 and 2017.
MA = Massachusetts. NH = New Hampshire. PHED = peak hours of excessive delay. UZA = urbanized area.
Sources: National Performance Management Research Data Set, FHWA, MassDOT, and NH DOT.
MassDOT and NH DOT only examined NPMRDS travel-time data from CY 2017 when developing targets for the PHED measure because NPMRDS data sets from prior years (Version 1 data) were assembled by different data collection methods than the 2017 data set (Version 2 data).10 Other features of the data sets differ as well. FHWA provided guidance to states and MPOs stating that that because there are differences between Versions 1 and 2 of the NPMRDS, using multiple years of data to set targets may not be the best approach, especially for four-year targets. FHWA added that multiple years of NPMRDS data will be available for when states and MPOs revisit their targets in the future.11 For this initial round of target setting, MassDOT and NH DOT elected to set both a two-year target (reflecting performance as of the end of CY 2019) and a four-year target (reflecting performance as of the end of CY 2021) equal to the 2017 baseline value—18.3 annual hours of PHED per capita—and established these targets for the UZA.
Table 3 summarizes the targets for the traffic congestion measures for the Boston UZA: annual hours of peak hour excessive delay per capita and the percent of non-SOV travel.
Table 3
Summary of CMAQ Traffic Congestion Targets for the Boston UZA
CMAQ Traffic Congestion Performance Measure |
Baseline Years and Data |
Baseline Value |
Two Year Target (CYs 2018–19) |
Four-Year Target (CYs 2018–21) |
Percent of non-SOV travel |
ACS data available in 2017 |
33.6% |
34.5% |
35.1% |
|
|
|
|
|
Annual hours of PHED per capita |
2017 NPMRDS and other data and estimates |
18.3 |
18.3 |
18.3 |
ASC = US American Community Survey. CMAQ = Congestion Mitigation and Air Quality. CY = calendar year. NPMRDS = National Performance Management Research Data Set. PHED = peak hours of excessive delay. UZA = urbanized area.
Sources: NPMRDS, FHWA, MassDOT, NH DOT, and ACS.
The CMAQ emissions reduction performance measure focuses specifically on the impacts of CMAQ investments in areas that do not meet air quality standards (nonattainment areas), or that have not met them in the past (maintenance areas).This measure examines the total daily kilograms of emissions reduction of mobile source pollutants or precursors—including carbon monoxide (CO), nitrogen oxides (NOx), volatile organic compounds (VOCs), and particulate matter (PM10 and PM2.5)—for CMAQ-funded projects in nonattainment and maintenance areas.
State DOTs and MPOs set targets for this measure using estimated daily emissions reduction for transportation projects in nonattainment or maintenance areas reported in the CMAQ Public Access System for a given set of federal fiscal years (FFYs). These targets focus on the pollutants or precursors for which designated areas are in nonattainment or maintenance status. For this first federal performance-monitoring period, applicable states and MPOs will set
FHWA requires states and MPOs to establish baseline emissions reduction values by identifying the emissions reduction for applicable pollutants and precursors that is associated with CMAQ-funded projects programmed and obligated for funding in nonattainment or maintenance areas between FFYs 2014 and 2017. For the Boston Region MPO, applicable projects would include CMAQ-funded projects implemented in the MPO’s carbon monoxide maintenance area in Waltham. The Boston Region MPO and MassDOT have not programmed any CMAQ-funded projects in Waltham in the Transportation Improvement Program (TIP) and State TIP (STIP), respectively, between FFYs 2014 and 2017, so the baseline amount of carbon monoxide reduced by CMAQ-funded projects in this maintenance area during this period is zero kilograms per day. The MPO’s FFYs 2018–22 and FFYs 2019–23 TIPs do not include any CMAQ-funded projects in Waltham; therefore, MPO staff proposes to set the two-year and four-year carbon monoxide emissions reduction targets to zero kilograms per day. Table 4 summarizes this information.
Table 4
CMAQ Emissions Reduction Targets for the Boston Region MPO
Performance Measure |
Baseline Years and Data |
Baseline Value |
Two-Year Target (FFYs 2018-–19) |
Four-Year Target (FFYs 2018-–21) |
Daily kilograms of CO emissions reduction from CMAQ projects in Boston region nonattainment or maintenance areas |
FFYs 2014-17 data on obligated projects with CMAQ funding |
0 |
0 |
0 |
Note: A maintenance area for carbon monoxide is located in Waltham.
CMAQ = Congestion Mitigation and Air Quality. CO = carbon monoxide. FFY = federal fiscal year.
Sources: Boston Region MPO.
MPO staff requests that the Boston Region MPO vote to adopt the traffic congestion targets established for the Boston UZA to ensure that the UZA targets are reported consistently by all relevant states and MPOs in the UZA. Staff also requests that the MPO vote to adopt the carbon monoxide emissions reduction targets proposed for the Boston Region MPO area. The list below highlights next steps related to federally required CMAQ performance measures.
During this first federally determined performance period, the Boston Region MPO can coordinate with MassDOT, other state DOTs and MPOs, and other transportation planning partners to refine and improve coordination processes for setting targets and monitoring congestion. It can also work with these partners to identify and invest in projects, programs, and studies that reduce congestion, support mode shift, or improve air quality. For example, MPO staff is updating the LRTP Needs Assessment, which will identify roadway bottlenecks and congested locations, gaps in the bicycle pedestrian networks, and recommended studies and programs to address these issues. The MPO can choose to fund these recommendations and related projects when developing future LRTPs, TIPs, and Unified Planning Work Programs (UPWPs). In future years, the MPO can monitor its progress using both federally required measures as well as other performance measures related to congestion and air quality.
As discussed in Section 2, CMAQ traffic congestion targets must be set for urbanized areas. Table A-1 lists the states and MPOs that are required to participate in establishing targets for the UZA, along with the states and MPOs that are encouraged, but not required, to participate in this target-setting process. Figure A-1 shows the boundaries of the Boston UZA and the states and MPOs that overlap the UZA.
Table A-1
States and MPO Participation in CMAQ Traffic Congestion Target Setting for the Boston UZA
State or MPO |
Participation Type |
Massachusetts DOT |
Required to establish targets for the UZA |
New Hampshire DOT |
Required to establish targets for the UZA |
Boston Region MPO (Massachusetts) |
Required to establish targets for the UZA |
Middlesex Council of Governments (Massachusetts) |
Required to establish targets for the UZA |
Central Massachusetts MPO (Massachusetts) |
Encouraged to participate in target setting for the UZA, but not required to establish targets |
Merrimack Valley MPO (Massachusetts) |
Encouraged to participate in target setting for the UZA, but not required to establish targets |
Montachusett MPO |
Encouraged to participate in target setting for the UZA, but not required to establish targets |
Nashua Regional Planning Commission (New Hampshire) |
Encouraged to participate in target setting for the UZA, but not required to establish targets |
Old Colony MPO (Massachusetts) |
Encouraged to participate in target setting for the UZA, but not required to establish targets |
Rockingham Planning Commission (New Hampshire) |
Encouraged to participate in target setting for the UZA, but not required to establish targets |
Southeastern Massachusetts MPO (Massachusetts) |
Encouraged to participate in target setting for the UZA, but not required to establish targets |
CMAQ = Congestion Mitigation and Air Quality. DOT = Department of Transportation. MPO = Metropolitan Planning Organization. UZA = Urbanized Area.
Source: FHWA and Boston Region MPO.
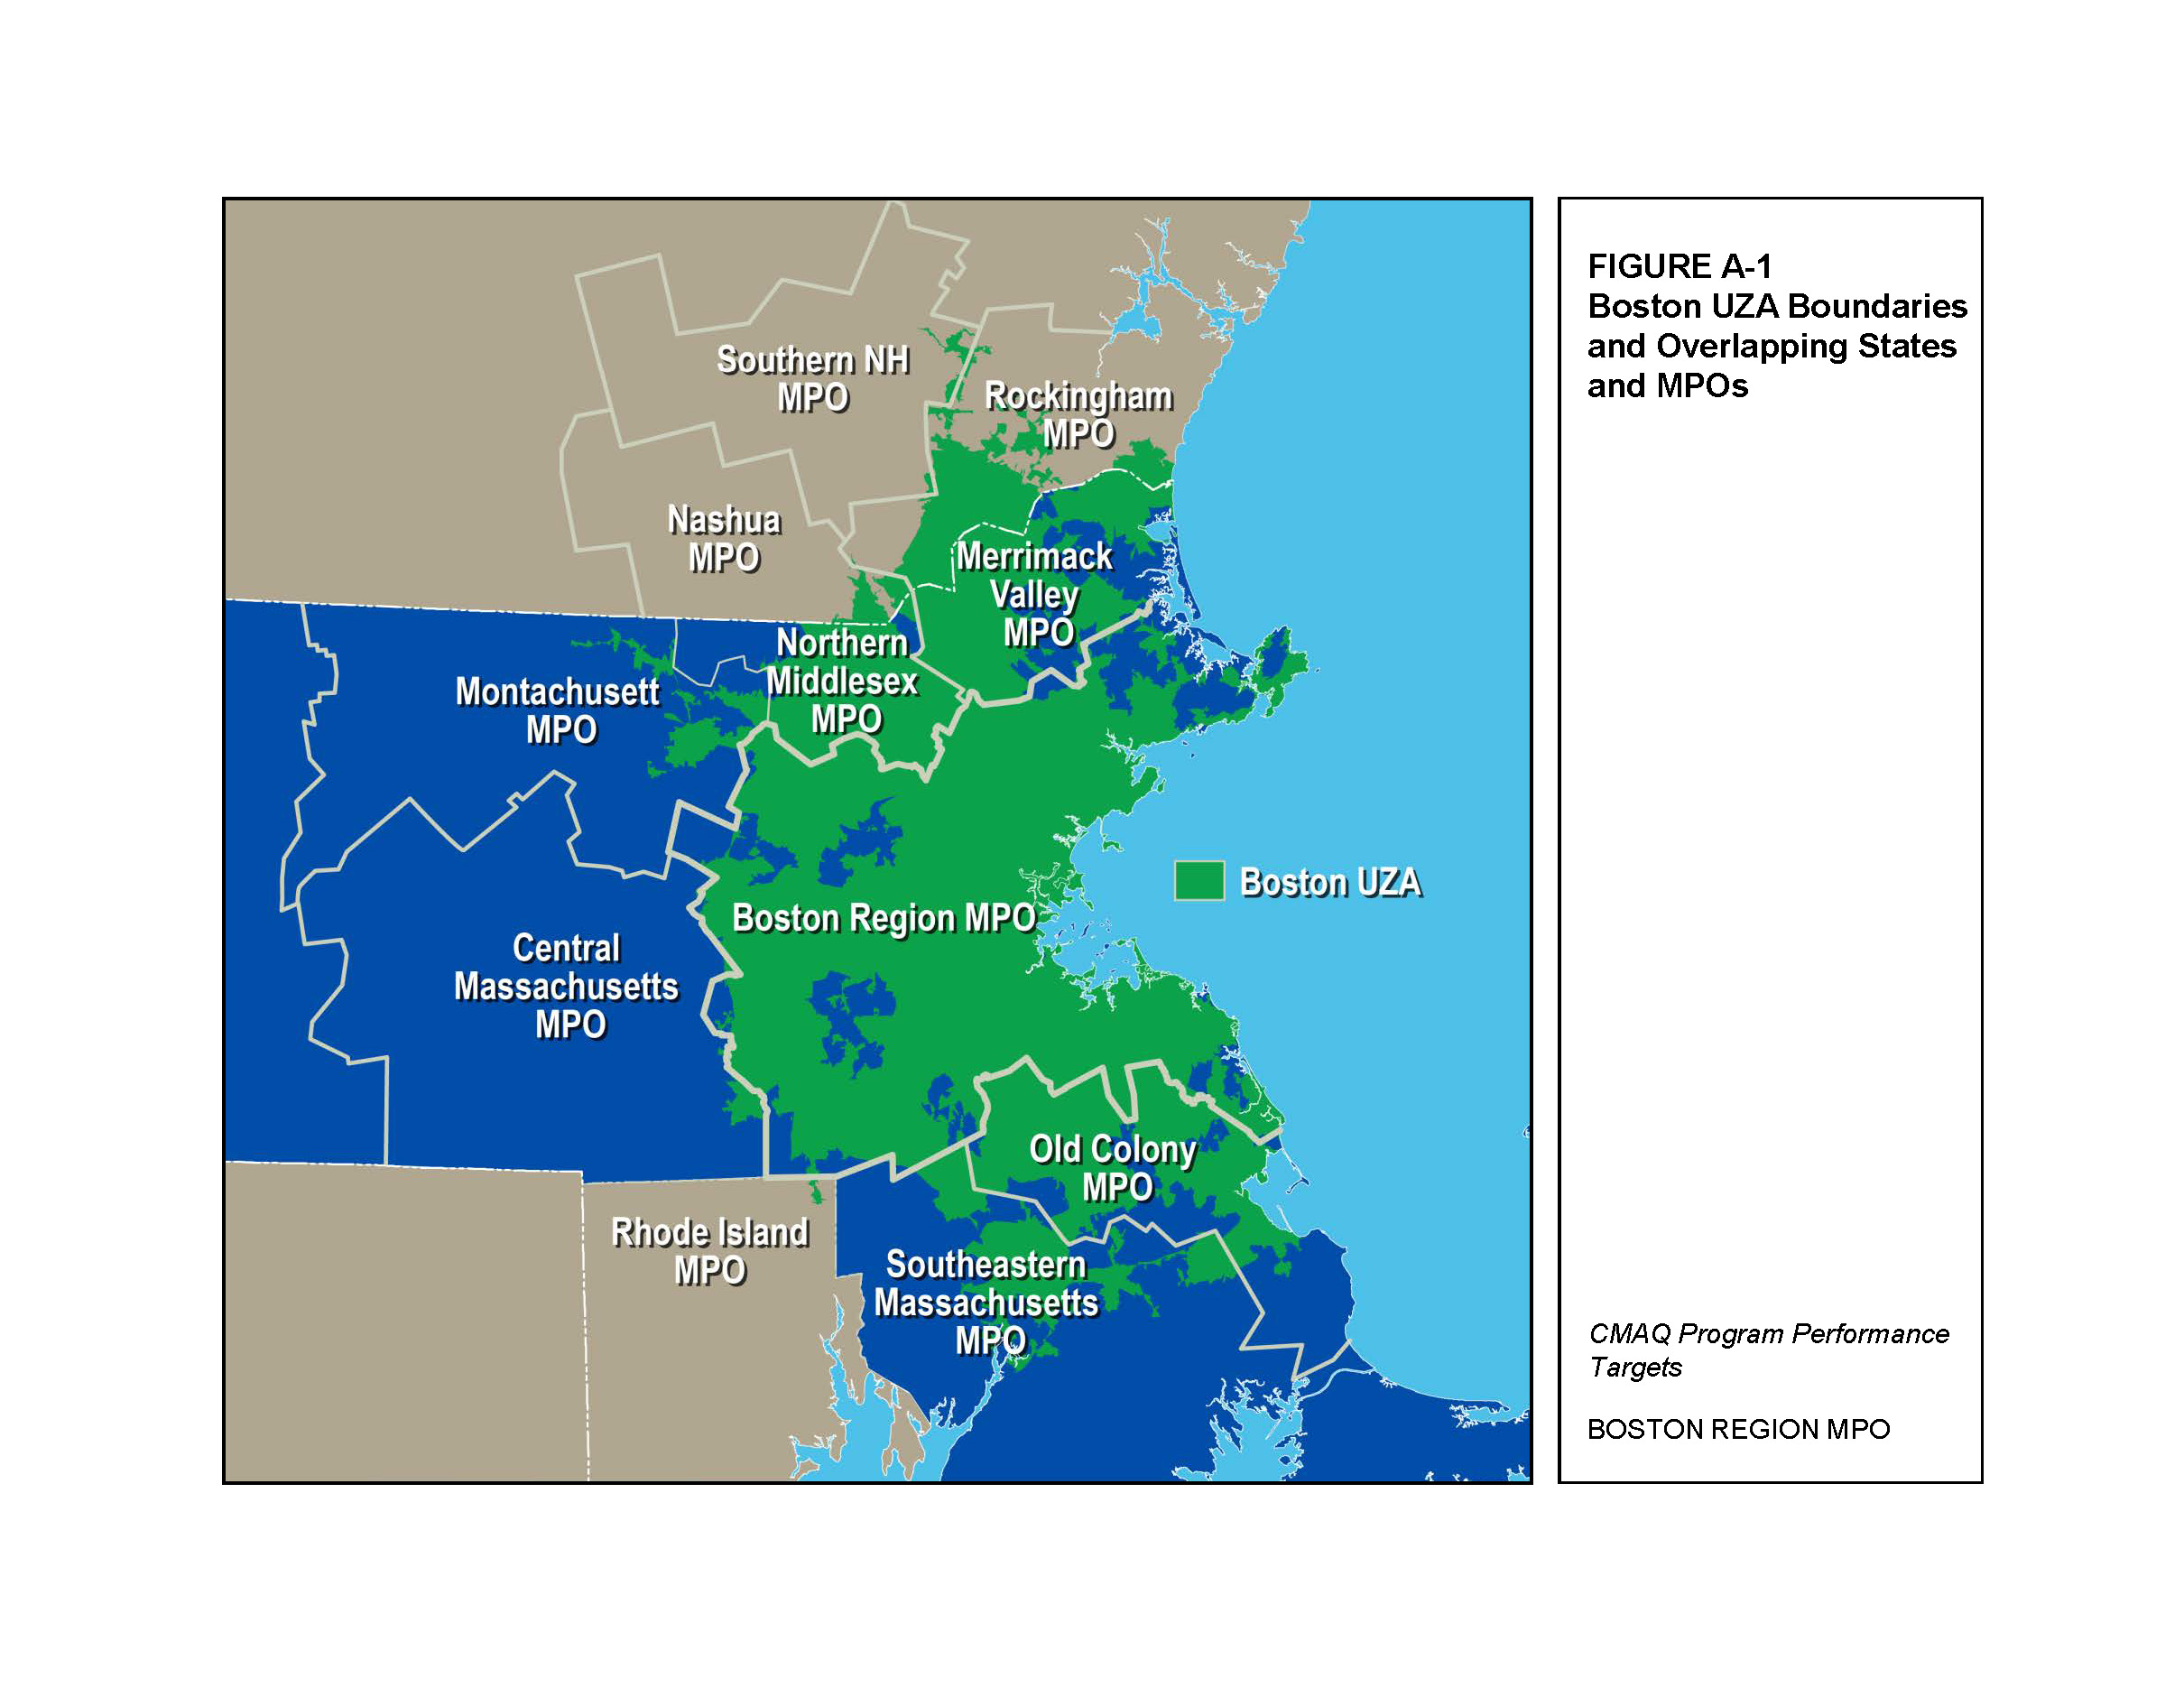
Table A-2 provides five-year American Community Survey (ACS) estimates of the shares of workers who chose various modes to travel to work in the Boston UZA. These five-year estimates come from ACS Table S0801, “Commuting Characteristics by Sex.”
Table A-2
Means of Commuting to Work in the Boston UZA: ACS Five-Year Estimates
Category |
2008–12 Five-Year Rolling Average |
2009–13 Five-Year Rolling Average |
2010–14 Five-Year Rolling Average |
2011–15 Five-Year Rolling Average |
2012–16 Five-Year Rolling Average |
Workers 16 years and over |
2,112,239 |
2,126,399 |
2,158,705 |
2,206,545 |
2,248,850 |
Means of Transportation to work |
n/a |
n/a |
n/a |
n/a |
n/a |
Drove alone |
67.6% |
67.5% |
67.3% |
66.7% |
66.4% |
Carpooled |
8.0% |
7.7% |
7.5% |
7.4% |
7.2% |
2-person carpool |
6.4% |
6.2% |
6.0% |
5.9% |
5.7% |
3-person carpool |
1.0% |
0.9% |
0.9% |
0.9% |
0.9% |
4-or-more person carpool |
0.6% |
0.6% |
0.6% |
0.6% |
0.6% |
Workers per car, truck, or van |
1.06 |
1.06 |
1.06 |
1.06 |
1.06 |
Public transportation (excluding taxicab) |
12.9% |
13.1% |
13.3% |
13.7% |
14.0% |
Walk |
5.5% |
5.6% |
5.5% |
5.6% |
5.6% |
Bicycle |
0.9% |
0.9% |
0.9% |
1.0% |
1.0% |
Taxicab, motorcycle, or other means |
0.9% |
0.9% |
1.0% |
1.1% |
1.2% |
Worked at home |
4.2% |
4.3% |
4.4% |
4.5% |
4.6% |
Notes: The table above includes American Community Survey estimates from Table S0801: “Commuting Characteristics by Sex” (available at https://factfinder.census.gov/faces/
tableservices/jsf/pages/productview.xhtml?pid=ACS_16_5YR_S0801&prodType=table). The full table for each set of five-year estimates, available at the aforementioned website, includes margins of error for the above estimates.
Source: US Census Bureau, 2012-16 American Community Survey Five-Year Estimates.
This table reflects the same estimates of the population of workers ages 16 and older and of the shares of these workers who reported commuting by driving alone or taking other options as in ACS Table DP03 “Selected Economic Characteristics,” which federal agencies will use to monitor performance for the share of non-SOV travel measure. Table S0801 differs mainly in that it provides more detail on commuters who carpooled or used other modes to get to work.
1 These rules pertain to performance-based planning and programming for CMAQ Program measures:
2A precursor is a chemical compound that reacts with other chemical compounds in the presence of solar radiation to form pollutants.
3 UZAs are defined by the US Census Bureau and represent the urban cores of metropolitan areas. For the first performance period designated by the Federal Highway Administration (calendar years 2018-22), UZAs must meet a population threshold of one million, but for future performance periods, the population threshold will be 200,000.
4FHWA, Applicability Determination: CMAQ Traffic Congestion and CMAQ On-Road Mobile Source Emissions Measures, 2017,
5FHWA, Applicability Determination: CMAQ Traffic Congestion and CMAQ On-Road Mobile Source Emissions Measures, 2017, pg. 34-5. See also: FHWA, Applicability Determination: CMAQ Traffic Congestion and CMAQ On-Road Mobile Source Emissions Measures (23 CFR 490.707 and 490.807), and FHWA, “Change Log: Applicability Determination for CMAQ Measures,” May 22, 2018,
6US American Community Survey, “Commuting Characteristics by Sex,” American Community Survey Five-Year Estimates,
accessed September 2, 2018.
7 FHWA requires states and MPOs to use the period from 6:00 AM to 10:00 AM for the morning peak period. When setting urbanized area targets, states and MPOs had the option of selecting either 3:00 PM to 7:00 PM or 4:00 PM to 8:00 PM to represent the evening peak period. MassDOT and NH DOT selected the period from 3:00 PM to 7:00 PM to represent the evening peak period for the Boston UZA. The Boston Region MPO also used 3:00 PM to 7:00 PM to represent the evening peak period in its Congestion Management Process.
8 Vehicle occupancy factors are described in FHWA’s Average Vehicle Occupancy Factors for Computing Travel Time Reliability Measures and Total Peak Hour Excessive Delay Metrics (April 2018),
www.fhwa.dot.gov/tpm/guidance/avo_factors.pdf,
accessed September 2, 2018.
9 Rhode Island was not included in the calculation of this measure because it does not include any portion of the Boston UZA’s NHS network. See FHWA’s Applicability Determination: CMAQ Traffic Congestion and CMAQ On-Road Mobile Source Emissions Measures (23 CFR 490.707 and 490.807), Change Log: Applicability Determination for CMAQ Measures,” May 22, 2018.
10 NPMRDS Version 1 data determined vehicle travel times by detecting vehicles passing a point at a fixed location. Point-based probes may record vehicles waiting at intersections or fail to record other vehicles. The current NPMRDS data set, Version 2, tracks individual vehicles passing through multiple segments, which eliminates challenges associated with single-point detection.
11 FHWA, “Frequently Asked Questions: Target Setting,”
https://www.fhwa.dot.gov/tpm/faq.cfm#targ, accessed September 14, 2018.