Fairmount Line Station-Access Analysis
An Assessment of the Safety and Comfort of Bicycle and Pedestrian Access to Five Fairmount Line Stations
Project Manager
Casey-Marie Claude
Project Principal
Mark Abbott
Data Analyst
Katrina Crocker
Graphics
Jane Gillis
Cover Design
Kim DeLauri
The preparation of this document was supported
by the Federal Highway Administration through
MPO Planning Contract #84053 and MPO and 5303 Planning Contract #84080.
Central Transportation Planning Staff
Directed by the Boston Region Metropolitan
Planning Organization. The MPO is composed of
state and regional agencies and authorities, and
local governments.
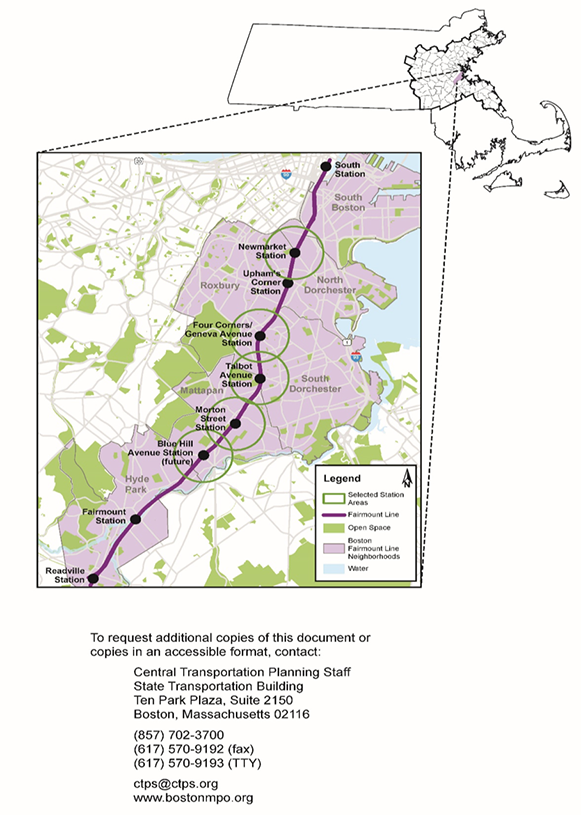
This report documents the existing bicycle and pedestrian travel conditions within a half-mile radius of five stations on the Massachusetts Bay Transportation Authority (MBTA) commuter rail Fairmount Line. The Fairmount Line is the only MBTA commuter rail branch that exclusively serves the City of Boston, traveling through its Downtown, South Boston, Roxbury, Dorchester, Mattapan, and Hyde Park neighborhoods. Apart from South Station, there are currently seven Fairmount Line stations, with plans to add an eighth. Including the planned station (Blue Hill Avenue), the eight stations on the line are Newmarket, Upham’s Corner, Four Corners/Geneva Avenue, Talbot Avenue, Morton Street, Fairmount, and Readville. Using the ActiveTrans Priority Tool (APT), five of these stations were selected for analysis: Newmarket, Four Corners/Geneva Avenue, Talbot Avenue, Morton Street, and Blue Hill Avenue. MPO staff traveled by foot and on bike through the five selected station areas along Boston Bike Network roadways and the Fairmount Greenway path, and noted the conditions of the bicycle and pedestrian environment. MPO staff assessed bicycle facilities, bike racks, pedestrian signals, sidewalks, curb ramps, detectable warnings, and pavement markings. This report presents staff’s assessments of the five station areas, followed by improvement recommendations, and cost estimates for each station area analyzed.
Four appendices are included at the end of this report:
1.1.6 Fairmount Line Planning Efforts
Fairmount Indigo Planning Initiative
Priority Corridor: Codman Square
Neighborhood Slow Streets: Talbot-Norfolk Triangle
Talbot-Norfolk Triangle Eco-Innovation District
Eco-Teens Talbot-Norfolk Triangle Walk Audit with WalkBoston
1.2.2 Infrastructure Considerations
Curb Ramps and Detectable Warnings
2.2 Four Corners/Geneva Avenue Station Area
2.2.1 Zoning and Selection Scores
2.3 Talbot Avenue Station Area
2.4 Morton Street Station Area
2.5 Blue Hill Avenue Station Area
3.2 Four Corners/Geneva Avenue
4.2 Four Corners/Geneva Avenue
5.2 Four Corners/Geneva Avenue
6.2 Four Corners/Geneva Avenue
7.2 Four Corners/Geneva Avenue
8.2 Four Corners/Geneva Avenue
table of tables PAGE
TABLE 2-1 Fairmount Line Station Area Prioritization Rankings
TABLE 2-2 Zoning in the Newmarket Station Area
TABLE 2-3 Newmarket Priority Ranking by Factor
TABLE 2-4 South Bay Development Trip Estimates
TABLE 2-5 Zoning in the Four Corners/Geneva Avenue Station Area
TABLE 2-6 Four Corners/Geneva Avenue Priority Ranking by Factor
TABLE 2-7 Zoning in the Talbot Avenue Station Area
TABLE 2-8 Talbot Avenue Priority Ranking by Factor
TABLE 2-9 Zoning in Morton Street Station Area
TABLE 2-10 Morton Street Priority Ranking by Factor
TABLE 2-11 Zoning in Blue Hill Avenue Station Area
TABLE 2-12 Blue Hill Avenue Priority Ranking by Factor
TABLE 5-1 Pedestrian Signals in the Newmarket Station Area
TABLE 5-2 Durations, Lengths, and Speeds of Pedestrian Crossings
near Newmarket
TABLE 5-3 Pedestrian Signals in the Four Corners/Geneva Avenue Station Area
TABLE 5-4 Durations, Lengths, and Speeds of Pedestrian Crossings near Four Corners/ Geneva Avenue
TABLE 5-5 Pedestrian Signals in the Talbot Avenue Station Area
TABLE 5-6 Durations, Lengths, and Speeds of Talbot Avenue Pedestrian Crossings
TABLE 5-7 Pedestrian Signals in the Morton Street Station Area
TABLE 5-8 Durations, Lengths, and Speeds of Morton Street Pedestrian Crossings
TABLE 5-9 Pedestrian Signals in the Blue Hill Avenue Station Area
TABLE 5-10 Durations, Lengths, and Speeds of Blue Hill Avenue
Pedestrian Crossings
TABLE 6-1 Narrow Sidewalks in the Newmarket Station Area
TABLE 6-2 Sidewalks in the Four Corners/Geneva Avenue Station Area
TABLE 6-3 Sidewalks in the Talbot Avenue Station Area
TABLE 6-4 Sidewalks in the Morton Street Station Area
TABLE 6-5 Sidewalks in the Blue Hill Avenue Station Area
TABLE 7-1 Newmarket Station Area Curb Ramps
TABLE 7-2 Four Corners/Geneva Avenue Station Area Curb Ramps
TABLE 7-3 Talbot Avenue Station Area Curb Ramps.
TABLE 7-4 Morton Street Station Area Curb Ramps
TABLE 7-5 Blue Hill Avenue Station Area Curb Ramps
TABLE 9-1 Bicycle Facility Cost Estimates
TABLE 9-2 Bicycle Rack Replacement Costs for the Five Fairmount Line
Station Areas
TABLE 9-3 Pedestrian Signals in Need of Countdown Displays.
TABLE 9-4 Crossings Too Long for Provided Crossing Time
TABLE 9-5 New Crossing Durations for Acceptable Speeds at Problematic Crossings
TABLE 9-6 Missing Curb Ramps in Fairmount Line Station Areas
TABLE 9-7 Missing Detectable Warnings and Estimated Costs
TABLE 9-8 Cost of Detectable Warnings at Missing Curb Ramp Locations
TABLE 9-9 Estimated Cost of Restriping Faded Crosswalks
table of figures PAGE
FIGURE 1-1 MBTA Fairmount Line Stations in City of Boston Neighborhoods
FIGURE 1-2 Selected Station Areas—MBTA Fairmount Line
FIGURE 2-1 MBTA Stations—Newmarket Station Area
FIGURE 2-2 Zoning Subdistricts—Newmarket Station Area
FIGURE 2-3 Bus Stops—Four Corners/Geneva Avenue Station Area
FIGURE 2-4 Zoning Subdistricts—Four Corners/Geneva Avenue Station Area
FIGURE 2-5 Zoning Subdistricts—Talbot Avenue Station Area
FIGURE 2-6 Zoning Subdistricts—Morton Street Station Area
FIGURE 2-7 Town of Milton—Blue Hill Avenue Station Area
FIGURE 2-8 Zoning Subdistricts—Blue Hill Avenue Station Area
FIGURE 3-1 Shared-Use Path and Bike Lane on Franklin Park Road
FIGURE 3-2 Existing Bicycle Facilities—Newmarket Station Area
FIGURE 3-3 Primary Facility Recommendations—Newmarket Station Area
FIGURE 3-4 Secondary Facility Recommendations—Newmarket Station Area
FIGURE 3-5 Fairmount Greenway—Newmarket Station Area
FIGURE 3-6 Existing Bicycle Facilities—Four Corners/Geneva Avenue Station Area
FIGURE 3-7 Primary Facility Recommendations—Four Corners/ Geneva Avenue
Station Area
FIGURE 3-8 Secondary Facility Recommendations—Four Corners/ Geneva Avenue Station Area
FIGURE 3-9 Fairmount Greenway Route—Four Corners/ Geneva Avenue
Station Area
FIGURE 3-10 Existing Bicycle Facilities—Talbot Avenue Station Area
FIGURE 3-11 Primary Facility Recommendations—Talbot Avenue Station Area
FIGURE 3-12 Secondary Facility Recommendations—Talbot Avenue Station Area
FIGURE 3-13 Fairmount Greenway—Talbot Avenue Station Area
FIGURE 3-14 Existing Bicycle Facilities—Morton Street Station Area
FIGURE 3-15 Primary Facility Recommendations—Morton Street Station Area
FIGURE 3-16 Secondary Facility Recommendations—Morton Street Station Area
FIGURE 3-17 Fairmount Greenway—Morton Street Station Area
FIGURE 3-18 Existing Bicycle Facilities—Blue Hill Avenue Station Area
FIGURE 3-19 Primary Facility Recommendations—Blue Hill Avenue Station Area
FIGURE 3-20 Secondary Facility Recommendations—Blue Hill Avenue Station Area
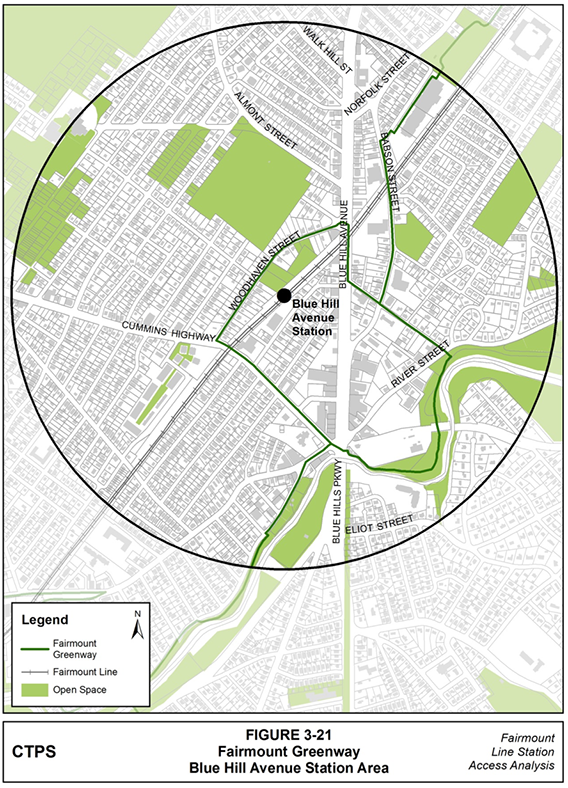
FIGURE 3-21 Fairmount Greenway—Blue Hill Avenue Station Area
FIGURE 4-2 Inverted U Bike Racks on Norwell Street—Four Corners/Geneva Avenue
FIGURE 4-3 Wave Bike Racks outside the Dorchester Arts Collaborative
FIGURE 4-4 Coat Hanger Bike Rack Outside the Geneva Avenue Inbound Platform
FIGURE 4-1 Bike Racks—Newmarket Station Area
FIGURE 4-5 Bike Racks—Four Corners/Geneva Avenue Station Area
FIGURE 4-6 Bike Racks—Talbot Avenue Station Area
FIGURE 4-7 Bike Racks—Morton Street Station Area.
FIGURE 4-8 Bike Racks—Blue Hill Avenue Station Area
FIGURE 5-1 Pedestrian Signals—Newmarket Station Area
FIGURE 5-2 Pedestrian Signals—Four Corners/Geneva Avenue Station Area
FIGURE 5-3 Pedestrian Signals—Talbot Avenue Station Area
FIGURE 5-4 Pedestrian Signals—Morton Street Station Area
FIGURE 5-5 Pedestrian Signals—Blue Hill Avenue Station Area
FIGURE 6-1 Debris on Puritan Avenue near Richfield Street
FIGURE 6-2 Narrow Sidewalk on Richfield Street
FIGURE 6-3 Overgrown Vegetation on Geneva Avenue.
FIGURE 6-4 Overgrown Vegetation between Browning Avenue and Kingsdale Street
FIGURE 6-5 South View of New England Avenue from Southern Avenue Intersection
FIGURE 6-6 New England Avenue Sidewalk between Southern Avenue
and Norfolk Street
FIGURE 7-1 Curb Ramps—Newmarket Station Area
FIGURE 7-2 Detectable Warnings—Newmarket Station Area
FIGURE 7-3 Curb Ramps—Four Corners/Geneva Avenue Station Area
FIGURE 7-4 Detectable Warnings—Four Corners/Geneva Avenue Station Area
FIGURE 7-5 Curb Ramps—Talbot Avenue Station Area.
FIGURE 7-6 Detectable Warnings—Talbot Avenue Station Area
FIGURE 7-7 Curb Ramps—Morton Street Station Area.
FIGURE 7-8 Detectable Warnings—Morton Street Station Area
FIGURE 7-9 Curb Ramps—Blue Hill Avenue Station Area
FIGURE 7-10 Detectable Warnings—Blue Hill Avenue Station Area
FIGURE 8-1 Faded Crosswalk Locations—Newmarket Station Area
FIGURE 8-2 Bike Boxes—Newmarket Station Area
FIGURE 8-3 Faded Crosswalk Locations—Four Corners/Geneva Avenue
Station Area
FIGURE 8-4 Faded Crosswalk Locations—Talbot Avenue Station Area
FIGURE 8-5 Faded Crosswalk Locations—Morton Street Station Area
FIGURE 8-6 Faded Crosswalk Locations—Blue Hill Avenue Station Area
appendixes PAGE
Appendix A—ActiveTrans Priority Tool and Fairmount Line Station Area Selection
Appendix B—Bicycle and Pedestrian Infrastructure Overview
The MBTA offers commuter rail service between Boston’s central business district (CBD) to Readville along its 9.2-mile Fairmount Line (see Figure 1-1). The line begins at South Station and passes through the Downtown, South Boston, Roxbury, Dorchester, Mattapan, and Hyde Park neighborhoods. Since 2012, the MBTA has opened three new stations as part of the Fairmount Line improvement program: Talbot Avenue, Newmarket, and Four Corners/Geneva Avenue, all located in Dorchester. These additions, along with the anticipated Blue Hill Avenue Station in Mattapan, are located outside of Boston’s CBD, as are the pre-existing stations: Readville (Readville/Hyde Park), Fairmount (Hyde Park), Morton Street (Mattapan), and Upham's Corner (Roxbury). The Fairmount Line is the only MBTA Commuter Rail Branch that exclusively serves the City of Boston.1
The Boston Region Metropolitan Planning Organization (MPO) conducted this study to build upon the Boston Redevelopment Authority (BRA)’s Fairmount Indigo Planning Initiative, a three-year study launched in February 2012.2 The Fairmount Line is located in some of Boston’s most disadvantaged neighborhoods,3 which for years only received rail service from Fairmount Line trains with high fare structures and infrequent stops.4 Approximately 132,000 residents live within a half mile of the Fairmount Line,5 which provides direct access to the center of downtown Boston, but inbound boarding totals for a typical weekday on the Fairmount Line from 2007 to 2013 were the lowest of all MBTA commuter rail lines.6 Poor access to public rail transportation in the communities surrounding the Fairmount Line has a long history; and these circumstances have established considerable barriers to economic opportunity for both residents and businesses.
The goal of the BRA’s Fairmount Indigo Planning Initiative was to identify ways in which the City of Boston could address the critical need for economic growth and physical improvement along the Fairmount Line.7 Through the planning initiative, the BRA considered short- and long-term strategies for encouraging public realm improvements and increase job access and capital investment along the corridor.8 Over the course of three years, the BRA completed a corridor plan as well as studies of the Upham’s Corner, Four Corners/Geneva Avenue, and Blue Hill Avenue station areas.9 The initiative is discussed in further detail below (Section 1-5).
The purpose of this Boston Region MPO study is to build upon the work of the BRA to improve non-motorized transportation options within the neighborhoods surrounding the Fairmount Line, specifically regarding the safety and comfort of residents walking and bicycling to Fairmount Line stations. To identify impediments to bicycle and pedestrian travel, the study assesses the environment within a half-mile radius of five selected Fairmount Line stations and provides recommendations for improving each station area.
FIGURE 1-1
MBTA Fairmount Line Stations in City of Boston Neighborhoods
The Fairmount Line initially opened in January 1855 as part of the Boston and New York Central Railroad “Midland Railroad.”10 The Town of Dorchester filed an injunction within six months of the line’s opening that halted the trains until the railroad removed all grade crossings in Dorchester.11 After service resumed in 1856, passenger service under various corporate entities continued uninterrupted along the line for 88 years.12 Passenger service was abandoned on the line in 1944 after competition from other transit modes reduced ridership, but freight operations continued to use the line.13
In 1979, construction along the Southwest Corridor—that runs from Back Bay Station to Forest Hills Station through the Back Bay, South End, Roxbury, and Jamaica Plain neighborhoods of Boston14—led the MBTA to restore passenger service on what is now the Fairmount Line when trains headed to South Station were redirected through Dorchester.15 In order to accommodate the renewed passenger service, infrastructure along the Dorchester Branch right-of-way was upgraded.16 The MBTA considered the Dorchester Branch a temporary service, and most passenger service was reassigned to the Southwest Corridor in 1987 upon completion of the Southwest Corridor project17, which developed recreational facilities and open space by creating the Southwest Corridor Park and provided mass transit by relocating the Orange Line along the Southwest Corridor.18 However, in spite of the MBTA’s intentions, public sentiment pushed for continued Dorchester Branch service.19 In response, MBTA Railroad Operation designed the “Fairmount Line” as a rail-based shuttle service between Readville and South Station to replace the service that had been rerouted to the Southwest Corridor.20
The Fairmount Line Feasibility Study, published in October 2002, was conducted to determine what upgrades to existing infrastructure were needed to maintain a state-of-good-repair on the Fairmount Line.21 The feasibility study proposed improvements to the Fairmount Line that could increase ridership and revenues, and simultaneously hope to alleviate overcrowding on buses along the Fairmount Corridor.22 The study presented six improvement packages—a “state of good repair plus” package, followed by packages one through five—that were designed for sequential implementation, with each package building upon earlier packages’ infrastructure and service improvements.23 After achieving a “state-of-good-repair plus” through the (sequentially) first package, package one recommends building four new passenger stations: Newmarket, Four Corners, Talbot, and Blue Hill Avenue.24 Package two recommends improving off-peak service frequencies, longer hours of service, and providing weekend service.25 Package three proposes improving peak service frequencies; package four suggests constructing an additional station at Columbia Road, plus implementing fares comparable to those paid for MBTA rapid transit service.26 The final proposal, package five, adds a free transfer to the Red Line from the Fairmount Line.27
In 2010, the MBTA released its Foxborough Commuter Rail Feasibility Study.28 The study’s purpose was to assess the feasibility of expanding service to the special-event rail station at Gillette Stadium in Foxborough to full-time commuter rail service.29 Three options for expanding service to Foxborough were proposed, two of which would change service on the Fairmount Line.30 Option B, called “Hybrid Service,” would extend some Fairmount trains approximately 13 miles to Foxborough.31 The report notes that Option B would require no new rolling stock (that is, locomotives, carriages, wagons, or other vehicles used on a railroad) and that it would have minimal impacts on existing service and equipment requirements.32 Option C, “Full Direct Service,” would extend all Fairmount service to Foxborough, with all of the station’s full-time commuter rail service operating along the Fairmount Line’s Dorchester Branch.33 Option C would require one new train set comprised of existing coaches and a new locomotive.34 The study states that Option C would have minor but noticeable impacts on existing service and equipment requirements.35
Talbot Avenue Station service began in November 2012 and service at the Newmarket and Four Corners/Geneva Avenue stations started on July 1, 2013.36 Though service had begun previously, the three stations officially opened together on July 17, 2013.37 Simultaneously, the MBTA launched a pilot program that moved Fairmount Station into Zone 1A,38 changing the price of traveling the Fairmount Line to match the cost to ride MBTA rapid transit service. The only station excluded from this price reduction was Readville Station, which remains in Commuter Rail Zone 2.39 For the same price as the MBTA's Monthly LinkPass, the Zone 1A Commuter Rail pass not only provides unlimited subway and local bus travel, but also unlimited express bus, Inner Harbor Ferry, and Zone 1A service.40 Lastly, on November 29, 2014, the MBTA began hourly weekend service on the Fairmount Line.41
Several studies and projects addressing the Fairmount Line have recently been completed or are currently underway. Each effort intends to improve conditions within the areas surrounding Fairmount Line stations.
As briefly discussed above, in February 2012, the BRA began the Fairmount Indigo Planning Initiative (FIPI), a three-year study, in order to identify short- and long-term strategies for improving the public realm, capital investment, and job access along the Fairmount Line.42 The study—which identified Fairmount Line corridor opportunities for transit access, commercial and residential development, community building initiatives, and public realm enhancements—will act as a foundation on which the City of Boston will build new quality-of-life improvements for the 132,000 residents who live within one-half mile of the Fairmount Line; it is the BRA’s largest planning study to date.4344 The FIPI included corridor-wide planning for the Fairmount Line and planning for the Upham’s Corner, Blue Hill Avenue/Cummins Highway, and Four Corners/Geneva Avenue station areas.45
The goal of the Fairmount Greenway Task Force (FGTF) is to create a nine-mile walking and biking urban greenway with an on-street-and-sidewalk route that loosely follows the Fairmount Line.46 The purpose of the greenway is to safely connect residents, visitors, commuters, and shoppers to neighborhood business districts, historic sites, and new and existing open space, including parks, schools, and community gardens.47 The concept behind the Fairmount Greenway emerged in 2008 and the FGTF was formed to implement it,48 with support from the Fairmount/Indigo Line Community Development Corporation (CDC) Collaborative.49 The Fairmount Greenway Concept Plan, created in March 2011, identified the Fairmount Greenway route, including both on-street and off-street pathway sections, along the Neponset River in Mattapan and Hyde Park.50
Vision Zero Boston, launched in December 2015, is the City of Boston’s commitment to make serious and fatal traffic crashes in Boston nonexistent by 2030, using proven techniques.51 Vision Zero Boston, through a partnership that includes the Boston Police Department, builds upon the belief that one travel-related fatality is too many.52 In order to achieve its goal, Vision Zero Boston promises to take action to reduce speeds and build safer streets, minimize distracted and impaired driving, engage with Bostonians directly about safety, hold itself accountable for results, and respond rapidly to fatalities.53 Two pilot projects that aim to address Vision Zero Boston’s promises are to be implemented within the Talbot Avenue station area.
The first Vision Zero pilot project within the Talbot Avenue station area addresses Codman Square as a priority corridor. The City of Boston used data collected from the Boston Police Department (BPD) and Emergency Medical Services (EMS) to identify Codman Square—including the segments of Talbot Avenue and Norfolk Street directly to the west of the intersection—and Massachusetts Avenue as the two initial Vision Zero Boston priority corridors.54 Vision Zero work along the Codman Square corridor in 2016 is expected to take the form of rapid implementation projects that will provide short-term improvements to the corridor.55
The second Vision Zero pilot project within the Talbot Avenue station area attempts to slow the streets in the Talbot-Norfolk Triangle. Neighborhood Slow Streets is a joint effort between the BPD and the Public Works Department to provide zone-based traffic calming on local streets.56 The City of Boston is piloting this program in 2016 in the Talbot-Norfolk Triangle and the Stonybrook neighborhood in Jamaica Plain, and intends to deploy both physical changes and visual cues to reduce driving speeds to 20 miles per hour from the default speed limit of 30 mph.57 Proposed transportation safety projects include building speed humps, restricting parking at key intersections to improve sight lines, and posting easily recognizable identification- and speed-limit signage at all entry points to the neighborhoods.58 Additional approaches for calming traffic may be used, such as road deviations (called chicanes), street art, raised crosswalks and intersections, neighborhood traffic circles, and curb extensions. After the pilot phase, City of Boston neighborhoods will be invited to apply to the program and will be selected based on objective criteria.59
The Talbot-Norfolk Triangle (TNT), bounded by Talbot Avenue, Norfolk Street, and the Fairmount Corridor, is located in the Codman Square area of Dorchester.60 The Eco-Innovation District is the first of its kind in Boston. The TNT Eco-Innovation District is creating a model for low-income urban neighborhoods to develop into equitable and environmentally sustainable communities.61 Subjects of interest to the TNT Eco-Innovation District include green infrastructure, energy retrofitting, local energy generation, and transit-oriented development (a type of development located within a half-mile of quality public transportation, characterized by a walkable neighborhood with a variety of amenities).62
The Fairmount Line’s Talbot Avenue Station is within the bounds of the TNT Eco-Innovation District.63 The station provides transportation options for local residents, 40 percent of whom work downtown.64 Although bus transportation into Boston’s CBD from the Talbot Norfolk Triangle can take more than an hour, the Fairmount Line transports passengers from Talbot Avenue Station to South Station in 19 minutes65 or as little as 12 minutes if stops are not requested at stations where the train is only scheduled to stop upon request.66 The construction of Talbot Avenue Station has increased TNT residents’ access to transportation and employment opportunities.
The Codman Square Neighborhood Development Corporation (NDC), part of the partnership that established the TNT Eco-Innovation District,67 hopes to create a sustainable, transit-oriented urban village in the TNT. As part of their efforts, the NDC established the Levedo Building, a mixed-use, transit-oriented development immediately adjacent to Talbot Avenue Station.68 The proximity of the Levedo Building to the Fairmont Line provides viable public transportation to key locations and encourages residents to access the station by foot or on bike. The Codman Square NDC is currently identifying more sustainable real-estate projects to further their efforts.69
In August 2015, a group associated with the Boston Project Ministries known as the Eco-Teens conducted walk audits of the TNT with WalkBoston.70 The Eco-Teens assessed 13 streets to offer recommendations for improving cleanliness and safety.71 While the Eco-Teens found considerable vegetation, friendly neighbors, sidewalks, and parking along both sides of most TNT streets, they also noted areas in which the TNT could improve.72 They cited the lack of traffic signals, absence of trashcans, presence of speeding traffic, poor quality and/or lack of crosswalks, and no apparent maintenance of vegetation.73 Traffic speeding and the lack of maintenance, crosswalks, and trash cans were the Eco-Teens’ greatest concerns for Talbot-Norfolk Triangle streets.74
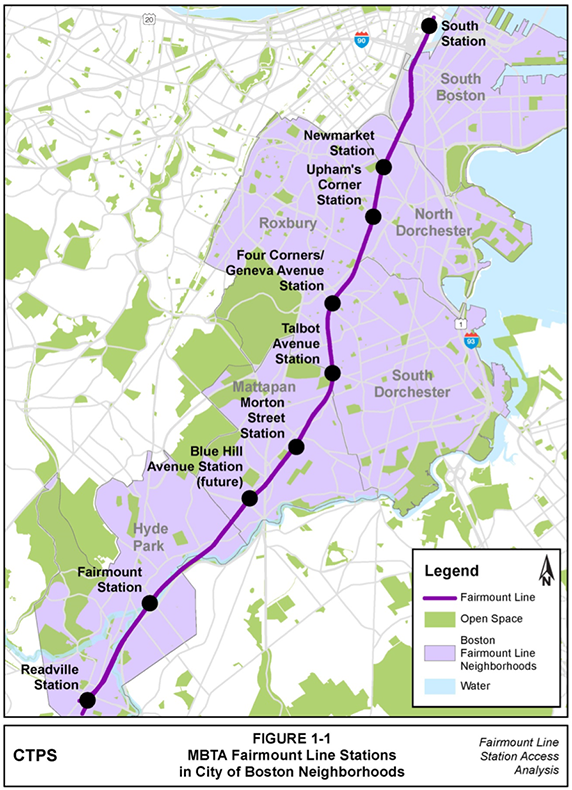
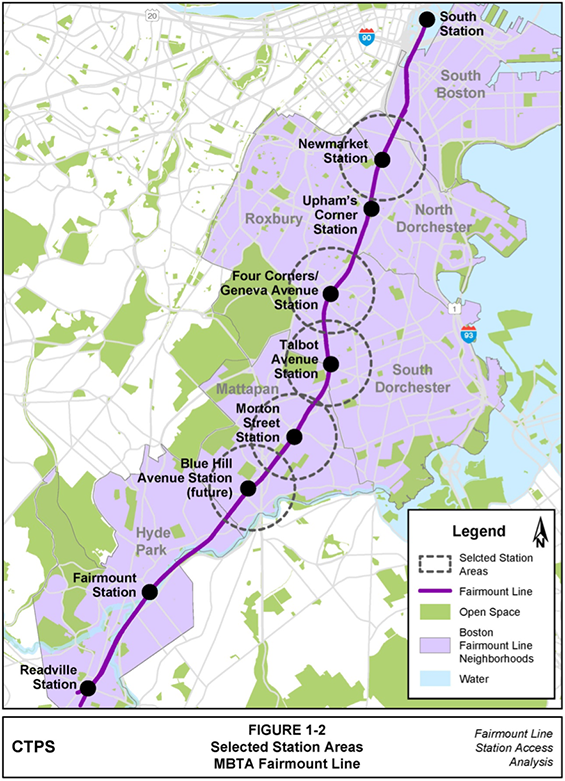
MPO staff used the APT to determine which five of the eight Fairmount Line stations outside of Boston’s CBD to study for possible bicycle and pedestrian improvements, in terms of both safety and comfort. The original project budget allowed for the assessment of four station areas, but additional funds from the deferment of a previously approved study made it possible to add a fifth station area to the evaluation. MPO staff selected the Newmarket, Four Corners/Geneva Avenue, Talbot Avenue, Morton Street, and Blue Hill Avenue station areas. An overview of the APT and the results it generated may be found in Appendix A.
Staff used the seven factors described below to select which Fairmount Line station areas were most in need of bicycle and pedestrian improvements.
Once the five station areas had been selected, MPO staff went into the field to observe existing conditions. Staff conducted station area assessments from August 2015 to December 2015.
Within the five selected Fairmount Line station areas, MPO staff biked or walked along each roadway segment that included existing or proposed bicycle facilities, as identified in the Boston Bike Network plan. Staff also traveled along the Fairmount Greenway path through each station area. These routes were chosen because of the current and future likelihood of bicyclist and pedestrian travel. The majority of conditions, measurements and observations were documented in the field, on maps and with photographs, although some information was gathered using existing data. Furthermore, MPO staff used resources such as Google Maps and Bing Maps to collect additional measurements and ensure accuracy. The descriptions of and specific details about the bicycle and pedestrian environment that MPO staff used in their considerations may be found in the Bicycle and Pedestrian Infrastructure Overview in Appendix B.
MPO staff evaluated several aspects of the bicycle and pedestrian environment near the five selected Fairmount Line stations, including bicycle facilities, bike racks, pedestrian signals, sidewalks, curb ramps, detectable warnings, and pavement markings. A brief overview of these assessments is provided below.
FIGURE 1-2
Selected Station Areas—MBTA Fairmount Line
While staff noted the conditions of bicycle facilities in the field where appropriate, such as where bike lane striping or shared-lane markings (also known as “sharrows”) had faded, MPO staff relied on the Boston Bike Network plan’s cataloguing of the location, status, and type of bicycle facilities in the city. Staff used Boston Bike Network plan data from October 22, 2015 to document where bicycle facilities are located in the five selected station areas and to identify the type of facility at each location. Staff also used the Boston Bike Network plan’s proposed bicycle facility information to document the future distribution of bicycle facility types in the Fairmount Line station areas. The different types of bicycle facilities are described in the Bicycle and Pedestrian Infrastructure Overview in Appendix B.
MPO staff looked for bike racks while out in the field, and confirmed the location and type of each bike rack using Google Maps. The Association of Pedestrian and Bicycle Professionals (APBP) identifies which bike racks are acceptable for all uses, which bike racks are well suited for high-density locations, and which bike racks should be avoided.75 MPO staff encountered several Inverted U (also Staple or Loop) and Post & Ring bike racks, both of which APBP has identified as being acceptable for all uses. MPO staff did not notice any of the racks that APBP classified as acceptable for high-density uses, but MPO staff observed a few instances of the unacceptable bike racks within the study areas. Specifically, these types of racks were the Wave (also Undulating or Serpentine), Schoolyard (also Comb or Grid), and Coat Hanger. MPO staff differentiated between acceptable and unacceptable bike racks in their documentation.
MPO staff noted the presence of pedestrian signals while in the field, and documented their characteristics when found. Staff noted whether the signals included countdown displays, as the Federal Highway Administration (FHWA)’s Manual on Uniform Traffic Control Devices (MUTCD) states that a pedestrian change interval of more than seven seconds should include a pedestrian change interval countdown display.76 Staff also determined whether the pedestrian crossing phases were concurrent with vehicular traffic or whether there was an exclusive pedestrian phase, and the amount of time the signals provided for pedestrians to cross. They used Google Maps to measure the length of the crossings for pedestrians and divided the measurements by the crossing time in order to determine the speed at which pedestrians would need to travel in order to complete the crossing in the time provided, using the 3.5-feet-per-second walking speed that the FHWA recommends for calculating crossing times.77 Staff also assessed whether the pedestrian intervals of the signals were accompanied by audible indications. The FHWA does not require pedestrian signals to provide information in non-visual formats such as audible tones, speech messages, or vibrating surfaces; however, the MUTCD includes guidance that, where engineering judgement determines it is appropriate, pedestrian signals should provide non-visual information formats.78
While conducting fieldwork MPO staff assessed the quality of sidewalks and noted whether sidewalks met FHWA width standards. According to federal guidelines, sidewalks should include a five-foot-wide pedestrian zone and a six-inch-wide curb zone, plus a two-foot-wide zone for light poles and signs so that they do not obstruct the paths of pedestrians.79 If trees are planted along a roadway, this zone should be expanded to four feet wide.80 In addition, if the sidewalk is bordered by a building, storefront, wall, or fence, then two and a half feet should be added to the sidewalk corridor as a frontage zone.81 The five-foot-wide pedestrian zone provides adequate space for a single wheelchair to turn around or two wheelchair users to pass one another.82
MPO staff marked the locations of curb ramps while in the field, and indicated their types: perpendicular, diagonal, apex, or median cut-through. Perpendicular curb ramps are aligned with the crossing direction on tight radius corners while diagonal curb ramps are located at the apex of an intersection corner. MPO staff differentiated between diagonal curb ramps and apex curb ramps by identifying curb ramps that served one crossing as diagonal and curb ramps that served two crossings as apex. They also noted where curb ramps should have been present but were missing (curb ramps were often identified as “missing” at locations where MPO staff observed crosswalks that led to curbs instead of curb ramps). Finally, they marked whether they observed detectable warnings at curb ramps and other transitions along sidewalks and public streets.
MPO staff noted pavement markings such as crosswalks, bike lanes, sharrows, and bike boxes when in the field. They indicated the type of crosswalk striping at crossings, noting whether the markings were transverse lines (standard), ladder, continental, or marked with an unconventional design. Staff also documented locations where markings had faded.
The next seven chapters of this report document the conditions that MPO staff observed when assessing the five Fairmount Line station areas selected for evaluation. Each chapter addresses a specific aspect of the five station areas, assessing each station area on the topic. The remaining chapters are as follows:
1 Fairmount Line Improvements; Massachusetts Bay Transportation Authority; <<http://mbta.com/about_the_mbta/t_projects/default.asp?id=14261>>.
2 Fairmount Indigo Planning Initiative; City of Boston Redevelopment Authority; 2016; <<http://www.bostonredevelopmentauthority.org/planning/planning-initiatives/fairmount-indigo-planning-initiative>>.
3 Fairmount Indigo Planning Initiative Corridor Plan; City of Boston Redevelopment Authority; September 2014; page 6.
4 Fairmount Indigo Planning Initiative Corridor Plan: Executive Summary; City of Boston Redevelopment Authority; September 2014; page 4.
5 Fairmount Indigo Planning Initiative; City of Boston Redevelopment Authority; <<http://www.bostonredevelopmentauthority.org/planning/planning-initiatives/fairmount-indigo-planning-initiative>>.
6 Ridership and Service Statistics (Fourteenth Edition); Massachusetts Bay Transportation Authority; July 2014; page 78 (Chapter 4, Page 7).
7 Fairmount Indigo Planning Initiative Corridor Plan; City of Boston Redevelopment Authority; September 2014; page 6.
8 Fairmount Indigo Planning Initiative; City of Boston Redevelopment Authority; <<http://www.bostonredevelopmentauthority.org/planning/planning-initiatives/fairmount-indigo-planning-initiative>>.
9 Ibid.
11 Ibid.
12 Ibid.
13 Ibid.
14 Southwest Corridor Park; Executive Office of Energy and Environmental Affairs of the State of Massachusetts; http://www.mass.gov/eea/agencies/dcr/massparks/region-boston/southwest-corridor-park.html.
15 Fairmount Line Feasibility Study; KKO and Associates, L.L.C., and HNTB Companies; Massachusetts Bay Transportation Authority Planning Department; October 16, 2002; page 2.
16 Ibid.
17 Ibid.
18 Southwest Corridor Park; Executive Office of Energy and Environmental Affairs of the State of Massachusetts; http://www.mass.gov/eea/agencies/dcr/massparks/region-boston/southwest-corridor-park.html.
19Fairmount Line Feasibility Study; KKO and Associates, L.L.C., and HNTB Companies; Massachusetts Bay Transportation Authority Planning Department; October 16, 2002; page 2.
20 Ibid.
21 Fairmount Line Improvements; Massachusetts Bay Transportation Authority; http://mbta.com/about_the_mbta/t_projects/default.asp?id=14261.
22 Ibid.
23 Fairmount Line Feasibility Study; KKO and Associates, L.L.C., and HNTB Companies; Massachusetts Bay Transportation Authority Planning Department; October 16, 2002; page 8.
24 Ibid.
25 Ibid.
26 Ibid.
27 Ibid.
28 Foxborough Commuter Rail Feasibility Study: Final Report; Jacobs Engineering Group, Ann S. Gailbraith, and Central Transportation Planning Staff (CTPS); Massachusetts Bay Transportation Authority (MBTA) and Massachusetts Executive Office of Housing and Economic Development; September 1, 2010; page 1.
29 Foxborough Commuter Rail Feasibility Study: Final Report; Jacobs Engineering Group, Ann S. Gailbraith, and CTPS; MBTA and Massachusetts Executive Office of Housing and Economic Development; September 1, 2010; page 3.
30 Foxborough Commuter Rail Feasibility Study: Final Report; Jacobs Engineering Group, Ann S. Gailbraith, and CTPS; MBTA and Massachusetts Executive Office of Housing and Economic Development; September 1, 2010; page 6.
31 Foxborough Commuter Rail Feasibility Study: Final Report; Jacobs Engineering Group, Ann S. Gailbraith, and CTPS; MBTA and Massachusetts Executive Office of Housing and Economic Development; September 1, 2010; page 7.
32 Foxborough Commuter Rail Feasibility Study: Final Report; Jacobs Engineering Group, Ann S. Gailbraith, and CTPS; MBTA and Massachusetts Executive Office of Housing and Economic Development; September 1, 2010; page 6.
33 Ibid.
34 Ibid.
35 Ibid.
36 Patrick Administration Opens Three New Fairmount Commuter Rail Stations; Kelly Smith; Massachusetts Bay Transportation Authority; July 17, 2013; http://www.mbta.com/about_the_mbta/news_events/?id=27077andmonth=andyear=.
37 Ibid.
38 Ibid.
39 Commuter Rail Fares and Passes; Massachusetts Bay Transportation Authority; http://www.mbta.com/fares_and_passes/rail/.
40 Fares and Passes; Massachusetts Bay Transportation Authority; http://www.mbta.com/fares_and_passes/passes/.
41 Gov. Patrick Announces Fairmount Line Service Upgrades; Cyndi Roy Gonzalez; Massachusetts Bay Transportation Authority; October 16, 2014; http://www.mbta.com/about_the_mbta/news_events/?id=6442453136.
42 Fairmount Indigo Planning Initiative; Boston Redevelopment Authority; http://www.bostonredevelopmentauthority.org/planning/planning-initiatives/fairmount-indigo-planning-initiative.
43 Ibid.
44 Ibid.
45 Ibid.
46 Fairmount Greenway Brochure; Michelle Moon; Fairmount Greenway Task Force; July 2015; page 2.
47 Fairmount Greenway Brochure; Michelle Moon; Fairmount Greenway Task Force; July 2015; page 2.
48 Fairmount Greenway (re)Visioning Workshop (PowerPoint Presentation); Michelle Moon; Fairmount Greenway Task Force; February 5, 2016; Slide 15.
49 Create a Fairmount Greenway; Fairmount Indigo CDC Collaborative; http://fairmountcollaborative.org/our-work/create-a-fairmount-greenway/.
50 Fairmount Greenway Concept Plan; Crosby, Schlessigner, and Smallridge (CSS) with Bryant Associates; Fairmount Greenway Task Force; March 2011; pages 20-21.
51 Overview; Vision Zero Boston; City of Boston; http://www.visionzeroboston.org/overview.
52 Overview; Vision Zero Boston; City of Boston; http://www.visionzeroboston.org/overview.
53 Overview; Vision Zero Boston; City of Boston; http://www.visionzeroboston.org/overview.
54 Focusing on the Issues; Vision Zero Boston; City of Boston; http://www.visionzeroboston.org/focusing.
55 Focusing on the Issues; Vision Zero Boston; City of Boston; http://www.visionzeroboston.org/focusing.
56 Stefanie Seskin; City of Boston Active Transportation Director; Boston Transportation Department; Personal Communication; February 18, 2016.
57 Ibid.
58 Ibid.
59 Ibid.
60 Ibid.
61 Talbot-Norfolk Triangle (TNT) Eco-Innovation District Brochure; David Queeley; page 1.
62 Talbot-Norfolk Triangle (TNT) Eco-Innovation District Brochure; David Queeley; page 1.
63 Talbot-Norfolk Triangle Eco-Innovation District One-Pager; David Queeley; page 1.
64 Talbot-Norfolk Triangle Eco-Innovation District One-Pager; David Queeley; page 1.
65 Fairmount Line Schedule Information; Massachusetts Bay Transportation Authority; http://www.mbta.com/schedules_and_maps/rail/lines/?route=FAIRMNT.
66 Talbot-Norfolk Triangle Eco-Innovation District One-Pager; David Queeley; page 1.
67 Talbot-Norfolk Triangle (TNT) Eco-Innovation District Brochure; David Queeley; page 1.
68 Talbot-Norfolk Triangle (TNT) Eco-Innovation District Brochure; David Queeley; page 1.
69 Talbot-Norfolk Triangle (TNT) Eco-Innovation District Brochure; David Queeley; page 1.
70 Eco-Teens Talbot Norfolk Triangle Walk Audit Report; Eco-Teens; WalkBoston; August 2015; page 2.
71 Ibid.
72 Ibid.
73 Ibid.
74 Eco-Teens Talbot Norfolk Triangle Walk Audit Report; Eco-Teens; WalkBoston; August 2015; page 3.
75 Essentials of Bike Parking: Selecting and Installing Bicycle Parking That Works; Association of Pedestrian and Bicycle Professionals (APBP); September 2015; pages 6-8.
76 Manual on Uniform Traffic Control Devices, Part 4: Highway Traffic Signals, Chapter 4E: Pedestrian Control Features, Section 4E.07: Countdown Pedestrian Signals; Federal Highway Administration; December 2009; page 499.
77 Designing Sidewalks and Trail for Access, Part II of II: Best Practices Design Guide, Chapter 8: Pedestrian Crossings, Section 8.6: Crossing Times; Federal Highway Administration; September 2001; page 8-17.
78 Manual on Uniform Traffic Control Devices, Part 4: Highway Traffic Signals, Chapter 4E: Pedestrian Control Features, Section 4E.09: Accessible Pedestrian Signals and Detectors - General; Federal Highway Administration; December 2009; page 504.
79 Designing Sidewalks and Trails for Access, Part II of II: Best Practices Design Guide, Chapter 4: Sidewalk Corridors, Section 4.1: Sidewalk Corridor Width, Section 4.1.2: The Zone System; Federal Highway Administration (FHWA); September 2001; page 4-4.
80 Ibid.
81 Ibid.
82 Designing Sidewalks and Trails for Access, Part II of II: Best Practices Design Guide, Chapter 4: Sidewalk Corridors, Section 4.1: Sidewalk Corridor Width, Section 4.1.4: Improving Access on Narrow Sidewalks; Federal Highway Administration (FHWA); September 2001; page 4-13.
Chapter 2—Station Area Overviews
This chapter provides brief descriptions of the five station areas that MPO staff assessed for bicycle and pedestrian travel improvements. In addition to providing basic information about each location, such as the distribution of land use zoning around the stations, these overviews include each area’s overall APT prioritization rankings and their individual APT factor rankings that contributed to the final results.
MPO staff used the APT to identify which five Fairmount Line stations were most in need of improvements for bicycle and pedestrian travel. The overall prioritization ranking of each station area is listed in the last column of Table 2-1, with first place signifying the highest priority and eighth signifying the lowest priority. The overall prioritization rankings were calculated by adding together each location’s scores for seven different factors: Connectivity, Constraints, Demand, Equity, Existing Conditions, Safety, and Stakeholder Input. Table 2-1 lists the state of each factor in the eight station areas. It would be most beneficial to improve bicycle and pedestrian travel in the locations with the smallest numbers. For more information, please refer to Appendix A.
TABLE 2-1
Fairmount Line Station Area Prioritization Rankings
Station Area |
Connectivity |
Constraints |
Demand |
Equity |
Existing Conditions |
Safety |
Stakeholder Input |
Priority Ranking |
Newmarket |
2 |
1 |
3 |
7 |
2 |
1 |
1 |
1 |
Morton Street |
8 |
1 |
5 |
3 |
1 |
2 |
1 |
2 |
Four Corners/ Geneva Ave |
2 |
1 |
1 |
2 |
3 |
3 |
4 |
3 |
Talbot Avenue |
2 |
1 |
4 |
4 |
7 |
5 |
1 |
4 |
Upham's Corner |
1 |
5 |
2 |
1 |
4 |
4 |
7 |
5 |
Blue Hill Ave |
2 |
5 |
6 |
5 |
6 |
8 |
5 |
6 |
Fairmount |
2 |
7 |
7 |
6 |
5 |
7 |
6 |
7 |
Readville |
2 |
7 |
8 |
8 |
8 |
6 |
7 |
8 |
To understand factor prioritization better, consider the equity factor. Locations with the highest prioritization rankings for the equity factor are station areas with the greatest percentages of households without access to a vehicle; the largest percentages of people younger than 18 and/or older than 64; and/or the greatest percentages of environmental justice areas within a half mile of the station. Massachusetts block groups are considered environmental-justice areas if they meet any one of three criteria: 1) 25 percent or more of the block group’s population identifies as a race other than white; 2) median household income is less than or equal to 65.49 percent of $65,133, the 2010 Massachusetts state median income: $40,673; 3) 25 percent or more block group households identify as “English-isolated,” without someone older than 14 who only speaks English or who speaks English very well.83
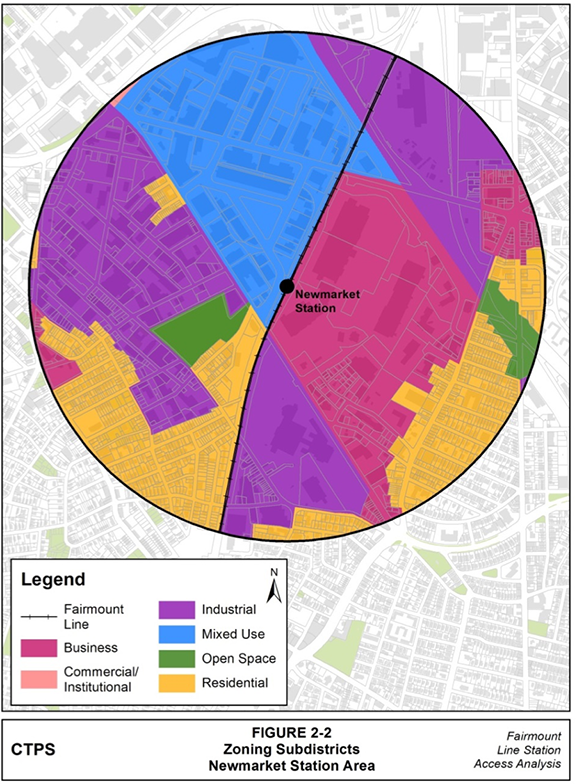
Newmarket Station is the northern-most Fairmount Line station outside of Boston’s CBD. The Newmarket Station area is a circle with Newmarket Station at its center with a radius of one half mile, forming an area of almost 22 million square feet. The station area has a population density slightly less than 7,700 people per square mile and an employment density of more than 11,500 jobs per square mile, resulting in an employment density that exceeds population density by almost 50 percent. The MBTA’s Red Line also passes through the area: Andrew Station is located at Andrew Square in the area’s northeast quadrant (see Figure 2-1). Both Andrew and Newmarket connect to South Station, though the Fairmount Line connects directly while the Red Line stops at Broadway Station before reaching South Station. Between Andrew and Newmarket is the South Bay Center, which includes a Stop & Shop supermarket, retail buildings, restaurants, and a bank. Zoning in the area within one half mile of Newmarket Station is listed in Table 2-2 by total square feet and by the percentage of the station area composed of each zoning type.
TABLE 2-2
Zoning in the Newmarket Station Area
Zoning Type |
Square Footage |
Percentage |
Industrial |
7,557,917 |
35 |
Business |
4,706,631 |
21 |
Residential |
4,557,925 |
21 |
Mixed Use |
4,375,080 |
20 |
Open Space |
674,492 |
3 |
Commercial/Institutional |
19,971 |
<1 |
Total |
21,892,016 |
100% |
FIGURE 2-1
MBTA Stations—Newmarket Station Area
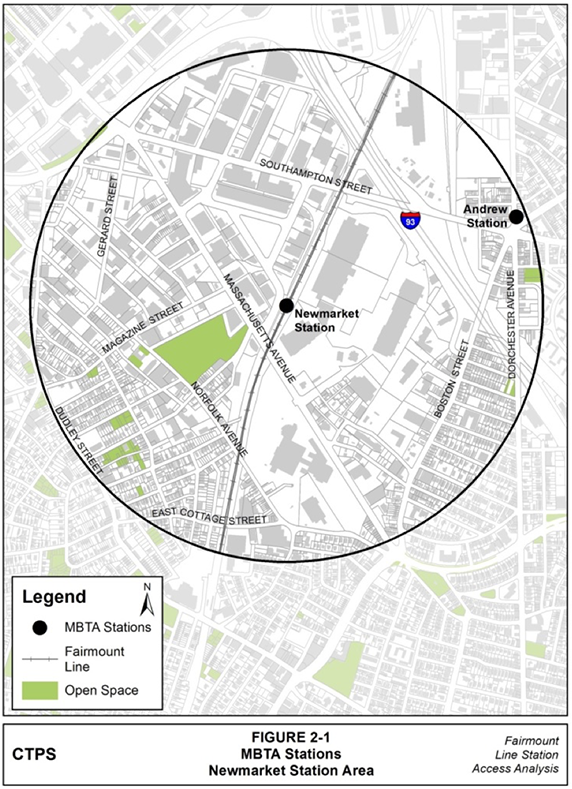
FIGURE 2-2
Zoning Subdistricts—Newmarket Station Area
The APT ranked the Newmarket station area as the highest-priority Fairmount Line station area for bicycle and pedestrian improvements. Newmarket was the only station area with a fatal bike crash and it tied Upham’s Corner for the greatest number of non-fatal-injury bike crashes from 2008 to 2012 with a total of seven such crashes. Employment density in the Newmarket Station area exceeded that of the second-most job-dense station area, Upham’s Corner, by more than 250 percent. Furthermore, the Newmarket Station area generated more than four times the sales of Upham’s Corner, which is the second-most retail active station area. Table 2-3 illustrates that the APT ranked Newmarket Station as the highest priority area for bicycle and pedestrian improvements.
TABLE 2-3
Newmarket Priority Ranking by Factor
Station Area Factor |
Priority Ranking |
Connectivity |
2 |
Constraints |
1 |
Demand |
3 |
Equity |
7 |
Existing Conditions |
2 |
Safety |
1 |
Stakeholder Input |
1 |
Overall |
1 |
The BRA/Economic Development and Industrial Corporation (EDIC) Board approved the proposed plans for the South Bay development on May 12, 2016.84 The project, which was proposed as a mixed-use, transit-oriented development, will be located to the south of the existing South Bay Center.85 The development, as envisioned, will be composed of five main buildings, four of which will include approximately 475 apartment units, 115,000 to 125,000 square feet of retail and restaurant space, a 12-screen cinema, and structured parking; the fifth building will serve as a hotel.86 Newmarket Station is located approximately a quarter mile from the site of the proposed project and Andrew Station is situated approximately half a mile from the site.87 Estimates suggest that the development will generate high numbers of walking, bicycling, and transit trips (see Table 2-4), reinforcing the importance of improving bicycle and pedestrian access to Newmarket Station.
TABLE 2-4
South Bay Development Trip Estimates
Trip Type |
Weekday Morning Peak Hour |
Weekday Evening Peak Hour |
Saturday Midday Peak Hour |
Walking and Bicycling Trips |
170 |
443 |
503 |
Transit Trips |
147 |
371 |
423 |
Total |
317 |
814 |
926 |
Source: Development Plan for Planned Development Area No. 103: South Bay Development; Allstate Road (Edens), LLC; Boston Redevelopment Authority; February 26, 2016; pages 2 and 3.
The Four Corners/Geneva Avenue station is the third stop on the Fairmount Line as it travels to Readville from South Station. The station area—a circle whose half-mile radius measures approximately 22 million square feet—includes a portion of Franklin Park on its western side. The Four Corners/Geneva Avenue Station area overlaps the Talbot Avenue Station area to the south; there are no signalized intersections within the shared space. Of all eight Fairmount Line station areas, Four Corners/Geneva Avenue contains the most bus stops, with 61 (see Figure 2-3).
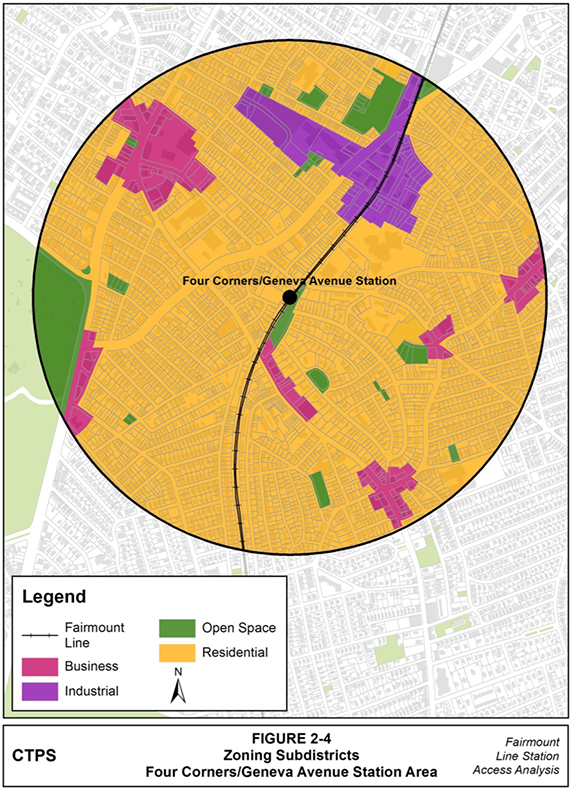
Zoning in the area within one-half mile of Four Corners/Geneva Avenue Station is listed in Table 2-5 by total square feet and by the percentage of the station area composed of each zoning type. As shown in Table 2-5 and illustrated in Figure 2-4, 82 percent of the station area is zoned for residential use. It has a population density of more than 22,500 residents per square mile and employs almost 3,000 people per square mile. As a result, Four Corners/Geneva Avenue has approximately 7.5 times more residents than jobs. The large number of residents led the APT to attribute the highest level of demand to the area of all eight Fairmount Line stations, which contributed to the APT ranking Four Corners/Geneva Avenue Station as the third-highest-priority area for bicycle and pedestrian improvements (Table 2-6).
TABLE 2-5
Zoning in the Four Corners/Geneva Avenue Station Area
Zoning Type |
Square Footage |
Percentage |
Residential |
17,859,415 |
82 |
Business |
1,565,410 |
7 |
Open Space |
1,260,538 |
6 |
Industrial |
1,206,680 |
6 |
Total |
21,892,042 |
100% |
TABLE 2-6
Four Corners/Geneva Avenue Priority Ranking by Factor
Station Area Factor |
Priority Ranking |
Connectivity |
2 |
Constraints |
1 |
Demand |
1 |
Equity |
2 |
Existing Conditions |
3 |
Safety |
3 |
Stakeholder Input |
4 |
Calculated Overall Ranking |
3 |
FIGURE 2-3
Bus Stops—Four Corners/Geneva Avenue Station Area
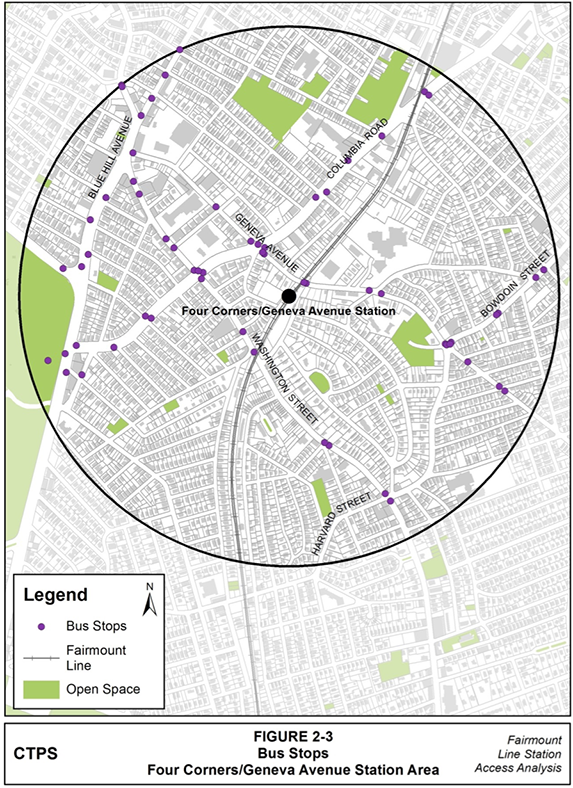
FIGURE 2-4
Zoning Subdistricts—Four Corners/Geneva Avenue Station Area
The population of the Four Corners/Geneva Avenue Station area is expected to grow approximately 12 percent by 2040, which is greater than that of the Upham’s Corner, Fairmount, and Readville station areas. Employment growth in the area is forecasted to exceed employment growth in the Blue Hill Avenue and Fairmount station areas, increasing 24 percent by 2040. The Four Corners/Geneva Avenue population grew more slowly than that of the Newmarket, Morton Street, and Blue Hill Avenue station areas and its employment grew more slowly than employment in the Newmarket, Upham’s Corner, Talbot Avenue, Morton Street, and Readville station areas. According to estimates based on expected development, Four Corners/Geneva Avenue Station is expected to draw the fifth-largest ridership demand for the Fairmount Line in 2035.88
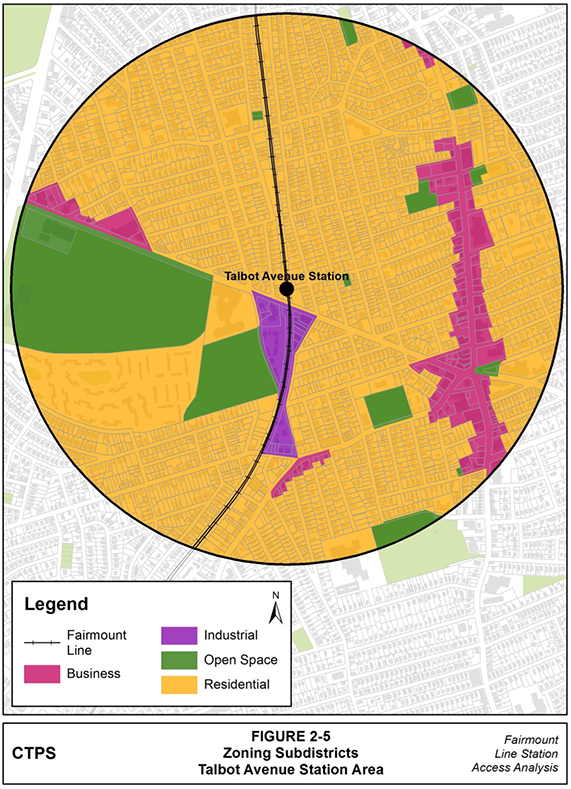
The Talbot Avenue Station is the fourth stop on the Fairmount Line as it travels to Readville from South Station. The station includes the TNT within its bounds, in the southeastern quadrant of the station area near Codman Square.
The station area has a population density of almost 17,800 people per square mile and an employment density of almost 2,700 people per square mile, resulting in an employment density that is 15 percent as dense as that of the station area’s population. The entire study location is considered an environmental-justice area. In addition to the TNT southeast of Talbot Avenue Station, the study area includes the Joseph Lee Elementary School, Harambee Park, the Berkshire Partners Blue Hill Boys and Girls Club of Boston, and the Sportsmen’s Tennis and Enrichment Center, all northwest of Talbot Avenue Station. Zoning in the area within one-half mile of Talbot Avenue Station is listed in Table 2-7 by total square feet and by the percentage of the station area composed of each zoning type.
TABLE 2-7
Zoning in the Talbot Avenue Station Area
Zoning Type |
Square Footage |
Percentage |
Residential |
16,982,109 |
78 |
Open Space |
2,935,907 |
13 |
Business |
1,566,893 |
7 |
Industrial |
407,133 |
2 |
Total |
21,892,042 |
100% |
FIGURE 2-5
Zoning Subdistricts—Talbot Avenue Station Area
Every stakeholder entity that MPO staff polled, from advocacy groups to municipal government departments, identified Talbot Avenue as a Fairmount Line station area in great need of bicycle and pedestrian improvements. Portions of three Boston Region Bike Network gaps are located within the Talbot Avenue station area, which led the APT to rank it second in priority for connectivity. The Newmarket, Four Corners/Geneva Avenue, Blue Hill Avenue, Fairmount, and Readville station areas all contain the same number of gaps, so they all ranked second in connectivity.
In the bicycle and pedestrian safety category, APT ranked Talbot Avenue as fifth out of the eight Fairmount Line station areas, in spite of the area experiencing the fourth-largest number of bicycle crashes and the fourth-largest number of pedestrian crashes between 2008 and 2012. MPO staff averaged the pedestrian and bicycle safety scores to determine each station area’s overall safety score for APT calculations. Although Upham’s Corner had a lower prioritization score for pedestrian safety, the station area’s prioritization score for bicycles was more than double that of Talbot Avenue. Finally, the low number of vehicular crashes in the station area between 2008 and 2012 contributed to Talbot Avenue’s seventh-place priority ranking for the existing conditions factor.
TABLE 2-8
Talbot Avenue Priority Ranking by Factor
Station Area Factor |
Priority Ranking |
Connectivity |
2 |
Constraints |
1 |
Demand |
4 |
Equity |
4 |
Existing Conditions |
7 |
Safety |
5 |
Stakeholder Input |
1 |
Calculated Overall Ranking |
4 |
The population of the Talbot Avenue station area is expected to grow 12 percent by 2040, while the number of jobs is expected to grow 29 percent by the same year. Calculations based on development plans for the station area in the year 2035 indicate daily ridership totals of 180 boardings and alightings at Talbot Avenue Station by that time.89
Morton Street Station is the fifth stop on the Fairmount Line as it travels toward Readville from South Station. Approximately 13,200 people live in the Morton Street station area—a population density of more than 16,800 people per square mile. Employment is about 8.5 percent the size of the population. With about 1,400 jobs per square mile or an estimated 1,100 total jobs, this area has the lowest job-to-resident ratio of all eight Fairmount Line station areas. Despite this, it generates the third-largest amount of retail activity of the Fairmount Line station areas: almost $110,500,000 in annual sales.
The Morton Street area ranks third among the Fairmount Line stations for transit boardings. Of the eight Fairmount Line station areas, the largest amount of fatal and severe vehicle crashes have occurred there, as have the second-largest number of total vehicle crashes. Morton Street is similar to Talbot Avenue in that it is the only other Fairmount Line station whose surrounding area is entirely comprised of environmental justice areas.
Zoning in the area within one half mile of Morton Street Station is listed in Table 2-9 by total square feet and by the percentage of the station area composed of each zoning type.
TABLE 2-9
Zoning in Morton Street Station Area
| Zoning Type |
Square Footage |
Percentage |
|---|---|---|
Residential |
17,972,516 |
82 |
Open Space |
796,654 |
4 |
Business |
1,957,230 |
9 |
Commercial/Institutional |
978,615 |
4 |
Industrial |
187,027 |
1 |
Total |
21,892,042 |
100% |
FIGURE 2-6
Zoning Subdistricts—Morton Street Station Area
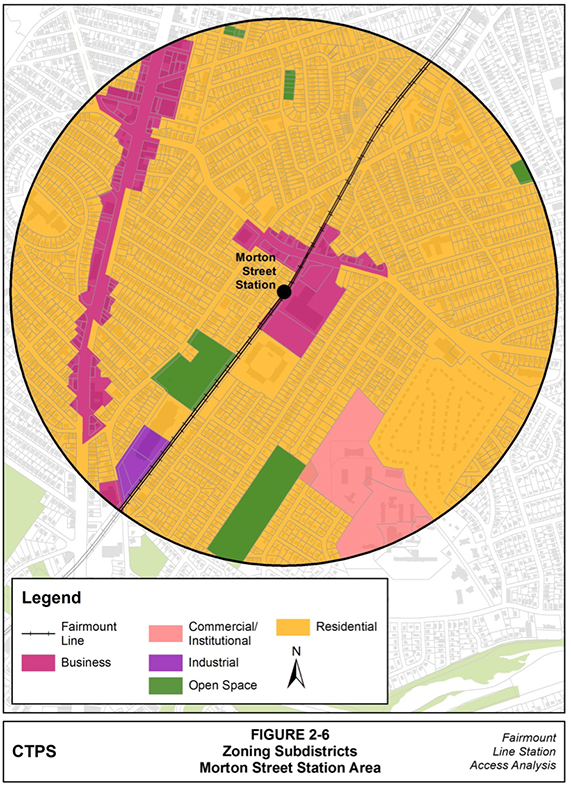
APT ranked Morton Street as the second-highest priority station area for bicycle and pedestrian improvements overall. This is partly because of the large number of vehicle crashes in the station area, which contributed to Morton Street’s existing conditions being ranked as the highest priority for improvement. Every stakeholder entity that MPO staff polled, from advocacy groups to municipal government departments, identified Morton Street as a Fairmount Line station area in great need of bicycle and pedestrian improvements. APT ranked Morton Street as the second-highest priority station area for bicycle and pedestrian safety because from 2008 through 2012 bicycle and pedestrian crashes numbered the third and second greatest of all eight Fairmount Line station areas, respectively. Finally, in spite of the fact that all of Morton Street is considered an environmental justice area, APT identified Morton Street as the third-highest priority location for equity considerations because the percentage of households in this area with no vehicle access was the fifth highest of all eight Fairmount Line stations.
TABLE 2-10
Morton Street Priority Ranking by Factor
Station Area Factor |
Priority Ranking |
Connectivity |
8 |
Constraints |
1 |
Demand |
5 |
Equity |
3 |
Existing Conditions |
1 |
Safety |
2 |
Stakeholder Input |
1 |
Calculated Overall Ranking |
2 |
Population within the Morton Street station area is expected to grow 15 percent by 2040, while employment is predicted to increase by 33 percent within the same period. In spite of this growth, 2035 ridership forecasts indicate that the station will have 10 fewer total boardings and alightings by that year; this makes it the only station of the five selected Fairmount Line stops at which ridership in 2035 is expected to decline from current levels.90
Blue Hill Avenue Station has not yet been constructed, although it is anticipated to become the sixth stop on the Fairmount Line as it travels toward Readville from South Station. The majority of the station area will be within the bounds of the City of Boston, although almost 10 percent of the station area is within the town of Milton, as illustrated in Figure 2-7. The station area’s population is estimated to be nearly 8,500, with approximately 1,600 jobs or more within the station area itself. This means that there will be jobs for roughly 19 percent of the Blue Hill Avenue station area population, making it the fourth largest, in terms of employment percentage, of the eight Fairmount Line station areas.
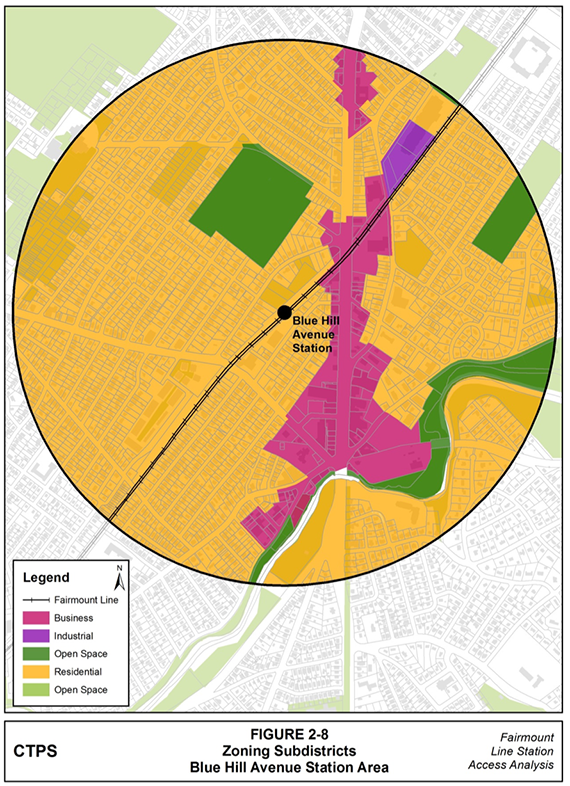
Zoning in the area within one-half mile of Blue Hill Avenue Station is listed in Table 2-11 by total square feet and by the percentage of the station area composed of each zoning type. Figure 2-7 illustrates the zoning in the Blue Hill Avenue station area.
TABLE 2-11
Zoning in Blue Hill Avenue Station Area
Zoning Type |
Square Footage |
Percentage |
Residential |
17,517,891 |
80 |
Business |
2,342,284 |
11 |
Open Space |
1,757,346 |
8 |
Industrial |
187,027 |
1 |
Neponset River |
87,494 |
<1 |
Total |
21,892,042 |
100% |
FIGURE 2-7
Town of Milton—Blue Hill Avenue Station Area
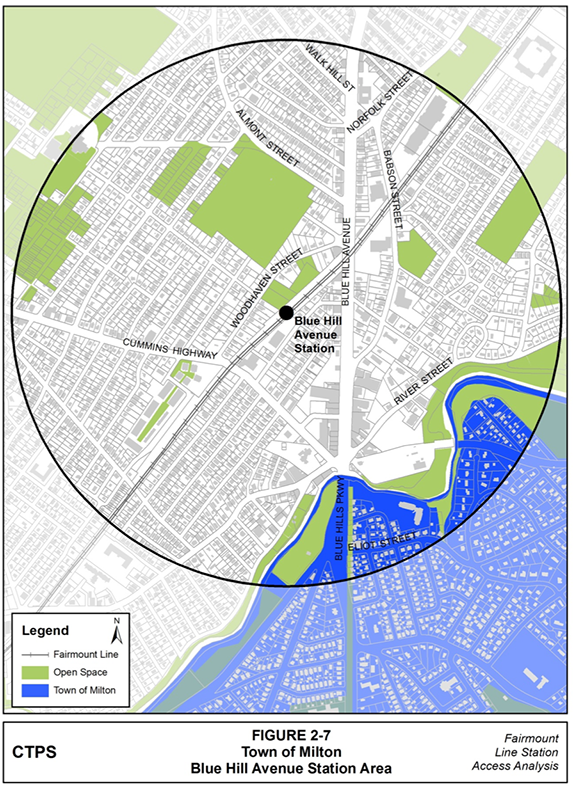
FIGURE 2-8
Zoning Subdistricts—Blue Hill Avenue Station Area
The BRA was the only entity polled by MPO staff that identified the Blue Hill Avenue station area as one of the locations most in need of improvements to the bicycle and pedestrian environment. This may be because the station has yet to be constructed, and the stakeholders (listed in Appendix A) that MPO staff polled could have been less familiar with the area than they are with the other station locations on the Fairmount Line. Aside from the BRA, the stakeholders that MPO staff polled did not identify Blue Hill Avenue as a high priority for bicycle and pedestrian improvements. In addition, the fact that it does not lie entirely within the City of Boston introduces the possibility of multi-jurisdictional conflict when attempts are made to address station area concerns. These constraints acted against Blue Hill Avenue’s overall prioritization for improvement.
TABLE 2-12
Blue Hill Avenue Priority Ranking by Factor
Station Area Factor |
Priority Ranking |
Connectivity |
2 |
Constraints |
5 |
Demand |
6 |
Equity |
5 |
Existing Conditions |
6 |
Safety |
8 |
Stakeholder Input |
5 |
Calculated Overall Ranking |
6 |
.
83 MassGIS Data – 2010 U.S. Census – Environmental Justice Populations; Massachusetts Executive Office for Administration and Finance; December 2012; http://www.mass.gov/anf/research-and-tech/it-serv-and-support/application-serv/office-of-geographic-information-massgis/datalayers/cen2010ej.html.
84 Minutes of the Economic Development and Industrial Corporation of Boston May 12, 2016 Board of Directors’ Meeting Scheduled for 3:30 P.M.; Economic Development and Industrial Corporation of Boston Board of Directors; May 12, 2016; pages 34-37; http://boston.siretechnologies.com/sirepubbra/cache/2/sjk5kdsldcviycru0eh2srm3/31607292016013900271.pdf.
85 Draft Project Impact Report: Volume 1; Allstate Road (Edens), LLC; Fort Point Associates, Inc.; January 22, 2016; page 1-2.
86 Development Plan for Planned Development Area No. 103: South Bay Development; Allstate Road (Edens), LLC; Boston Redevelopment Authority; February, 26, 2016; pages 2 and 3.
87 Draft Project Impact Report: Volume 1; Allstate Road (Edens), LLC; Fort Point Associates, Inc.; January 22, 2016; page 4-14.
88 Review and Update of Fairmount Line Ridership Forecasts; Scott Peterson; Central Transportation Planning Staff to the Boston Region MPO; November 15, 2011; page 2.
89 Review and Update of Fairmount Line Ridership Forecasts; Scott Peterson; Central Transportation Planning Staff to the Boston Region MPO; November 15, 2011; page 2.
90 Review and Update of Fairmount Line Ridership Forecasts; Scott Peterson; Central Transportation Planning Staff to the Boston Region MPO; November 15, 2011; page 2.
91 Review and Update of Fairmount Line Ridership Forecasts; Scott Peterson; Central Transportation Planning Staff to the Boston Region MPO; November 15, 2011; page 2.
This chapter assesses the bicycle facilities in five Fairmount Line station areas. Each section focuses on the infrastructure surrounding one of the stations and illustrates where the Boston Bike Network Plan identifies existing and future bicycle facilities. Each section also outlines the route of the Fairmount Greenway in the station area. The Boston Bike Network Plan anticipates that 75 miles of future bicycle infrastructure will occur within approximately five years, while other improvements are longer-term goals that the City of Boston hopes to implement over the next 30 years, ultimately achieving a network of 356 miles.92 The plan differentiates between primary and secondary facility recommendations, describing the secondary recommendations as retrofit or short-term solutions where a primary recommendation is temporarily not possible. Appendix B includes descriptions of the Boston Bike Network Plan bicycle facilities.
The five sections of this chapter include a map of the existing facilities in a station area, a map of the Boston Bike Network Plan’s primary bicycle facility recommendations, a map of the Boston Bike Network Plan’s secondary recommendations, and a map the Fairmount Greenway’s path within each study location. The Boston Bike Network Plan’s suggested local routes, marked in grey on the maps of the existing and recommended infrastructure, do not have associated facility recommendations, but are included in the map because they are popular local routes. When conducting fieldwork, MPO staff traveled along each of the routes identified on the four maps—routes chosen for their current and future potential to attract bicyclists and pedestrians because of enhanced accommodations.
The existing bicycle facilities in the Newmarket Station area include shared lane markings and bike lanes; a small segment of the South Bay Harbor Trail accounts for the shared-use path where Massachusetts Avenue crosses Melnea Cass Boulevard in the northwestern portion of the station area (see Figure 3-1). The Boston Bike Network identified portions of the Fairmount Greenway in the Newmarket area as suggested local routes, and recommended that segments of the Greenway near Newmarket become neighborways (see Figures 3-2, 3-3, 3-4).
The proximity of Four Corners/Geneva Avenue Station to Franklin Park and its zoo adds some high-quality infrastructure to this station area. On Franklin Park Road, a bike lane in the roadway is located adjacent to a shared-use path on the north side of the street that is lined with benches and trees (see Figure 3-1). The Boston Bike Network Plan indicates that the current bicycle facilities in the Four Corners/Geneva Avenue station area include shared-lane markings, bike lanes, and a small stretch of buffered bike lane on Columbia Road traveling northeast under the rail bridge that serves the Fairmount Line (see Figure 3-2). Not included in the plan (and therefore missing from the figure) are the bike lanes that MPO staff observed on both sides of Seaver Street, to the west of its intersection with Blue Hill Avenue. The Boston Bike Network has identified portions of the Fairmount Greenway in the Four Corners/Geneva Avenue area as suggested local routes and has recommended that segments of the Greenway in the station area become neighborways. Primary bicycle facility recommendations are included in Figure 3-3, secondary recommendations are illustrated in Figure 3-4, and the route of the Fairmount Greenway is cited in Figure 3-5.
FIGURE 3-1
Shared-Use Path and Bike Lane on Franklin Park Road
Source: Central Transportation Planning Staff.
The bicycle facilities currently present in the station area are shared-lane markings and bike lanes (see Figure 3-1). Portions of the Fairmount Greenway in the Talbot Avenue station area are identified in the Boston Bicycle Network Plan as recommended locations for neighborways, shared roads, and suggested local routes (for recommendations, see Figure 3-2 and Figure 3-3). The path of the Fairmount Greenway in the Talbot Avenue station area is documented in Figure 3-4.
The bicycle facilities currently present in the Morton Street station area are shared-lane markings and bike lanes (see Figure 3-4). Portions of the Fairmount Greenway in the Morton Street station area are identified in the Boston Bike Network Plan as having shared-lane markings and are recommended for bike lanes or marked as suggested local routes (see Figure 3-2 and Figure 3-3). The path of the Fairmount Greenway in the Morton Street station area is documented in Figure 3-4.
The bicycle facilities currently present in the Blue Hill Avenue station area include shared-lane markings, bike lanes, and a shared-use path in the southern portion of the station area where the Neponset River Trail is located (see Figure 3-1). One portion of the Fairmount Greenway in the Blue Hill Avenue station area is identified in the Boston Bike Network Plan as having shared-lane markings but recommendations for the route include a two-way cycle track on one side of Blue Hill Avenue, a shared-use path, buffered bike lanes, bike lanes, and shared-lane markings (see Figure 3-2 and Figure 3-3). The path of the Fairmount Greenway in the Blue Hill Avenue station area is documented in Figure 3-4.
FIGURE 3-2
Existing Bicycle Facilities—Newmarket Station Area
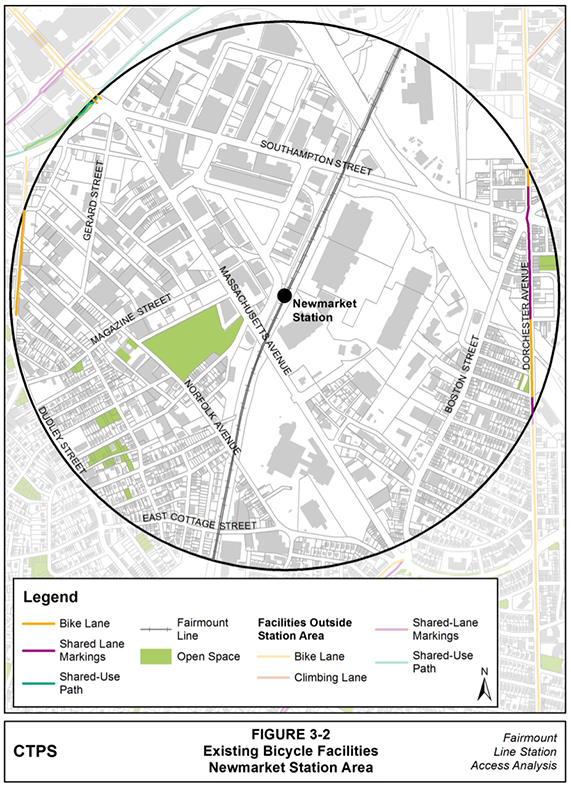
FIGURE 3-3
Primary Facility Recommendations—Newmarket Station Area
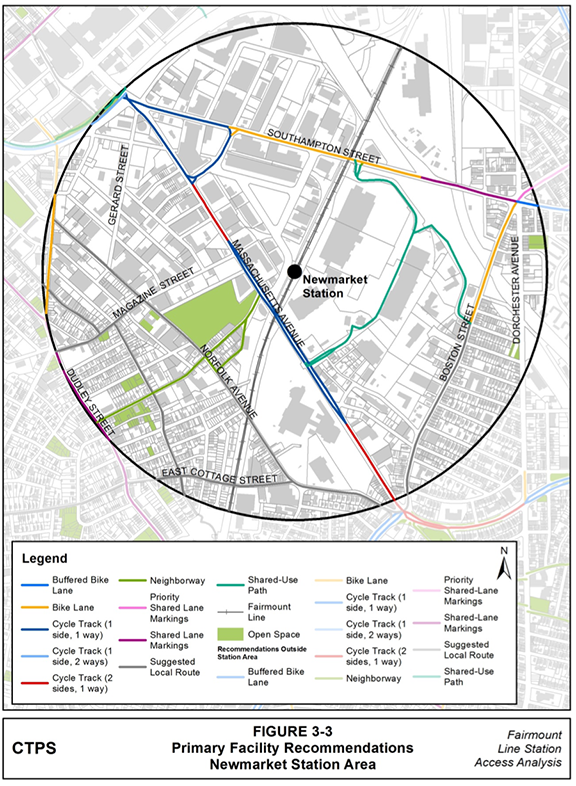
FIGURE 3-4
Secondary Facility Recommendations—Newmarket Station Area
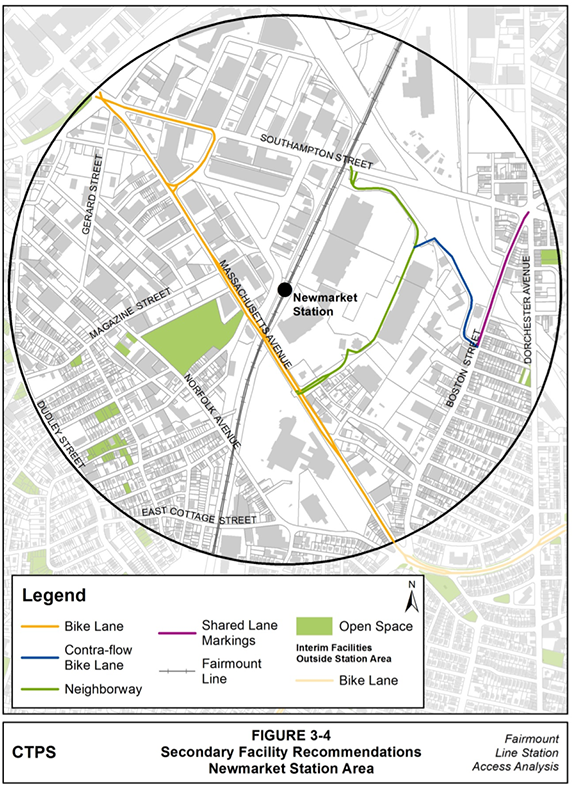
FIGURE 3-5
Fairmount Greenway—Newmarket Station Area
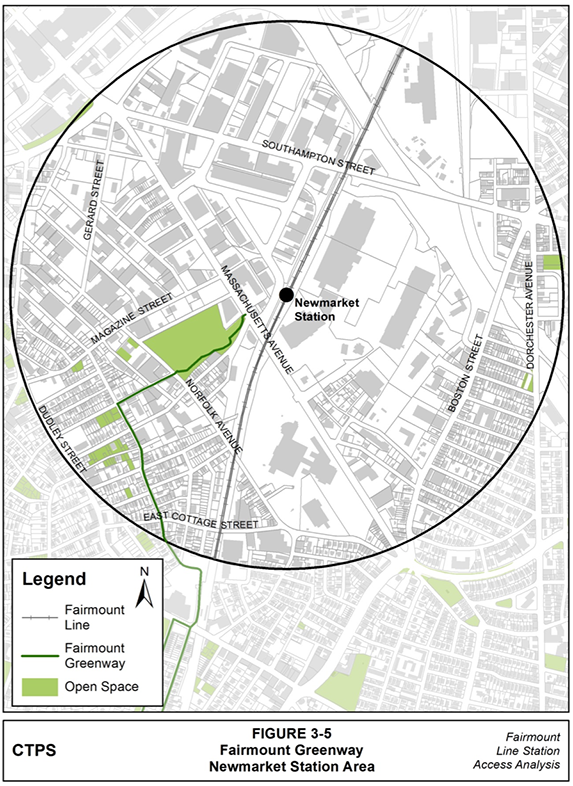
FIGURE 3-6
Existing Bicycle Facilities—Four Corners/Geneva Avenue Station Area
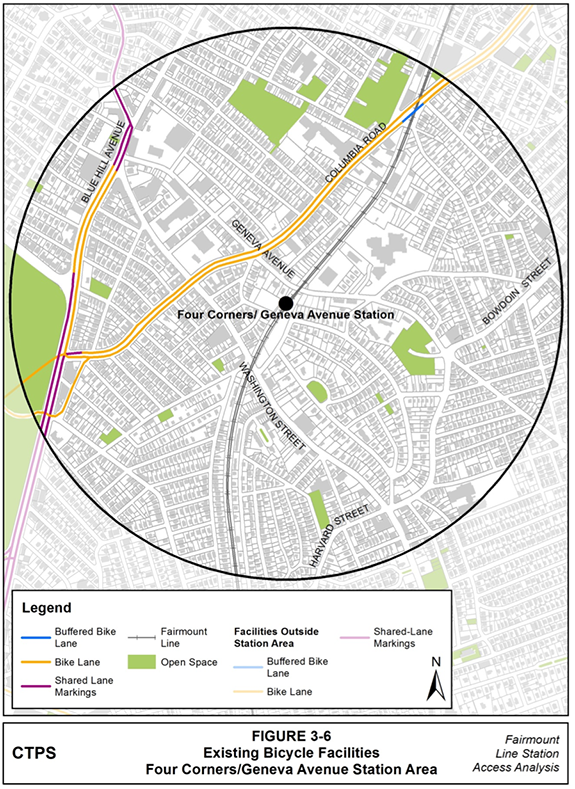
FIGURE 3-7
Primary Facility Recommendations—Four Corners/
Geneva Avenue Station Area
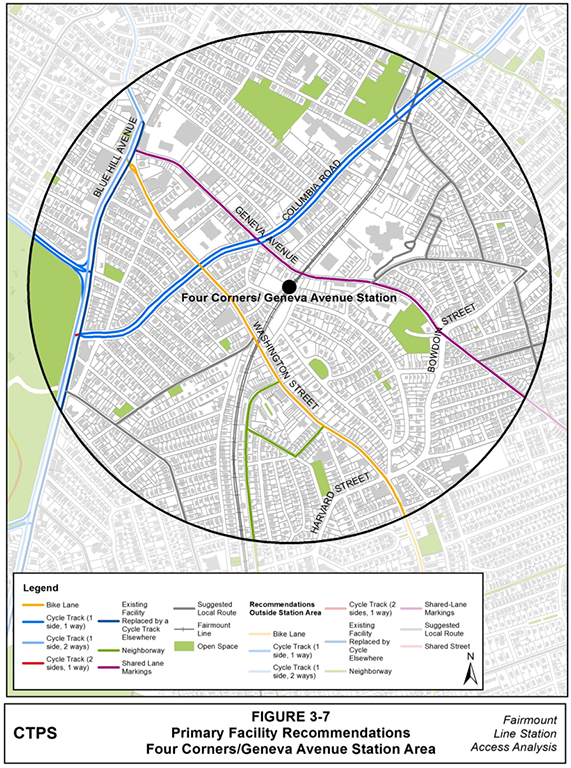
FIGURE 3-8
Secondary Facility Recommendations—Four Corners/
Geneva Avenue Station Area
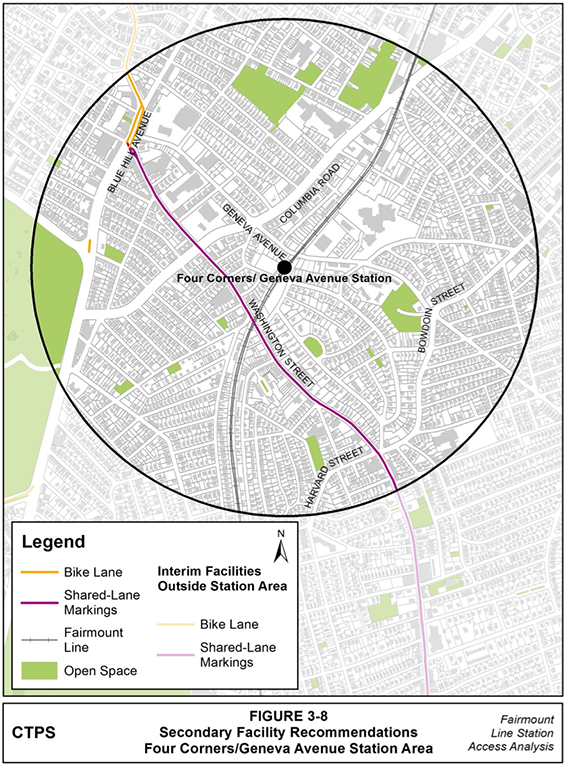
FIGURE 3-9
Fairmount Greenway Route—Four Corners/
Geneva Avenue Station Area
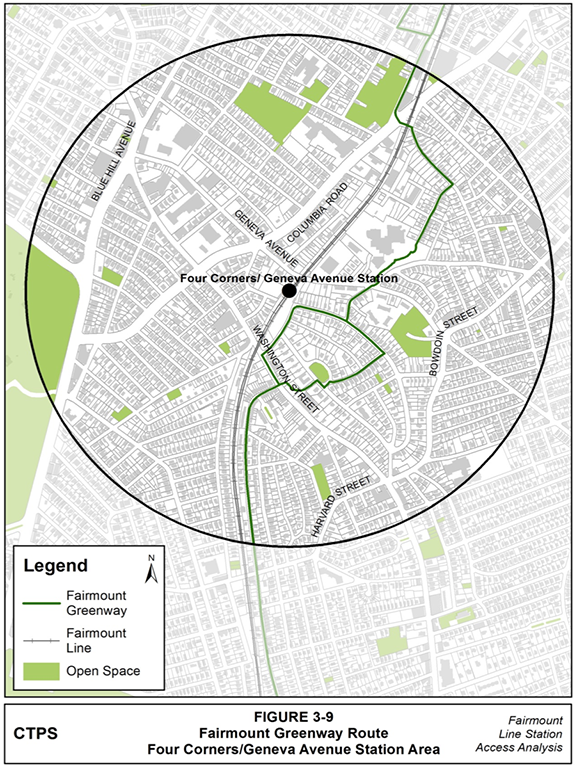
FIGURE 3-10
Existing Bicycle Facilities—Talbot Avenue Station Area
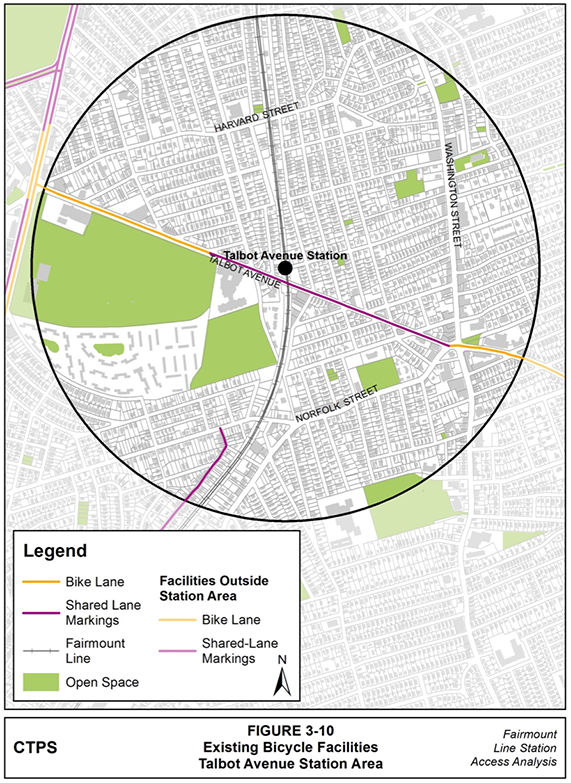
FIGURE 3-11
Primary Facility Recommendations—Talbot Avenue Station Area
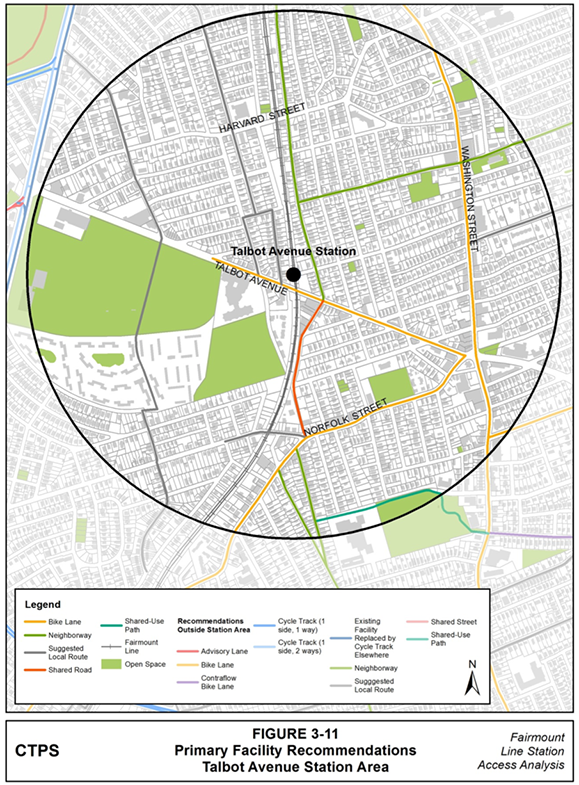
FIGURE 3-12
Secondary Facility Recommendations—Talbot Avenue Station Area
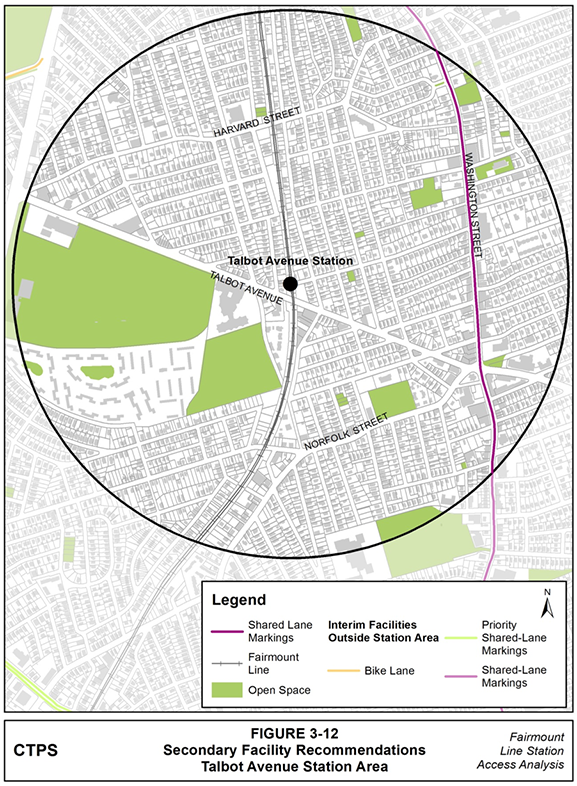
FIGURE 3-13
Fairmount Greenway—Talbot Avenue Station Area
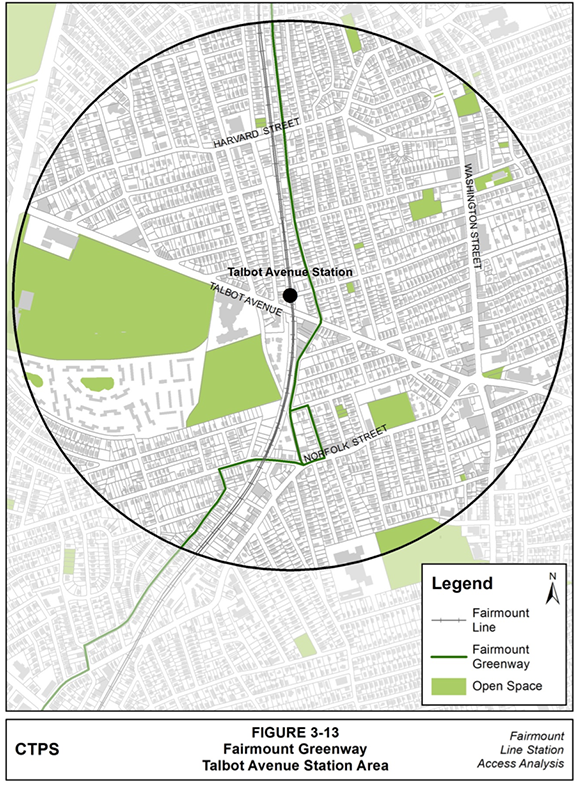
FIGURE 3-14
Existing Bicycle Facilities—Morton Street Station Area
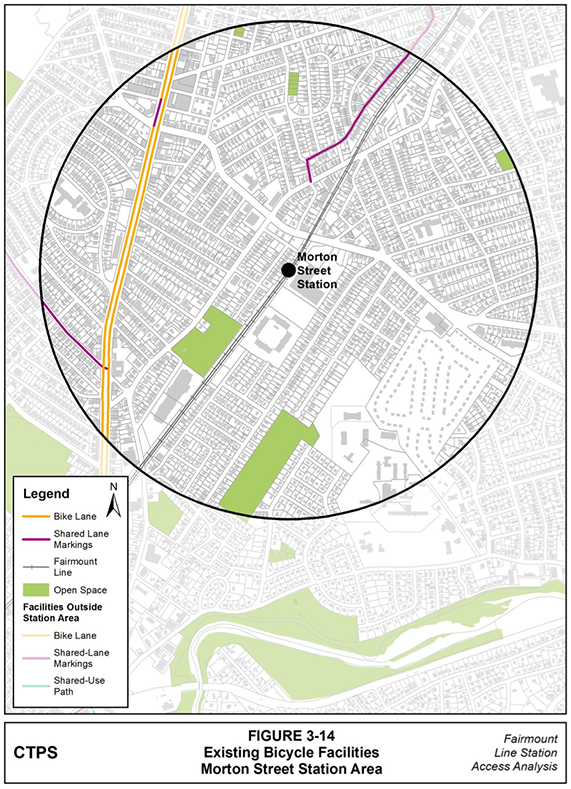
FIGURE 3-15
Primary Facility Recommendations—Morton Street Station Area
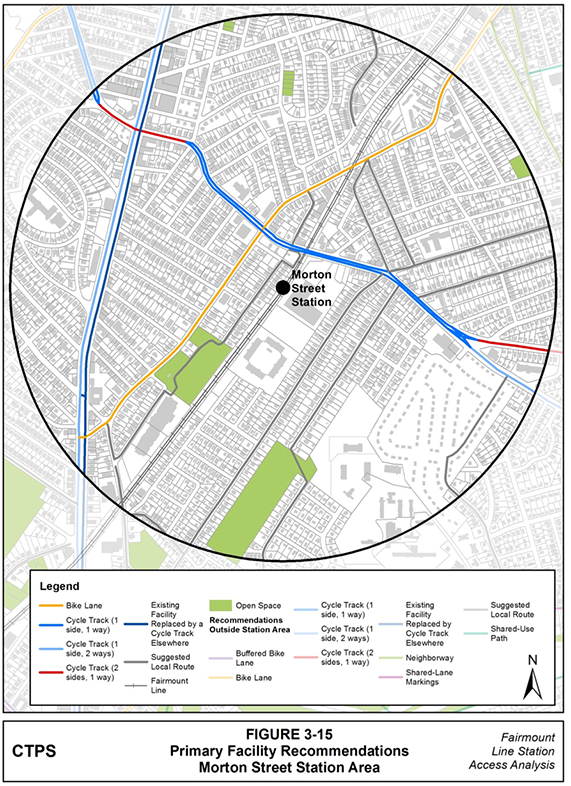
FIGURE 3-16
Secondary Facility Recommendations—Morton Street Station Area
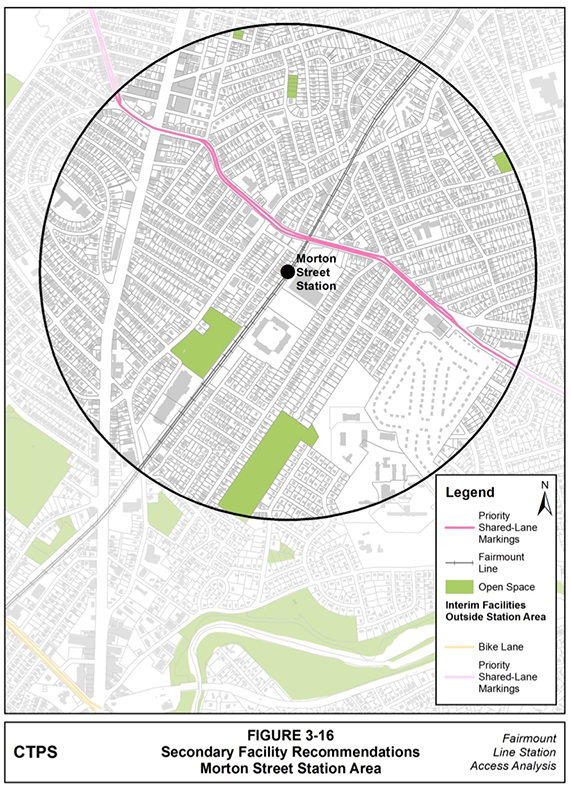
FIGURE 3-17
Fairmount Greenway—Morton Street Station Area
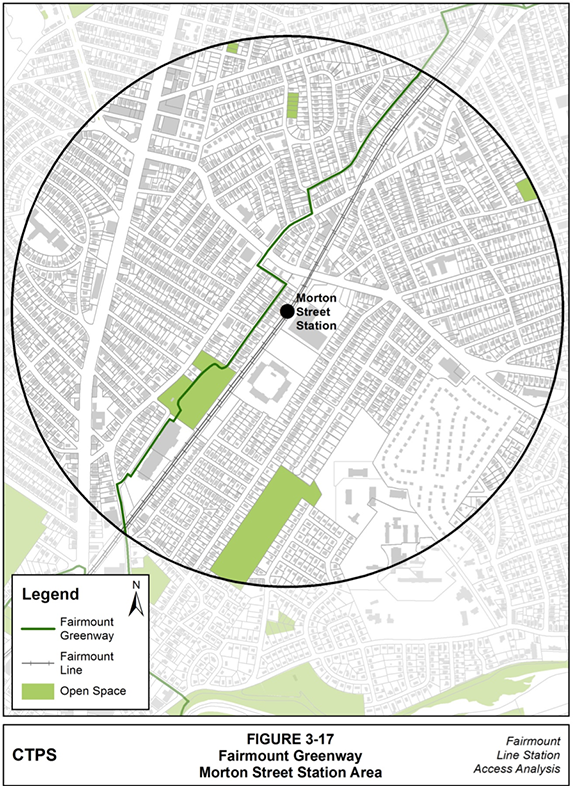
FIGURE 3-18
Existing Bicycle Facilities—Blue Hill Avenue Station Area
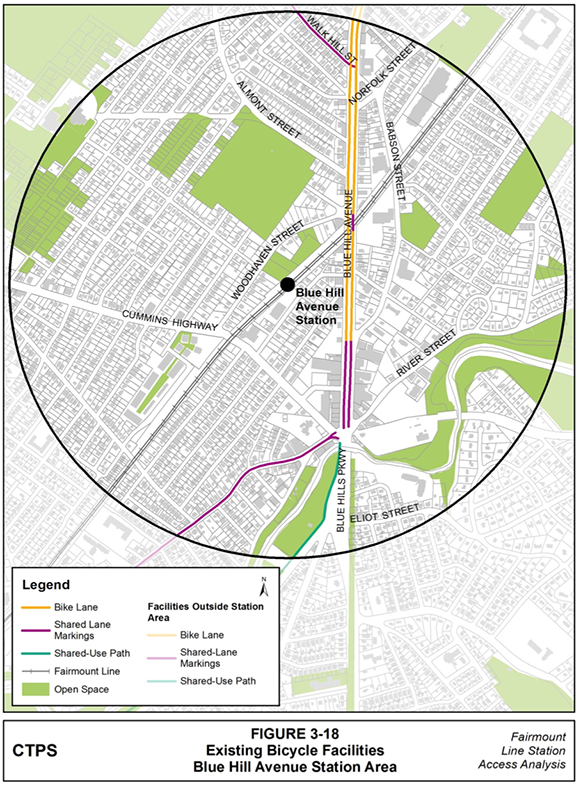
FIGURE 3-19
Primary Facility Recommendations—Blue Hill Avenue Station Area
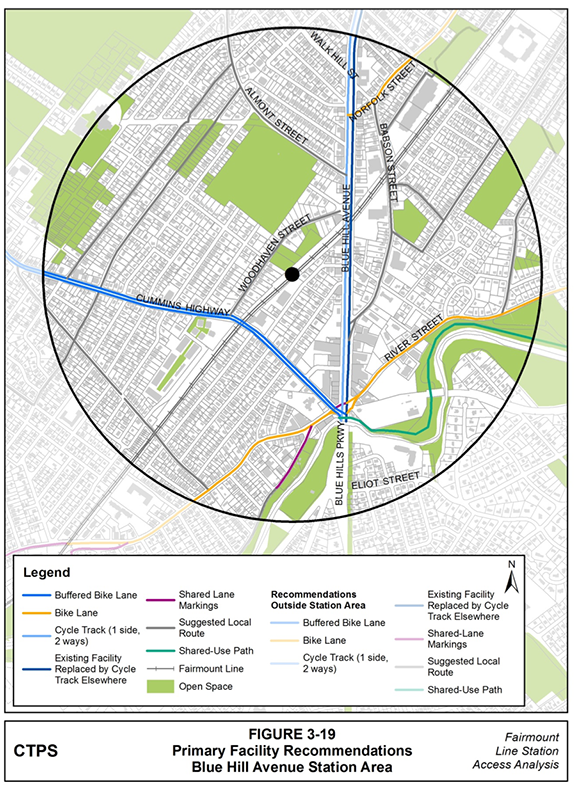
FIGURE 3-20
Secondary Facility Recommendations—Blue Hill Avenue Station Area
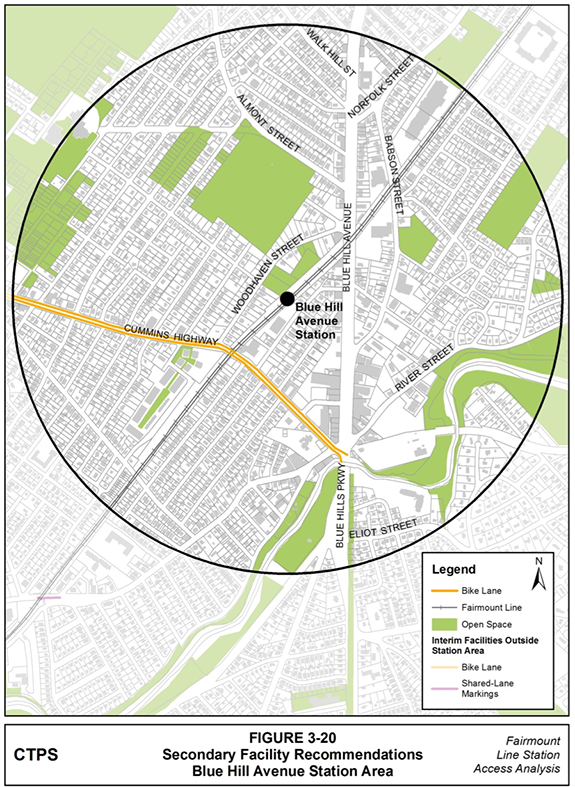
FIGURE 3-21
Fairmount Greenway—Blue Hill Avenue Station Area
92 Boston Bike Network Plan; Boston Bikes; City of Boston Department of Transportation; 2013; page 2.
This chapter documents the locations where MPO staff found bike racks in the five selected Fairmount Line station areas. In addition to documenting bike rack installations, this chapter identifies each bike rack as either acceptable or unacceptable. The distinctions are based on guidance published in the Association of Pedestrian and Bicycle Professionals’ (APBP) The Essentials of Bike Parking, which classifies several bike racks as acceptable for all uses or acceptable for high-density locations. 93 APBP’s third bike rack category identifies bike racks that should be avoided because of performance concerns.94
MPO staff found several Inverted U (also Staple or Loop) and Post and Ring bike racks, both of which APBP has identified as being acceptable for all uses. MPO staff did not notice any of the racks that APBP classified as acceptable for high-density uses, but within the study areas there were a few bike racks that should be avoided. These bike racks were the Wave (also Undulating or Serpentine), Schoolyard (also Comb or Grid), and Coat Hanger. Refer to Appendix B for bike rack information. The staff documentation differentiates between acceptable bike racks and those that should be avoided. MPO staff recommend the replacement of any of the bike racks that should be avoided. A sufficient number of acceptable bike racks should be installed to replace the existing amount of bicycle parking at a given location.
This chapter also documents the locations where the City of Boston has installed Post and Ring bicycle racks, using City of Boston data. This highlights any differences between the bike racks observed by MPO staff and those that the City of Boston indicates it has installed. MPO staff recommend verifying the presence of City of Boston bike racks where MPO staff did not observe them, even though City of Boston documentation indicates otherwise.
MPO staff observed a total of 11 bike racks in the Newmarket Station area. Ten bike racks were Post and Ring, four of which were found on Norfolk Avenue. The remaining six bike racks were seen near Andrew Square. MPO staff found the Newmarket area’s only APBP-discouraged bike rack, which was a Schoolyard rack, outside the Stop & Shop just east of Newmarket Station. The location of each bike rack, whether acceptable or discouraged, is illustrated in Figure 4-1.
MPO staff observed 11 bike racks in the Four Corners/Geneva Avenue Station area. Of those, eight were in the Inverted U style; all were located on Norwell Street, south of its intersection with Washington Street; three of the eight racks on Norwell Street are documented in Figure 4-2.
FIGURE 4-2
Inverted U Bike Racks on Norwell Street—Four Corners/Geneva Avenue
Source: Central Transportation Planning Staff.
APBP advises against the bike rack types of the remaining three installations that MPO staff observed in this area. Two Wave bike racks are installed in front of the Dorchester Arts Collaborative on Washington Street, shown in Figure 4-3. MPO staff found the final bike rack, a Coat Hanger-style rack, outside the northern Geneva Avenue entrance to the Four Corners/Geneva Avenue Station inbound platform (documented in Figure 4-4). The locations of both the acceptable and the discouraged bike racks in the area are illustrated in Figure 4-5.
FIGURE 4-3
Wave Bike Racks outside the Dorchester Arts Collaborative
Source: Central Transportation Planning Staff.
FIGURE 4-4
Coat Hanger Bike Rack Outside the Geneva Avenue Inbound Platform
Source: Central Transportation Planning Staff.
MPO staff observed three bike racks in Talbot Avenue station area, two of which were in the Inverted U-style and located beside each other in front of the Dorchester District Court on Washington Street. At the entrance to the inbound Fairmount Line platform located to the northeast of the station entrances on Talbot Avenue, MPO staff found a Coat Hanger-style bike rack, which the APBP discourages. The locations of these bike racks are illustrated in Figure 4-6.
MPO staff did not observe any bike racks along the selected roadways within the station area, but documentation indicates that the city installed bike racks there (see Figure 4-7).
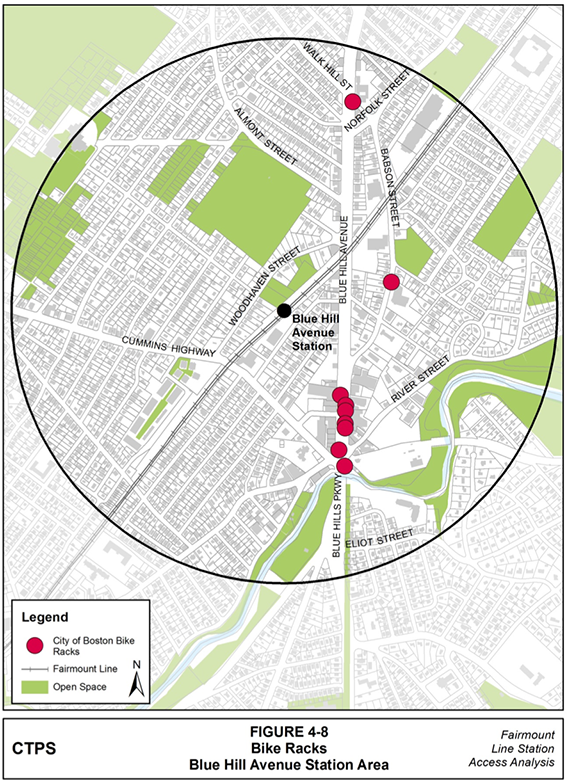
MPO staff did not observe any bike racks in the Blue Hill Avenue station area but City of Boston documentation indicates that it did install bike racks in the area (see Figure 4-8).
FIGURE 4-1
Bike Racks—Newmarket Station Area
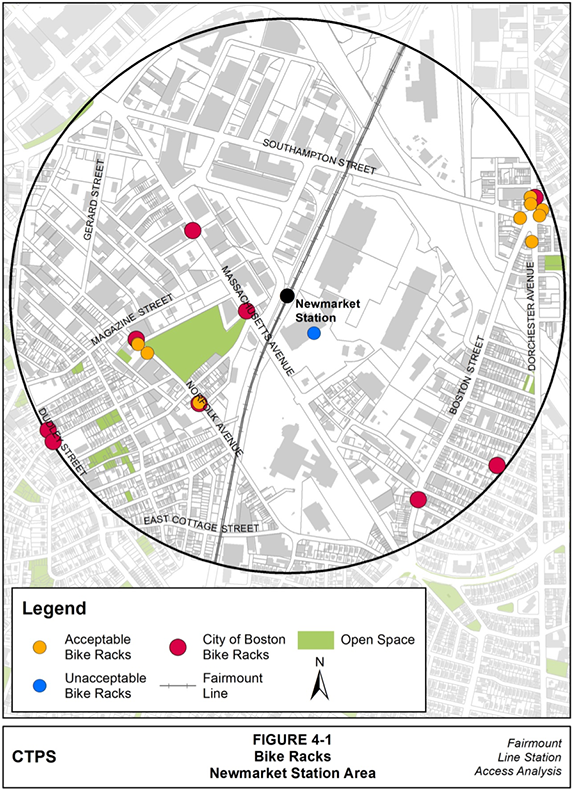
FIGURE 4-5
Bike Racks—Four Corners/Geneva Avenue Station Area
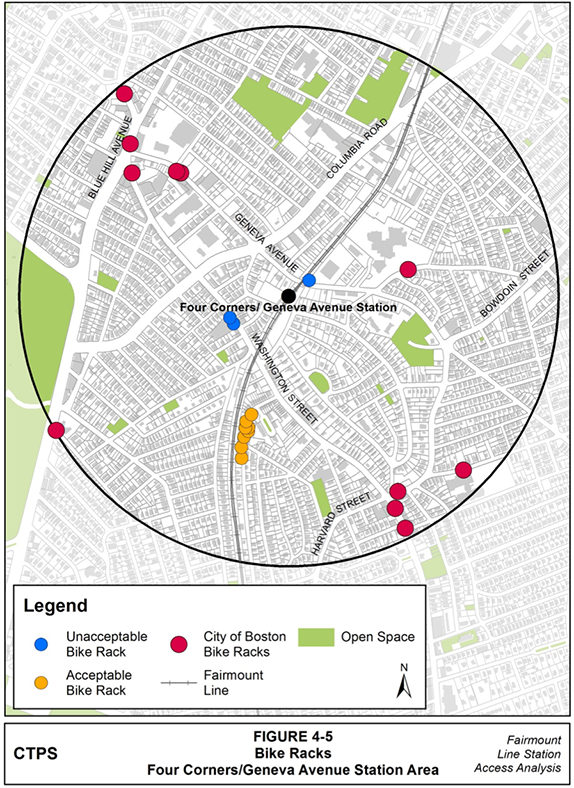
FIGURE 4-6
Bike Racks—Talbot Avenue Station Area
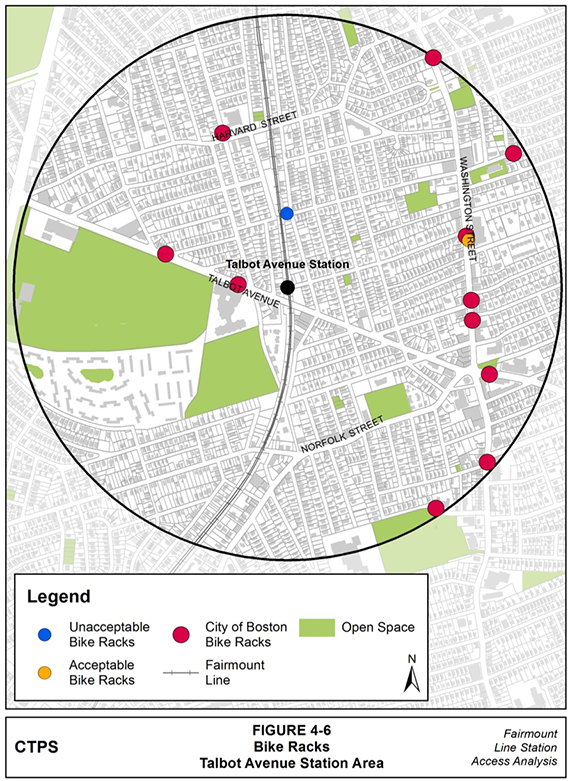
FIGURE 4-7
Bike Racks—Morton Street Station Area
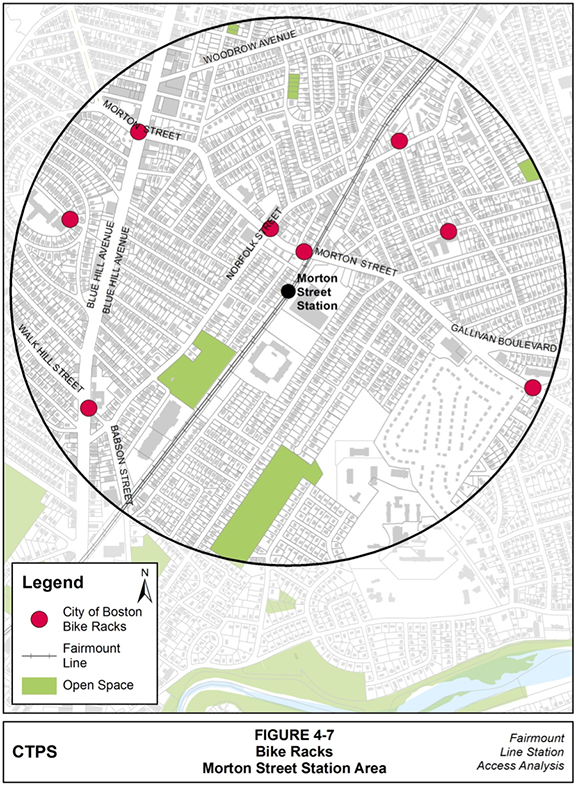
FIGURE 4-8
Bike Racks—Blue Hill Avenue Station Area
93 Essentials of Bike Parking: Selecting and Installing Bicycle Parking That Works; Association of Pedestrian and Bicycle Professionals (APBP); September 2015; pages 6-8.
94 Essentials of Bike Parking: Selecting and Installing Bicycle Parking That Works; Association of Pedestrian and Bicycle Professionals (APBP); September 2015; pages 6-8.
This chapter documents the presence of pedestrian signals throughout the five Fairmount Line station areas. Several signal attributes are listed in tables for each location. The first table in each section provides general information about the station area’s pedestrian signals: Whether the pedestrian phases are exclusive or concurrent with vehicular traffic, whether the phases are accompanied by audible indications, and whether the signals featured countdown displays. The FHWA’s MUTCD states that a pedestrian change interval of more than seven seconds should include a pedestrian change interval countdown display;95 for those with change intervals of seven seconds or less, a countdown display is optional.96 Regarding audible indications, the FHWA does not require pedestrian signals to provide information in non-visual formats such as audible tones, speech messages, or vibrating surfaces; however, the MUTCD includes guidance that, where engineering judgement determines it is appropriate, pedestrian signals should provide non-visual information formats.97
The second table in each section addresses duration of the pedestrian phases—the walk interval (walking person symbol), pedestrian change interval (flashing upraised hand symbol), and red clearance/buffer interval (solid upraised hand symbol while all vehicular signals are red)—and the longest length that pedestrians might cross during the crossing time provided, which is defined as the combined duration of the pedestrian change and buffer intervals. MPO staff used Google Maps to identify and measure the longest crossing length and divided the measurement by its crossing time in order to determine the speed at which pedestrians would need to travel in order to complete the crossing.
The FHWA recommends that crossing time calculations should use a 3.5-feet-per-second walking speed.98 MUTCD guidelines state that pedestrian clearance time should allow an individual walking at a speed of 3.5 feet per second, or slower, to leave the curb and reach either 1) the other side of the street or 2) a median that is wide enough for pedestrians to wait.99 MPO staff calculated crossing speeds at each intersection by measuring the longest crossing at each intersection. The longest crossings were measured from the ramp of one pedestrian-friendly area to another, and therefore did not include accessible medians, which are medians 1) with ramps or cut-throughs, 2) located within the path of a crosswalk, and 3) at least six feet wide. Accessible medians safely accommodate multiple pedestrians and provide sufficient space for a stroller, wheelchair, or bicycle.
In order to verify the information collected in the field, MPO staff requested data from the City of Boston Transportation Department (BTD) for every signalized intersection within the Fairmount Line station areas. MassDOT provided information for a few intersections in the Morton Street station area. Each station area’s pedestrian signal attribute information and timing data recorded in the tables of this chapter come from BTD and MassDOT. Appendix D highlights the differences between the pedestrian signal data collected by MPO staff and the information provided by BTD and MassDOT. The disparities should be assessed by city and state employees because they could represent differences between BTD and MassDOT documentation and the actual conditions at a given location. In some cases, this might mean that pedestrian signals do not provide sufficient time or information for pedestrians to cross roadways safely in spite of satisfactory planning efforts.
MPO staff documented 15 signalized intersections in the station area: 13 intersections were made up exclusively of pedestrian signals with countdowns; while two intersections did not have any countdown pedestrian signals (see Figure 5-1). Table 5-1 cites information about the pedestrian signals at each of the 15 intersections assessed by MPO staff. Two intersections feature both exclusive pedestrian phases and pedestrian phase signals that illuminate concurrently with vehicular traffic.
TABLE 5-1
Pedestrian Signals in the Newmarket Station Area
| Intersection or Crossing |
Exclusive or Concurrent |
Audible |
Count-down |
|---|---|---|---|
112 Southampton Street |
Exclusive |
No |
Yes |
Allstate Road and Massachusetts (Mass.) Avenue |
Exclusive |
No |
Yes |
Blue Hill Ave, Dudley St, Magazine St, Mount Pleasant Ave |
Exclusive |
No |
Yes |
Boston Street and Harvest Street |
Exclusive |
No |
Yes |
Boston Street, Washburn Street, and Frontage Road |
Both |
Yes |
Yes |
Dorchester Avenue, Father Songin Way, O'Connor Way |
Exclusive |
No |
Yes |
Dudley Street, Dunmore Street, and Hampden Street |
Exclusive |
No |
Yes |
Hampden Street, Keegan Street, and Norfolk Avenue |
Concurrent |
No |
Yes |
Magazine Street and Massachusetts Avenue |
Exclusive |
No |
Yes |
Magazine Street and Norfolk Avenue |
Both |
No |
No |
Massachusetts Avenue and Chesterton Street |
Concurrent |
No |
Yes |
Mass. Ave, Melnea Cass Blvd, JFK Ramp, Southampton St |
Concurrent |
No |
Yes |
Massachusetts Ave, Newmarket Square, and Shirley Street |
Concurrent |
No |
Yes |
Southampton Street, Massachusetts Ave, and Bradston St |
Exclusive |
No |
Yes |
Southampton Street and South Bay Drive |
Exclusive |
No |
No |
The duration of the walk interval, pedestrian change interval, and red clearance interval of each Newmarket station area intersection is listed in Table 5-2, below. The table also includes the length of the longest pedestrian crossing associated with the interval durations and the calculated crossing speed at which a pedestrian would need to walk in order to cross the roadway before signals turn green for vehicular traffic. The boxed rows indicate intersections with multiple pedestrian signal timings that are specific to different roadway crossings. Staff found that seven crossing locations’ signal timings allowed pedestrians walking at a speed of 3.5 feet per second or slower to leave the curb and reach the other side of the street or a median that is wide enough for pedestrians to wait. At 16 crossing locations, the interval durations did not provide sufficient time for pedestrians to cross.
TABLE 5-2
Durations, Lengths, and Speeds of Pedestrian Crossings near Newmarket
| Intersection or Crossing |
Walk Interval (seconds) |
Pedestrian Change Interval (seconds) |
Red Clearance Interval (seconds) |
Longest Crossing Length (feet) |
Expected Crossing Speed (feet/sec)a |
|---|---|---|---|---|---|
112 Southampton Street** |
7 |
9 |
1 |
49 |
4.88 |
Allstate Road, Massachusetts Avenue** |
7 |
13 |
4 |
99 |
5.81 |
Blue Hill Ave, Dudley St, Magazine St, Mount Pleasant Ave |
7 |
14 |
4 |
62 |
3.46 |
Boston Street and Harvest Street |
8 |
4 |
4 |
40 |
4.97 |
Boston Street, Washburn St, Frontage Road |
7 |
7 |
4 |
39 |
3.53 |
Boston Street, Washburn St, Frontage Road |
7 |
10 |
4 |
41 |
2.90 |
Dorchester Ave, Father Songin Way, O'Connor Way** |
7 |
10 |
4 |
52 |
3.68 |
Dudley Street, Dunmore Street, and Hampden Street |
7 |
13 |
4 |
71 |
4.18 |
Hampden Street, Keegan Street, and Norfolk Avenue* |
7 |
7 |
2 |
34 |
3.73 |
Hampden Street, Keegan St, Norfolk Avenue |
7 |
7 |
2 |
31 |
3.49 |
Magazine Street, Massachusetts Avenue** |
7 |
10 |
4 |
49 |
3.53 |
Magazine Street and Norfolk Avenue |
4 |
11 |
1 |
43 |
3.62 |
Magazine Street and Norfolk Avenue** |
7 |
6 |
4 |
45 |
4.45 |
Massachusetts Avenue, Chesterton Street |
35 |
8 |
1 |
28 |
3.14 |
Massachusetts Avenue, Chesterton Street |
8 |
8 |
1 |
48 |
5.36 |
Mass Ave, Melnea Cass Blvd, JFK Ramp, Southampton St |
7 |
20 |
2 |
85 |
3.87 |
Mass Ave, Melnea Cass Blvd, JFK Ramp, Southampton St |
7 |
20 |
2 |
51 |
2.31 |
Mass Ave, Melnea Cass Blvd, JFK Ramp, Southampton St |
7 |
22 |
2 |
38 |
1.57 |
Mass Ave, Melnea Cass Blvd, JFK Ramp, Southampton St |
7 |
20 |
2 |
91 |
4.12 |
Massachusetts Ave, Newmarket Square, Shirley St** |
7 |
9 |
2 |
64 |
5.78 |
Massachusetts Ave, Newmarket Square, Shirley St* |
15 |
14 |
3 |
86 |
5.07 |
Southampton St, Massachusetts Ave, Bradston St |
8 |
9 |
4 |
23 |
1.80 |
Southampton Street and South Bay Drive |
7 |
11 |
4 |
59 |
3.94 |
a Longest Crossing Length /(Pedestrian Change Interval + Red Clearance Interval).
Note: Walk interval durations followed by an asterisk indicate that the pedestrian signal rests in the walk phase. Walk interval durations followed by two asterisks indicate that the pedestrian phase is only called after pushbutton actuation.
FIGURE 5-1
Pedestrian Signals—Newmarket Station Area
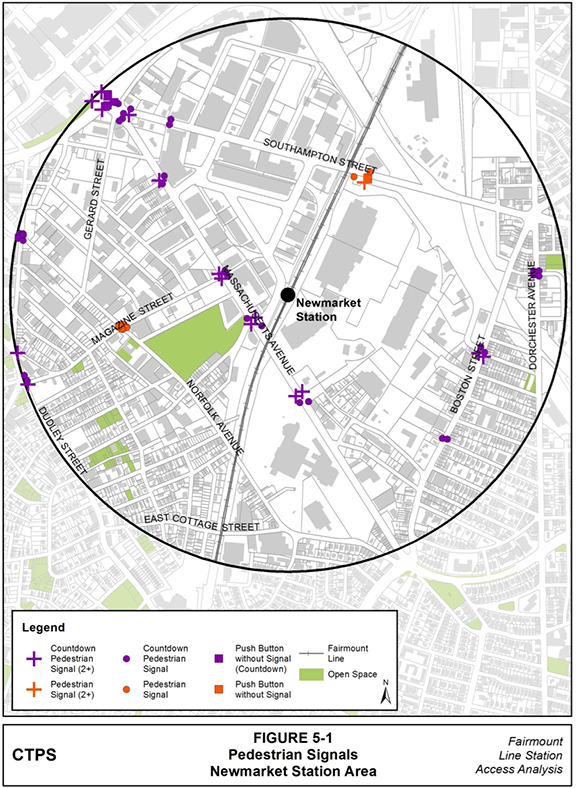
MPO staff documented 15 signalized intersections along the selected roadways in the station area. They found that 11 intersections had pedestrian countdown signals exclusively while two intersections did not have any countdown pedestrian signals at all. The remaining two intersections in the station area are composed of a combination of different types of pedestrian signals, some of which include countdown displays and some of which do not. This information is represented in Figure 5-2-1. Listed in Table 5-2-1 is information about the pedestrian signals at each of the 15 intersections observed by MPO staff. One intersection features both exclusive pedestrian phases and pedestrian phases that illuminate concurrently with vehicular traffic.
TABLE 5-3
Pedestrian Signals in the Four Corners/Geneva Avenue Station Area
| Intersection or Crossing |
Exclusive or Concurrent |
Audible |
Count-down |
|---|---|---|---|
Blue Hill Avenue and Columbia Road |
Exclusive |
No |
Yes |
Blue Hill Avenue and Seaver Street |
Both |
Yes |
13 of 14 |
Blue Hill Avenue, Cheney Street, Washington Street |
Exclusive |
No |
Yes |
Blue Hill Avenue, Warren Street, and Georgia Street |
Concurrent |
No |
Yes |
Columbia Road and Devon Street |
Exclusive |
No |
Yes |
Columbia Road and Geneva Avenue |
Concurrent |
No |
Yes |
Columbia Road and Seaver Street |
Concurrent |
No |
Yes |
Columbia Road and Washington Street |
Concurrent |
No |
Yes |
Columbia Road and Wyola Place |
Exclusive |
No |
No |
Columbia Road, Ceylon Street, and Richfield Street |
Exclusive |
No |
Yes |
Geneva Avenue and Bowdoin Street |
Exclusive |
No |
Yes |
Glen Lane, Blue Hill Avenue, and Glenway Street |
Exclusive |
No |
No |
Harvard Street, Washington St, Bowdoin St, Bowdoin Ave |
Concurrent |
No |
Yes |
Washington Street and Erie Street |
Concurrent |
Yes |
3 of 4 |
Washington Street and Vassar Street |
Exclusive |
No |
Yes |
The pedestrian signals at two intersections in the station area do not feature countdown displays: the six signals where Columbia Road and Wyola Place intersect; and the eight signals at the intersection of Glen Lane, Blue Hill Avenue, and Glenway Street. MPO staff found the pedestrian change interval for the six pedestrian signals at Columbia Road and Wyola Place to be 18 seconds long, although documentation from the Boston Public Works Department indicates that the interval lasts 21 seconds. The pedestrian change interval at the intersection of Glen Lane, Blue Hill Avenue, and Glenway Street is 24 seconds long.
The duration of the walk interval, pedestrian change interval, and red clearance interval of each Four Corners/ Geneva Avenue station area intersection is listed in Table 5-2-2, below. The table also includes the length of the longest pedestrian crossing associated with the interval durations and the calculated crossing speed at which a pedestrian would need to walk in order to cross the roadway before signals turn green for vehicular traffic. The boxed rows indicate intersections with multiple pedestrian signal timings that are specific to different roadway crossings. Staff found that nine crossing locations’ signal timings allowed pedestrians walking at a speed of 3.5 feet per second or slower to leave the curb and reach the other side of the street or a median that is wide enough for pedestrians to wait. At 18 crossing locations, the interval durations did not provide sufficient time for pedestrians to cross.
TABLE 5-4
Durations, Lengths, and Speeds of Pedestrian Crossings near
Four Corners/ Geneva Avenue
| Intersection or Crossing |
Walk Interval (seconds) |
Pedestrian Change Interval (seconds) |
Red Clearance Interval (seconds) |
Longest Crossing Length (feet) |
Expected Crossing Speed (feet/sec)a |
|---|---|---|---|---|---|
Blue Hill Avenue and Columbia Road** |
7 |
27 |
4 |
107 |
3.45 |
Blue Hill Avenue and Seaver Street** |
7 |
9 |
3 |
26 |
2.13 |
Blue Hill Avenue and Seaver Street** |
7 |
6 |
6 |
30 |
2.49 |
Blue Hill Avenue and Seaver Street** |
7 |
19 |
3 |
84 |
3.82 |
Blue Hill Avenue and Seaver Street** |
7 |
6 |
3 |
18 |
2.00 |
Blue Hill Avenue, Cheney St, Washington Street |
7 |
25 |
4 |
88 |
3.02 |
Blue Hill Avenue, Warren Street, Georgia Street |
7 |
10 |
6 |
67 |
4.17 |
Blue Hill Avenue, Warren Street, Georgia Street |
7 |
14 |
4 |
71 |
3.93 |
Blue Hill Avenue, Warren Street, Georgia Street |
7 |
8 |
4 |
52 |
4.30 |
Columbia Road and Devon Street |
7 |
22 |
4 |
93 |
3.59 |
Columbia Road and Geneva Avenue* |
8 |
12 |
4 |
63 |
3.94 |
Columbia Road and Geneva Avenue |
7 |
24 |
4 |
118 |
4.22 |
Columbia Road and Geneva Avenue* |
8 |
12 |
3 |
67 |
4.47 |
Columbia Road and Seaver Street* |
8 |
8 |
3 |
32 |
2.93 |
Columbia Road and Seaver Street |
7 |
20 |
3 |
95 |
4.11 |
Columbia Road and Washington Street* |
8 |
7 |
3 |
45 |
4.52 |
Columbia Road and Washington Street** |
7 |
21 |
3 |
94 |
3.91 |
Columbia Road and Washington Street* |
8 |
7 |
3 |
46 |
4.56 |
Columbia Road and Wyola Place** |
7 |
21 |
4 |
54 |
2.15 |
Columbia Road, Ceylon Street, Richfield Street |
7 |
25 |
4 |
103 |
3.54 |
Geneva Avenue and Bowdoin Street |
7 |
13 |
4 |
81 |
4.75 |
Glen Lane, Blue Hill Avenue, Glenway Street |
7 |
24 |
4 |
94 |
3.37 |
Harvard St, Washington St, Bowdoin St, Bowdoin Ave |
10 |
10 |
1 |
70 |
6.38 |
Harvard St, Washington St, Bowdoin St, Bowdoin Ave |
10 |
10 |
1 |
58 |
5.24 |
Washington Street and Erie Street* |
8 |
7 |
2 |
38 |
4.21 |
Washington Street and Erie Street** |
8 |
8 |
1 |
48 |
5.39 |
Washington Street and Vassar Street** |
7 |
9 |
4 |
45 |
3.48 |
Washington Street and Vassar Street |
13 |
12 |
1 |
38 |
2.92 |
a Longest Crossing Length / (Pedestrian Change Interval + Red Clearance Interval).
Note: Walk interval durations followed by an asterisk indicate that the pedestrian signal rests in the walk phase. Walk interval durations followed by two asterisks indicate that the pedestrian phase is only called after pushbutton actuation.
FIGURE 5-2
Pedestrian Signals—Four Corners/Geneva Avenue Station Area
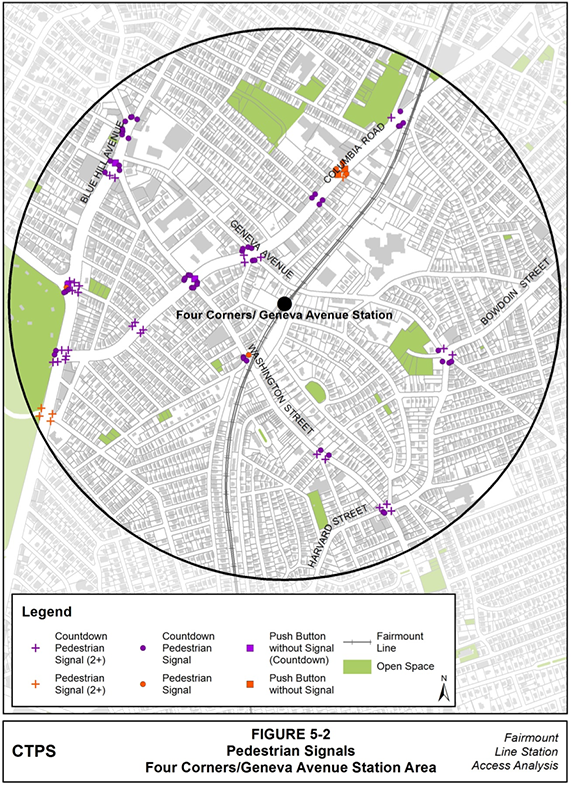
MPO staff documented nine signalized intersections along the selected roadways in the Talbot Avenue station area: seven intersections were exclusively made up of pedestrian signals with countdowns while two intersections did not have any countdown pedestrian signals (see Figure 5-3). Of note is that MPO staff did not find pedestrian signal countdown displays at the intersection of Talbot Avenue, Colonial Avenue, Aspinwall Road, and Spencer Street while documentation from the BTD states that there are pedestrian signal countdown displays at the intersection (see Appendix D). Listed in Table 5-5 is information about the pedestrian signals at each of the nine intersections MPO staff observed in the station area. Table 5-5 shows that every intersection within the Talbot Avenue station area features an exclusive pedestrian phase.
TABLE 5-5
Pedestrian Signals in the Talbot Avenue Station Area
Intersection or Crossing |
Exclusive or Concurrent |
Audible |
Count-down |
Harvard Street, Glenway Street, and Warner Street |
Exclusive |
No |
Yes |
Norfolk Street and Stanton Street |
Exclusive |
No |
Yes |
Norfolk St, New England Avenue, Woodrow Ave |
Exclusive |
No |
Yes |
Talbot Avenue and Bernard Street |
Exclusive |
No |
No |
Talbot Ave, Colonial Ave, Aspinwall Rd, Spencer St |
Exclusive |
No |
Yes |
Talbot Avenue, Norwell Street, New England Ave |
Exclusive |
Yes |
Yes |
Talbot Avenue, Washington Street, Norfolk Street |
Exclusive |
No |
Yes |
Washington Street and Melville Avenue |
Exclusive |
No |
Yes |
Washington Street and Park Street |
Exclusive |
No |
Yes |
The nine pedestrian signals at the intersection of Talbot Avenue and Bernard Street do not feature countdown displays. MPO staff found that the pedestrian change interval for these pedestrian signals last 16 seconds, although documentation from the Boston Public Works Department indicates the interval lasts 12 seconds and is followed by a four-second long red clearance interval.
The duration of the walk interval, pedestrian change interval, and red clearance interval of each Talbot Avenue station area intersection are listed in Table 5-6. The table also includes the length of the longest pedestrian crossing associated with the interval durations and the calculated crossing speed at which a pedestrian would need to walk in order to cross the roadway before signals turn green for vehicular traffic. Staff found that four crossing locations’ signal timings allowed pedestrians walking at a speed of 3.5 feet per second or slower to leave the curb and reach the other side of the street or a median that is wide enough for pedestrians to wait. At five crossing locations, the interval durations did not provide sufficient time for pedestrians to cross.
TABLE 5-6
Durations, Lengths, and Speeds of Talbot Avenue Pedestrian Crossings
Intersection or Crossing |
Walk Interval (seconds) |
Pedestrian Change Interval (seconds) |
Red Clearance Interval (seconds) |
Longest Crossing Length (feet) |
Expected Crossing Speed (feet/sec)a |
Harvard St, Glenway St, Warner St** |
8 |
7 |
4 |
33 |
2.98 |
Norfolk Street and Stanton Street |
7 |
7 |
4 |
52 |
4.75 |
Norfolk St, New England Ave, Woodrow Ave |
7 |
11 |
4 |
58 |
3.89 |
Talbot Avenue and Bernard Street |
7 |
12 |
4 |
74 |
4.63 |
Talbot Ave, Colonial Ave, Aspinwall Rd, Spencer St |
7 |
7 |
4 |
64 |
5.79 |
Talbot Ave, Norwell S, New England Ave** |
7 |
7 |
4 |
49 |
4.43 |
Talbot Avenue, Washington Street, Norfolk St |
7 |
20 |
4 |
84 |
3.48 |
Washington Street and Melville Avenue** |
7 |
9 |
4 |
45 |
3.45 |
Washington Street and Park Street |
7 |
13 |
4 |
48 |
2.84 |
a Longest Crossing Length/(Pedestrian Change Interval + Red Clearance Interval).
Note: Walk interval durations followed by two asterisks indicate that the pedestrian phase is only called after pushbutton actuation.
FIGURE 5-3
Pedestrian Signals—Talbot Avenue Station Area
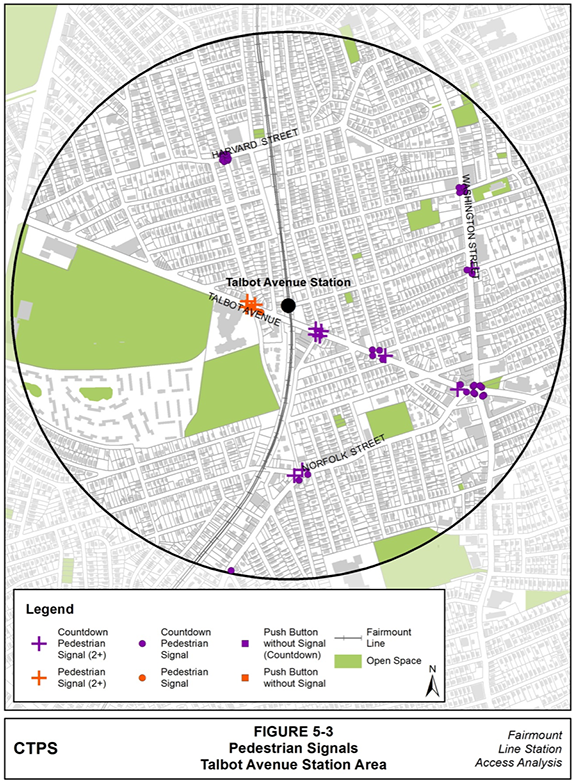
MPO staff documented 16 signalized intersections or crossings along the selected roadways in the Morton Street station area: eight intersections were exclusively made up of pedestrian signals with countdowns while eight intersections and crossings did not have any countdown pedestrian signals (see Figure 5-4). Listed in Table 5-7 is information about the pedestrian signals at each of the 16 intersections and crossings that MPO staff assessed in the station area. The table shows that every intersection and crossing within the Morton Street station area features an exclusive pedestrian phase, although one also includes concurrent pedestrian phases.
One difference between the BTD data and the information collected by MPO staff at the eight BTD-managed Morton Street Station area intersections is that MPO staff did not find pedestrian signal countdown displays at the intersection of Norfolk Street, Fessenden Street, and Mildred Avenue, while documentation from the BTD states that there are pedestrian countdown displays at the intersection. The BTD information, which indicates that the eight Morton Street station area intersections and crossings managed by the BTD include pedestrian countdown displays, is represented in Figure 5-4.
TABLE 5-7
Pedestrian Signals in the Morton Street Station Area
| Intersection or Crossing |
Exclusive or Concurrent |
Audible |
Count-down |
|---|---|---|---|
Blue Hill Avenue and Clarkwood Street |
Exclusive |
Yes |
Yes |
Blue Hill Avenue and Morton Street |
Exclusive |
No |
No |
Blue Hill Avenue and Norfolk Street |
Exclusive |
No |
Yes |
Blue Hill Avenue, Baird Street, and Woodrow Ave |
Exclusive |
No |
Yes |
Blue Hill Avenue, Walk Hill Street, and Babson St |
Exclusive |
No |
Yes |
Blue Hill Avenue, Wellington Hill St, Fessenden St |
Exclusive |
No |
Yes |
Gallivan Boulevard (east of split from Morton St) |
Exclusive |
No |
No |
Morton Street and Evans Street |
Exclusive |
No |
No |
Morton Street and Norfolk Street |
Exclusive |
No |
No |
Morton St (between Theodore and Wildwood Streets) |
Exclusive |
No |
No |
Morton Street (east of Gallivan Boulevard split) |
Exclusive |
No |
No |
Morton Street (west of Gallivan Boulevard split) |
Exclusive |
No |
No |
Morton St, Selden St, West Selden St, Corbet Street |
Exclusive |
No |
Yes |
Norfolk Street and Babson Street |
Both |
No |
Yes |
Norfolk Street and Stanton Street |
Exclusive |
No |
Yes |
Norfolk Street, Fessenden Street, Mildred Avenue |
Exclusive |
No |
Yes |
Only one location in the Morton Street station area features a pedestrian change interval of seven seconds or less—the intersection of Norfolk Street and Stanton Street—but it features countdown displays in spite of its short pedestrian change interval. In spite of MUTCD standards, which dictate that a pedestrian change interval of more than seven seconds should include a pedestrian change interval countdown display,100 the eight pedestrian signals without countdown displays in the Morton Street Station area all have pedestrian change intervals longer than seven seconds (see Table 5-8).
The duration of the walk interval, pedestrian change interval, and red clearance interval of each Morton Street station area intersection is listed in Table 5-8, below. The table also includes the length of the longest pedestrian crossing associated with the interval durations and the calculated crossing speed at which a pedestrian would need to walk in order to cross the roadway before signals turn green for vehicular traffic. The boxed rows indicate intersections with multiple pedestrian signal timings that are specific to different roadway crossings. Staff found that eight crossing locations’ signal timings allowed pedestrians walking at a speed of 3.5 feet per second or slower to leave the curb and reach the other side of the street or a median that is wide enough for pedestrians to wait. Of the eight crossings, three are one of two crossings at the same intersection. These second crossings are among the 12 locations where the interval durations did not provide sufficient time for pedestrians to cross.
Two of the crossings that provide inadequate crossing times occur at the same intersection. To calculate the speed at which pedestrians would need to travel to safely traverse the longest crossing at each of the eight intersections and crossings for which MPO staff did not have BTD information, MPO staff assumed that the duration of the red clearance interval was three seconds long, per MUTCD minimum buffer interval requirements.101
TABLE 5-8
Durations, Lengths, and Speeds of Morton Street Pedestrian Crossings
| Intersection or Crossing |
Walk Interval (seconds) |
Pedestrian Change Interval (seconds) |
Red Clearance Interval (seconds) |
Longest Crossing Length (feet) |
Expected Crossing Speed (feet/ sec)a |
|---|---|---|---|---|---|
Blue Hill Avenue and Clarkwood Street |
7** |
22 |
4 |
92 |
3.55 |
Blue Hill Avenue and Clarkwood Street |
7* |
10 |
4 |
33 |
2.36 |
Blue Hill Avenue and Morton Street |
7 |
15 |
1 |
107 |
6.69 |
Blue Hill Avenue and Norfolk Street |
8** |
21 |
4 |
79 |
3.14 |
Blue Hill Avenue, Baird Street, Woodrow Ave |
7** |
14 |
3 |
91 |
5.38 |
Blue Hill Avenue, Walk Hill Street, Babson St |
7** |
16 |
4 |
34 |
1.69 |
Blue Hill Avenue, Walk Hill Street, Babson St |
7* |
16 |
4 |
72 |
3.58 |
Blue Hill Avenue, Wellington Hill St, Fessenden St |
7 |
24 |
4 |
131 |
4.70 |
Gallivan Boulevard (east of split from Morton St) |
7.2 |
10.2 |
1.2 |
39 |
3.39 |
Morton Street and Evans Street |
6 |
14 |
1 |
63 |
4.21 |
Morton Street and Norfolk Street |
6 |
14 |
1 |
63 |
4.18 |
Morton St (between Theodore and Wildwood Sts) |
12 |
10 |
2 |
63 |
5.28 |
Morton Street (east of Gallivan Boulevard split) |
7.2 |
12 |
1.2 |
60 |
4.51 |
Morton Street (west of Gallivan Boulevard split) |
7 |
17.5 |
1.4 |
40 |
2.12 |
Morton St, Selden St, West Selden St, Corbet St |
6 |
14 |
1 |
62 |
4.13 |
Norfolk Street and Babson Street |
7 |
9 |
1 |
39 |
3.90 |
Norfolk Street and Babson Street |
7 |
11 |
4 |
62 |
4.14 |
Norfolk Street and Stanton Street |
7 |
7 |
4 |
52 |
4.75 |
Norfolk Street, Fessenden Street, Mildred Ave |
7** |
10 |
4 |
61 |
4.33 |
Norfolk Street, Fessenden Street, Mildred Ave |
7 |
10 |
4 |
33 |
2.36 |
a Longest Crossing Length/(Pedestrian Change Interval + Red Clearance Interval).
Note: Walk interval durations followed by an asterisk indicate that the pedestrian signal rests in the walk phase. Walk interval durations followed by two asterisks indicate that the pedestrian phase is only called after pushbutton actuation.
FIGURE 5-4
Pedestrian Signals—Morton Street Station Area
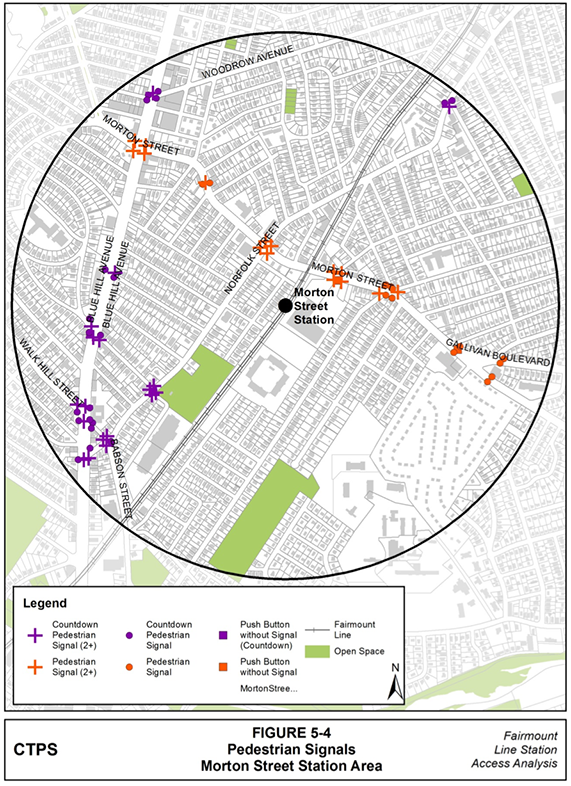
MPO staff documented 15 intersections with pedestrian signals in the station area, 14 of which were located in the City of Boston. The one intersection found by MPO staff in the Milton portion of the station area did not include countdown displays, but completed improvements to the intersection are expected in spring 2017 and will include countdown displays as well as audible and vibro-tactile pedestrian pushbuttons for every pedestrian signal. Vibro-tactile pedestrian pushbuttons communicate pedestrian signal intervals using the perception of vibration through touch. The expected conditions are included in Table 5-9.
Of the 14 City of Boston intersections, MPO staff found that two do not feature countdown displays on their pedestrian signals (see Table 5-9). BTD data indicates countdown displays are present at the two intersections where MPO staff did not observe countdown displays. BTD documentation also indicates that there are not countdown displays at one intersection where MPO staff to noted countdown displays. Table 5-9 lists information about the pedestrian signals at each of the 14 intersections that MPO staff observed in the Boston portion of the Blue Hill Avenue station area. One intersection features both exclusive pedestrian phases and pedestrian phases that illuminate concurrently with vehicular traffic.
TABLE 5-9
Pedestrian Signals in the Blue Hill Avenue Station Area
Intersection or Crossing |
Exclusive or Concurrent |
Audible |
Count-down |
Babson Street and Fremont Street |
Exclusive |
No |
Yes |
Babson Street and Norfolk Street |
Both |
No |
Yes |
Blue Hill Avenue and Babson Street |
Exclusive |
No |
Yes |
Blue Hill Avenue and Fairway Street |
Exclusive |
No |
Yes |
Blue Hill Avenue and Norfolk Street |
Exclusive |
No |
Yes |
Blue Hill Avenue and Woodhaven Street |
Exclusive |
No |
Yes |
Blue Hill Avenue, Regis Road, and Fremont Street |
Exclusive |
No |
Yes |
Blue Hill Avenue, River Street, and Cummins Highway |
Concurrent |
No |
Yes |
Blue Hill Avenue, Walk Hill Street, and Babson Street |
Exclusive |
No |
Yes |
Cummins Highway and Itasca Street |
Concurrent |
No |
No |
Cummins Highway and Woodhaven Street |
Exclusive |
No |
Yes |
Cummins Highway, Rexford Street, and Rockdale St |
Exclusive |
No |
Yes |
Norfolk Street, Fessenden Street, and Mildred Avenue |
Exclusive |
No |
Yes |
Rector Road and River Street |
Exclusive |
No |
Yes |
Blue Hills Parkway, Brush Hill Road, and Eliot Street |
-- |
Yes |
Yes |
According to BTD documentation, there is one intersection in the Blue Hill Avenue station area with pedestrian signals that do not feature countdown displays: the intersection of Cummins Highway and Itasca Street. This intersection also features a pedestrian change interval longer than seven seconds across Cummins Highway. MUTCD standards dictate that the pedestrian signals at the crossing should include countdown displays.
Table 5-10 lists the duration of the walk interval, pedestrian change interval, and red clearance interval of each Blue Hill Avenue station area intersection. The table also includes the length of the longest pedestrian crossing associated with the interval durations and the calculated crossing speed at which a pedestrian would need to walk in order to cross the roadway before signals turn green for vehicular traffic. The boxed rows indicate intersections with multiple pedestrian signal timings that are specific to different roadway crossings. Staff found that six crossing locations’ signal timings allowed pedestrians walking at a speed of 3.5 feet per second or slower to leave the curb and reach the other side of the street or a median that is wide enough for pedestrians to wait. At 15 crossing locations, the interval durations did not provide sufficient time for pedestrians to cross.
TABLE 5-10
Durations, Lengths, and Speeds of Blue Hill Avenue Pedestrian Crossings
Intersection or Crossing |
Walk Interval (seconds) |
Pedestrian Change Interval (seconds) |
Red Clearance Interval (seconds) |
Longest Crosswalk Length (feet) |
Expected Crossing Speed (feet/ sec)a |
Babson Street and Fremont Street |
8 |
8 |
4 |
56 |
4.66 |
Babson Street and Norfolk Street |
7 |
9 |
1 |
39 |
3.86 |
Babson Street and Norfolk Street |
7 |
11 |
4 |
63 |
4.21 |
Blue Hill Avenue and Babson Street** |
7 |
16 |
4 |
34 |
1.69 |
Blue Hill Avenue and Babson Street* |
7 |
16 |
4 |
71 |
3.56 |
Blue Hill Avenue and Fairway Street |
7 |
15 |
4 |
73 |
3.87 |
Blue Hill Avenue and Norfolk Street** |
8 |
21 |
4 |
79 |
3.14 |
Blue Hill Avenue and Woodhaven Street** |
7 |
21 |
4 |
41 |
1.63 |
Blue Hill Avenue, Regis Road, Fremont Street |
7 |
15 |
4 |
43 |
2.24 |
Blue Hill Avenue, River St, Cummins Highway** |
6 |
9 |
2 |
40 |
3.61 |
Blue Hill Avenue, River St, Cummins Highway** |
6 |
9 |
5 |
92 |
6.54 |
Blue Hill Avenue, River St, Cummins Highway** |
6 |
9 |
2 |
60 |
5.44 |
Blue Hill Avenue, Walk Hill Street, Babson St |
7 |
10 |
4 |
80 |
5.75 |
Cummins Highway and Itasca Street* |
7 |
5 |
3 |
44 |
5.53 |
Cummins Highway and Itasca Street** |
7 |
11 |
2 |
64 |
4.90 |
Cummins Highway and Woodhaven Street |
7 |
10 |
4 |
62 |
4.40 |
Cummins Highway, Rexford St, Rockdale St |
7 |
10 |
4 |
67 |
4.76 |
Norfolk Street, Fessenden St, Mildred Avenue** |
7 |
10 |
4 |
61 |
4.39 |
Norfolk Street, Fessenden Street, Mildred Ave |
7 |
10 |
4 |
34 |
2.40 |
Rector Road and River Street |
7 |
13 |
4 |
33 |
1.92 |
Rector Road and River Street* |
8 |
7 |
4 |
42 |
3.82 |
Blue Hills Parkway, Brush Hill Road, Eliot Street |
-- |
-- |
-- |
-- |
-- |
aLongest Crossing Length/(Pedestrian Change Interval + Red Clearance Interval).
Note: Intersection names followed by an asterisk indicate that the pedestrian signal rests in the walk phase. Intersection names followed by two asterisks indicate that the pedestrian phase is only called after pushbutton actuation.
FIGURE 5-5
Pedestrian Signals—Blue Hill Avenue Station Area
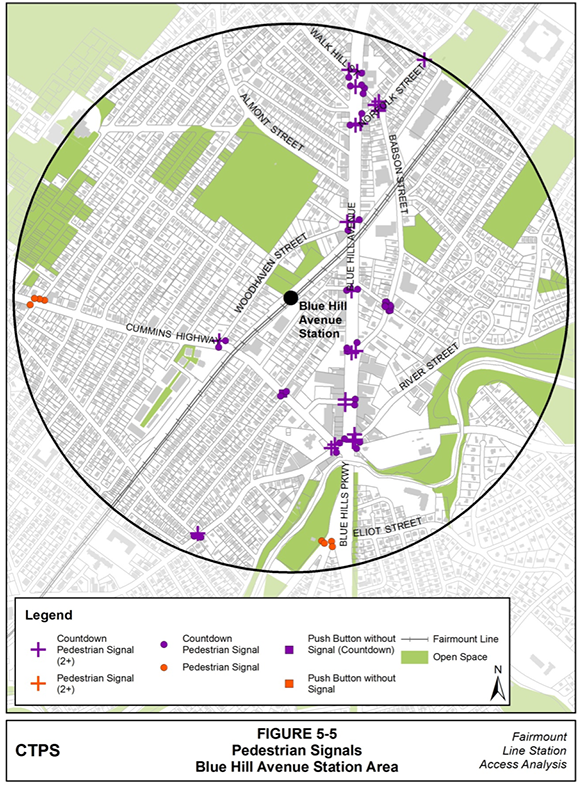
95 Manual on Uniform Traffic Control Devices, Part 4: Highway Traffic Signals, Chapter 4E: Pedestrian Control Features, Section 4E.07: Countdown Pedestrian Signals; Federal Highway Administration; December 2009; page 499.
96 Manual on Uniform Traffic Control Devices, Part 4: Highway Traffic Signals, Chapter 4E: Pedestrian Control Features, Section 4E.06: Pedestrian Intervals and Signal Phases; Federal Highway Administration; December 2009; page 497.
97 Manual on Uniform Traffic Control Devices, Part 4: Highway Traffic Signals, Chapter 4E: Pedestrian Control Features, Section 4E.09: Accessible Pedestrian Signals and Detectors - General; Federal Highway Administration; December 2009; page 504.
98 Designing Sidewalks and Trail for Access, Part II of II: Best Practices Design Guide, Chapter 8: Pedestrian Crossings, Section 8.6: Crossing Times; Federal Highway Administration; September 2001; page 8-17.
99 Manual on Uniform Traffic Control Devices, Part 4: Highway Traffic Signals, Chapter 4E: Pedestrian Control Features, Section 4E.06: Pedestrian Intervals and Signal Phases; Federal Highway Administration; December 2009; page 497.
100 Manual on Uniform Traffic Control Devices, Part 4: Highway Traffic Signals, Chapter 4E: Pedestrian Control Features, Section 4E.07: Countdown Pedestrian Signals; Federal Highway Administration; December 2009; page 499.
101 Manual on Uniform Traffic Control Devices, Part 4: Highway Traffic Signals, Chapter 4E: Pedestrian Control Features, Section 4E.06: Pedestrian Intervals and Signal Phases; Federal Highway Administration; December 2009; page 497.
This chapter documents sidewalk widths in each station area, especially at locations where sidewalks are narrower than five feet. Each section consists of a table that lists the measurements and provides information about obstructions at the specific locations. MPO staff identified each sidewalk measurement with the name of the street on which it was taken and included a general description of the area.
Table 6-1 below cites sidewalk widths in the Newmarket area.
TABLE 6-1
Sidewalks in the Newmarket Station Area
| Street |
Location |
Side of Street |
Sidewalk Width |
Sidewalk Obstruction |
Width to Obstruction |
|---|---|---|---|---|---|
Southampton Street |
Between Newmarket Square and Allstate Road (in front of Costas Provisions, Good Guys Provision, and South Bay Motors) |
South |
-- |
Pole |
4'9" |
Southampton Street |
East of where Allstate Road intersects the south side of Southampton Street |
North |
-- |
Pole |
3'1" |
Southampton Street |
West median on Southampton Street at the entrance to I-93 Frontage Road |
North |
3'8" (median cut-through width) |
-- |
-- |
Southampton Street |
Right before the intersection with the I-93 Frontage Road (just to the east of the Frontage Road entrance) |
North |
-- |
Pole |
3'8" |
Southampton Street |
Where Southampton Street crosses the railroad tracks (west of Andrew Square) |
North |
4'11" |
Pole |
3'0" (pavement to pole) 2'5" (pavement) |
Boston Street |
South of Ellery Street, where Father Songin Way intersects Boston Street from the east |
West |
10' |
Pole (in middle) |
4'9" (either side) |
Boston Street |
Where Ellery Street intersects Boston Street from the west |
East |
10' |
Tree Pit |
3'9" |
Boston Street |
North of Power Street |
West |
-- |
Hydrant |
3'4" |
Boston Street |
West of Power Street |
West |
-- |
Pole |
3'6" |
Boston Street |
Just north of Rawson Street |
West |
-- |
Pole |
2'9" |
Boston Street |
Between West Bellflower Street, Enterprise Street |
West |
-- |
Street Trees |
5' |
Massachusetts Avenue |
Northwest of Edward Everett Square |
East |
8'6" |
Pole |
5'10" |
Massachusetts Avenue |
Northwest of Edward Everett Square |
West |
8'0" |
Pole |
5'6" |
Massachusetts Avenue |
Northwest of Allstate Road |
West |
7'11" |
-- |
-- |
Massachusetts Avenue |
North of Allstate Road |
East |
10'3" |
-- |
-- |
Massachusetts Avenue |
1010 Massachusetts Avenue |
East |
11'10" |
Tree Planter |
5'7" |
Massachusetts Avenue |
North of 1010 Massachusetts Avenue |
East |
4'4" |
-- |
-- |
Massachusetts Avenue |
South of Theodore Glynn Way |
East |
12'1" |
Bus Shelter |
5'8" |
Hampden Street |
Between Howard Street and George Street |
East |
6'6" |
Pole |
3'0" |
Hampden Street |
Between Howard Street and George Street |
East |
6'6" |
Hydrant |
4'0" |
Dudley Street |
Southeast corner of Dudley/ Langdon Intersection |
East |
10'1" |
Pole |
5'8" |
Langdon Street |
North of Dudley Street Neighborhood Charter School, per GoogleMaps (or Emerson School, according to sign) |
South |
10'1" |
Bus Shelter |
4'6" |
East Cottage Street |
West of the East Cottage Street, Norfolk Avenue, and Humphreys Street intersection |
North |
6'11" |
Hydrant to Vegetation |
2'3" |
East Cottage Street |
West of the East Cottage Street, Norfolk Avenue, and Humphreys Street intersection |
North |
6'11" |
Hydrant to Fence |
4'11" |
East Cottage Street |
Curve where East Cottage Street becomes Norfolk Avenue |
Northeast |
6'8" |
Pole |
3'2" |
East Cottage Street |
East of the Fairmount Line rail bridge |
South |
6'7" |
Fence in sidewalk |
5'11" |
East Cottage Street |
Driveway that is just east of the Fairmount Line rail bridge |
South |
- |
Fence across driveway entrance |
3'10" |
East Cottage Street |
East of East Cottage Street intersection with Humphreys Street and Norfolk Avenue |
South |
7' |
Tree Box to Fence |
4'5" |
East Cottage Street |
East of East Cottage Street intersection with Humphreys Street and Norfolk Avenue |
South |
7' |
Tree Box to Fence |
3'6" |
East Cottage Street |
East of East Cottage Street intersection with Humphreys Street and Norfolk Avenue |
South |
7' |
Tree Box to Fence |
3'7" |
East Cottage Street |
East of East Cottage Street intersection with Humphreys Street and Norfolk Avenue |
North |
6'11" |
Hydrant |
4'10" |
Norfolk Avenue |
Between Magazine Street, Gerard Street |
East |
7'6" |
Vegetation |
2'3" |
Norfolk Avenue |
Between Gerard Street and Hampden Street |
West |
6'0" |
Driveway Curb Ramp to Fence |
4'4" |
Norfolk Avenue |
Between Gerard Street and Hampden Street |
East |
6'11" |
Pole |
3'7" |
Magazine Street |
Between Norfolk Avenue and Cedric Street |
South |
6'7" |
Pole |
3'4" |
Magazine Street |
Between Cedric Street and George Street |
South |
6'0" |
-- |
-- |
Magazine Street |
Between Eustis Street and Dunmore Street |
North |
7'6" |
Pole |
5'0" |
Magazine Street |
Between Dunmore Street and Dudley St |
South |
7'2" |
Pole |
4'5" |
Shirley Street |
Between Roswell Street and George Street |
South |
7'4" |
-- |
-- |
Clifton Street |
At intersection with Longmeadow Street |
West |
7'0" |
Tree |
3'5" |
Table 6-2 contains MPO staff sidewalk observations in the Four Corners/Geneva Avenue station area.
TABLE 6-2
Sidewalks in the Four Corners/Geneva Avenue Station Area
| Street |
Location |
Side of Street |
Sidewalk Width |
Sidewalk Obstruction |
Width to Obstruction |
|---|---|---|---|---|---|
| Puritan Avenue |
Near intersection with Richfield Street |
Southeast |
5' |
Debris |
3' |
| Geneva Avenue |
Beside Geneva Cliffs, between Everton/ Bowdoin Sts |
Southwest |
6'5" |
Pole |
4'6" |
| Richfield Street |
Near Pilgrim Place, between Westwood Street/ Puritan Ave |
Southwest |
6'8" |
Tree |
3' |
| Richfield Street |
Near Pilgrim Place, between Westwood Street/ Puritan Ave |
Southwest |
6'8" |
Tree Grate |
1'8" |
| Richfield Street |
Near Pilgrim Place, between Westwood Street/ Puritan Ave |
Southwest |
6'8" |
Pole |
4'6" |
| Richfield Street |
Near Pilgrim Place, between Westwood Street/ Puritan Ave |
Southwest |
6'8" |
Pole Area |
4' |
| Richfield Street |
Between Davidson Ave and Olney St |
West |
6'11" |
Pole |
4'2" |
| Geneva Avenue |
Between Bishop Joel Smith Way/ Normandy St |
Northeast |
7' |
Overgrown Vegetation |
4'2" |
| Geneva Avenue |
Between Bishop Joel Smith Way/ Normandy St |
Northeast |
7' |
Pole |
3'9" |
| Homes Avenue |
Between Topliff St/ Geneva Ave |
North |
7'1" |
Tree |
2'10' |
| Holland School Path |
UP Holland Academy |
-- |
6' |
-- |
-- |
| Geneva Avenue |
Between Fairmount Line and Olney St |
South |
6'2" |
-- |
--- |
| Geneva Avenue |
Between Vaughan Ave and the Fairmount Line |
South |
7'2" |
-- |
-- |
| Washington Street |
Between Norwell and Vassar Streets |
Northeast |
9'8" |
-- |
-- |
FIGURE 6-1
Debris on Puritan Avenue near Richfield Street
|
Source: Central Transportation Planning Staff.
FIGURE 6-2
Narrow Sidewalk on Richfield Street
|
Source: Central Transportation Planning Staff.
FIGURE 6-3
Overgrown Vegetation on Geneva Avenue
Source: Central Transportation Planning Staff.
Table 6-3 below cites sidewalk conditions in the Talbot Avenue station area that were observed and documented by staff.
TABLE 6-3
Sidewalks in the Talbot Avenue Station Area
| Street |
Location |
Side of Street |
Sidewalk Width |
Sidewalk Obstruction |
Width to Obstruction |
|---|---|---|---|---|---|
Dunbar Avenue/ Wentworth Terrace |
Roberts Playground |
South |
7' |
-- |
-- |
Edson Street |
Between Norfolk Street and path to Roberts Playground |
West |
6'4" |
Fire Hydrant |
4'4" |
Edson Street |
Between Norfolk Street and path to Roberts Playground |
West |
6'4" |
Pole |
2'9" |
Edson Street |
Between Norfolk Street and path to Roberts Playground |
East |
6'10" |
-- |
-- |
Ferndale Street |
Between Southern Avenue/ Norfolk Street |
East |
6'8" |
Tree |
2'9" |
Ferndale Street |
Between Southern Avenue/ Norfolk Street |
West |
6'6" |
Fire Hydrant |
4'2" |
New England Ave |
Between Norfolk Street/ Southern Avenue |
West |
4'3" |
Pole |
1'7" |
Norfolk Street |
Intersection with Withington Street |
North |
7'10" |
Pole |
5'5" |
Paved Path |
Harambee Park |
Center |
10' |
-- |
-- |
Talbot Avenue |
Between Helen Street and Bernard Street |
North |
8'8" |
-- |
-- |
Talbot Avenue |
Between Blue Hill Ave/ Harvard St/ Nightingale St |
North |
10'1.5" |
-- |
-- |
Talbot Avenue |
Between Nightingale Street and Wales Street |
South |
12' |
- |
-- |
Talbot Avenue |
Between Westcott Street/ Fairmount Rail Line |
South |
10' |
-- |
-- |
Talbot Avenue |
Under Fairmount Line Rail Bridge |
North |
9'8" |
-- |
-- |
Wollaston Terrace |
Between Woodrow Avenue Jones Avenue |
East |
4' |
Fire Hydrant |
2' |
Woodrow Avenue |
Between New England Ave/ Fairmount Rail Line |
North |
7'11" |
Tree |
4'5" |
FIGURE 6-4
Overgrown Vegetation between Browning Avenue and Kingsdale Street
Source: Central Transportation Planning Staff.
FIGURE 6-5
South View of New England Avenue from Southern Avenue Intersection
Source: Central Transportation Planning Staff.
FIGURE 6-6
New England Avenue Sidewalk between Southern Avenue
and Norfolk Street
|
MPO staff’s assessment of sidewalks in the Morton Street station area is presented in Table 6-4.
TABLE 6-4
Sidewalks in the Morton Street Station Area
| Street |
Location |
Side of Street |
Sidewalk Width |
Sidewalk Obstruction |
Width to Obstruction |
|---|---|---|---|---|---|
Morton Street |
Just northwest of Lorna Road |
West |
11'9" |
-- |
-- |
West Selden Street |
Southwest of Morton Street |
Southeast |
7' 9.5" |
Pole |
4'6" |
West Selden Street |
Between Wooddale Ave and Rich St |
Northwest |
7'10" |
Leaves |
5'3" |
Morton Street |
Between Fuller St and Selden St |
East |
8'10" |
-- |
- |
Fuller Street |
Between Capen St and Morton St |
North |
6'6" |
Pole |
4' 1.5" |
Selden Street |
Between Capen St and Milton Ave |
North |
7'0" |
Pole |
5'0" |
Gallivan Boulevard |
Between Pine Ridge Rd/ Wilmington Ave |
North |
7'2" |
Hydrant |
6' |
Standard Street |
Curve in Standard St located south of intersection of Woodgate St/ Woodbole Ave |
East |
6'10" |
Tree Cut Out |
3'3" |
Woodgate Street |
Between Woodbole Ave/ Standard St |
West |
6' 10.5" |
Tree Cut Out |
3' 3.5" |
Morton Street |
Between Woodgate St/ Gallivan Blvd |
South |
9'10" |
Pole |
6' 5" |
Pine Ridge Road |
Northeast corner of where Pine Ridge Road meets Morton Street |
Southeast |
6'2" |
Pole |
4' |
West Selden Street |
Between Lena Terrace/ Wooddale Ave |
Southeast |
8' |
Tree Cut Out |
2'10" |
West Selden Street |
Between Lena Terrace/ Wooddale Ave |
Southeast |
8' |
Debris |
2' |
West Selden Street |
Between Halborn Street and Rich Street |
West |
7'6" |
-- |
-- |
Gladeside Avenue |
Between Cragmere Terrace/ Arborcrest Terr |
West |
4' |
Tree |
2'8" |
Gladeside Avenue |
Between Cragmere Terrace/ Arborcrest Terr |
West |
4' |
Debris |
2'10" |
Astoria Street |
Between Elizabeth and Flint Sts |
East |
7'1" |
Hydrant |
4'9" |
George H. Walker Playground Path |
Walker Playground |
North |
5'5" |
-- |
-- |
George H. Walker Playground Path |
Walker Playground |
South |
5'8" |
-- |
-- |
Walk Hill Street |
Northwest of Fottler Road |
Southwest |
6'11" |
Pole |
4' |
Blue Hill Avenue |
Across from Tennis Road entrance |
East |
14'6" |
Tree |
8'7" |
Babson Street |
Between where Babson Street crosses the Fairmount rail line/ Mildred Ave |
East |
4'4" |
Extra narrow point |
3' 11.5" |
Babson Street |
Wider Alternate Sidewalk: Between where Babson Street crosses the Fairmount rail line and Mildred Avenue |
East |
6'6" |
Narrowest point |
5'6" |
Blue Hill Avenue |
Between Morton St/ Landor Road |
East |
10'1" |
Tree |
4'11" |
Table 6-5 presents MPO staff’s observations of sidewalks in the Blue Hill Avenue station area.
TABLE 6-5
Sidewalks in the Blue Hill Avenue Station Area
| Location |
Side of Street |
Sidewalk Width |
Sidewalk Obstruction |
Width to Obstruction |
|---|---|---|---|---|
| Between location just east of Gladeside Ave and location slightly west of Fremont Street |
South |
6'8" |
Slope |
4' |
| Between Fremont Street and Blue Hill Ave, River St, Cummins Highway intersection |
South |
8'4" |
Tree Cut Out |
2'10" |
| West of Blue Hills Parkway, south of Blue Hill Ave, River St, Cummins Highway intersection |
-- |
6'1" |
-- |
-- |
| West of Blue Hills Parkway, south of Blue Hill Ave, River St, Cummins Highway intersection |
-- |
8'0" |
-- |
-- |
| Between Messinger St and Newcastle St |
West |
-- |
Narrow Point |
2'10" |
Chapter 7—Curb Ramps and Detectable Warnings
This chapter provides information about the curb ramps and detectable warnings in the five Fairmount Line station areas. When MPO staff found curb ramps and detectable warnings in the field, they marked their locations and indicated their types. Appendix B provides information and illustrations that specify curb ramp types. Perpendicular curb ramps are aligned with the crossing direction on tight radius corners while diagonal curb ramps are located at the apex of an intersection corner. MPO staff differentiated between diagonal curb ramps and apex curb ramps by identifying curb ramps that served one crossing as diagonal and curb ramps that served two crossings as apex. They also noted where curb ramps should have been present but were missing. Curb ramps were often identified as missing at locations where MPO staff observed crosswalks that led to curbs instead of curb ramps.
In addition to documenting the presence of curb ramps, MPO staff also marked whether they observed detectable warnings at curb ramps and other transitions along sidewalks and public streets. Detectable warnings alert users to their presence through their texture of truncated domes, contrast in color from the surrounding surface, and material change from the surrounding surface. The Americans with Disabilities Act Accessibility Guidelines (ADAAG) state that detectable warnings—distinctive dome-shaped surface patterns that, when detected underfoot or by cane, alert pedestrians to the boundary between street and sidewalk—should accompany every curb ramp and median cut-through.
MPO staff observed 257 curb ramps within the Newmarket Station area. The numbers of each type of ramp are summarized in Table 7-1; and the curb ramp and median cut-through distribution in the Newmarket station area is illustrated in Figure 7-1. MPO staff noted 140 detectable warnings in the Newmarket Station area (see Figure 7-1; however, there should have been 271 detectable warnings to accommodate every transition that MPO staff observed in the area.
TABLE 7-1
Newmarket Station Area Curb Ramps
Curb Ramp Type |
Number of Ramps |
Diagonal |
113 |
Perpendicular |
111 |
Apex |
33 |
Median Cut-Through |
7 |
Missing Curb Ramp |
43 |
Total |
307 |
MPO staff observed 294 curb ramps within the station area. One of these provides three directions for leaving a pedestrian island at the intersection of Seaver Street and Blue Hill Avenue. The numbers of each curb ramp type in the station area are summarized in Table 7-2 and the curb ramp and median cut-through distribution within the Four Corners/Geneva Avenue station area is illustrated in Figure 7-2.
TABLE 7-2
Four Corners/Geneva Avenue Station Area Curb Ramps
Curb Ramp Type |
Number of Ramps |
Diagonal |
113 |
Perpendicular |
111 |
Apex |
33 |
Median Cut-Throughs |
7 |
Missing Curb Ramp |
43 |
While gathering data in the Four Corners/Geneva Avenue station area, MPO staff observed 184 detectable warnings. Their distribution throughout the station area is documented in Figure 7-2. One of the 10 median cut-throughs provides three directions for leaving a pedestrian island. This median cut-through, located at the intersection of Seaver Street and Blue Hill Avenue, should include three detectable warnings instead of the typical two. A total of 315 detectable warnings would be required to accompany every curb ramp and median cut-through transition that MPO staff observed in the station area.
MPO staff observed 300 curb ramps within the Talbot Avenue station area. The numbers of each curb ramp type in the station area are summarized in Table 7-3 and the curb ramp and median cut-through distribution within the Talbot Avenue station area is illustrated in Figure 7-3. MPO staff observed 145 detectable warnings in the station area, and 300 are needed for the station area to be in accordance with the ADAAG. The distribution of the existing warnings is documented in Figure 7-3.
TABLE 7-3
Talbot Avenue Station Area Curb Ramps
Curb Ramp Type |
Number of Ramps |
Diagonal |
135 |
Perpendicular |
114 |
Apex |
51 |
Median Cut-Throughs |
0 |
Missing Curb Ramp |
39 |
MPO staff observed 264 curb ramps within the Morton Street station area, which are summarized in Table 7-4; curb ramp and median cut-through distribution within the Morton Street station area is illustrated in Figure 7-4. In order to comply with ADAAG, 284 detectable warnings would be required to accompany each curb ramp and median cut-through in the Morton Street Station area. However, only 98 detectable warnings are currently in place (see Figure 7-4).
TABLE 7-4
Morton Street Station Area Curb Ramps
Curb Ramp Type |
Number of Ramps |
Diagonal |
131 |
Perpendicular |
106 |
Apex |
27 |
Median Cut-Throughs |
10 |
Missing Curb Ramp |
39 |
MPO staff observed 261 curb ramps within the Blue Hill Avenue station area, which are summarized in Table 7-5; the curb ramp and median cut-through distribution within the Blue Hill Avenue station area is illustrated in Figure 7-5. In order to comply with ADAAG, 271 detectable warnings would be required to accompany each curb ramp and median cut-through in the Blue Hill Avenue station area; MPO staff observed only 163 existing detectable warnings (see Figure 7-5).
TABLE 7-5
Blue Hill Avenue Station Area Curb Ramps
Curb Ramp Type |
Number of Curb Ramps |
Diagonal |
133 |
Perpendicular |
99 |
Apex |
29 |
Median Cut-Through |
5 |
Missing Curb Ramp |
25 |
FIGURE 7-1
Curb Ramps—Newmarket Station Area
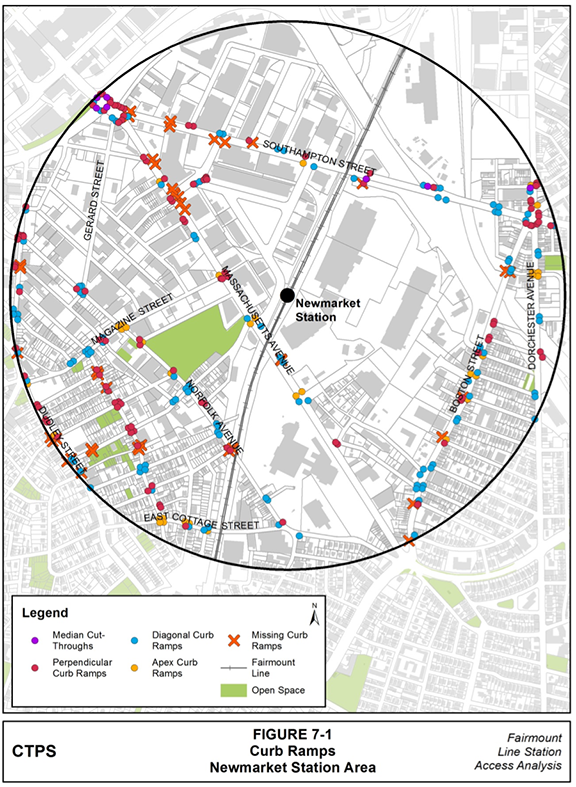
FIGURE 7-2
Detectable Warnings—Newmarket Station Area
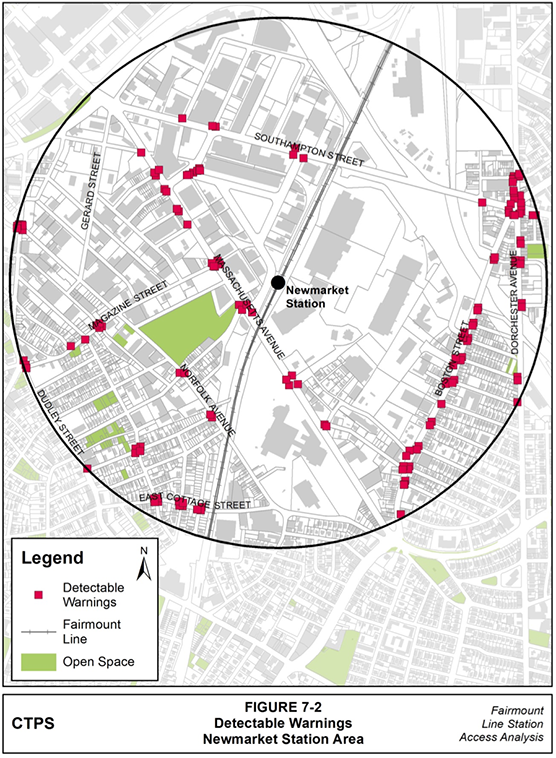
FIGURE 7-3
Curb Ramps—Four Corners/Geneva Avenue Station Area
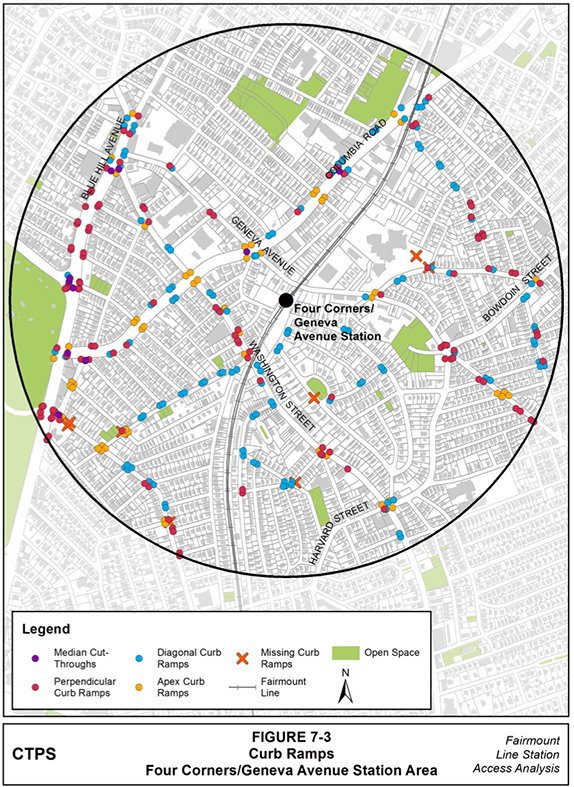
FIGURE 7-4
Detectable Warnings—Four Corners/Geneva Avenue Station Area
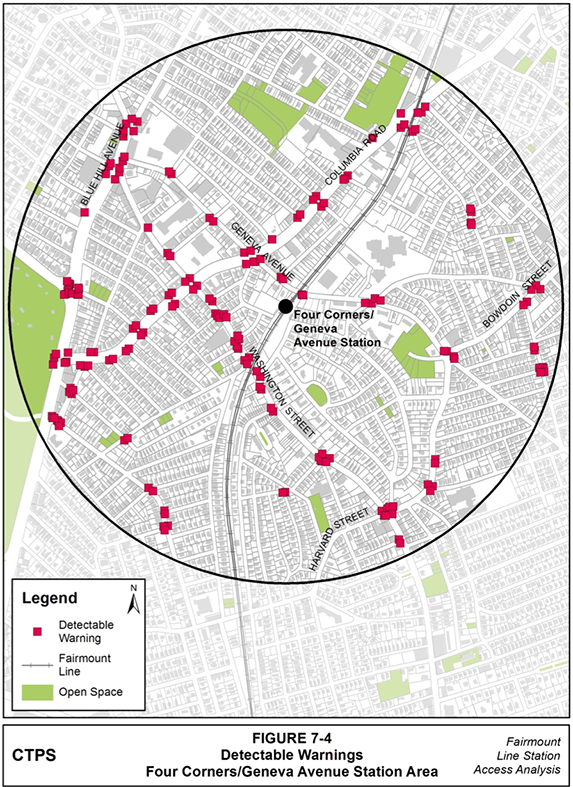
FIGURE 7-5
Curb Ramps—Talbot Avenue Station Area
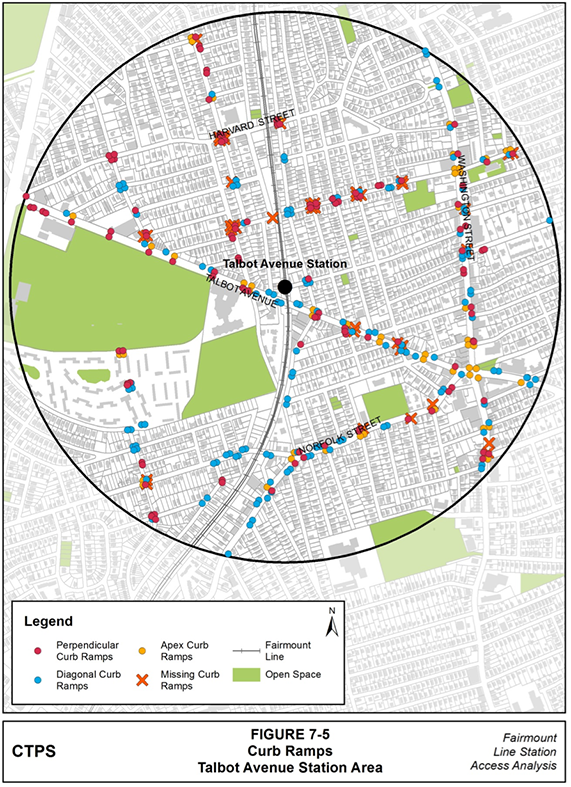
FIGURE 7-6
Detectable Warnings—Talbot Avenue Station Area
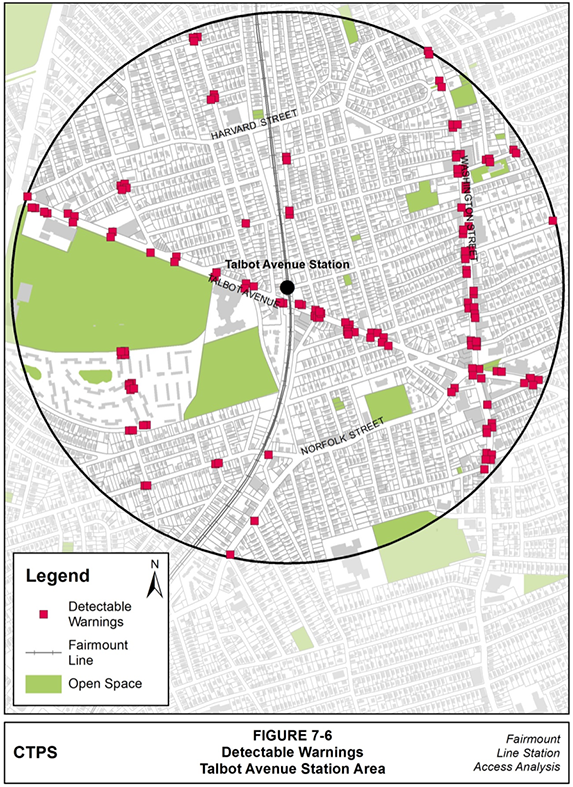
FIGURE 7-7
Curb Ramps—Morton Street Station Area
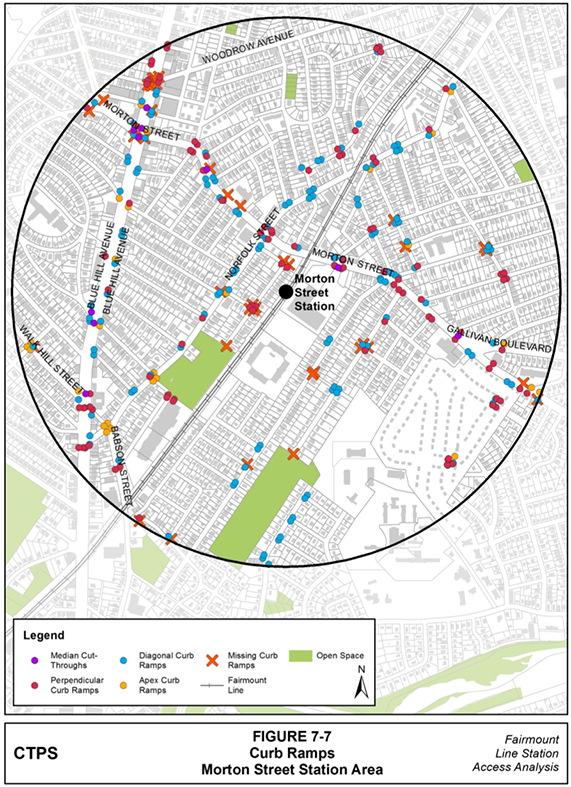
FIGURE 7-8
Detectable Warnings—Morton Street Station Area
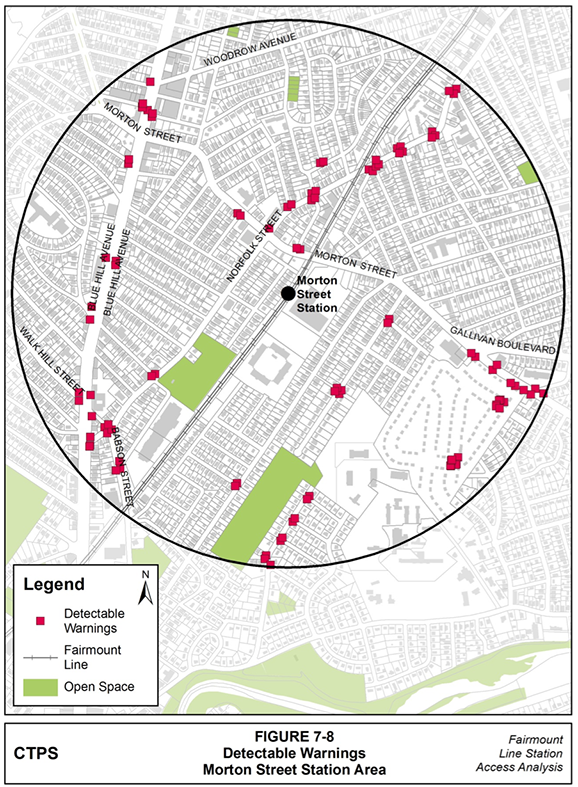
FIGURE 7-9
Curb Ramps—Blue Hill Avenue Station Area

FIGURE 7-10
Detectable Warnings—Blue Hill Avenue Station Area
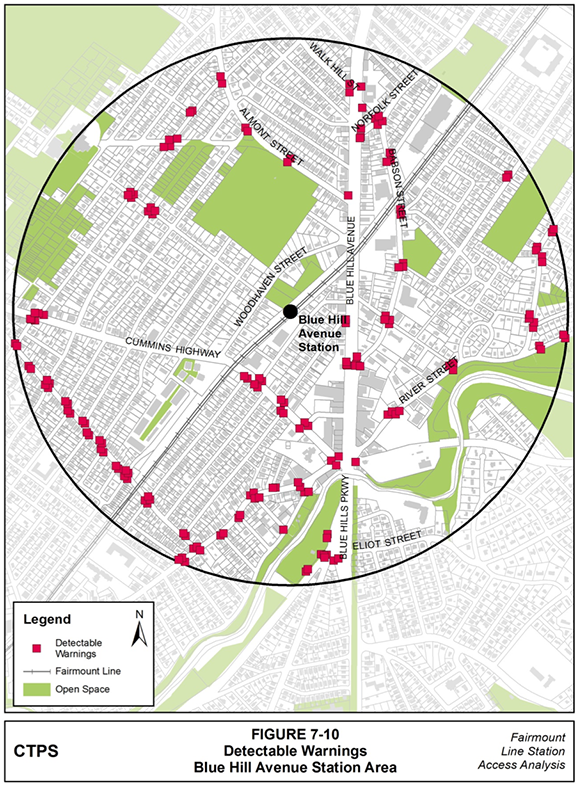
As illustrated in Figure 8-1, MPO staff observed 99 crosswalks in the Newmarket Station area, 19 of which contained faded crosswalk markings. Figure 8-1 shows three pavement markings in the form of bicycle boxes in the Newmarket Station area—the only pavement markings of this type in all five Fairmount Line station areas.
MPO staff observed 127 crosswalks in the station area (see Figure 8-2). Staff found 17 faded crosswalk segments, whose locations are documented in the figure.
MPO staff observed 125 crosswalks in the Talbot Avenue station area, eight of which were faded. The locations of the faded crosswalks are documented in Figure 8-3.
MPO staff observed 116 crosswalks in the station area. Along the crosswalks, MPO staff found 14 faded segments. The locations of all crosswalks (including the faded instances) are displayed in Figure 8-4.
MPO staff documented 100 crosswalks in the station area (illustrated in Figure 8-5), nine of which had faded crosswalk segments.
FIGURE 8-1
Faded Crosswalk Locations—Newmarket Station Area
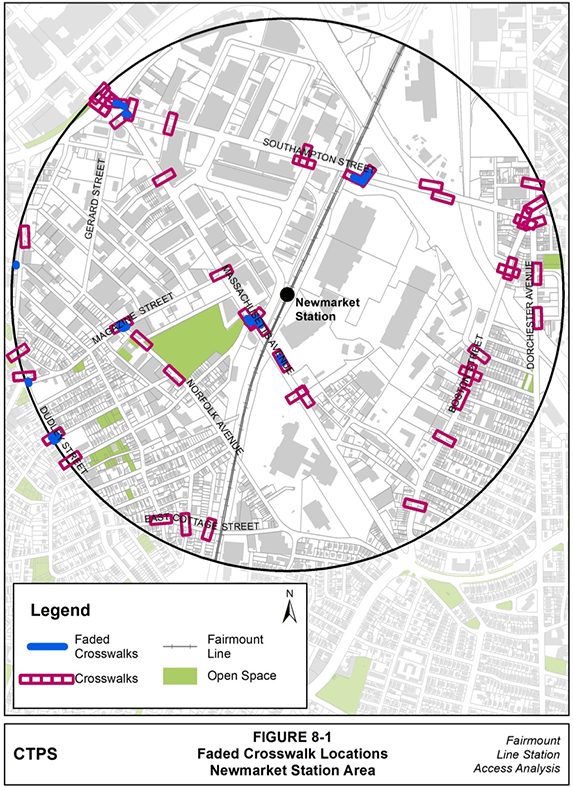
FIGURE 8-2
Bike Boxes—Newmarket Station Area
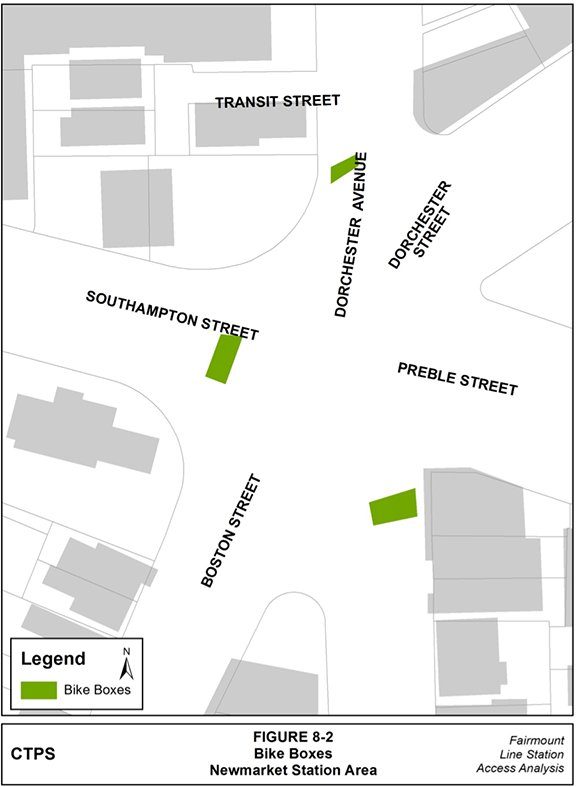
FIGURE 8-3
Faded Crosswalk Locations—Four Corners/Geneva Avenue Station Area
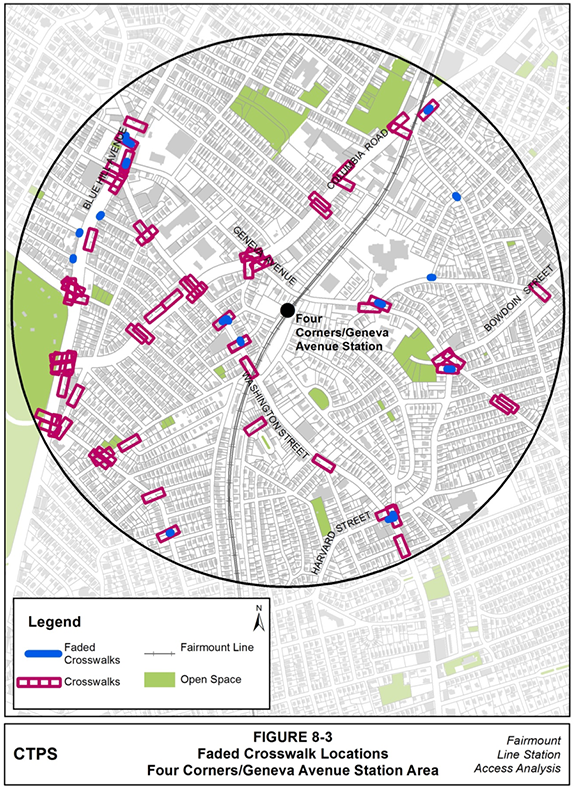
FIGURE 8-4
Faded Crosswalk Locations—Talbot Avenue Station Area
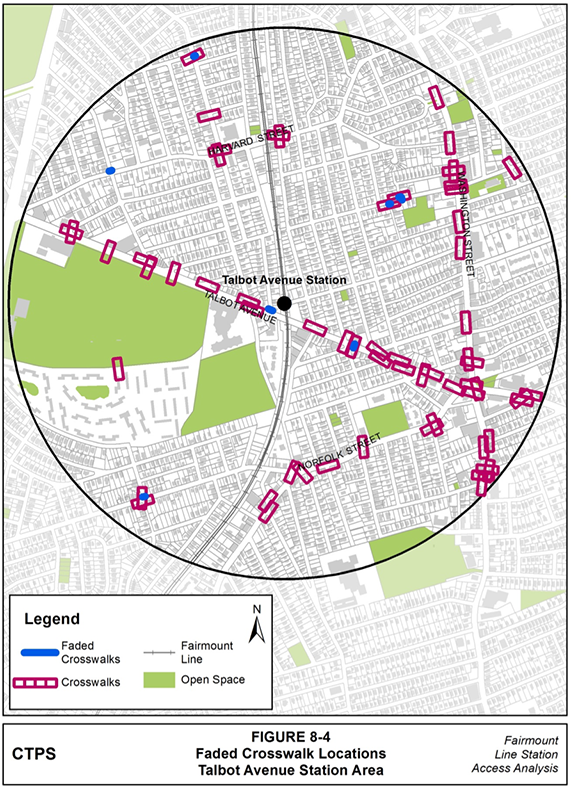
FIGURE 8-5
Faded Crosswalk Locations—Morton Street Station Area
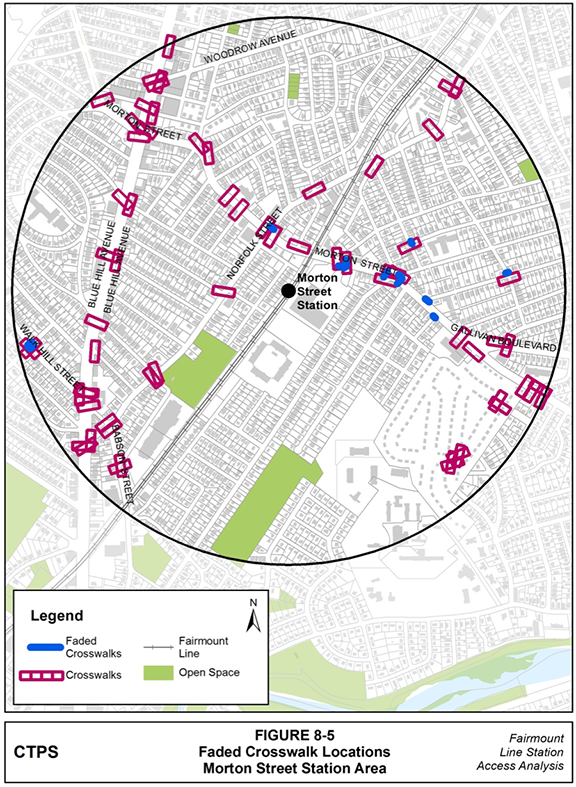
FIGURE 8-6
Faded Crosswalk Locations—Blue Hill Avenue Station Area
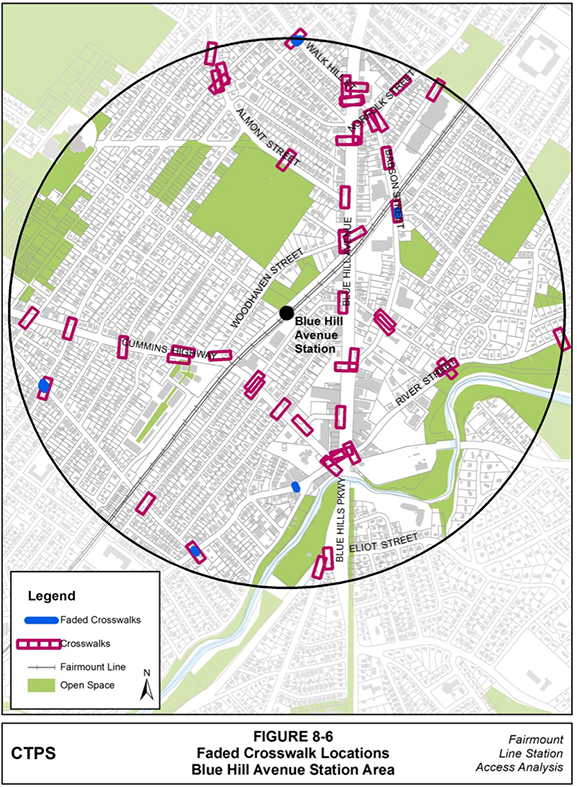
Bicycle facilities such as bike lanes and shared-use paths already exist in all five of the assessed Fairmount Line station areas, and more facilities—such as buffered bike lanes and cycle tracks—are recommended for future installation in the Boston Bike Network plan. In order to make bicycle travel safer and more comfortable, bicycle facilities should be included at every available opportunity and markings for existing facilities should be repainted when they begin to fade. The minimum width for vehicular traffic lanes in the City of Boston is 10 feet, and it is important to consider accommodating busses when allocating roadway width for bicycle travel.102 With these considerations in mind, vehicle lane striping should be narrowed to accommodate bicycle facilities where possible. Bike lanes should be at least five feet wide (or a minimum of eight feet wide for bi-directional travel) and, when possible, separated from motor vehicles with a two- to three-foot wide striped buffer zone adjacent to vehicle travel and parking lanes.103
To separate cyclists from motorists further, bollards should be installed within buffer zones. Bollards are short, vertical posts that often are used to control or direct road traffic (see Appendix B for more information). Shared-use paths should be constructed as an alternative to on-street bicycle accommodations, where road conditions, cyclist demand, and off-road space indicate a shared-use path is needed and feasible. Shared-lane markings should be installed along routes often used by cyclists where conditions do not allow for a bike lane or shared-use path.
Table 9-1 lists cost estimates for the improvements cited above. These improvements would be best incorporated into roadway reconstruction projects to coincide with repaving the surface. Bicycle pavement markings, such as bike lane and shared-lane markings, cost $180 on average.104 The calculations in Table 9-1 assume that 30 bicycle pavement markings are installed per mile. The cost of striping a standard four-to- six-inch wide lane line using paint or thermoplastic striping in Massachusetts averages between $0.50 and $0.60 per linear foot.105 The bike lane, buffered bike lane, and vehicular lane calculations represented in Table 9-1 all assume striping costs of $0.60 per linear foot. Bike lanes are one linear foot of striping for each linear foot of facility, while buffered bike lanes are 2.2 feet of linear striping for each linear foot of facility. This is because MPO staff assumed that buffered bike lanes would include two linear feet of striping connected by one four-foot long diagonal stripe every 20 feet. Vehicular striping for one lane going in one direction is one linear foot of yellow striping, while two lanes going in one direction is one linear foot of yellow striping, with an additional one-half linear foot of striping for the white dashed center line. The FHWA states that bollards typically are spaced between 10 and 40 feet apart, so the calculations in Table 9-1 assume that bollards, which cost an average of $730 each,106 are installed once every 35 feet.107
TABLE 9-1
Bicycle Facility Cost Estimates
| Bicycle Facility |
Estimated |
Estimated Cost for Two Directions |
Estimated |
Estimated Cost for Two Directions |
|---|---|---|---|---|
Bike Lane /Shared-Lane Markings |
$1.00 |
$2.00 |
$5,400 |
$10,800 |
Bike Lane |
$0.60 |
$1.20 |
$3,168 |
$6,336 |
Bike Lane and Markings |
$1.60 |
$3.20 |
$8,568 |
$17,136 |
Buffered Bike Lane |
$1.30 |
$2.60 |
$6,970 |
$13,939 |
Buffered Bike Lane, Markings |
$2.30 |
$4.70 |
$12,370 |
$24,739 |
Bollards |
$20.90 |
$41.70 |
$110,126 |
$220,251 |
Buffered Bike Lane and Bollards |
$22.20 |
$44.40 |
$117,095 |
$234,191 |
Buffered Bike Lane, Markings, Bollards |
$23.20 |
$46.40 |
$122,495 |
$244,991 |
Re-striping One Vehicular Lane |
$0.60 |
$1.20 |
$3,168 |
$6,336 |
Re-striping Two Vehicular Lanes |
$0.90 |
$1.80 |
$4,752 |
$9,504 |
Paved Shared-Use Path |
$91.10 |
-- |
$481,140 |
-- |
MPO staff recommend that the City of Boston replace all bike racks not supported by the APBP and install acceptable bike rack styles instead. One inverted U bike rack, which can serve two bicycles at one time, costs approximately $245.108 The costs of such improvements are summarized in Table 9-2. The City of Boston has installed Ring and Post bike racks throughout the five Fairmount Line station areas, as documented in Figure 9-1. APBP deems the Ring and Post bike rack style acceptable. Table 9-2 does not include cost calculations for the Morton Street and Blue Hill Avenue station areas because MPO staff did not find bike racks at either location.
Bike parking serves an important role in supporting bicycle transportation: the absence of bike racks reduces the convenience and practicality of bicycle travel. To encourage bicycling as a mode of transportation, MPO staff recommend that, in addition to replacing the unacceptable bike racks, more APBP acceptable bike racks also be installed throughout each of the five Fairmount Line station areas. New bike rack installations should follow APBP’s placement guidelines, as illustrated in Figure 9-2. The spacing requirements that APBP provides apply to Inverted-U and Post and Ring bike racks, both of which allow one bicycle to be roughly centered on each side of the rack.109 The average bicycle footprint is six feet by two feet, although bikes with trailers or cargo bikes can extend ten feet or longer.110 These are important measurements that should be factored into bike rack installations.
TABLE 9-2
Bicycle Rack Replacement Costs for the Five Fairmount Line Station Areas
| Station Area |
Total Bike Racks |
Total Bike Parking Spaces |
Unacceptable Bike Racks |
Unacceptable Bike Parking Spaces |
Acceptable Bike Racks Needed |
Estimated Cost |
|---|---|---|---|---|---|---|
Newmarket |
21 |
56 |
1 |
16 |
8 |
$1,960 |
Four Corners/Geneva Avenue |
28 |
71 |
3 |
21 |
11 |
$2,695 |
Talbot Avenue |
28 |
63 |
1 |
9 |
5 |
$1,225 |
Morton Street |
13 |
26 |
-- |
-- |
-- |
-- |
Blue Hill Avenue |
10 |
20 |
-- |
-- |
-- |
-- |
FIGURE 9-1
Bike Racks—Fairmount Line Station Areas
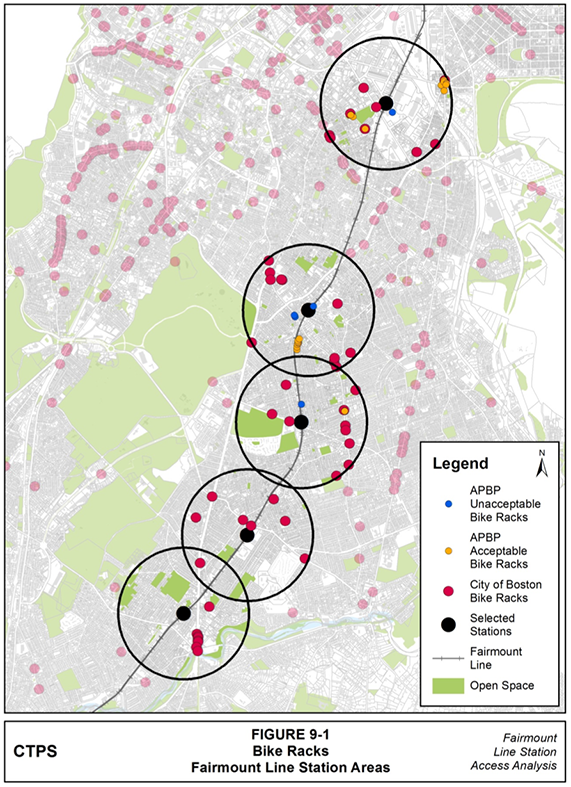
FIGURE 9-2
APBP Bike Rack Placement Recommendations
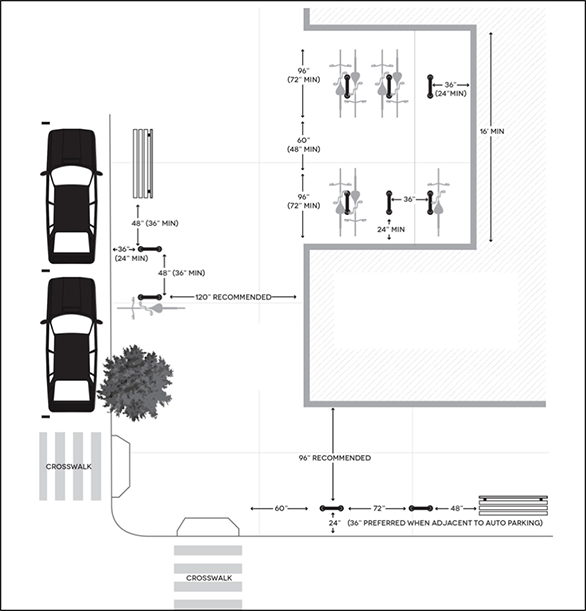
Essentials of Bike Parking: Selecting and Installing Bicycle Parking That Works; Association of Pedestrian and Bicycle Professionals (APBP); September 2015; page 10.
MUTCD standards require all pedestrian signals with a pedestrian change interval lasting longer than seven seconds to include a countdown display.111 Table 9-3 lists the number of pedestrian signals without countdown displays in each station area and indicates how many of those signals have pedestrian change intervals that last longer than seven seconds. This provides the information necessary to calculate the number of countdown displays that should be added to each station area. Pedestrian signal countdown timer modules cost $740 on average.112 New pedestrian signal heads, which cost $550 each on average,113 are not factored into the cost estimates listed in Table 9-3 because the need for their installation will vary on a case-by-case basis.
TABLE 9-3
Pedestrian Signals in Need of Countdown Displays
| Station Area |
|
Non-Countdown Signals with Pedestrian Change Intervals More than 7 Seconds |
Estimated Cost of Countdown Displays |
|---|---|---|---|
Newmarket |
12 |
8 |
$5,920 |
Four Corners/Geneva Avenue |
14 |
14 |
$10,360 |
Talbot Avenue |
9 |
9 |
$6,660 |
Morton Street |
44 |
44 |
$32,560 |
Blue Hill Avenue |
4 |
2 |
$1,480 |
Total |
83 |
77 |
$56,980 |
Table 9-4 documents the number of crossings in the five station areas that do not provide sufficient time for pedestrians to cross at a speed of 3.5 feet per second or slower.
TABLE 9-4
Crossings Too Long for Provided Crossing Time
Station Area |
Crossings with Travel Speeds Faster than 3.5 Feet per Second |
Newmarket |
16 |
Four Corners/Geneva Avenue |
18 |
Talbot Avenue |
5 |
Morton Street |
12 |
Blue Hill Avenue |
15 |
Total |
66 |
The least expensive solution for amending the inadequate time of the combined pedestrian change and red clearance intervals at crossings throughout the Fairmount Line station areas would be to increase the length of the pedestrian change and red clearance intervals. Table 9-5 lists the total combined duration of the two intervals that would be necessary to meet the MUTCD standard of 3.5 feet per second. Table 9-5 also lists the total combined duration of the two intervals that would be necessary to meet the even-more accessible speed of 2.8 feet per second, which is used by the City of San Francisco to better serve elderly and mobility-impaired populations.114
An alternative to adjusting the pedestrian signals at each crossing listed in the table below is to shorten the distance that pedestrians must cross during the pedestrian change and red clearance intervals. This can be done by creating accessible median islands or extending sidewalks into the roadway where lane widths allow. The minimum width for vehicular traffic lanes in the City of Boston is 10 feet.115 Median islands and curb extensions can be created with low-cost, interim materials such as planters, pavement markings, temporary curbs, and bollards.116 When funding becomes available, permanent median islands and curb extensions—which cost $13,520 and $13,000 on average, respectively—should be constructed.117
TABLE 9-5
New Crossing Durations for Acceptable Speeds at Problematic Crossings
| Intersection/ Crossing |
Current Expected Crossing Speed (feet/ sec) |
Current Crossing Duration (seconds) |
Crossing Length (feet) |
Crossing Duration (3.5 feet/ second) |
Crossing Duration (2.8 feet/ second) |
|---|---|---|---|---|---|
Newmarket Station Area: |
|
|
|
|
|
112 Southampton Street |
4.88 |
10 |
49 |
14 |
18 |
Allstate Road and Massachusetts Avenue |
5.81 |
17 |
99 |
29 |
36 |
Boston Street and Harvest Street |
4.97 |
8 |
40 |
12 |
15 |
Boston Street, Washburn Street, and Frontage Rd |
3.53 |
11 |
39 |
12 |
14 |
Dorchester Ave, Father Songin Way, O'Connor Way |
3.68 |
14 |
52 |
15 |
19 |
Dudley Street, Dunmore Street, and Hampden Street |
4.18 |
17 |
71 |
21 |
26 |
Hampden Street, Keegan Street, and Norfolk Avenue |
3.73 |
9 |
34 |
10 |
12 |
Magazine Street and Massachusetts Avenue |
3.53 |
14 |
49 |
15 |
18 |
Magazine Street and Norfolk Avenue |
3.62 |
12 |
43 |
13 |
16 |
Magazine Street and Norfolk Avenue |
4.45 |
10 |
45 |
13 |
16 |
Massachusetts Avenue and Chesterton Street |
5.36 |
9 |
48 |
14 |
18 |
Mass Ave, Melnea Cass Blvd, JFK Ramp, Southampton St |
3.87 |
22 |
85 |
25 |
31 |
Mass Ave, Melnea Cass Blvd, JFK Ramp, Southampton St |
4.12 |
22 |
91 |
26 |
33 |
Massachusetts Ave, Newmarket Square, Shirley St |
5.78 |
11 |
64 |
19 |
23 |
Massachusetts Ave, Newmarket Square, Shirley St |
5.07 |
17 |
86 |
25 |
31 |
Southampton Street and South Bay Drive |
3.94 |
15 |
59 |
17 |
22 |
Four Corners/ Geneva Avenue Station Area: |
|
|
|
|
|
Blue Hill Avenue and Seaver Street |
3.82 |
22 |
84 |
25 |
31 |
Blue Hill Avenue, Warren Street, and Georgia Street |
4.17 |
16 |
67 |
20 |
24 |
Blue Hill Avenue, Warren Street, and Georgia Street |
3.93 |
18 |
71 |
21 |
26 |
Blue Hill Avenue, Warren Street, and Georgia Street |
4.30 |
12 |
52 |
15 |
19 |
Columbia Road and Devon Street |
3.59 |
26 |
93 |
27 |
34 |
Columbia Road and Geneva Avenue |
3.94 |
16 |
63 |
18 |
23 |
Columbia Road and Geneva Avenue |
4.22 |
28 |
118 |
34 |
43 |
Columbia Road and Geneva Avenue |
4.47 |
15 |
67 |
20 |
24 |
Columbia Road and Seaver Street |
4.11 |
23 |
95 |
28 |
34 |
Columbia Road and Washington Street |
4.52 |
10 |
45 |
13 |
17 |
Columbia Road and Washington Street |
3.91 |
24 |
94 |
27 |
34 |
Columbia Road and Washington Street |
4.56 |
10 |
46 |
14 |
17 |
Columbia Road, Ceylon Street, and Richfield Street |
3.54 |
29 |
103 |
30 |
37 |
Geneva Avenue and Bowdoin Street |
4.75 |
17 |
81 |
24 |
29 |
Harvard St, Washington St, Bowdoin St, Bowdoin Ave |
6.38 |
11 |
70 |
21 |
26 |
Harvard St, Washington St, Bowdoin St, Bowdoin Ave |
5.24 |
11 |
58 |
17 |
21 |
Washington Street and Erie Street |
4.21 |
9 |
38 |
11 |
14 |
Washington Street and Erie Street |
5.39 |
9 |
48 |
14 |
18 |
Talbot Avenue Station Area: |
|
|
|
|
|
Norfolk Street and Stanton Street |
4.75 |
11 |
52 |
15 |
19 |
Norfolk Street, New England Avenue, Woodrow Ave |
3.89 |
15 |
58 |
17 |
21 |
Talbot Avenue and Bernard Street |
4.63 |
16 |
74 |
22 |
27 |
Talbot Ave, Colonial Ave, Aspinwall Road, Spencer St |
5.79 |
11 |
64 |
19 |
23 |
Talbot Avenue, Norwell Street, New England Avenue |
4.43 |
11 |
49 |
14 |
18 |
Morton Street Station Area: |
|
|
|
|
|
Blue Hill Avenue and Clarkwood Street |
3.55 |
26 |
92 |
27 |
33 |
Blue Hill Avenue and Morton Street |
4.28 |
25 |
107 |
31 |
39 |
Blue Hill Avenue, Baird Street, and Woodrow Avenue |
5.38 |
17 |
91 |
27 |
33 |
Blue Hill Avenue, Walk Hill Street, and Babson Street |
3.58 |
20 |
72 |
21 |
26 |
Blue Hill Avenue, Wellington Hill St, Fessenden Street |
4.70 |
28 |
131 |
38 |
47 |
Morton Street (between Theodore/ Wildwood Sts) |
4.87 |
13 |
63 |
19 |
23 |
Morton Street (east of Gallivan Boulevard split) |
3.97 |
15 |
60 |
18 |
22 |
Morton Street, Selden St, West Selden St, Corbet St |
3.64 |
17 |
62 |
18 |
23 |
Norfolk Street and Babson Street |
3.90 |
10 |
39 |
12 |
14 |
Norfolk Street and Babson Street |
4.14 |
15 |
62 |
18 |
23 |
Norfolk Street and Stanton Street |
4.75 |
11 |
52 |
15 |
19 |
Norfolk Street, Fessenden Street, Mildred Avenue |
4.33 |
14 |
61 |
18 |
22 |
Blue Hill Avenue Station Area: |
|
|
|
|
|
Babson Street and Fremont Street |
4.66 |
12 |
56 |
16 |
20 |
Babson Street and Norfolk Street |
3.86 |
10 |
39 |
12 |
14 |
Babson Street and Norfolk Street |
4.21 |
15 |
63 |
19 |
23 |
Blue Hill Avenue and Babson Street |
3.56 |
20 |
71 |
21 |
26 |
Blue Hill Avenue and Fairway Street |
3.87 |
19 |
73 |
21 |
27 |
Blue Hill Avenue, River Street, and Cummins Highway |
3.61 |
11 |
40 |
12 |
15 |
Blue Hill Avenue, River Street, and Cummins Highway |
6.54 |
14 |
92 |
27 |
33 |
Blue Hill Avenue, River Street, and Cummins Highway |
5.44 |
11 |
60 |
18 |
22 |
Blue Hill Avenue, Walk Hill Street, and Babson Street |
5.75 |
14 |
80 |
23 |
29 |
Cummins Highway and Itasca Street |
5.53 |
8 |
44 |
13 |
16 |
Cummins Highway and Itasca Street |
4.90 |
13 |
64 |
19 |
23 |
Cummins Highway and Woodhaven Street |
4.40 |
14 |
62 |
18 |
22 |
Cummins Highway, Rexford Street, Rockdale Street |
4.76 |
14 |
67 |
20 |
24 |
Norfolk Street, Fessenden Street, Mildred Avenue |
4.39 |
14 |
61 |
18 |
22 |
Rector Road and River Street |
3.82 |
11 |
42 |
12 |
15 |
MPO staff recommend removing debris and overgrown vegetation at locations where such obstructions impede access and ease of travel along the pedestrian zone of a sidewalk. Staff also suggest widening the pedestrian zone to a minimum of five feet in places where poles and trees narrow the sidewalk. FHWA guidance states that obstructions such as poles and trees should be moved outside the pedestrian zone to a furniture zone, which is at least two feet wide, or a planter zone, which is at least four feet wide. Please refer to Appendix B for more information.
The average cost of a concrete sidewalk is $32 per linear foot. 118 A concrete sidewalk accompanied by a curb costs an average of $150 per linear foot.119 It is only possible to widen the sidewalk corridor where there is sufficient right of way. By narrowing traffic lanes to the City of Boston’s minimum 10-foot width, additional space may be carved from the public right-of-way for the sidewalk corridor. 120
At locations where such reallocation is not possible, especially in areas where the pedestrian zone is less than three feet wide, protruding objects and permanent obstacles should be removed from the pedestrian zone.121
Throughout the Fairmount Line station areas, MPO staff noted locations where curb ramps were needed but not present. Typically, this occurred where a crosswalk led to a curb instead of a curb ramp. Curb ramps cost an average of $810 each.122 Table 7-6 lists the number of missing curb ramps that staff found in each station area, and the estimated cost of constructing them. MPO staff recommend installing curb ramps at every location where a crosswalk meets a curb and where a pedestrian corridor intersects a roadway.
TABLE 9-6
Missing Curb Ramps in Fairmount Line Station Areas
| Station Area |
Missing Curb Ramps |
Estimated Cost |
|---|---|---|
| Newmarket |
43 |
$34,830 |
| Four Corners/ Geneva Ave |
8 |
$6,480 |
| Talbot Avenue |
39 |
$31,590 |
| Morton Street |
39 |
$31,590 |
| Blue Hill Avenue |
25 |
$20,250 |
| Total |
154 |
$124,740 |
Table 9-7 shows the number of locations in each station area where detectable warnings have not been installed to inform pedestrians of the transition from pedestrian zone to vehicle travel lane. The table also presents cost estimates for adding a six-square-foot detectable warning at each location. The average cost of a detectable warning is $42 per square foot. 123 Table 9-8 shows cost estimates for adding six-square-foot detectable warnings to each curb ramp installation that MPO staff recommend.
TABLE 9-7
Missing Detectable Warnings and Estimated Costs
| Station Area |
Existing Curb Ramps |
Median Cut-Through Entrances |
Existing Detectable Warnings |
Missing Detectable Warnings |
Estimated Cost |
|---|---|---|---|---|---|
Newmarket |
257 |
14 |
140 |
131 |
$33,012 |
Four Corners/ Geneva Ave |
294 |
21 |
184 |
131 |
$33,012 |
Talbot Avenue |
300 |
0 |
145 |
155 |
$39,060 |
Morton Street |
264 |
20 |
98 |
186 |
$46,872 |
Blue Hill Avenue |
261 |
10 |
163 |
108 |
$27,216 |
Total |
1,376 |
65 |
730 |
711 |
$179,172 |
TABLE 9-8
Cost of Detectable Warnings at Missing Curb Ramp Locations
| Station Area |
Missing Curb Ramps |
Estimated Cost |
|---|---|---|
Newmarket |
43 |
$10,836 |
Four Corners/ Geneva Avenue |
8 |
$2,016 |
Talbot Avenue |
39 |
$9,828 |
Morton Street |
39 |
$9,828 |
Blue Hill Avenue |
25 |
$6,300 |
Total |
154 |
$38,808 |
MPO staff observed faded crosswalk striping at locations throughout the five Fairmount Line station areas. To ensure the visibility of crosswalks to all roadway users, it is important to maintain solid crosswalk striping. A striped crosswalk costs an average of $8.51 per linear foot.124 Table 9-9 cites the estimated cost of restriping existing faded crosswalk segments.
TABLE 9-9
Estimated Cost of Restriping Faded Crosswalks
Station Area |
Linear Feet of Faded Crosswalk |
Cost to Restripe Faded Crosswalk |
Newmarket |
805 |
$6,847 |
Four Corners/ Geneva Avenue |
603 |
$5,127 |
Talbot Avenue |
223 |
$1,898 |
Morton Street |
604 |
$5,140 |
Blue Hill Avenue |
306 |
$2,600 |
Total |
2,540 |
$21,612 |
102 Boston Complete Streets Guidelines, Minimum Widths for Roadway Lanes; City of Boston; 2013; page 103.
103 Separated Bike Lane Planning and Design Guide; Massachusetts Department of Transportation; November 2015; page 34.
104 Costs for Pedestrian and Bicyclist Infrastructure Improvements: A Resource for Researchers, Engineers, Planners, and the General Public; Max A. Bushell, Bryan W. Poole, Charles V. Zegeer, and Daniel A. Rodriguez; UNC Highway Safety Research Center; October 2013; page 30.
105 Pedestrian Infrastructure: Strategies for Improving Pedestrian Safety through Low-Cost Traffic Calming; WalkBoston; August 2015; page 23.
106 Costs for Pedestrian and Bicyclist Infrastructure Improvements: A Resource for Researchers, Engineers, Planners, and the General Public; Max A. Bushell, Bryan W. Poole, Charles V. Zegeer, and Daniel A. Rodriguez; UNC Highway Safety Research Center; October 2013; page 18.
107 Separated Bike Lane Planning and Design Guide – Step 2: Forms of Separation; Federal Highway Administration (FHWA); May 2015; page 84.
108 Costs for Pedestrian and Bicyclist Infrastructure Improvements: A Resource for Researchers, Engineers, Planners, and the General Public; Max A. Bushell, Bryan W. Poole, Charles V. Zegeer, and Daniel A. Rodriguez; UNC Highway Safety Research Center; October 2013; Database of Costs (Excel spreadsheet).
109 Essentials of Bike Parking: Selecting and Installing Bicycle Parking That Works; Association of Pedestrian and Bicycle Professionals (APBP); September 2015; page 10.
110 Essentials of Bike Parking: Selecting and Installing Bicycle Parking That Works; Association of Pedestrian and Bicycle Professionals (APBP); September 2015; page 10.
111 Manual on Uniform Traffic Control Devices, Part 4: Highway Traffic Signals, Chapter 4E: Pedestrian Control Features, Section 4E.07: Countdown Pedestrian Signals; Federal Highway Administration; December 2009; page 499.
112 Costs for Pedestrian and Bicyclist Infrastructure Improvements: A Resource for Researchers, Engineers, Planners, and the General Public; Max A. Bushell, Bryan W. Poole, Charles V. Zegeer, and Daniel A. Rodriguez; UNC Highway Safety Research Center; October 2013; page 27.
113 Costs for Pedestrian and Bicyclist Infrastructure Improvements: A Resource for Researchers, Engineers, Planners, and the General Public; Max A. Bushell, Bryan W. Poole, Charles V. Zegeer, and Daniel A. Rodriguez; UNC Highway Safety Research Center; October 2013; page 28.
114 Designing Sidewalks and Trails for Access, Part II of II: Best Practices Design Guide, Chapter 8: Pedestrian Crossings, Section 8.6: Crossing Times; Federal Highway Administration (FHWA); September 2001; page 8-17.
115 Boston Complete Streets Guidelines, Minimum Widths for Roadway Lanes; City of Boston; 2013; page 103.
116 Urban Street Design Guide, Street Design Elements, Lane Widths; National Association of City Transportation Officials; Island Press; October 2012; http://nacto.org/publication/urban-street-design-guide/street-design-elements/lane-width/.
117 Costs for Pedestrian and Bicyclist Infrastructure Improvements: A Resource for Researchers, Engineers, Planners, and the General Public; Max A. Bushell, Bryan W. Poole, Charles V. Zegeer, and Daniel A. Rodriguez; UNC Highway Safety Research Center; October 2013; pages 14-15.
118 Costs for Pedestrian and Bicyclist Infrastructure Improvements: A Resource for Researchers, Engineers, Planners, and the General Public; Max A. Bushell, Bryan W. Poole, Charles V. Zegeer, and Daniel A. Rodriguez; UNC Highway Safety Research Center; October 2013; page 25.
119 Costs for Pedestrian and Bicyclist Infrastructure Improvements: A Resource for Researchers, Engineers, Planners, and the General Public; Max A. Bushell, Bryan W. Poole, Charles V. Zegeer, and Daniel A. Rodriguez; UNC Highway Safety Research Center; October 2013; page 25.
120 Boston Complete Streets Guidelines, Minimum Widths for Roadway Lanes; City of Boston; 2013; page 103.
121 Designing Sidewalks and Trails for Access, Part II of II: Best Practices Design Guide, Chapter 4: Sidewalk Corridors, Section 4.1: Sidewalk Corridor Width, Section 4.1.4: Improving Access on Narrow Sidewalks; Federal Highway Administration (FHWA); September 2001; page 4-12.
122 Costs for Pedestrian and Bicyclist Infrastructure Improvements: A Resource for Researchers, Engineers, Planners, and the General Public; Max A. Bushell, Bryan W. Poole, Charles V. Zegeer, and Daniel A. Rodriguez; UNC Highway Safety Research Center; October 2013; page 19.
123 Costs for Pedestrian and Bicyclist Infrastructure Improvements: A Resource for Researchers, Engineers, Planners, and the General Public; Max A. Bushell, Bryan W. Poole, Charles V. Zegeer, and Daniel A. Rodriguez; UNC Highway Safety Research Center; October 2013; page 19.
124 Costs for Pedestrian and Bicyclist Infrastructure Improvements: A Resource for Researchers, Engineers, Planners, and the General Public; Max A. Bushell, Bryan W. Poole, Charles V. Zegeer, and Daniel A. Rodriguez; UNC Highway Safety Research Center; October 2013; page 24.
MPO staff identified five station areas along the MBTA’s Fairmount Line—Newmarket, Four Corners/Geneva Avenue, Talbot Avenue, Morton Street, and Blue Hill Avenue—that need improvements to make bicycle and pedestrian travel safer and more comfortable. After selecting the station areas, MPO staff assessed each location for impediments to bicycle and pedestrian travel and noted changes that could increase the appeal of walking and bicycling in each area. MPO staff paid particular attention to:
MPO staff documented the presence of each type of infrastructure observed in the station areas and considered their suitability for bicyclists’ and pedestrians’ needs. For example, staff identified fading crosswalks and bike racks in shapes that do not allow for proper bicycle locking because of old, broken, or outdated parts. MPO staff mapped the locations of each amenity, indicating characteristics of important features, such as the type of bicycle facility or the orientation of curb ramps. By mapping locations of the existing facilities surrounding the five stations, MPO staff then could offer insight into the types of changes to the physical environment that would benefit bicyclists and pedestrians in each station area. The City of Boston can use this information to guide its efforts to improve bicycle and pedestrian access to the Fairmount Line.
While gathering data for the maps, a high priority for staff was to identify areas where improvements to the physical environment would help bicyclists and pedestrians feel safer and more comfortable. By improving infrastructure for people walking and bicycling in the five Fairmount Line station areas, traveling on foot and by bicycle could become an increasingly appealing mode of travel and might encourage more people to access the Fairmount Line by such means. This would allow residents who live near Fairmount Line stations to become less dependent on motor vehicles and would provide them with direct access to the MBTA’s light rail rapid transit through South Station.
Among staff’s suggestions is to add buffered or separated bicycle facilities to roadways in Fairmount Line station areas wherever feasible, which would encourage potential bicyclists of all levels to choose to travel by bicycle. In addition, staff suggest that more inverted U and post and ring bike racks be installed to improve the practicality of bicycling as a transportation mode. Aside from locations where high-density racks or long-term bicycle parking are installed, staff recommend that inverted U and post and ring racks replace all existing bicycle parking. While wheelwell-secure bike racks are acceptable by APBP standards, this style is not common; to avoid user confusion, MPO staff do not recommend installing them.
To improve the pedestrian experience around Fairmount Line stations, MPO staff suggest giving pedestrians wider walkways wherever possible. Wider sidewalks and paved routes with separate zones that house poles and other utilities outside the path of pedestrians are improvements that make walking safer and more comfortable. Incorporating green space, especially as a buffer between pedestrians and vehicle traffic, provides more protection and creates a pleasing atmosphere that encourages travel along the corridor. While these improvements would have a significant impact on the pedestrian experience, the importance of ADA accessibility for pedestrian safety and comfort cannot be overstated. The width of sidewalks and paths should be able to accommodate two wheelchairs passing or riding side-by-side; curb ramps with detectable warnings should provide smooth transitions to and from pedestrian zones; and sidewalks should be in good physical condition to accommodate wheelchairs. Adequate lighting, visible crosswalk markings, and pedestrian signals with countdown displays that provide sufficient time for pedestrians to cross all are improvements that staff recommend incorporating into Fairmount Line station areas to enhance pedestrians’ experience, and encourage current and potential Fairmount Line riders to walk to their nearest station.
By suggesting improvements to bicycle and pedestrian facilities, this study seeks to increase the transportation options available to those who live within walking and bicycling distance of Fairmount Line stations. In turn, this may lead to greater employment opportunities and better access to amenities for people within the vicinity of the five Fairmount Line stations assessed in this study.
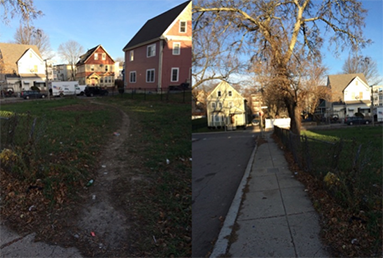
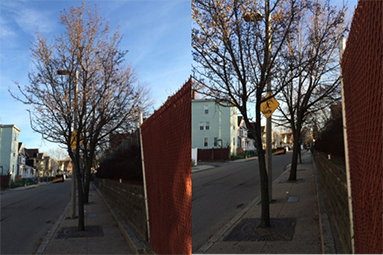
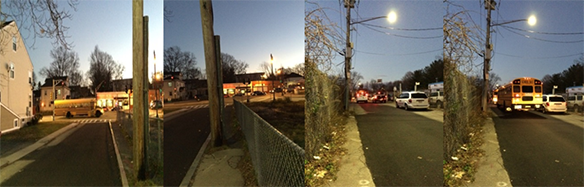 Source: Central Transportation Planning Staff.