Memorandum
DATE: June 5, 2014
TO: Boston Region Metropolitan Planning Organization (MPO)
FROM: Chen-Yuan Wang, MPO Staff
RE: Safety and Operations Analyses at Selected Boston Region MPO Intersections, FFY 2013: Lexington Street at Beaver Street in Waltham
This memorandum summarizes safety and operations analyses and proposes improvement strategies for the intersection of Lexington Street at Beaver Street in Waltham.
The location was approved for study by the Boston Region MPO following a selection process1 for four locations from a short list of 21 intersections based on a series of criteria including 1) high equivalent property damage only (EDPO) crash ratings, 2) the number of pedestrian and bicycle crashes, 3) transit significance, 4) regional significance, and 5) implementation potential.
The four locations approved for study are:
The Waltham intersection is ranked 107 in MassDOT’s 2008–10 statewide top-200 intersection crash list. The city of Waltham expressed a strong interest in studying the location for safety and operational improvements.
This memorandum contains the following sections:
This memorandum also includes technical appendices that contain methods and data applied in the study and detailed reports of the intersection capacity analyses.
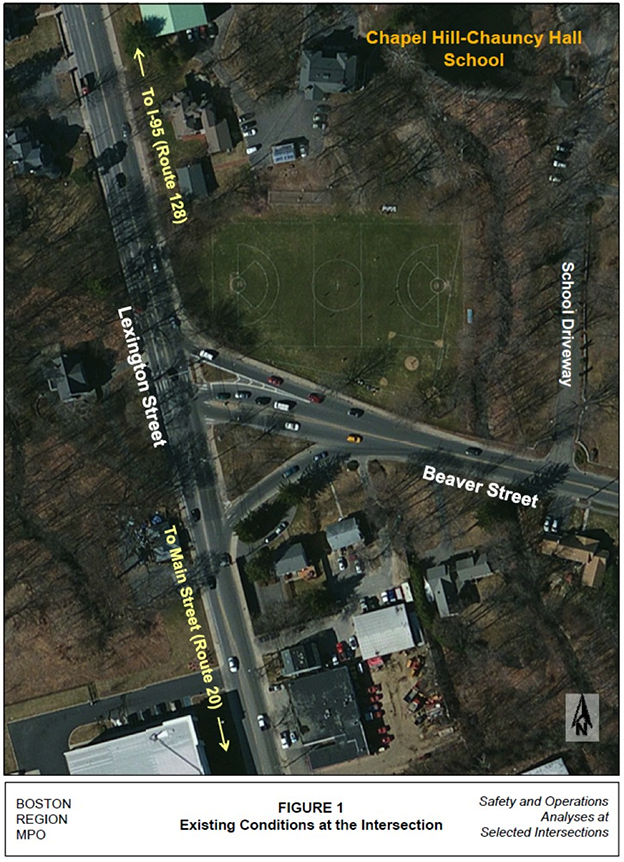
This “T” intersection is at the geographic center of the city of Waltham, about one-half mile north of the city hall and Main Street (Route 20) and about one mile west of Interstate 95 (I-95)/Route 128. This location carries a large amount of commuting traffic and is congested in both the AM and PM peak periods, especially in the PM peak period.
Lexington Street, running north-south, is the major street of the intersection. It is a principal arterial that stretches from Main Street north to the City’s border with the Town of Lexington. It then continues as Waltham Street in Lexington, connects Route 2 in both directions, and terminates at Lexington Center. About 1,000 feet north of this intersection, Lexington Street intersects with Totten Pond Road and Bacon Street. Totten Pond Road is a major roadway that connects I-95/Route 128 at Exit 27 and reaches to the office parks and commercial developments in the Route 128 vicinity.
Beaver Street is the minor street of the intersection. It is classified as an urban minor arterial that stretches from this intersection eastward, intersecting Forest Street and Waverley Oak Road (Route 60), to Warren Street near the City’s border with Watertown and Belmont.
Figure 1 shows the existing intersection layout and adjacent developments. The adjacent areas are mainly residential, along with a private school, Chapel Hill-Chauncy Hall School, which occupies the area northeast of the intersection. South of the intersection, commercial developments exist on both sides of Lexington Street. Lexington Street in the study area primarily contains three lanes, with a center lane for two-way left turns to adjacent commercial developments. North of the intersection, Lexington Street widens to four lanes until Totten Pond Road. All of the lanes on Lexington Street appear to be narrow.2 Beaver Street is primarily a two-lane roadway (one lane in each direction) with sufficient width in the intersection vicinity.
Approaching the intersection, Lexington Street northbound runs slightly uphill and has two through lanes with a channelized turnoff to Beaver Street. Lexington Street southbound, slightly downhill, contains one through lane and one left-turn-only lane. Beaver Street widens from one lane to two lanes at the intersection: one for left turns only and one for right turns only. The two lanes are separated by a triangular traffic island.
The intersection is signalized. Its traffic signal operates in three phases: 1) a concurrent phase for Lexington Street, both approaches with left turns permitted, 2) an exclusive phase for the Lexington Street southbound approach, with left turns protected (a lagging left-turn protected phase), and 3) an exclusive phase for the Beaver Street approach.
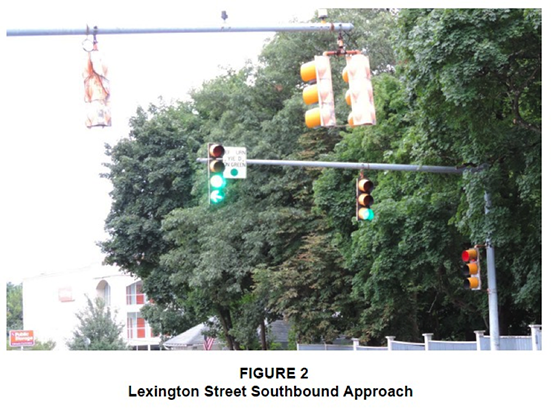
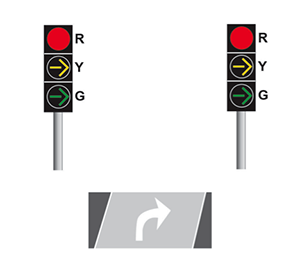
All of the approaches are indicated by three signal faces. All signal faces have the regular three-section red/yellow/green circular indication, except the one above the southbound left-turn lane, which is a four-section signal face with the bottom section indicating a green or yellow arrow. It would indicate a circular green in the concurrent northbound/southbound phase and a circular green and a green arrow simultaneously in the lagging protected left-turn phase. A “left turn yield on circular green” sign is installed next to the four-section signal head on the mast arm (Figure 2).
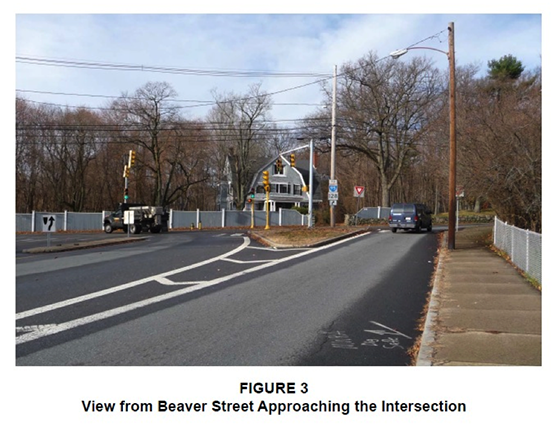
Right turns on red are allowed at the intersection. Right turns on the westbound approach (Beaver Street) are actually controlled by a pair of yield signs, not by the intersection’s traffic signal (Figure 3).
Sidewalks, which are about five feet wide in most sections, exist on both sides of Lexington Street and Beaver Street. Crosswalks are installed across Beaver Street and the southbound approach of Lexington Street. Push buttons and pedestrian signal heads are installed on the posts at the two traffic islands on Beaver Street and on the west side of Lexington Street.
Pedestrian signals operate concurrently with traffic signal phases that have no, or minimal, conflict with the crossings. The crossing of Beaver Street is concurrent with the northbound/southbound traffic signal and the crossing of the Lexington Street southbound approach is concurrent with the Beaver Street traffic signal. The crossing of Lexington Street has no conflicts with prevailing traffic. However, the crossing of Beaver Street conflicts with the left turns from Lexington Street. In order to alert the left-turning drivers to yield to pedestrians, a “yield to pedestrians in crosswalk“ sign is facing Lexington Street southbound at the corner of the traffic island on Beaver Street. Viewed from the southbound stop line, the sign appeared to be small.3
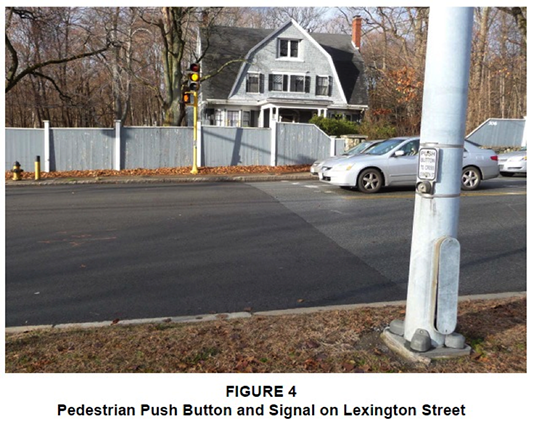
Currently, the pavement markings for the crosswalk across the Lexington Street southbound approach are completely faded (or covered by new pavement). There are no curb cuts at either end of the crosswalk (Figure 4). The pedestrian signals and push buttons for crossing the approach are operational.
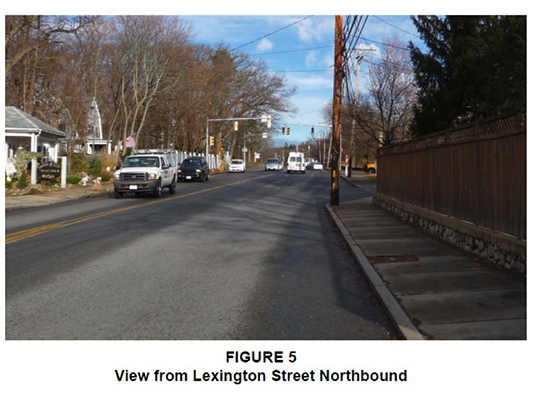
Staff observed that a utility pole is located very close to Lexington Street and could be hazardous to northbound drivers, especially for right-turning vehicles. Also, a fence of the adjacent house extends to the right-turn corner, obstructing drivers’ view of the pedestrian crossings (Figure 5).
A utility pole, located on the traffic island just south of the westbound right-turn lane, also is potentially obstructive. It could hinder drivers’ view of northbound traffic when they are at the yield location.
This intersection carries a number of bicyclists during the day. In the recent traffic count on November 15, 2012, staff observed about ten bicycles in each of the two-hour peak traffic periods; most of them traveling on Lexington Street. Cyclists need to use the traffic lanes, as there are essentially no shoulders on either side of Lexington Street.
Based on the counts, heavy vehicles (trucks and buses) comprised about 3% and 2%, respectively, of the intersection’s total entry traffic in both the AM and PM peak hours, which is considered normal. The movement from Beaver Street to Lexington Street southbound had the highest share—nearly 6% in the AM and 5% in the PM peak hours. The approach lane is relatively wide, and large trucks usually have no problem turning left unless one of the northbound vehicles stops beyond the stop line.
MBTA Massachusetts Bay Transportation Authority (MBTA) Bus Route 554 goes through the intersection about four times during each of the AM and PM peak hours; but there are no bus stops in the immediate vicinity of the intersection.
Staff met with Waltham city engineers on January 16, 2013, to discuss the study area’s issues and concerns. A field reconnaissance to survey the existing facilities and observe the PM peak-period traffic conditions was performed after the meeting.
The primary concern is the high number of crashes, and their severity, at the intersection. This intersection has a higher-than-average crash rate compared with other locations in MassDOT Highway District 4. Crash data analysis identified a high proportion (nearly 30%) of left-turn crashes; and police crash reports indicate that some of these accidents have to do with drivers misinterpreting the signal indication for southbound left turns on Lexington Street.
Currently, the southbound left turns are operated in a permissive/protected mode. It is a lagging left-turn protected mode, but some drivers can mistake it as being protected at the beginning of the circular green indication. It is well known that drivers turning left on a permissive circular green indication may inadvertently mistake that indication as implying the left turn has the right of way over opposing traffic.
Another major concern is the traffic congestion in the evening peak period. During the period, traffic frequently backs up on the southbound and the westbound approaches. Field observations indicate that the southbound queues sometimes extend almost to Totten Pond Road but seldom spill through it.4 The westbound queue is not as extensive but usually extends pass the driveway of Chapel Hill-Chauncy Hall School. The queue is usually caused by the high volume of right turns from Beaver Street under a limited storage length of about 200 feet. The right turns are currently under yield control. Intersection collision analysis (see next section) indicates that some rear-end collisions at the yield location likely are a result of traffic congestion.
Based on discussions with City engineers, staff field observations, and the available crash and traffic data, the issues and concerns for the study intersection can be summarized as:
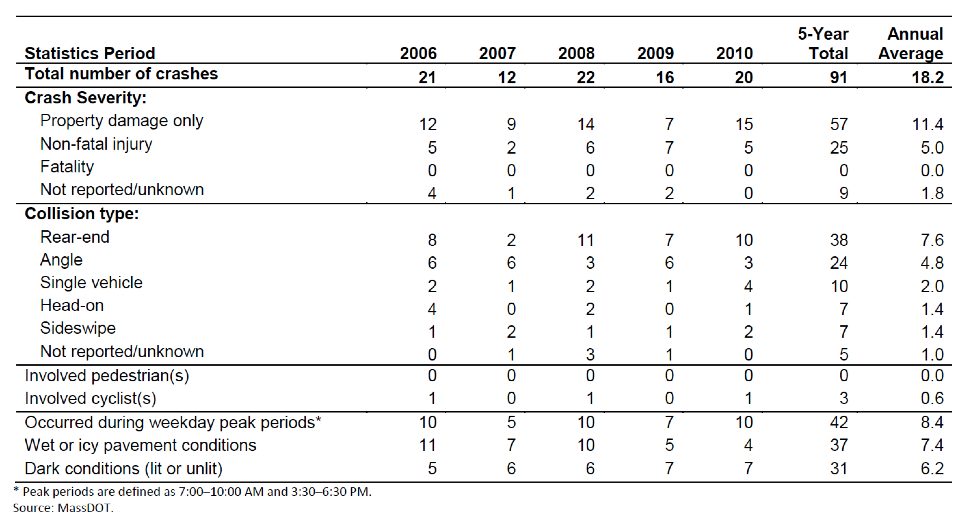
MPO staff collected two sets of the most recent available crash data: 1) MassDOT’s Registry of Motor Vehicles (RMV) 2006–2010 crash data, and 2) crash reports for the latest four years, 2009–2012, provided by the Waltham Police Department. Table 1 summarizes the crash statistics at the intersection based on the MassDOT RMV 2006–2010 crash data. On average, approximately 18 crashes occurred at the intersection each year. About 27% of the total crashes resulted in personal injuries. Crash types consist of 42% rear-end collisions, 26% angle collisions, 11% single-vehicle collisions, 8% head-on collisions, 8% sideswipe collisions, and 5% unknown.
No crashes involved pedestrians. Three crashes involved a bicycle within in the five-year period. About 46% of the total crashes occurred during peak periods, which indicates that many of the crashes are potentially related to stop-and-go traffic conditions at the intersection.
Crash rate5 is effective tool for examining the relative safety of a location. Based on the crash data and the turning movement counts collected recently by staff, the crash rate for this intersection was calculated as 1.34 (see Appendix A). This is much higher than the average crash rate for signalized locations in MassDOT’s Highway Division District 4, which is estimated at 0.77.6
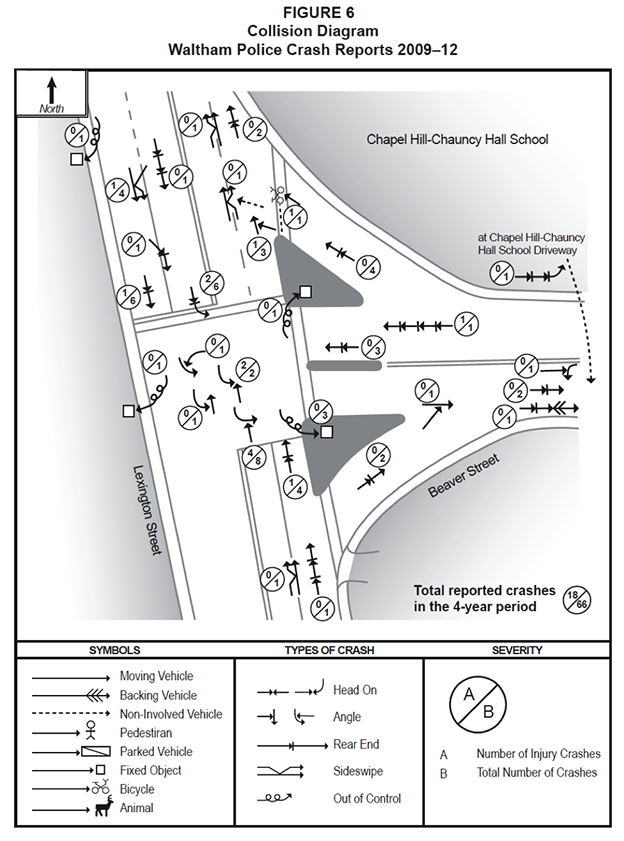
Based on the Waltham Police Department crash reports, MPO staff constructed a collision diagram for the intersection (see Figure 6). The diagram shows that the majority of crashes occurred on Lexington Street, with a noticeably high number of crashes involving a southbound left-turn vehicle and a northbound through vehicle. There were 11 such crashes in the past four years, with six of them causing personal injuries.
TABLE 1
Intersection Crash Statistics
MassDOT Crash Data 2006–10
Currently, the southbound left turns operate in a permissive/protected mode (also referred as a lagging left-turn mode), which is indicated first by a circular green ball followed by a green arrow in addition to the circular green. Drivers may mistake the circular green-only indication as being protected and proceed to enter the intersection. When traffic is congested, drivers also may behave aggressively and proceed to make risky left turns under the permissive mode. These movements could potentially cause conflicts with the northbound through movements that actually have the right-of-way priority. Police reports for crashes involving southbound left-turning vehicles did indicate these two possible causes. In addition, two of the six rear-end crashes in the southbound left-turn lane were also caused by drivers following too closely, thinking that they could proceed under the permissive mode.
The other crashes on Lexington Street are mostly rear-end collisions occurring on the northbound and southbound entry approaches, and mostly during the peak traffic periods under congested conditions. There also were a high number of angle crashes occurring on the northbound departure approach, where it is joined by the right-turn lane from Beaver Street. The right-turn lane is under yield control and carries high traffic volume during peak periods. Most of the angle crashes are caused by right-turn vehicles failing to yield to through vehicles. The congested condition is also indicated by the four rear-end collisions occurring at the yield control.
Another noticeable crash location is where three out-of-control single vehicles collided with the signal post on the south side of Beaver Street. These all occurred under snow or ice weather conditions. However, it appears that the left turn from Lexington Street is somewhat tight and there is space for an adjustment at the corner. The locations and sizes of the traffic island, the signal post, and the existing controller box should be reexamined, if the intersection is to be reconstructed.
Staff collected turning movement counts at the intersection on Thursday, November 15, 2012, when the weather was cloudy and chilly with no rain. The data were recorded in 15-minute intervals during peak traffic periods in the morning, from 7:00 to 9:00 AM, and in the evening, from 4:00 to 6:00 PM.
Peak traffic hours in each of the two periods were then identified and the associated turning movements and pedestrian crossings were used for the intersection’s capacity analysis.
Figure 7 shows the observed vehicular turning movement counts in the AM and PM peak hours. The intersection carried about 2,650 vehicles in the AM peak hour from 7:45 to 8:45, and about 3,350 vehicles in the PM peak hour from 5:00 to 6:00 (see Appendix B for detailed 15-minute breakdowns for passenger vehicles, various heavy vehicles, pedestrians, and bicycles in the peak periods and the peak hours).
There were three and four pedestrians, respectively, crossing the intersection (mostly across Beaver Street) during the two-hour AM and PM peak periods. There were eight and eleven bicyclists, respectively, passing through the intersection (mostly traveling on Lexington Street) during the two-hour AM and PM peak periods.
Heavy vehicles comprised about 3% of the total entry traffic in the AM peak hour and about 2% in the PM peak hour. The movement from Beaver Street to Lexington Street southbound had the highest share of heavy vehicles —nearly 6% in the AM and 5% in the PM peak hour. The percentages at individual approaches were used for the intersection capacity analysis.
Based on the collected data, the intersection was modeled as a fully actuated isolated intersection. Table 2 summarizes analysis results from Synchro7 for existing conditions in the AM and PM peak hours. Analysis indicates that the intersection operates at acceptable level of service (LOS) C in the AM peak hour with an average delay of about 32 seconds per vehicle. In the PM peak hour, the intersection is estimated to operate at LOS E with an average delay of nearly 80 seconds per vehicle. Specifically, the southbound left-turn group is estimated to operate at LOS F with an average extensive delay of nearly two minutes. Both the right- and left-turn lane groups on Beaver Street are evaluated to operate at LOS F with an average delay of more than one minute. Detailed analysis parameters and results for the AM and PM peak hours are included in Appendix C.
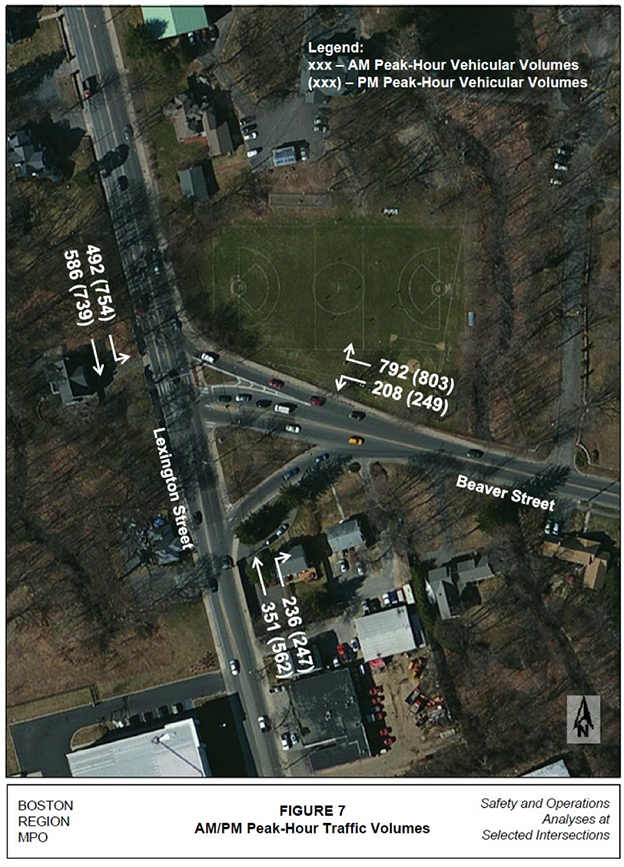
TABLE 2
Intersection Capacity Analysis of Existing Conditions
Street Name |
Approach/Movement |
LOS1 |
Delay per Vehicle |
Lexington Street |
NB – Through/right |
C (D) |
31 (55) |
Lexington Street |
SB – Left |
D (F) |
41 (159) |
Lexington Street |
SB – Through/right |
B (B) |
11 (12) |
Beaver Street |
WB – Left |
D (F) |
42 (96) |
Beaver Street |
WB – Right |
D (F) |
40 (82) |
Overall |
Blank |
C (E) |
32 (77) |
1 LOS = level of service. The LOS for the AM peak hour is the first letter. The LOS for the PM peak hour is in parentheses.
Using Synchro’s signal optimization function, staff tested a number of traffic signal improvement alternatives with no major layout modifications considering the adjacent residential land use and the limited availability of right of way. Among the alternatives examined, three are considered feasible; they are listed below from the least to the most expensive improvement option:
Tables 3 and 4 summarize the capacity analyses for the proposed improvement alternatives in both the AM and PM peak hours. All the alternatives maintain the existing cycle length of 105 seconds and the concurrent pedestrian signal operations.
Alternative 1, changing the southbound left-turn from the lagging to the leading mode, would maintain about the same level of service in the AM and PM peak hours with a slight increase of one to two seconds of average delay. However, the leading left-turn phase potentially could reduce left-turn crashes somewhat.8
Alternative 2, adjusting signal timing with the same sequence as Alternative 1, would maintain the same level of service and average delay as the existing conditions in both peak hours. In addition, it potentially could reduce the southbound left-turn crashes.
Alternative 3, installing signal indication for the westbound right-turn lane group and overlapping its operation with the southbound left-turn protected phase, would further reduce the average delay by five seconds in the AM peak hour and by eight seconds in the PM peak hour. Moreover, the signal potentially could reduce the angle collisions at the right-turn merging location.
Further analyses indicate that increasing the southbound left-turn lane from one to two would significantly improve the intersection’s level service and reduce delays. However, the surrounding areas do not have room for such an expansion alternative.
Detailed signal timing settings and analysis results for the three proposed alternatives in the both the AM and PM peak hours are shown in Figure 8, Table 5, and Appendix D.
TABLE 3
Intersection Capacity Analysis of the Level of Service for
Existing Conditions and Alternatives
Blank |
Blank |
Existing Conditions |
Alternative 1 |
Alternative 2 |
Alternative 3 |
Street Name |
Approach |
LOS1 |
LOS |
LOS |
LOS |
Lexington Street |
NB – Through/right |
C (D) |
C (D) |
C(E) |
C(E) |
Lexington Street |
SB – Left |
D (F) |
D (F) |
D(F) |
C(F) |
Lexington Street |
SB – Through/right |
B (B) |
B (B) |
B(B) |
A(B) |
Beaver Street |
WB – Left |
D (F) |
D (F) |
D(E) |
D(E) |
Beaver Street |
WB – Right |
D (F) |
D (E) |
D(E) |
C(D) |
Overall |
Blank |
C (E) |
C (E) |
C (E) |
C(E) |
1 LOS = level of service. The LOS for the AM peak hour is the first letter. The LOS for the PM peak hour is in parentheses.
TABLE 4
Intersection Capacity Analysis of Delay for
Existing Conditions and Alternatives
Blank |
Blank |
Existing Conditions |
Alternative 1 |
Alternative 2 |
Alternative 3 |
Street Name |
Approach |
Delay1 |
Delay |
Delay |
Delay |
Lexington Street |
NB – Through/right |
31 (55) |
32 (55) |
35 (79) |
35 (76) |
Lexington Street |
SB – Left |
41 (159) |
40 (165) |
38 (154) |
29 (149) |
Lexington Street |
SB – Through/right |
11 (12) |
10 (12) |
10 (14) |
9 (14) |
Beaver Street |
WB – Left |
42 (96) |
44 (96) |
45 (73) |
54 (78) |
Beaver Street |
WB – Right |
40 (82) |
43 (82) |
37 (64) |
26 (36) |
Overall |
Blank |
32 (77) |
33 (79) |
31 (77) |
27 (69) |
1 The delay for the AM peak hour is the first number. The delay for the PM peak hour is in parentheses.
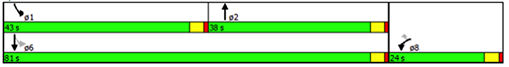
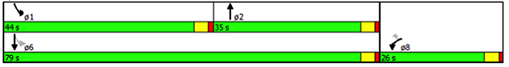
FIGURE 8
Intersection Signal Timings and Phasing for
Existing Conditions and Alternatives
AM Peak Hour - Existing
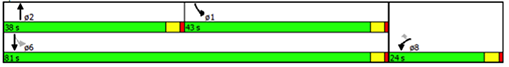
AM Peak Hour – Alternative 1
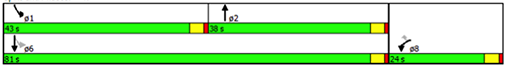
AM Peak Hour – Alternative 2
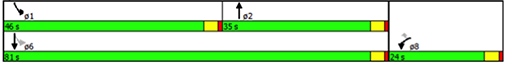
AM Peak Hour – Alternative 3
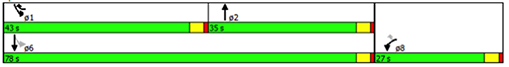
PM Peak Hour – Existing

PM Peak Hour – Alternative 1
PM Peak Hour – Alternative 2
PM Peak Hour – Alternative 3
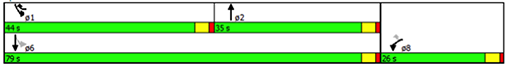
TABLE 5
Intersection Signal Phasing for
Existing Conditions and Alternatives
Blank |
Blank |
Existing Conditions |
Alternative 1 |
Alternative 2 |
Alternative 3 |
Street Name |
Approach |
Phases |
Phases |
Phases |
Phases |
Lexington Street |
NB – Through/right |
2 |
2 |
2 |
2 |
Lexington Street |
SB – Left |
1, 6 |
1, 6 |
1, 6 |
1, 6 |
Lexington Street |
SB – Through/right |
6 |
6 |
6 |
6 |
Beaver Street |
WB – Left |
8 |
8 |
8 |
8 |
Beaver Street |
WB – Right |
8 |
8 |
8 |
8 |
Another improvement alternative considered for this intersection is to install a modern roundabout. This section examines if and how a modern roundabout would work at this intersection.
Synchro tests of a single-lane roundabout under the existing traffic conditions indicate that a modern roundabout would fail in both the AM and PM peak hours. In the AM peak hour, the southbound approach would operate at a volume-to-capacity (V/C) ratio of 1.07, which is more than 85% of the estimated capacity.9 The approach would operate at an unacceptable level of service and endure extensive delays. In the PM peak hour, both the southbound and northbound approaches would operate at an unacceptable level of service. The southbound approach would endure an extremely extensive delay. Detailed analyses of individual approaches for both peak hours are shown in Appendix E.
The analysis confirms that an intersection that carries unbalanced traffic flows usually is not favorable for modern roundabout operations, especially with a high percentage of left turns.
Staff further tested another roundabout alternative with the southbound through movements and the westbound right-turn movements separated from the roundabout operation (see Appendix F for a draft diagram of the conceptual design). This alternative would operate acceptably in the AM peak hour. However, in the PM peak hour, the northbound traffic still would queue up and endure delays as the extensive southbound left-turn traffic would occupy the roundabout most of the time. In addition, this alternative would require some land takings on the west side of Lexington Street and a major land taking at the northeast corner of the intersection.
The above analysis shows that a modern roundabout is not feasible at this location.
The study intersection has a high number of crashes with a large proportion of left-turn crashes and is congested during the PM peak hour. The crash data analysis indicates that the left-turn crashes likely are related to the permissive/protected left-turn operation and signal indication. The intersection capacity analysis indicates that the southbound left-turn and the Beaver Street left- and right-turn approaches endure extensive delays.
Staff examined the following three traffic signal improvement alternatives (cited on page 16, above):
The analyses for the alternatives show that Alternative 3 could reduce the average delay by five to eight seconds in both the AM and PM peak hours. More importantly, this alternative potentially could reduce the southbound left-turn crashes and the westbound right-turn crashes.
Staff also explored the feasibility of a modern roundabout alternative. It was found to be unfavorable in terms of operations and land-taking requirements.
Hence, staff recommends a comprehensive approach to improve the intersection’s safety and operations based on Alternative 3, with an upgrade of the signal system and a number of modifications within the existing intersection layout.
The signal system upgrade should include the following items:
FIGURE 9
Proposed Arrangement of Signal Faces with Flashing Yellow Arrow for the Southbound Left-Turn Protected/Permissive Operation
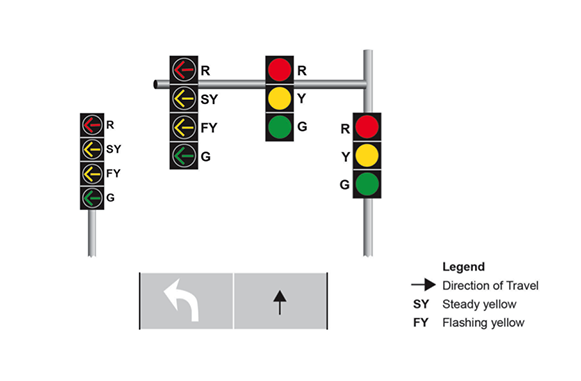
FIGURE 10
Proposed Signal Faces for the Westbound Right-Turn Operation
The intersection modifications should include the following items:
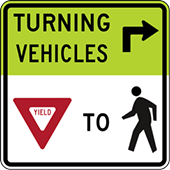
FIGURE 11
MUTCD Sign R10-15: Turning Vehicles Yield to Pedestrians
At this preliminary planning stage, staff estimates the total cost of the above proposed improvements at approximately $750,000 to $1,000,000. Both streets and the intersection are under the jurisdiction of the city of Waltham. The City can seek funding from the state by working closely with MassDOT Highway District 4 through a project implementation process.
In the short term, the following improvements should be considered:
CW/cw
1 Memorandum to Boston Region MPO, Safety and Operations Analyses at Selected Intersections—FFY 2013, Task 1: Intersection Selection Procedure, Mark Abbot and Chen-Yuan Wang, November 1, 2012.
2 The lanes probably were divided from an original two-lane roadway in order to accommodate increasing traffic over the years. Because of the adjacent residential and commercial developments, there is limited room for expansion to multiple standard 12-foot lanes.
3 During a return site visit in August 2013, staff did not observe the sign. The pedestrian signal for crossing Beaver Street was operational.
4 Lexington Street is an alternative route to Route 128. According to the City engineers, from time to time the intersection congestion is exacerbated by additional traffic, when an incident occurs on Route 128 in the vicinity.
5 Crash rates are estimated based on crash frequency (crashes per year) and vehicle exposure (traffic volumes or miles traveled). Per MassDOT guidance, crash rates are expressed as “crashes per million entering vehicles” for intersection locations and as “crashes per million miles traveled” for roadway segments.
6 The average crash rates estimated by the MassDOT Highway Division (as of January 23, 2013) are based on a database that contains intersection crash rates submitted to MassDOT as part of the review process for an Environmental Impact Report or Functional Design Report.
7 Synchro Version 8 is a computer application developed and distributed by Trafficware Ltd. The software can perform capacity analysis and traffic simulation (when combined with SimTraffic) for an individual intersection or a series of intersections.
8 The leading left-turn mode meets drivers’ expectations better than the lagging mode, especially for the drivers who have been waiting for traffic light changes at the intersection. The majority of intersections in the region, if running with a protected/permissive left-turn phase, operate in a leading mode, which generally is considered somewhat safer than a lagging mode. However, some intersections do operate left turns in a lagging mode because of the consideration of signal coordination, traffic pattern, or capacity concerns.
9 For any of the approaches in a modern roundabout, a V/C ratio of 0.85 is regarded as the threshold of an acceptable level of service. All the approaches should operate under the threshold to ensure the roundabout’s smooth operation.
10 For many years, engineers have had concerns that drivers turning left on a permissive circular green indication might inadvertently mistake it as the left turns having the right of way over the opposing traffic. Recent national researches assert that Flashing Yellow Arrow (FYA) is the best overall alternative to the circular green as permissive signal display for left turns. MassDOT now plans to upgrade all state highway intersections that have a separate left-turn lane under a protected/permissive left-turn phasing to incorporate FYA indication. It will be accomplished by a systematic review of such state-owned intersections.
11 Manual for Uniform Traffic Control Devices, Federal Highway Administration, U.S. Department of Transportation, 2009 Edition with Revision Numbers 1 and 2 incorporated, May 2012.
12 With the installation of the four-section FYA indication, left turns will be prohibited by the indication of a red arrow.
13 Advanced traffic signal control technology that can adapt to serve demand by adjusting the cycle lengths, splits, and/or offsets of traffic signals in a corridor based on volume or occupancy data collected in real time.
14 Staff does not have a suggestion for the format of the sign, as currently there is no MUTCD standard sign for regulating left turning vehicles yielding to pedestrians on crosswalks.
15 A five-foot shoulder on each side of Lexington Street would be desirable for bicycle accommodation at this intersection. Its feasibility should be examined during the intersection’s functional design stage.
APPENDIX A. Intersection Crash Rate. Crash rates for the intersection are shown on MassDOT’s Intersection Crash Rate worksheet.
APPENDIX B. Intersection Traffic, Pedestrian, and Bicycle Counts, November 15, 2012. Four pages of tables. The counts cover “all vehicles,” cars, MBTA buses, trucks, and large trucks (freight), for various time periods.
APPENDIX C. AM/PM Peak-Hour Intersection Capacity Analysis: Existing Conditions. Four pages of data generated by using Synchro 8 software.
APPENDIX D. AM/PM Peak-Hour Intersection Capacity Analysis: Traffic Signal Improvement Alternatives. Tables of data (12 pages) generated by using Synchro 8 software.
APPENDIX E. AM/PM Peak-Hour Intersection Capacity Analysis: Single-Lane Modern Roundabout Alternative. Two pages of data generated by using by Synchro 8 software.
APPENDIX F. Modern Roundabout Draft Concept Plan. This is a hand-drawn sketch how a roundabout might function at the intersections.