Memorandum
Date December 20, 2012
To Boston Region MPO
From William Kuttner
MPO Staff
Re Screening Regional Express Highways for Possible Preferential Lane Implementation
This memorandum presents the findings of the Regional HOV Lane System Planning Study. This study represents the initial phase of a two-part investigation, the second phase of which is to be undertaken during federal fiscal year (FFY) 2013.
Gradually increasing traffic congestion has imposed both economic and quality-of-life burdens on the region, and strategies to limit or reduce congestion are regularly evaluated by the MPO. The congestion relief strategies being envisioned do not include building new express highways, and the widening of express highways is only being considered in a few specific locations.
The implementation of high-occupancy-vehicle (HOV) lanes has been a successful congestion relief strategy in the Boston region, and both HOV lanes and other kinds of preferential lanes have been successful across the country. The value of these lanes, however, depends critically on the traffic conditions of the highway where they are constructed. This study evaluates all express highways in eastern Massachusetts and identifies sections that might be suitable for preferential lane implementation. Conceptual plans for selected suitable sections will be developed in this study’s second phase.
This study is informed by three basic planning assumptions:
Most of the regional express highway system was found to be unsuitable for the type of preferential lane envisioned. Either these highway sections failed the user benefit tests in some respect, or there were land use or traffic flow issues specific to particular locations that eliminated them from further consideration.
Important stretches of express highway were, however, found to potentially offer significant user benefits and have tractable construction challenges. The express highway elements recommended for further analysis are shown in Figure 5, found on page 56 of this memorandum. These highway elements relate to each other geographically in such a way that they can be viewed as an integrated preferential lane system focused on I-93. The sections recommended for further consideration include:
This memorandum presents the initial findings of the Regional HOV Lane System Planning Study, which was approved by the MPO on August 18, 2011. In recent years extensive data about traffic and level of service on the Boston region limited-access expressway system have been gathered, refined, and systematized. In this initial phase of the investigation, these data are analyzed and specific quantitative measurements are presented that can indicate the appropriateness of having a preferential lane within a section of the regional express highway system.
HOV (high-occupancy vehicle) lanes, commonly referred to as “carpool” lanes, may be used by autos with two or more occupants, depending on the rules of a particular HOV facility. Buses also use HOV lanes, sometimes offering a significant time advantage to bus users as compared with driving alone. With new vehicle and other technologies, highway authorities have been experimenting with additional eligibility criteria for these facilities, such as low- or no-emission vehicles, or willingness to pay tolls collected using a transponder.
In this investigation, the term “preferential lane” has been adopted to make explicit the recognition that any Massachusetts agency responsible for such lanes in the future will be able to establish eligibility as deemed appropriate at that time. Vehicle occupancy data are used in this investigation, however, to the extent that such data are available and relevant to the analysis.
This study is has five major sections. The introduction reviews some history of the regional express highway system. The difficulties of adding capacity to a congested highway are discussed, as well as the types of benefits that might reasonably be expected from a successful preferential lane implementation.
In the second major section, the regional express highway system is divided into parts to facilitate congestion analysis. Several measurements of congestion severity, based on recently obtained regional traffic data, are presented. These measurements are applied to each part of the regional express highway system to identify which parts of the system experience congestion that rises to the level of a “problem.”
The next section looks more closely at the highway segments identified as having problem congestion. The regional traffic data are analyzed to determine whether a preferential lane would provide meaningful user benefits in the congested highway sections. Only if the analysis predicts meaningful user benefits is a preferential lane deemed to be suitable.
The express highway sections that emerge from the traffic-based screening process are then evaluated individually. How congested highways interact with nearby and interconnected highway sections is examined. Improvements to the regional express highway system, whether under construction, planned, or envisioned, must be considered when evaluating implementation of a preferential lane anywhere in the region.
The last section presents all the parts of the regional express highway system that emerged from the screening process. These highway sections fit together and function as a regional preferential lane system, which was a desired outcome of the evaluation in the preceding section.
Construction of the regional express highway system began in earnest in the 1950s. Most Massachusetts expressways at that time were planned as either four- or six-lane facilities, and were constructed with then-standard breakdown lanes. As traffic volumes increased, some express highways were widened and some of the newer ones were built as eight-lane roadways.
Continued traffic growth and the cancellation of several major expressways in the early 1970s have made maximum utilization of existing highway corridors a critical planning objective. Some expressways have been fully widened with newly constructed breakdown lanes. In other instances the breakdown lane has been converted into a travel lane, with some pullouts provided. Another strategy has been to allow use of the breakdown lane only during peak periods, though this is discouraged as a long-term operating practice.
It needs to be acknowledged that the Central Artery/Tunnel (CA/T) project added significant new capacity and important connections in the core of the regional expressway system, and no new preferential lane facilities are envisioned within the CA/T project area. Outside of the core, however, the regional expressway system continues to struggle with today’s traffic burden. Though future forecasts of traffic growth are moderate and characteristic of a mature travel market, most of the regional expressway system has very little extra capacity to accommodate growth, and crowded highways impose significant congestion and delay penalties on current users.
Further widening of regional expressways poses a number of challenges. First, adding two additional general-purpose lanes to an eight-lane section should not be expected to increase capacity by a full 25% because of the increased amount of lane changing that results, especially in a dense urban area such as that of the Boston region. Given the expense and probable land takings that any such widening is likely to require, adding extra lanes to achieve only a modest capacity increase would be unlikely to gain institutional or public support.
An alternative approach to adding capacity in an expressway corridor is to add a lane, or lanes, serving a specialized traffic purpose, and physically separated from the main traffic lanes. A common example of this approach is so-called “collector-distributor,” or “CD” lanes. These lanes, usually built to the right of the main travel lanes, can serve numerous entrances and exits as the expressway passes through a complex of one or more closely-spaced interchanges. A four-lane main travel barrel can operate at full capacity, while the CD lanes accommodate significant amounts of traffic using the various ramps, and rejoin the main travel lanes at a simpler location in the network.
The preferential lanes envisioned in this study would usually constitute specialized, separate lanes, generally constructed in the median of an expressway. The adjacent main travel lanes could continue to accommodate their full lane capacities, up to around 2,200 vehicles per hour, depending on the design standards of the roadway. With preferential lane eligibility set to allow fewer vehicles, perhaps 1,500 per hour, buses and other users of the preferential lane would be able to travel at posted speeds. Depending on traffic conditions, users of the general-purpose lanes would continue to experience delays either as a result of heavy traffic or from queues forming at bottlenecks.
A less common preferential lane implementation is the use of a moveable-barrier contraflow lane, like the so-called “zipper” lane currently in use on the Southeast Expressway. These systems require reversing the direction of one lane during peak travel periods. This increases capacity in the peak direction, but reduces it in the opposite direction. If an expressway section has a sufficiently large disparity in traffic by direction, a zipper lane might be implemented without meaningfully worsening traffic in the off-peak direction. Locations in the express highway system that might benefit from this type of facility will be identified in this study.
The implementation of a preferential lane may offer several benefits. First, the total capacity of an expressway section can be increased. Congestion and queuing in the general-purpose lanes can be reduced, and the preferential lane can still offer its users a travel advantage as compared with users of the general-purpose lanes. This advantage will accrue to important preferential-lane users such as buses, and provide an incentive for other users to meet the eligibility standards, whether set by occupancy, payment of a toll, or other criteria.
It is sometimes suggested that an HOV lane could be implemented by converting a general-purpose lane for the exclusive use of HOVs. Since it is assumed that any preferential lane eligibility rules would result in fewer vehicles in the preferential lane than in the general-purpose lanes, the result would be a reduction in total expressway capacity. Reducing the capacity of a congested expressway would seriously worsen congestion and queuing within and leading to the capacity-reduced corridor, as well as on nearby surface roadways.
This study will identify locations in the regional expressway system where creating a preferential lane could be expected to substantially benefit all or most users. Situations or strategies where the likely benefits would be minimal, or where negative impacts would likely be significant, are identified and eliminated from further consideration.
The appropriateness of adding a preferential lane is considered for all regional expressways, regardless of size. For practical and political reasons, a preferential lane may be the better way of adding capacity to an eight-lane expressway. However, six- and four-lane expressways might at some point be candidates for simple widening as a better option. This study examines the potential benefits of adding a preferential lane to these narrower parts of the expressway system, but will be cognizant of any plans or the possibility of undertaking a roadway widening.
This investigation has been able to utilize extensive, recently developed traffic information resources. Narrowing and focusing the available data to develop usable results presents an organizational challenge. This section previews the general approach to the analysis.
For the purposes of this study, regional express highway traffic has been divided into four travel markets:
Each of these express highway travel markets is analyzed separately and in this order, but the structure of the four analyses is basically the same. Each analysis involves dividing the regional express highway system into major components, picking specific highway segments to represent each component, and attaching several congestion measurements to each of the representative segments. These measurements are compared, and some of the segments are identified as having congestion severe enough to be considered a problem.
The analysis begins with a description of how the regional express highway system is divided into major components. The next step is to select a single highway segment within each system component that will represent the component in the comparative analysis.
Each of the representative segments is then characterized by its level of congestion severity, which is represented by four different measurements in this analysis. Each of the four measurements has its own analytical meaning and importance, and each measurement is presented and discussed individually.
It is helpful to point out here that one of the four congestion measurements, vehicles per lane per hour, is also used for selecting representative segments. Although this measure is appropriate for selecting representative segments, it is only one measure used to evaluate congestion severity. In the evaluation of representative segments, all four congestion measurements need to be considered.
Some of the representative segments will be identified as having a congestion “problem,” a level of severity greater than merely observing some congestion. This involves weighing the four measurements, as well as consideration of the overall traffic situation within the given system component.
Congestion on radial express highways during the AM peak period is discussed first. This initial travel market is used to provide numerical examples and network situations with which to illustrate the calculations and concepts applied throughout the analysis. After AM peak radial problem congestion is identified, PM peak radial congestion problems are then identified, but without repeating the illustrative discussion.
After the AM and PM radial congestion problems are identified, the circumferential highway travel markets are analyzed. AM peak conditions are used to illustrate several unique characteristics of circumferential highway analysis. Problem circumferential congestion in the AM peak is identified, followed by problem circumferential congestion in the PM peak.
At this point, the identification of representative segments with problem congestion is complete. In the next major section, the same traffic data that were used here will again be applied to determine which of the segments with problem congestion might be suitable for preferential lane implementation.
For the purposes of this study, the regional express highway system has been divided into sections which will be referred to as major “components.” A component will generally be a section of limited-access highway anchored at its two ends by interchanges with other limited-access highways. These major components are in turn divided into two distinct groups: radial components and circumferential components. The analysis and evaluation of these two groups differs in important regards, and as indicated above, the two groups have been evaluated separately, beginning with the radial group.
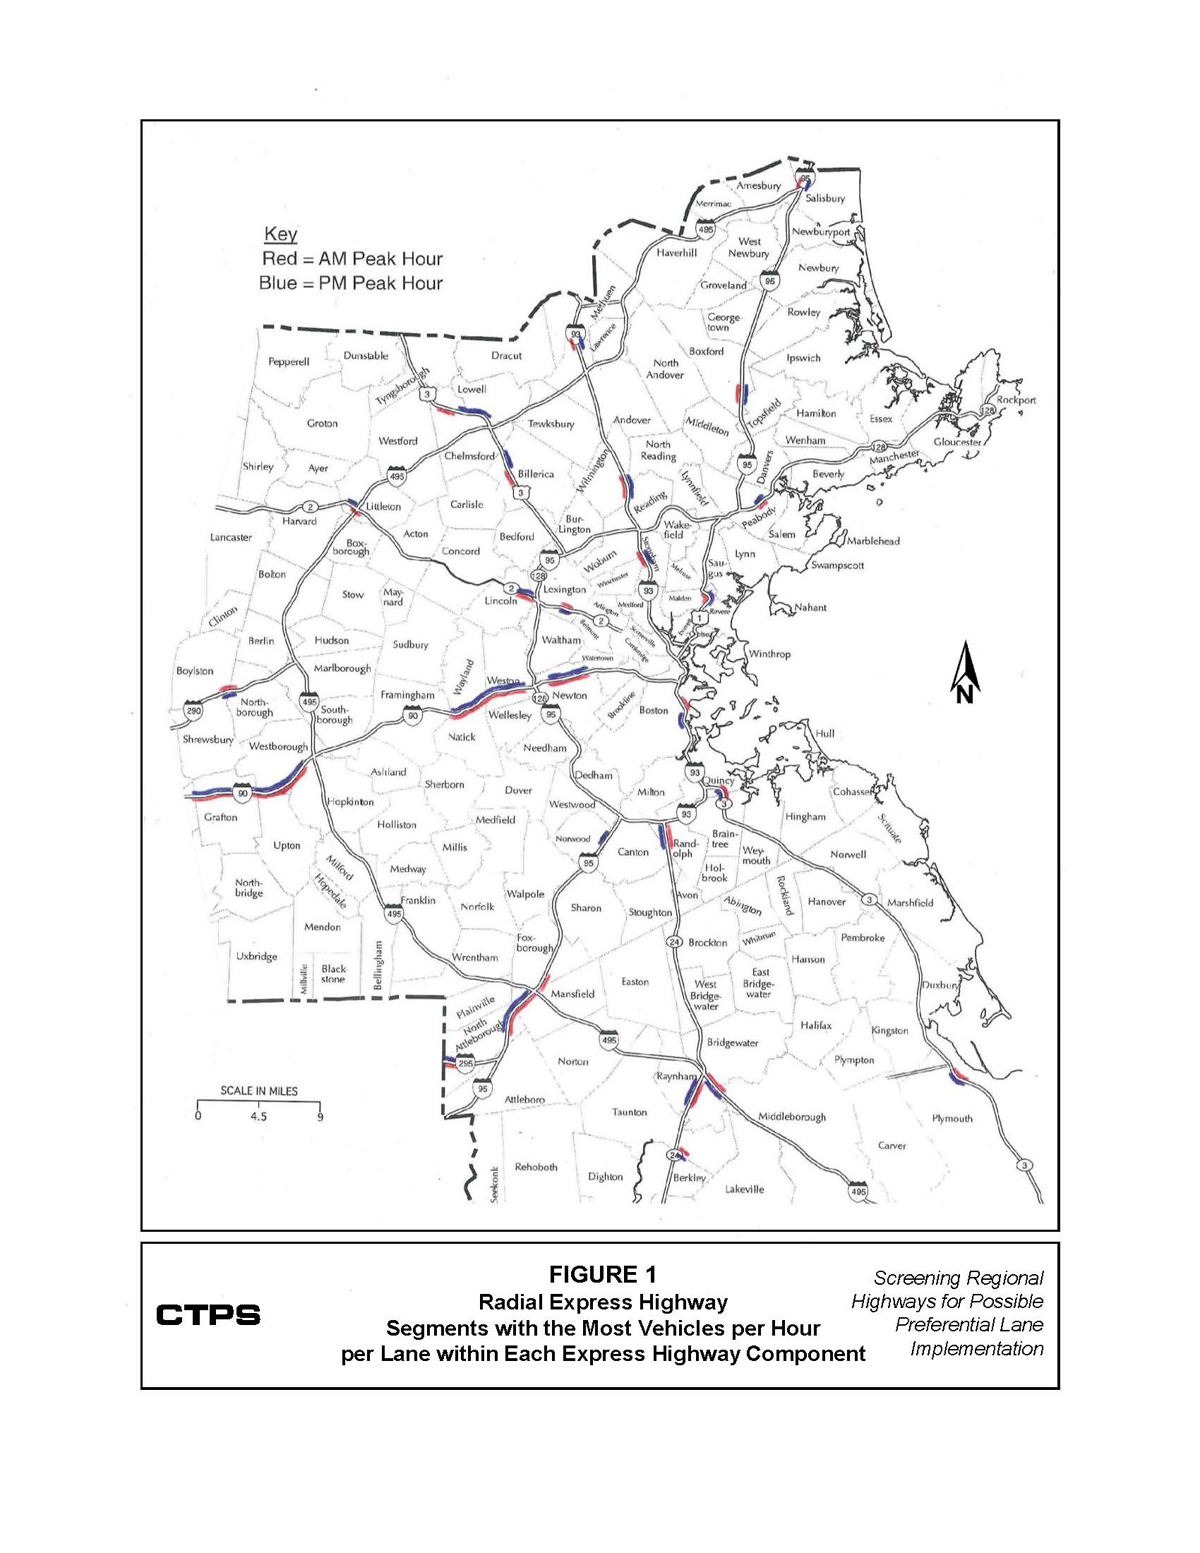
The analysis begins by using peak hour traffic volumes for every express highway segment to identify the location with the highest number of vehicles per lane per hour for every highway component being evaluated. Figure 1 shows the CTPS model region, as well as several adjoining municipalities. The express highway system is also shown, and radial segments carrying the highest number of vehicles per lane per hour are highlighted in red (AM peak hour) or blue (PM). The position of the highlighting indicates the direction of the peak hour travel, and the length indicates the length of the highway segment.
The segments shown in Figure 1 illustrate some aspects of both component definition and segment selection. There are a total of 26 components analyzed in Figure 1, each of which has both an AM (red) and a PM (blue) segment highlighted. In 19 components, the peak AM and PM segments are between the same pairs of interchanges, with the direction shifting between the AM and PM peaks. In five of the components, the highest volumes per lane per hour are found between different interchanges in the morning than in the afternoon.
For analytical purposes, the components in Figure 1 have been organized into three groups: “inner” radials, “outer” radials, and “external” radials. Inner radials are the five express highways components within the I-95/Route 128 circumferential highway. Outer radials are the nine components outside of and connecting with I-95/Route 128. With the exception of Route 3 on the South Shore and Route 128 east of I-95 on the North Shore, outer radial components extend from the I‑95/Route 128 circumferential highway to I-495.
Beyond I-495 there are ten components referred to as external radials. Eight of these highways connect directly with I-495, while I-295 in Attleboro and Route 140 in Taunton are even more distant from Boston, branching from I-95 and Route 24 respectively. Southeast of Route 24, I‑495 is also characterized as an external radial, extending as it does to the edge of the model region.
Route 3 in Plymouth, south of the recently constructed U.S. 44 interchange, completes the group of twelve external radial components. Conforming with the definition of a component used here, most of these external radials extend to an interchange with another express highway outside of the model region. All traffic volume analysis, however, is confined to those segments of the external components that are within the CTPS model region.
AM peak conditions for the 26 radial segments are shown in Table 1. The segments are listed in the left-hand column in their three groups. The demarcations of (N) and (S) for I-93 and I-95 refer to regional system components north or south of Boston respectively, not direction of travel. The components are ordered starting with alignments to the northeast, followed by alignment directions sequencing counterclockwise, ending at the southeasternmost alignment.
The AM peak travel direction for all but three of these segments is toward downtown Boston. The exceptions are indicated in Table 1 with asterisks and include Route 2 in Lexington, Route 128 in Peabody, and I-290 in Northborough. The exit numbers indicating the location of each highway segment are shown, as well as the town where it is located. U.S. 1 has no interchange numbers, and the selected segment is immediately north of Massachusetts Route 60 at Copeland Circle. If only one interchange is shown, the segment is at the edge of the numbering system, or in the case of external radial Route 2 in Littleton, the segment is within the cloverleaf Interchange 40 at I-495.
The selected segment of each component is also characterized by the number of lanes in the peak direction at that point. Segments usually have two, three, or four lanes of general traffic. In the instance of I‑93 between interchanges 46 and 45 north of I‑495, use of the breakdown lane is allowed during the AM peak period. The relationship of these so-called “managed” lanes to the various entrance and exit ramps and associated acceleration lanes is not always clear to drivers, and these lanes are generally not fully utilized. As a consequence, a practical capacity of one-half lane is commonly assumed when travel in breakdown lanes is authorized.
The average weekday traffic (AWDT) for each segment is also presented in Table 1. The AWDT suggests the relative importance of the 26 highway system components in the overall regional express highway system.
Highlighted in Table 1 is a group of statistics which can be used as measurements of congestion severity. Dividing AWDT by the number of lanes (not including managed lanes) gives the AWDT per lane. It has been observed in eastern Massachusetts that at locations where AWDT per lane reaches 15,000 on an express highway, congestion and queues begin to be observed. Above 15,000 daily vehicles per lane, the hours of congestion and length of queues increase.
Since this statistic is based on AWDT, it can reflect congestion during both AM and PM, as well as midday congestion. Prior to completion of the CA/T Project, AWDT per lane reached 35,000 north of Northern Avenue northbound, and weekday congestion began shortly after 5 AM and only subsided late in the evening. The highest AWDT per lane in Table 1 is the 27,900 weekday vehicles on the I-93 inner radial south of downtown Boston between interchanges 15 and 16, from Columbia Road to Southampton Street.
| Table 1 | ||||||||||
| Segments with Highest AM Peak Hour Vehicles per Lane | ||||||||||
| within Each Radial Express Highway Component: | ||||||||||
| Selected Statistics with Congestion Problem Flags | ||||||||||
| Measurement of Congestion Severity | ||||||||||
| Vehicles | Slowest | Congestion | ||||||||
| Peak Direction | AWDT | per Hour | Hours | Period | Problem | |||||
| Exits | Location | Lanes | AWDT | per Lane | per Lane | Congested | Speed | Flag | ||
| Inner | ||||||||||
| U.S. 1 | MA 60 | Revere | 2 | 48,000 | 24,000 | 2,175 | 3.0 | 45 | C | |
| I-93 (N) | 36-35 | Stoneham | 4 | 100,000 | 25,000 | 1,988 | 1.5 | 40 | C | |
| MA 2 | 55-54* | Lexington | 3 | 50,000 | 16,700 | 1,683 | 58 | |||
| I-90 | 16-17 | Newton | 3 | 73,000 | 24,300 | 2,000 | 2.5 | 26 | C | |
| I-93 (S) | 15-16 | Boston | 4 | 111,500 | 27,900 | 2,075 | 4.0 | 20 | C | |
| Outer | ||||||||||
| MA 128 | 28-26* | Peabody | 2 | 55,000 | 27,500 | 2,000 | 2.0 | 50 | ||
| I-95 (N) | 52-51 | Boxford | 4 | 45,000 | 11,300 | 1,363 | 65 | |||
| I-93 (N) | 39-38 | Wilmington | 4 | 90,000 | 22,500 | 2,050 | 2.5 | 48 | C | |
| U.S. 3 | 28-27 | Billerica | 3 | 55,500 | 18,500 | 2,067 | 3.0 | 42 | C | |
| MA 2 | -52 | Lincoln | 2 | 29,000 | 14,500 | 1,500 | 50 | |||
| I-90 | 13-14 | Weston | 3 | 71,000 | 23,700 | 1,800 | 1.0 | 28 | C | |
| I-95 (S) | 6-7 | Mansfield | 3 | 54,500 | 18,200 | 1,967 | 2.0 | 60 | ||
| MA 24 | 20-21 | Randolph | 3 | 70,000 | 23,300 | 2,033 | 2.5 | 28 | C | |
| MA 3 | 17-19 | Braintree | 3 | 80,000 | 26,700 | 2,167 | 3.0 | 20 | C | |
| External | ||||||||||
| I-95 (N) | 60-59 | Salisbury | 4 | 49,000 | 12,300 | 1,050 | 65 | |||
| I-93 (N) | 46-45 | Andover | 3.5 | 68,500 | 22,800 | 2,171 | 3.0 | 54 | C | |
| U.S. 3 | 33-32 | Chelmsford | 3 | 54,000 | 18,000 | 1,867 | 1.0 | 58 | ||
| MA 2 | 40 | Littleton | 2 | 31,000 | 15,500 | 1,800 | 58 | |||
| I-290 | 24-23* | Northborough | 3 | 45,000 | 15,000 | 1,600 | 65 | |||
| I-90 | 11-11A | Westborough | 3 | 50,000 | 16,700 | 1,433 | 65 | |||
| I-295 | -1 | N. Attleboro | 3 | 25,600 | 8,500 | 833 | 65 | |||
| I-95 (S) | 5-6 | Mansfield | 3 | 61,000 | 20,300 | 1,967 | 2.0 | 60 | ||
| MA 24 | 13-14 | Raynham | 2 | 41,000 | 20,500 | 2,100 | 2.0 | 64 | ||
| MA 140 | 11-12 | Taunton | 2 | 22,000 | 11,000 | 900 | 50 | |||
| I-495 | 6-7 | Raynham | 2 | 30,000 | 15,000 | 1,550 | 65 | |||
| MA 3 | 5-6 | Plymouth | 2 | 38,000 | 19,000 | 1,500 | 60 | |||
*Peak AM traffic on these segments is away from Boston |
||||||||||
The second measurement of congestion severity is vehicles per hour per lane. Estimates of traffic by hour during four-hour AM and four-hour PM peak periods have been developed by CTPS for every express highway segment in eastern Massachusetts. For highways designed to the highest standards, 2,200 vehicles per hour per lane is a practical maximum. Ten of the 26 segments in Table 1 have at least 2,000 vehicles per lane per hour, with the highest value being 2,175 on U.S. 1 approaching Route 60 at Copeland Circle from the north.
The vehicles per hour per lane values shown in Table 1 were the basis for selecting the 26 highway segments that would represent the 26 radial components. During the AM peak period, these segments show a higher number of vehicles per hour per lane than any other segments that make up their respective highway system components. It is possible that traffic conditions may be worse at other locations along a highway component. These other highly stressed segments in most cases will be near the selected segment and will be considered in the corridor analyses after the initial screening.
There are three reasons for using the highest vehicles per hour per lane to select representative segments. First, an abundance of quantitative data is readily available for all regional express highways, regardless of the presence of any congested conditions. Second, a high volume of traffic implies a high level of regional travel demand at that location in the roadway network. Third, consideration of a preferential lane implementation can logically begin at a high volume location, and then be expanded to look at other congested segments that make up the component.
The third measurement of congestion severity is the length of time the segment is congested during a peak period. For the 26 representative segments shown in Table 1, the estimates of congestion duration approximate the length of time that the roadway is substantially full. Given that there is a maximum hourly capacity for a roadway, travel demand above that capacity will result in queuing, peak spreading, or both.
At many locations in the express highway system, congestion is observed despite a substantially lower number of vehicles per hour per lane than at the locations in Table 1. Usually these congested locations are within a peak period queue. If there is a high-volume entrance ramp joining an express highway, the lanes beyond the entrance may be carrying their practical capacity, but queues will form on the entrance ramp and upstream in the main barrel it joins. Vehicles in a queue will travel at the queue’s characteristic slow speed until reaching the bottleneck, at which point traffic can speed up and higher vehicles per hour per lane can be achieved.
A low-volume-per-lane but high-congestion condition can also occur where an expressway component ends either at another congested expressway or at a traffic signal. These types of congestion situations are not used in the screening process, but will be analyzed as appropriate in conjunction with the selected high-volume severe congestion locations.
The selection rule for the representative segments in Table 1 was highest vehicles per hour per lane. As a consequence, almost all the segments shown with a congestion duration were carrying their practical maximum of traffic rather than being in a queue behind a bottleneck. Some of these representative segments are at bottlenecks at the head of queues, and any preferential lane analysis will consider the queue and the bottleneck together as a congested traffic subsystem.
The longest AM congestion duration is four hours on the northbound I-93 inner radial north of Columbia Road. As indicated above, this location also has the highest AWDT per lane (27,900) which is known to correlate well with congestion duration.
The lowest vehicles per lane per hour with congestion is the 1,800 vehicles on outer radial I-90 after Interchange 13 as it approaches the Weston toll plazas, interchanges 14 and 15. An hour of AM congestion is estimated at this location as the volume on this segment reaches the maximum throughput of the Weston toll plazas.
The last measurement of congestion is the slowest traffic speed that will normally occur on a representative segment at some time during the peak period. Travel speeds have been measured on regional express highways using GIS and other techniques, and average speeds have been developed for half-hour periods between 6 and 10 AM and between 3 and 7 PM for individual segments of the regional express highway system.
Slow speed is a reliable indicator of a congestion problem, either from heavy traffic at a particular point, or from a bottleneck ahead of that point causing a queue. The converse is not true, however. Traffic on a road can be near capacity, yet traffic can be moving near design speeds. As with the other three measurements of congestion severity, consideration of travel speed must be in the context of conditions on other parts of an expressway system component.
Travel speeds as low as 20 mph occur during the AM peak at two locations: the northbound I-93 inner radial north of Columbia Road, and the outer radial Massachusetts Route 3 as it approaches Exit 19 just before the Braintree Split. At the opposite extreme, a number of locations experience one or more hours of congestion, yet are seen with traffic speeds ranging from 54 to 64 mph.
Fifteen of the 26 segments in Table 1 are shown as having one or more hours of congestion. Ten of these segments have been flagged as having a congestion “problem,” indicated by a “C” in the rightmost column. Congestion on the other five segments is considered insufficiently severe to qualify as a problem.
Congested conditions will not necessarily slow traffic. The five segments with “non-problem” congestion all support traffic speeds appropriate for the segment design. The slowest traffic of the five is on Route 128 in Peabody headed north towards Danvers, where congestion is observed for two hours in the morning, but traffic only slows to 50 mph, a reasonable speed given the 1940s-era highway design.
The segments with non-problem congestion could in the future have a congestion problem if traffic grows appreciably. The external radial, Route 24 in Raynham, carries 2,100 vehicles per hour per lane, the highest of the five non-problem congestion segments. It is congested for two hours during the AM peak, although traffic moves at 64 mph. Despite the limited potential for traffic growth, this segment has not been flagged as having a congestion problem because after a mile and a half it widens to three lanes.
The remaining three non-problem congestion segments, U.S. 3 in Chelmsford and two segments of I-95 in Mansfield, have fewer than 2,000 vehicles per hour per lane, and traffic speeds are 58 mph or greater. Despite the good travel speeds, and modest unutilized lane capacity, they are still considered to be congested for one or two hours during each AM peak period.
Of the ten segments with “problem” congestion, four are inner radials, five are outer radials, and one is an external radial. Of the five inner radials, all except Route 2 are considered to have problem congestion. The congested inner radials are I-93, both north and south of downtown Boston, U.S. 1 in Revere, and I-90 in Newton.
Five of the nine outer radials are also considered to have problem congestion. These include I-93 in Wilmington, U.S. 3 in Billerica, I-90 in Weston, Route 24 in Randolph, and Massachusetts Route 3 in Braintree.
The only external radial with a congestion problem is I-93 in Andover. It carries 2,171 vehicles per hour per lane (assuming a half-lane capacity for the managed lane), experiences three hours of congestion each morning and has a travel speed of 54 mph. While 54 mph may not seem unduly slow, this section of highway clearly has little room to add more traffic.
Casual inspection of these ten segments reveals some patterns. Six of the ten segments are associated with I-93 in some manner. The three I-93 segments north of Boston all qualify as having congestion problems. South of the downtown area, I-93 northbound traffic in the Southeast Expressway north of Columbia Road shows some of the region’s highest measures of congestion severity. Further south, Routes 24 and 3 in Randolph and Braintree experience serious congestion as they supply much of the AM peak-period traffic to the Southeast Expressway.
This completes the selection process for AM peak-period radial segments with problem congestion. After selection of the PM radial and AM and PM circumferential segments with problem congestion, the entire group of selected segments will be evaluated to determine the possible benefit of adding preferential lane facilities.
The representative radial segments for the PM peak are listed in Table 2. This table is organized in the same manner as Table 1. The PM peak segments appear in Figure 1, and most, but not all, are located between the same pair of interchanges as the corresponding AM peak segments.
Seventeen of the 26 representative segments experience congested conditions for one or more hours during the PM peak. This compares with the 15 segments in the AM experiencing congestion. Congested situations are more widespread during the PM peak than in the AM because the PM peak combines a quantity of work trips similar to the AM peak, with trips having other purposes exceeding those taking place during the AM peak.
Three of the segments exhibit what is considered non-problem congestion. Two external radials with some congestion show speeds of 60 mph with volumes per hour per lane near 2,000 vehicles. The outer radial on the south-side part of I-95 in Norwood shows travel speeds of 56 mph with 2,033 vehicles per hour per lane.
Fourteen of the PM segments with congestion are considered in this study as having a congestion problem. All ten of the expressway system components that had problem congestion during the AM peak also experience problem congestion during the PM peak. Of the six segments associated with I-93, the AM and PM peak segments for five locations are between the same interchanges. In Boston, the congested I-93 segments are offset by one interchange, north and south of Columbia Road.
Four components have problem congestion in the afternoon but not in the morning. The outer radial Route 128 in Peabody carries 2,150 vehicles per hour per lane inbound on a 1950s-era highway. The road is full for three hours each afternoon, and traffic moves at 42 mph for two hours even through the highway widens from two to three lanes within this segment.
Route 2 in Lincoln is severely congested in the PM as it approaches the Bedford Road signal, the first of a sequence of eight traffic lights on Route 2 as it bypasses Concord. During the AM peak, traffic in this most easterly segment is approaching a fully limited-access section of Route 2 and speeds are higher.
| Table 2 | ||||||||||||||||||||||||||
| Segments with Highest PM Peak Hour Vehicles per Lane | ||||||||||||||||||||||||||
| within Each Radial Express Highway Component: | ||||||||||||||||||||||||||
| Selected Statistics with Congestion Problem Flags | ||||||||||||||||||||||||||
| Measurement of Congestion Severity | ||||||||||||||||||||||||||
| Vehicles | Slowest | Congestion | ||||||||||||||||||||||||
| Peak Direction | AWDT | per Hour | Hours | Period | Problem | |||||||||||||||||||||
| Exits | Location | Lanes | AWDT | per Lane | per Lane | Congested | Speed | Flag | ||||||||||||||||||
| Inner | ||||||||||||||||||||||||||
| U.S. 1 | MA 60 | Revere | 2 | 51,000 | 25,500 | 2,150 | 4.0 | 19 | C | |||||||||||||||||
| I-93 (N) | 35-36 | Stoneham | 4 | 102,000 | 25,500 | 1,900 | 3.5 | 34 | C | |||||||||||||||||
| MA 2 | 54-55* | Lexington | 3 | 51,000 | 17,000 | 1,583 | 57 | |||||||||||||||||||
| I-90 | 17-16 | Newton | 3 | 71,000 | 23,700 | 2,000 | 3.0 | 36 | C | |||||||||||||||||
| I-93 (S) | 15-13 | Boston | 4 | 108,000 | 27,000 | 1,950 | 5.0 | 35 | C | |||||||||||||||||
| Outer | ||||||||||||||||||||||||||
| MA 128 | 26-28* | Peabody | 2 | 55,000 | 27,500 | 2,150 | 3.0 | 42 | C | |||||||||||||||||
| I-95 (N) | 51-52 | Boxford | 4 | 46,000 | 11,500 | 1,250 | 65 | |||||||||||||||||||
| I-93 (N) | 38-39 | Wilmington | 4 | 91,000 | 22,800 | 2,050 | 3.5 | 56 | C | |||||||||||||||||
| U.S. 3 | 28-29 | Billerica | 3 | 56,000 | 18,700 | 2,033 | 2.5 | 58 | C | |||||||||||||||||
| MA 2 | 52- | Lincoln | 2 | 28,000 | 14,000 | 1,200 | 4.0 | 44 | C | |||||||||||||||||
| I-90 | 14-13 | Weston | 3 | 73,000 | 24,300 | 2,067 | 3.0 | 42 | C | |||||||||||||||||
| I-95 (S) | 11A-11 | Norwood | 3 | 61,000 | 20,300 | 2,033 | 2.0 | 56 | ||||||||||||||||||
| MA 24 | 21-20 | Randolph | 3 | 70,000 | 23,300 | 2,000 | 3.0 | 46 | C | |||||||||||||||||
| MA 3 | 19-17 | Braintree | 3 | 79,000 | 26,300 | 2,133 | 5.0 | 16 | C | |||||||||||||||||
| External | ||||||||||||||||||||||||||
| I-95 (N) | 59-60 | Salisbury | 4 | 49,000 | 12,300 | 1,150 | 65 | |||||||||||||||||||
| I-93 (N) | 45-46 | Andover | 3.5 | 69,000 | 23,000 | 2,114 | 3.5 | 22 | C | |||||||||||||||||
| U.S. 3 | 31-32 | Chelmsford | 3 | 54,000 | 18,000 | 2,000 | 2.0 | 40 | C | |||||||||||||||||
| MA 2 | 40-39 | Littleton | 2 | 28,500 | 14,300 | 1,550 | 58 | |||||||||||||||||||
| I-290 | 23-24* | Northborough | 3 | 44,000 | 14,700 | 1,567 | 65 | |||||||||||||||||||
| I-90 | 11A-11 | Westborough | 3 | 49,500 | 16,500 | 1,600 | 65 | |||||||||||||||||||
| I-295 | 1- | N. Attleboro | 3 | 26,400 | 8,800 | 1,000 | 65 | |||||||||||||||||||
| I-95 (S) | 6-5 | Mansfield | 3 | 61,000 | 20,300 | 1,967 | 2.5 | 60 | ||||||||||||||||||
| MA 24 | 14-13 | Raynham | 2 | 41,000 | 20,500 | 1,950 | 2.5 | 29 | C | |||||||||||||||||
| MA 140 | 12-11 | Taunton | 2 | 22,000 | 11,000 | 1,050 | 50 | |||||||||||||||||||
| I-495 | 7-6 | Raynham | 2 | 32,000 | 16,000 | 1,625 | 60 | |||||||||||||||||||
| MA 3 | 6-5 | Plymouth | 2 | 40,500 | 20,300 | 1,850 | 2.0 | 60 | ||||||||||||||||||
| *Peak PM traffic on these segments is away from Boston | ||||||||||||||||||||||||||
The external radial on Route 24 in Raynham has problem congestion for 2.5 hours in the afternoon, with speeds dropping to 29 mph as the highway narrows from three to two lanes between interchanges 14 and 13. There is also AM congestion in the opposite direction, but the highway widens and the AM congestion is not considered a problem. Finally, the external radial U.S. 3 in Chelmsford narrows from four to three lanes as it approaches Interchange 32 at the Drum Hill Rotary, causing two hours of PM congestion. Speeds in this segment slow to 40 mph during the PM peak.
Since all the segments with problem congestion during the AM peak were also considered to have problem congestion in the PM peak, the analysis of PM congestion reinforces the regional patterns observed in the AM. A group of six segments associated with I-93, four segments on I‑93 itself and two on Routes 3 and 24 feeding into I-93 from the south, were identified as a north-south AM congestion group. The duration of PM congestion for each segment in this “I‑93 group” exceeds the AM duration.
This completes the selection of radial segments with problem congestion. The ten AM and fourteen PM designated segments will be grouped with the circumferential segments having problem congestion identified in the next section. This selection of regional segments with problem congestion, both radial and circumferential, will then be analyzed for appropriateness for possible preferential lane implementation.
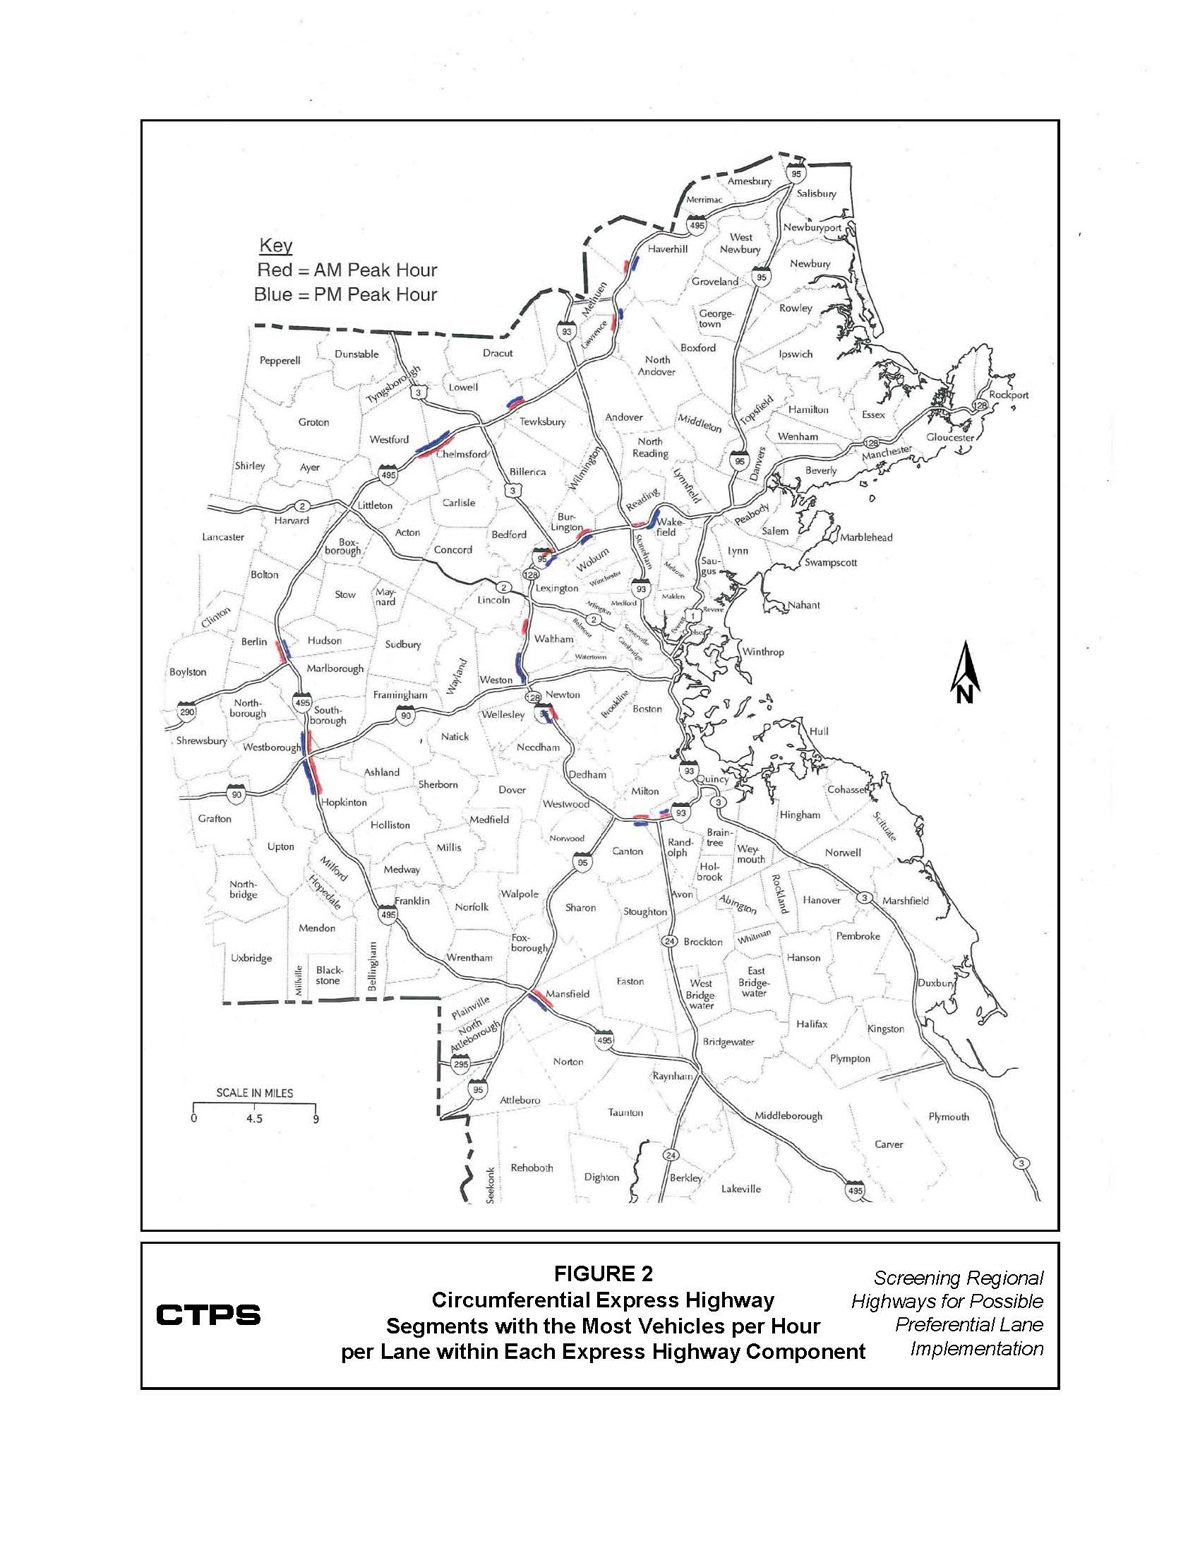
The two regional circumferential expressways have also been divided into components, as shown in Figure 2. The inner circumferential highway is often referred to by its pre- Interstate designation, Route 128. Between the I-95 junction in Peabody and Route 3 in Braintree, this expressway has been divided into seven components. The five northernmost components are part of I-95. In Peabody, I-95 branches from the circumferential corridor and continues north to New Hampshire. Route 128 continues up the North Shore and is considered to be a radial highway in this area. The circumferential segment between the I-95 junction in Peabody and U.S. 1 in Lynnfield is considered to be part of a I-95 (N) to I-93 (N) component. The southernmost two components, between I-95 and Route 24, and between Route 24 and Route 3, are part of I‑93.
The outer circumferential highway, I-495, extends from I-95 in Salisbury near the New Hampshire border to the junction with I-195, a few miles away from the Bourne Bridge and Cape Cod. Between Salisbury and Route 24, I-495 is divided into eight components. The southern end of I-495 between Route 24 in Raynham and the edge of the CTPS model region is treated in this study as a radial segment.
AM peak conditions for the 15 representative circumferential segments are shown in Table 3. The components are grouped by the two circumferential arcs, and arranged from north to south. The first two columns define the endpoints of each component. The exit numbers indicate segments with the highest AM peak hour vehicles per lane within each component. If only one exit is listed, the peak volume occurs within the interchange. Each segment is characterized by the number of lanes and AWDT. Breakdown lanes used during peak periods are counted as having a half-lane of capacity.
The same four measurements of congestion severity are utilized in this analysis as for radial routes. It is necessary, however, to look at peak traffic in both directions at the outset of the analysis. This is because there is no natural “peak” direction along the circumferential routes. The AM and PM peaks may be either north- or southbound, depending on regional travel patterns.
The vehicles per hour per lane are shown for the peak segment for both the higher direction, as well as the opposite direction within the same segment. The value for the peak direction is shaded, and represents the highest vehicles per hour per lane for the entire component, regardless of direction. The other three congestion severity measurements: AWDT per lane, hours congested, and slowest period speed, all refer to traffic moving in the direction of the shaded value.
AWDT per lane on AM peak Route 128 circumferential segments ranges between 24,000 and 27,800 vehicles, comparable to weekday traffic on the inner radial segments in Table 1. On I‑495, AWDT per lane ranges between 14,300 and 22,300 on the AM peak segments.
The circumferential expressway components do not by their nature have an obvious AM “inbound” direction to the urban core. It is possible, however, to observe some peak directional patterns in Table 3 by looking at the paired northbound and southbound peak hour traffic flows. During the AM peak on Route 128, the highest traffic segment for each component north of I-90 is in the southbound direction. Conversely, south of I-90 the highest traffic segments are all northbound. Many vehicle trips combine travel on a circumferential highway with travel on one or more of the radial highways. The fact that the net AM Route 128 traffic flows center on I-90 suggests the centrality of this highway in the regional network.
Without the strong peak period directional flows typical of the radial components, several of the peak circumferential traffic volumes are closely matched by corresponding heavy traffic in the opposite direction. Examples of this on Route 128 during the AM peak include the component between U.S. 3 and Route 2, with1,975 vehicles per hour per lane in the peak direction compared with 1,825 in the opposing direction, and the component between Routes 24 and 3, with 1,800 and 1,750 vehicles per hour per lane in two directions. The components on I-495 between I-93 (N) and U.S. 3 and between U.S. 3 and Route 2 show similar balance by direction. In this analysis, the peak volume segments are chosen and evaluated for congestion severity independent of any congestion conditions that exist in the opposing direction. Congestion conditions that exist in the lower traffic volume direction will be analyzed in conjunction with considering strategies for individual expressway components.
| Table 3 | ||||||||||||||||||||||
| Segments with Highest AM Peak Hour Vehicles per Lane | ||||||||||||||||||||||
| within Each Circumferential Express Highway Component: | ||||||||||||||||||||||
| Selected Statistics with Congestion Problem Flags | ||||||||||||||||||||||
| Measurement of Congestion Severity | ||||||||||||||||||||||
| Vehicles per | Slowest | Congestion | ||||||||||||||||||||
| North | South | Peak Direction | AWDT | Hour per Lane | Hours | Period | Problem | |||||||||||||||
| End | End | Exits | Lanes | AWDT | per Lane | SB | NB | Congested | Speed | Flag | ||||||||||||
| Rt. 128/ | ||||||||||||||||||||||
| I-95/I-93 | ||||||||||||||||||||||
| I-95 (N) | I-93 (N) | 38-37 | 3 | 83,500 | 27,800 | 2,067 | 1,175 | 4.0 | 26 | C | ||||||||||||
| I-93 (N) | U.S. 3 | 34-33 | 4 | 100,000 | 25,000 | 1,938 | 1,575 | 3.0 | 38 | C | ||||||||||||
| U.S. 3 | MA 2 | 32-31 | 4 | 96,000 | 24,000 | 1,975 | 1,825 | 2.5 | 20 | C | ||||||||||||
| MA 2 | I- 90 | 28-27 | 4 | 104,000 | 26,000 | 2,225 | 1,825 | 3.0 | 28 | C | ||||||||||||
| I- 90 | I-95 (S) | 19-20 | 3.5 | 94,000 | 26,900 | 1,886 | 2,314 | 4.0 | 44 | C | ||||||||||||
| I-95 (S) | MA 24 | 4-3 | 3.5 | 97,000 | 27,700 | 1,686 | 2,229 | 4.0 | 30 | C | ||||||||||||
| MA 24 | MA 3 | 5-4 | 4 | 108,000 | 27,000 | 1,750 | 1,800 | 2.0 | 48 | |||||||||||||
| I-495 | ||||||||||||||||||||||
| I-95 (N) | MA 213 | 48 | 3 | 65,000 | 21,700 | 2,017 | 800 | 2.0 | 64 | |||||||||||||
| MA 213 | I-93 (N) | 46-45 | 3 | 56,500 | 18,800 | 1,767 | 883 | 1.0 | 58 | |||||||||||||
| I-93 (N) | U.S. 3 | 38-37 | 3 | 67,000 | 22,300 | 1,867 | 1,733 | 1.5 | 64 | |||||||||||||
| U.S. 3 | MA 2 | 32-33 | 3 | 61,000 | 20,300 | 1,617 | 1,667 | 64 | ||||||||||||||
| MA 2 | I-290 | 26-25 | 3 | 55,500 | 18,500 | 1,700 | 1,367 | 50 | ||||||||||||||
| I-290 | I-90 | 22-23 | 3 | 51,500 | 17,200 | 1,300 | 1,867 | 1.5 | 60 | |||||||||||||
| I-90 | I-95 (S) | 21-22 | 3 | 52,500 | 17,500 | 1,267 | 1,983 | 2.0 | 65 | |||||||||||||
| I-95 (S) | MA 24 | 12-13 | 3 | 43,000 | 14,300 | 1,000 | 1,433 | 65 | ||||||||||||||
| Peak direction | ||||||||||||||||||||||
| is shaded. | ||||||||||||||||||||||
The hours of congestion shown in Table 3 confirm the regional understanding that congestion on Route 128 is severe, with three of the Route 128 components having four hours of AM congestion on their most congested segments. All but one of the AM Route 128 representative segments have been designated as having problem congestion. There is some congestion on I‑495, concentrated in the more urbanized Haverhill-Lawrence-Lowell corridor, and at the junction with I-90. Only near the interchange with I-290 does traffic slow to 50 mph, and no I‑495 segments are considered as having problem AM peak congestion.
The representative segment on the Route 128 circumferential component between Route 3 and Route 24 has 1,800 vehicles per hour per lane heading in the northerly direction, though the highway heads due west at this point. It is congested for two hours each morning, but traffic never slows below 48 mph and this has not been designated as problem congestion during the AM peak. In the opposing direction, however, traffic peaks at 1,750 vehicles per hour per lane, as queues entering the Southeast Expressway back up through the Braintree Split for several hours each morning. Although this segment is not designated as having problem congestion in its stronger direction, possible improvements in this area will be considered upon review of candidate system components.
The representative PM peak segments are shown in Figure 2, together with the AM peak segments. Nine of the fifteen representative PM segments are between the same pair of interchanges as in the AM, but in the opposite direction. In Lowell on I-495 and in Randolph on Route 128, the PM and AM peak segments are the same, including travel in the same direction. On Route 128 in Waltham, both the AM and the PM peak segments flow to the south. The PM peak segments of I-495 in Haverhill and Lawrence, and of I-93 in Wakefield, are in the opposite direction from the AM segment but offset by one interchange.
The PM peak circumferential segments are listed in Table 4, which is organized in the same manner as Table 3. Thirteen of the fifteen segments in Table 4 experience some PM peak congestion, and in eight of these cases the congestion is severe enough to be considered a problem. The five segments with non-problem congestion all have good travel speeds and some remaining capacity for traffic growth.
| Table 4 | ||||||||||||||||||||||
| Segments with Highest PM Peak Hour Vehicles Per Lane | ||||||||||||||||||||||
| within Each Circumferential Express Highway Component: | ||||||||||||||||||||||
| Selected Statistics with Congestion Problem Flags | ||||||||||||||||||||||
| Measurement of Congestion Severity | ||||||||||||||||||||||
| Vehicles per | Slowest | Congestion | ||||||||||||||||||||
| North | South | Peak Direction | AWDT | Hour per Lane | Hours | Period | Problem | |||||||||||||||
| End | End | Exits | Lanes | AWDT | per Lane | SB | NB | Congested | Speed | Flag | ||||||||||||
| Rt. 128/ | ||||||||||||||||||||||
| I-95/I-93 | ||||||||||||||||||||||
| I-95 (N) | I-93 (N) | 38-39 | 3 | 80,000 | 26,700 | 1,833 | 2,067 | 3.5 | 50 | C | ||||||||||||
| I-93 (N) | U.S. 3 | 33-34 | 4 | 102,000 | 25,500 | 1,638 | 1,975 | 3.5 | 46 | C | ||||||||||||
| U.S. 3 | MA 2 | 31-32 | 4 | 100,500 | 25,100 | 1,800 | 1,963 | 3.5 | 28 | C | ||||||||||||
| MA 2 | I- 90 | 26-25 | 4 | 104,000 | 26,000 | 2,025 | 1,825 | 4.0 | 42 | C | ||||||||||||
| I- 90 | I-95 (S) | 20-19 | 3.5 | 94,000 | 26,900 | 2,000 | 1,914 | 4.0 | 36 | C | ||||||||||||
| I-95 (S) | MA 24 | 3-4 | 3.5 | 97,000 | 27,700 | 2,057 | 1,771 | 5.0 | 34 | C | ||||||||||||
| MA 24 | MA 3 | 5-4 | 4 | 108,000 | 27,000 | 1,675 | 1,950 | 3.0 | 42 | C | ||||||||||||
| I-495 | ||||||||||||||||||||||
| I-95 (N) | MA 213 | 48-49 | 3 | 57,500 | 19,200 | 1,083 | 1,800 | 1.0 | 64 | |||||||||||||
| MA 213 | I-93 (N) | 46 | 3 | 62,500 | 20,800 | 917 | 1,867 | 2.5 | 46 | C | ||||||||||||
| I-93 (N) | U.S. 3 | 38-37 | 3 | 67,000 | 22,300 | 1,817 | 1,783 | 2.0 | 62 | |||||||||||||
| U.S. 3 | MA 2 | 33-32 | 3 | 61,000 | 20,300 | 1,767 | 1,650 | 65 | ||||||||||||||
| MA 2 | I-290 | 25-26 | 3 | 57,000 | 19,000 | 1,417 | 1,800 | 1.0 | 65 | |||||||||||||
| I-290 | I-90 | 23-22 | 3 | 52,000 | 17,300 | 1,867 | 1,367 | 2.0 | 52 | |||||||||||||
| I-90 | I-95 (S) | 22-21 | 3 | 53,000 | 17,700 | 2,000 | 1,400 | 2.5 | 60 | |||||||||||||
| I-95 (S) | MA 24 | 13-12 | 3 | 42,000 | 14,000 | 1,367 | 1,083 | 65 | ||||||||||||||
| Peak direction | ||||||||||||||||||||||
| is shaded. | ||||||||||||||||||||||
The eight PM problem locations include all seven Route 128 segments plus the section of I-495 inside Interchange 46 with Route 110 in Methuen. The northbound segment on the Route 128 circumferential component between Routes 3 and 24 experiences two hours of congestion in the AM peak, but with travel speeds of 48 mph, it was not considered a problem during the AM peak. This same segment experiences three hours of congestion and travel speeds of 42 mph during the PM peak and is considered to have a congestion problem during the afternoon.
This completes the selection of circumferential segments with problem congestion, almost all of which are on the Route 128 inner circumferential corridor. The eight circumferential components that have some problem congestion in either direction at some point in the day, together with the fourteen radial components that show some problem congestion, will be evaluated for preferential lane suitability in the next section.
Improving the flow of current or projected traffic at the most congested regional locations requires adding capacity either at the congested location or at a bottleneck downstream of the location. This added capacity can be in the form of an added general-purpose lane, an added preferential lane, or a lane borrowed during peak periods from the opposing traffic flow.
At locations where added capacity would be helpful, adding a general-purpose lane can be expected to improve traffic flow. The potential benefit of either an added preferential lane or a contraflow (usually preferential) lane borrowed from opposing traffic depends upon a number of factors. An initial evaluation presented in this section applies some simple volume and capacity tests for traffic currently using the congested highway segments to assess whether a preferential lane might provide meaningful user benefits as compared with a simple widening.
As in the previous section, AM peak radial problem congestion is discussed first. This initial travel market is used to provide numerical examples and network situations with which to illustrate the calculations and concepts applied throughout the evaluation process. After AM peak radial problem congestion is evaluated, the same evaluation steps are applied to PM peak radial segments and AM and PM peak circumferential segments.
The 26 express highway radial components that were analyzed in Table 1 are presented again in Table 5. All figures are in vehicles per hour per lane, and the data in the first column were also used in Table 1 and were the measure used to select peak segments. The 10 congestion flags from Table 1 are also shown in Table 5. The second column shows the traffic traveling in the opposite, lighter direction of the AM peak segment. The volume in the non-peak direction is critical in determining the viability of a contraflow strategy using a zipper lane.
| Table 5 | ||||||||||||||||||||||||||
| Tests of AM Peak Radial Segments for Preferential Lane Suitability | ||||||||||||||||||||||||||
| All Figures Are Vehicles per Hour per Lane: | ||||||||||||||||||||||||||
| Current Traffic Volumes | ||||||||||||||||||||||||||
| Current Traffic | Traffic with Preferential Lane | |||||||||||||||||||||||||
| Peak Travel Direction | Other Way | Con- | Pref. | Zipper | ||||||||||||||||||||||
| Peak | Other | General | Pref. | Pref. | if Zipper | gestion | Lane | Lane | ||||||||||||||||||
| Location | Direction | Way | Lanes | Lane | Benefit | Lane Lost | Flag | Benefit | OK | |||||||||||||||||
| Inner | ||||||||||||||||||||||||||
| U.S. 1 | Revere | 2,175 | 1,150 | 1,450 | 1,450 | - | 2,300 | C | ||||||||||||||||||
| I-93 (N) | Stoneham | 1,988 | 1,738 | 1,613 | 1,500 | 113 | 2,317 | C | P | |||||||||||||||||
| MA 2* | Lexington | 1,683 | 1,567 | 1,262 | 1,262 | - | 2,350 | |||||||||||||||||||
| I-90 | Newton | 2,000 | 1,817 | 1,500 | 1,500 | ** | 2,725 | C | P | |||||||||||||||||
| I-93 (S) | Boston | 2,075 | 1,475 | 1,700 | 1,500 | 200 | 1,967 | C | P | Z | ||||||||||||||||
| - | ||||||||||||||||||||||||||
| Outer | - | |||||||||||||||||||||||||
| MA 128* | Peabody | 2,000 | 1,875 | 1,333 | 1,333 | - | 3,750 | |||||||||||||||||||
| I-95 (N) | Boxford | 1,363 | 475 | 1,090 | 1,090 | - | 633 | |||||||||||||||||||
| I-93 | Wilmington | 2,050 | 1,313 | 1,675 | 1,500 | 175 | 1,750 | C | P | Z | ||||||||||||||||
| U.S. 3 | Billerica | 2,067 | 1,017 | 1,567 | 1,500 | 67 | 1,525 | C | P | Z | ||||||||||||||||
| MA 2 | Lincoln | 1,500 | 900 | 1,000 | 1,000 | - | 1,800 | |||||||||||||||||||
| I-90 | Weston | 1,800 | 1,667 | 1,350 | 1,350 | - | 2,500 | C | ||||||||||||||||||
| I-95 (S) | Mansfield | 1,967 | 1,017 | 1,475 | 1,475 | - | 1,525 | |||||||||||||||||||
| MA 24 | Randolph | 2,033 | 1,167 | 1,533 | 1,500 | 33 | 1,750 | C | P | Z | ||||||||||||||||
| MA 3 | Braintree | 2,167 | 1,267 | 1,667 | 1,500 | 167 | 1,900 | C | P | Z | ||||||||||||||||
| - | ||||||||||||||||||||||||||
| External | - | |||||||||||||||||||||||||
| I-95 (N) | Salisbury | 1,050 | 625 | 840 | 840 | - | 833 | |||||||||||||||||||
| I-93 | Andover | 2,171 | 917 | 1,742 | 1,500 | 242 | 1,375 | C | P | Z | ||||||||||||||||
| U.S. 3 | Chelmsford | 1,867 | 850 | 1,400 | 1,400 | - | 1,275 | |||||||||||||||||||
| MA 2 | Littleton | 1,800 | 600 | 1,200 | 1,200 | - | 1,200 | |||||||||||||||||||
| I-290* | Northborough | 1,600 | 967 | 1,200 | 1,200 | - | 1,450 | |||||||||||||||||||
| I-90 | Westborough | 1,433 | 733 | 1,075 | 1,075 | - | 1,100 | |||||||||||||||||||
| I-295 | N. Attleboro | 833 | 600 | 625 | 625 | - | 900 | |||||||||||||||||||
| I-95 (S) | Mansfield | 1,967 | 1,217 | 1,475 | 1,475 | - | 1,825 | |||||||||||||||||||
| MA 24 | Raynham | 2,100 | 1,100 | 1,400 | 1,400 | - | 2,200 | |||||||||||||||||||
| MA 140 | Taunton | 900 | 550 | 600 | 600 | - | 1,100 | |||||||||||||||||||
| I-495 | Raynham | 1,550 | 825 | 1,033 | 1,033 | - | 1,650 | |||||||||||||||||||
| MA 3 | Plymouth | 1,500 | 1,150 | 1,000 | 1,000 | - | 2,300 | |||||||||||||||||||
| * | Peak AM traffic on these segments is away from Boston. | |||||||||||||||||||||||||
| ** | Nominal benefit prior to adjustments by regional traffic. | |||||||||||||||||||||||||
Implementation of a preferential lane would reallocate existing traffic within both existing and newly created lanes. The reallocation of existing traffic with implementation of some type of preferential lane is calculated in the group of four columns in Table 5. It is understood that the addition of capacity in the peak direction would also make any express highway segments served by a new preferential lane more attractive to drivers, and some amount of additional traffic would be attracted to the improved express highway component. The calculations underlying Table 5 present a static analysis of current traffic, but still offer a basis for comparison among express highway segments. Estimation of incremental traffic attracted to a highway improved with a preferential lane requires use of the CTPS regional model set, and is not planned as part of this study.
The basic calculation in Table 5 takes the peak hour traffic in the peak direction and recalculates the vehicles per lane assuming one additional lane. This additional, preferential lane is assumed here to allow no more than 1,500 vehicles per hour. Setting eligibility criteria to allow 1,500 vehicles per hour to use the preferential lane will ensure that users of this lane will experience free-flow traffic conditions, and thereby may be more willing to meet the eligibility criteria by forming a carpool or perhaps paying a toll. Critically, the preferential-lane users will only perceive a benefit if traffic in the general-purpose lanes is more than 1,500 vehicles per hour.
The basic preferential lane calculation has been made for all 26 AM radial components in Table 5. The vehicles per lane in the general lanes are all significantly lower than the current peak direction volume per lane, the amount of the decrease depending principally on the number of current lanes. In 18 of the segments, including all 16 segments without problem congestion, the volume in the added preferential lane is the same as in the general traffic lanes, and lower than 1,500 vehicles per lane. In these situations, absent a substantial increase in segment traffic due to the added lane, the preferential lane would function in effect as a general-purpose lane and its specialized design would serve no purpose.
In eight of the 26 AM radial segments, the 1,500-vehicle cap on preferential lane traffic is effected, with traffic in the general-purpose lanes equal to or exceeding 1,500 vehicles per hour in this static analysis. The difference between the 1,500 vehicles in a preferential lane and the number of vehicles per hour calculated for the general-purpose lanes is shown in the next column as a preferential lane benefit.
These eight segments are flagged at the right with a “P,” and all but two of the segments with the congestion flag also are designated with a preferential lane benefit flag. On U.S. 1 in Revere, 4,300 vehicles per hour severely congest two lanes during the AM peak hour with 2,175 vehicles per lane. Three lanes comfortably accommodate this amount of traffic with 1,450 vehicles per lane. On I-90 in Weston, a fourth lane would serve as storage within the queue approaching the Weston toll plaza and would accommodate only 1,350 vehicles per hour.
The preferential lane benefit as calculated in Table 5 ranges up to 242 fewer vehicles per hour compared with the associated general-purpose lanes. This preferential lane advantage would upon implementation become greater as additional traffic was attracted to the improved highway segments. While the equilibrium traffic level in the general-purpose lanes might at some time during a peak period reach the level it had prior to implementing the preferential lane, these peak traffic levels would be reached later and subside earlier in the peak period because of the availability of the additional 1,500-vehicles-per-hour capacity in the preferential lane. This fulfills the requirement of this study that all users benefit from the implementation of a preferential lane. The general-purpose lanes would have less, but still some congestion. The preferential-lane users would have no congestion at all.
A preferential lane can be added to a section of highway by constructing a new lane, usually in the median of a divided highway. In certain situations, a preferential lane might be added by “borrowing” a lane from the off-peak direction for the duration of a peak period. In this contraflow strategy, the assessment of benefits in the peak direction is unchanged. It is necessary, however, to determine whether the off-peak direction is able to function adequately with the loss of a lane during a peak period.
It is a given that taking a lane from the off-peak direction will substantially increase the vehicles per hour per lane in that direction, and implementation of a contraflow lane would be a deviation from the assumption of this study that all users should benefit from a preferential lane implementation. This study does, however, calculate the burden on opposing traffic that would result from implementing a contraflow lane in segments where a preferential lane could be beneficial. This study defines a cutoff point for each segment and uses this cutoff point as an indication of feasibility.
The rightmost of the four evaluation columns calculates the vehicles per lane if the current traffic designated as “other way” were to be funneled somehow into one fewer lanes. Interstate 93 in Stoneham near the top of Table 5 presents a clear example. This eight-lane highway segment has four lanes in each direction and carries 1,988 vehicles per lane in the peak direction but only 1,738 per lane going the other way, a total of 6,950 for the entire four-lane outbound barrel. Giving up a lane in the off-peak direction for use in the peak direction would allow only three lanes, each carrying 2,317 vehicles during the AM peak hour. Not only is 2,317 vehicles per hour per lane almost impossible, but 2,317 vehicles per lane is worse than the 1,988 vehicles per lane in the peak direction that the contraflow lane would be ameliorating. As a consequence, an AM zipper lane implementation in this segment is not considered feasible.
The peak direction vehicles per hour per lane serves as the feasibility cutoff point for each segment. The resulting vehicles per lane in the direction giving up a lane cannot be greater than the vehicles per lane of the peak direction which is to be improved. The inner radial I-93 (S) is the first segment receiving a “Z” for zipper lane feasibility. Traffic in the inbound peak direction would drop from 2,075 vehicles per lane to 1,700 vehicles per lane with 1,500 vehicles using a zipper preferential lane in the peak direction. Traffic going in the opposite direction would lose a lane and go from 1,475 vehicles per lane to 1,967, but since 1,967 vehicles per lane is less than 2,075, this segment is given the “Z” designation. Even though traffic in the off-peak direction has been squeezed, the maximum number of vehicles per lane in this segment has been marginally reduced.
Using this benchmark to establish zipper lane feasibility, only segments with strong peak period directionality emerge as candidates for zipper lane implementation. Six of the eight congested segments where preferential lanes offer benefits are also considered appropriate for a zipper lane, given the criterion used in this study. Implementing a contraflow strategy that appreciably increases traffic congestion in the off-peak direction would have public policy implications which are not considered here.
The 26 representative radial segments for the PM peak are shown in Table 6. These are the same segments that were analyzed in Table 2, and Table 6 incorporates the same capacity tests that were applied in Table 5. Fourteen of these segments have been designated as having problem congestion, as compared with the ten problem congestion locations during the AM peak. This reflects the generally higher level of traffic during the PM peak as compared with the AM peak.
Ten of these fourteen locations have traffic levels sufficiently high that a preferential lane with 1,500 vehicles per hour would be less congested than the general travel lanes, and are designated with a “P.” The four congested segments that are eliminated by this test, U.S. 1 in Revere, Route 128 in Peabody, Route 2 in Lincoln, and Route 24 in Raynham, all have only two lanes in the peak direction. If a fifth, reversible lane were incorporated into a four-lane highway with two lanes in each direction, the 50 percent capacity increase in the peak direction would be so great that there would need to be substantial traffic growth before 1,500 vehicles would be reached in the reversible lane with the general-purpose lanes carrying sufficiently more than that amount to preserve the advantage of the reversible lane. In fact, widening three of these locations, U.S. 1 in Revere, Route 128 in Peabody, and Route 24 in Raynham, to six general-purpose lanes is under some level of active consideration, and this is an approach that would offer immediate user benefits as compared with adding a single reversible lane.
Of the ten locations designated as offering a preferential lane benefit, three show only nominal improvements in the static analysis, but would be expected to offer preferential-lane users meaningful benefits as traffic adapted to use the improved express highway component. Interstate 95 (S) in Norwood easily accommodates 2,033 vehicles per lane at 56 mph during the PM peak, and is not considered to have a congestion problem, even if a preferential lane would have 33 fewer vehicles per hour than the general-purpose lanes.
The external radial, I-93 in Andover, offers the greatest predicted benefit for preferential-lane users: 185 fewer vehicles per hour prior to regional traffic adjustment. This segment utilizes a peak period “managed” lane, or use of the breakdown lane, and the segment is assumed in these calculations to offer an equivalent of 3.5 general-purpose lanes. Were the breakdown lane to be upgraded to a full travel lane during the PM peak, a preferential lane in this segment would not offer benefits over the general-purpose lanes. AM peak traffic in this segment, however—analyzed in Table 5—is heavier, and even with a full fourth inbound lane, a preferential lane would offer users a benefit during the AM peak.
| Table 6 | ||||||||||||||||||||||||||
| Tests of PM Peak Radial Segments for Preferential Lane Suitability | ||||||||||||||||||||||||||
| All Figures Are Vehicles per Hour per Lane: | ||||||||||||||||||||||||||
| Current Traffic Volumes | ||||||||||||||||||||||||||
| Current Traffic | Traffic with Preferential Lane | |||||||||||||||||||||||||
| Peak Travel Direction | Other Way | Con- | Pref. | Zipper | ||||||||||||||||||||||
| Peak | Other | General | Pref. | Pref. | if Zipper | gestion | Lane | Lane | ||||||||||||||||||
| Location | Direction | Way | Lanes | Lane | Benefit | Lane Lost | Flag | Benefit | OK | |||||||||||||||||
| Inner | ||||||||||||||||||||||||||
| U.S. 1 | Revere | 2,150 | 1,300 | 1,433 | 1,433 | - | 2,600 | C | ||||||||||||||||||
| I-93 (N) | Stoneham | 1,900 | 1,850 | 1,525 | 1,500 | 25 | 2,467 | C | P | |||||||||||||||||
| MA 2* | Lexington | 1,583 | 1,233 | 1,188 | 1,188 | - | 1,850 | |||||||||||||||||||
| I-90 | Newton | 2,000 | 1,733 | 1,500 | 1,500 | ** | 2,600 | C | P | |||||||||||||||||
| I-93 (S) | Boston | 1,950 | 1,325 | 1,575 | 1,500 | 75 | 1,767 | C | P | Z | ||||||||||||||||
| Outer | ||||||||||||||||||||||||||
| MA 128* | Peabody | 2,150 | 2,050 | 1,433 | 1,433 | - | 4,100 | C | ||||||||||||||||||
| I-95 (N) | Boxford | 1,250 | 638 | 1,000 | 1,000 | - | 850 | |||||||||||||||||||
| I-93 | Wilmington | 2,050 | 1,525 | 1,675 | 1,500 | 175 | 2,033 | C | P | Z | ||||||||||||||||
| U.S. 3 | Billerica | 2,033 | 1,067 | 1,533 | 1,500 | 33 | 1,600 | C | P | Z | ||||||||||||||||
| MA 2 | Lincoln | 1,200 | 1,000 | 800 | 800 | - | 2,000 | C | ||||||||||||||||||
| I-90 | Weston | 2,067 | 1,600 | 1,567 | 1,500 | 67 | 2,400 | C | P | |||||||||||||||||
| I-95 (S) | Norwood | 2,033 | 1,033 | 1,533 | 1,500 | 33 | 1,550 | |||||||||||||||||||
| MA 24 | Randolph | 2,000 | 1,367 | 1,500 | 1,500 | ** | 2,050 | C | P | |||||||||||||||||
| MA 3 | Braintree | 2,133 | 1,567 | 1,633 | 1,500 | 133 | 2,350 | C | P | |||||||||||||||||
| External | ||||||||||||||||||||||||||
| I-95 (N) | Salisbury | 1,150 | 788 | 920 | 920 | - | 1,050 | |||||||||||||||||||
| I-93 | Andover | 2,114 | 1,233 | 1,685 | 1,500 | 185 | 1,850 | C | P | Z | ||||||||||||||||
| U.S. 3 | Chelmsford | 2,000 | 1,050 | 1,500 | 1,500 | ** | 1,575 | C | P | Z | ||||||||||||||||
| MA 2 | Littleton | 1,550 | 850 | 1,033 | 1,033 | - | 1,700 | |||||||||||||||||||
| I-290* | Northborough | 1,567 | 1,000 | 1,175 | 1,175 | - | 1,500 | |||||||||||||||||||
| I-90 | Westborough | 1,600 | 1,067 | 1,200 | 1,200 | - | 1,600 | |||||||||||||||||||
| I-295 | N. Attleboro | 1,000 | 800 | 750 | 750 | - | 1,200 | |||||||||||||||||||
| I-95 (S) | Mansfield | 1,967 | 1,333 | 1,475 | 1,475 | - | 2,000 | |||||||||||||||||||
| MA 24 | Raynham | 1,950 | 1,200 | 1,300 | 1,300 | - | 2,400 | C | ||||||||||||||||||
| MA 140 | Taunton | 1,050 | 725 | 700 | 700 | - | 1,450 | |||||||||||||||||||
| I-495 | Raynham | 1,625 | 1,000 | 1,083 | 1,083 | - | 2,000 | |||||||||||||||||||
| MA 3 | Plymouth | 1,850 | 1,400 | 1,233 | 1,233 | - | 2,800 | |||||||||||||||||||
| * | Peak PM traffic on these segments is away from Boston. | |||||||||||||||||||||||||
| ** | Nominal benefit prior to adjustments by regional traffic. | |||||||||||||||||||||||||
Five of the ten segments where a PM preferential could be beneficial meet the feasibility test used in this study for contraflow lane implementation. Interstate 93 south of downtown Boston is an important example in the PM peak, as it is in the AM peak. This segment, north of the end of the currently operating zipper lane, has a strong directional imbalance: 1,950 vehicles per hour per lane outbound in the PM peak compared with only 1,325 vehicles per lane inbound. Extending the zipper lane north into this segment would reduce outbound traffic to 1,575 vehicles per general-purpose lane, a significant improvement. Inbound traffic would be concentrated into three lanes with 1,767 vehicles per lane, which would be under the 1,950 feasibility threshold assumed for this segment.
The same capacity tests applied to the radial segments are used in evaluating the circumferential segments. Table 7 presents the fifteen circumferential segments that were presented in Table 3, arranged from the northernmost to the southernmost segment, first for the inner Route 128/I-95/I-93 circumferential highway, and then for the outer I-495 circumferential highway. The current vehicles per hour per lane for the south- and northbound directions that appear in Table 3 are repeated as the first two data columns in Table 7. The congestion flags on Table 3 also appear in Table 7. No I-495 segments were flagged as having problem congestion.
The AM peak direction in each circumferential component has been shaded, and the capacity evaluation calculations are applied to the shaded, peak direction volumes. Redistributing existing traffic shows that the general purpose lanes would still carry significantly more traffic than a preferential lane on each of the six Route 128 segments that has been designated as having problem congestion. Adaptation by regional traffic would further increase the preferential lane advantages.
The two Route 128 components between I-90 and Route 24 utilize so-called managed lanes over all or most of their length, allowing peak period use of breakdown lanes in both directions. Managed lanes are considered here to have a practical capacity equal to one-half a lane, and the segments are calculated as having 3.5 lanes in each direction. The managed lanes, extending south from the Route 9 interchange, are being reconstructed as full travel lanes. Even with fully-built fourth travel lanes, preferential lanes in these segments would still offer some advantage over the general-purpose lanes.
In only one instance could a contraflow lane be feasible. The peak congested segment on the northernmost component of Route 128 is between I-93 and Route 28 in Reading. This segment has three lanes in the peak southbound direction, but four lanes in the northbound direction. Utilizing one of these four lanes for southbound traffic during the AM peak would result in 1,567 vehicles in each northbound lane, significantly below the 2,067 vehicles currently in each southbound lane. At no other circumferential location could an AM contraflow preferential lane be considered, because there is heavy traffic in both directions at all the other circumferential locations, and no other segment would be able to spare a lane during the peak period.
| Table 7 | ||||||||||||||||||||||
| Tests of AM Peak Circumferencial Segments for Preferential Lane Suitability | ||||||||||||||||||||||
| All Figures are Vehicles per Hour per Lane: | ||||||||||||||||||||||
| Current Traffic Volumes | ||||||||||||||||||||||
| Current Traffic | Traffic with Preferential Lane | |||||||||||||||||||||
| Peak Travel Direction | Other Way | Con- | Pref. | Zipper | ||||||||||||||||||
| North | South | General | Pref. | Pref. | if Zipper | gestion | Lane | Lane | ||||||||||||||
| End | End | SB | NB | Lanes | Lane | Benefit | Lane Lost | Flag | Benefit | OK | ||||||||||||
| Rt. 128/ | ||||||||||||||||||||||
| I-95/I-93 | ||||||||||||||||||||||
| U.S. 1 | I-93 (N) | 2,067 | 1,175 | 1,567 | 1,500 | 67 | 1,567 | C | P | Z | ||||||||||||
| I-93 (N) | U.S. 3 | 1,938 | 1,575 | 1,563 | 1,500 | 63 | 2,100 | C | P | |||||||||||||
| U.S. 3 | MA 2 | 1,975 | 1,825 | 1,600 | 1,500 | 100 | 2,433 | C | P | |||||||||||||
| MA 2 | I- 90 | 2,225 | 1,825 | 1,850 | 1,500 | 350 | 2,433 | C | P | |||||||||||||
| I- 90 | I-95 (S) | 1,886 | 2,314 | 1,886 | 1,500 | 386 | 2,640 | C | P | |||||||||||||
| I-95 (S) | MA 24 | 1,686 | 2,229 | 1,800 | 1,500 | 300 | 2,360 | C | P | |||||||||||||
| MA 24 | MA 3 | 1,750 | 1,800 | 1,440 | 1,440 | - | 2,333 | |||||||||||||||
| I-495 | ||||||||||||||||||||||
| I-95 (N) | MA 213 | 2,017 | 800 | 1,517 | 1,500 | 17 | 1,200 | |||||||||||||||
| MA 213 | I-93 | 1,767 | 883 | 1,325 | 1,325 | - | 1,325 | |||||||||||||||
| I-93 | U.S. 3 | 1,867 | 1,733 | 1,400 | 1,400 | - | 2,600 | |||||||||||||||
| U.S. 3 | MA 2 | 1,617 | 1,667 | 1,250 | 1,250 | - | 2,425 | |||||||||||||||
| MA 2 | I-290 | 1,700 | 1,367 | 1,275 | 1,275 | - | 2,050 | |||||||||||||||
| I-290 | I-90 | 1,300 | 1,867 | 1,400 | 1,400 | - | 1,950 | |||||||||||||||
| I-90 | I-95 (S) | 1,267 | 1,983 | 1,487 | 1,487 | - | 1,900 | |||||||||||||||
| I-95 (S) | MA 24 | 1,000 | 1,433 | 1,075 | 1,075 | - | 1,500 | |||||||||||||||
| Peak direction | ||||||||||||||||||||||
| is shaded. | ||||||||||||||||||||||
The capacity tests for the fifteen PM peak circumferential segments are shown in Table 8. A total of eight segments have been designated as having problem congestion during the PM peak: all seven of the Route 128 segments and the I-495 segment at Route 110 in Methuen. PM peak traffic is actually lower than AM traffic in a number of locations as congestion backs up traffic between the closely spaced Route 128 interchanges. Congested conditions in the PM peak tend to last longer than during the AM peak.
All of the Route 128 segments show significant benefits for preferential-lane users, but none of these segments would be appropriate for contraflow implementation. The segment between Route 3 and Route 24 shows both a congestion problem and a preferential lane benefit during the PM that it did not show during the AM due to an AM directional traffic balance unique to that segment.
The express highway segments so far identified where a preferential lane would offer user benefits are summarized in Table 9 and shown graphically in Figure 3. Table 9 combines the traffic data of the candidate radial and circumferential segments in a common format, varying only the formats of component designation and travel direction.
The segments are arranged differently than in the previous tables. The segments are grouped by highway regardless of time period, and are generally presented from north to south. The I-93 group leads the list of radial components, with twelve candidate segments starting with I-93 in Methuen and extending south to Route 24 at its interchange with I-93 in Randolph. The I-93 group is followed by three segments of U.S. 3 in Chelmsford and Billerica, and I-90 in Weston and Newton.
| Table 8 | ||||||||||||||||||||||
| Tests of PM Peak Circumferencial Segments for Preferential Lane Suitability | ||||||||||||||||||||||
| All Figures are Vehicles per Hour per Lane: | ||||||||||||||||||||||
| Current Traffic Volumes | ||||||||||||||||||||||
| Current Traffic | Traffic with Preferential Lane | |||||||||||||||||||||
| Peak Travel Direction | Other Way | Con- | Pref. | Zipper | ||||||||||||||||||
| North | South | General | Pref. | Pref. | if Zipper | gestion | Lane | Lane | ||||||||||||||
| End | End | SB | NB | Lanes | Lane | Benefit | Lane Lost | Flag | Benefit | OK | ||||||||||||
| Rt. 128/ | ||||||||||||||||||||||
| I-95/I-93 | ||||||||||||||||||||||
| U.S. 1 | I-93 (N) | 1,833 | 2,067 | 1,567 | 1,500 | 67 | 2,750 | C | P | |||||||||||||
| I-93 (N) | U.S. 3 | 1,638 | 1,975 | 1,600 | 1,500 | 100 | 2,183 | C | P | |||||||||||||
| U.S. 3 | MA 2 | 1,800 | 1,963 | 1,588 | 1,500 | 88 | 2,400 | C | P | |||||||||||||
| MA 2 | I- 90 | 2,025 | 1,825 | 1,650 | 1,500 | 150 | 2,433 | C | P | |||||||||||||
| I- 90 | I-95 (S) | 2,000 | 1,914 | 1,571 | 1,500 | 71 | 2,680 | C | P | |||||||||||||
| I-95 (S) | MA 24 | 2,057 | 1,771 | 1,629 | 1,500 | 129 | 2,479 | C | P | |||||||||||||
| MA 24 | MA 3 | 1,675 | 1,950 | 1,575 | 1,500 | 75 | 2,233 | C | P | |||||||||||||
| I-495 | ||||||||||||||||||||||
| I-95 (N) | MA 213 | 1,083 | 1,800 | 1,350 | 1,350 | - | 1,625 | |||||||||||||||
| MA 213 | I-93 | 917 | 1,867 | 1,400 | 1,400 | - | 1,376 | C | ||||||||||||||
| I-93 | U.S. 3 | 1,817 | 1,783 | 1,363 | 1,363 | - | 2,675 | |||||||||||||||
| U.S. 3 | MA 2 | 1,767 | 1,650 | 1,325 | 1,325 | - | 2,475 | |||||||||||||||
| MA 2 | I-290 | 1,417 | 1,800 | 1,350 | 1,350 | - | 2,126 | |||||||||||||||
| I-290 | I-90 | 1,867 | 1,367 | 1,400 | 1,400 | - | 2,051 | |||||||||||||||
| I-90 | I-95 (S) | 2,000 | 1,400 | 1,500 | 1,500 | - | 2,100 | |||||||||||||||
| I-95 (S) | MA 24 | 1,367 | 1,083 | 1,025 | 1,025 | - | 1,625 | |||||||||||||||
| Peak direction | ||||||||||||||||||||||
| is shaded. | ||||||||||||||||||||||
| Table 9 | ||||||||||||||||||||||||||||||||||||||||||||||||
| Representative Segments Where a Preferential Lane Would Offer Benefits | ||||||||||||||||||||||||||||||||||||||||||||||||
| All Figures are Vehicles per Hour per Lane Unless Noted Otherwise: | ||||||||||||||||||||||||||||||||||||||||||||||||
| Current Traffic Volumes | ||||||||||||||||||||||||||||||||||||||||||||||||
| Other Way | Congestion Severity | |||||||||||||||||||||||||||||||||||||||||||||||
| Peak | Other | Peak with | if Zipper | AWDT | ||||||||||||||||||||||||||||||||||||||||||||
| Exits | Lanes | Time | Direction | Way | Pref. Lane | Lane Lost | per Lane | Hours | Speed | |||||||||||||||||||||||||||||||||||||||
| Radial Components | ||||||||||||||||||||||||||||||||||||||||||||||||
| I-93 (N) | Andover | 46-45 | 3.5 | AM | 2,171 | 917 | 1,742 | 1,375 | 22,800 | 3.0 | 54 | |||||||||||||||||||||||||||||||||||||
| I-93 (N) | Andover | 45-46 | 3.5 | PM | 2,114 | 1,233 | 1,685 | 1,850 | 23,000 | 3.5 | 22 | |||||||||||||||||||||||||||||||||||||
| I-93 (N) | Wilmington | 39-38 | 4 | AM | 2,050 | 1,313 | 1,675 | 1,750 | 22,500 | 2.5 | 48 | |||||||||||||||||||||||||||||||||||||
| I-93 (N) | Wilmington | 38-39 | 4 | PM | 2,050 | 1,525 | 1,675 | 2,033 | 22,800 | 3.5 | 56 | |||||||||||||||||||||||||||||||||||||
| I-93 (N) | Stoneham | 36-35 | 4 | AM | 1,988 | 1,738 | 1,613 | 25,000 | 1.5 | 40 | ||||||||||||||||||||||||||||||||||||||
| I-93 (N) | Stoneham | 35-36 | 4 | PM | 1,900 | 1,850 | 1,525 | 25,500 | 3.5 | 34 | ||||||||||||||||||||||||||||||||||||||
| I-93 (S) | Boston | 15-16 | 4 | AM | 2,075 | 1,475 | 1,700 | 1,967 | 27,900 | 4.0 | 20 | |||||||||||||||||||||||||||||||||||||
| I-93 (S) | Boston | 15-13 | 4 | PM | 1,950 | 1,325 | 1,575 | 1,767 | 27,000 | 5.0 | 35 | |||||||||||||||||||||||||||||||||||||
| MA 3 | Braintree | 17-19 | 3 | AM | 2,167 | 1,267 | 1,667 | 1,900 | 26,700 | 3.0 | 20 | |||||||||||||||||||||||||||||||||||||
| MA 3 | Braintree | 19-17 | 3 | PM | 2,133 | 1,567 | 1,633 | 26,300 | 5.0 | 16 | ||||||||||||||||||||||||||||||||||||||
| MA 24 | Randolph | 20-21 | 3 | AM | 2,033 | 1,167 | 1,533 | 1,750 | 23,300 | 2.5 | 28 | |||||||||||||||||||||||||||||||||||||
| MA 24 | Randolph | 21-20 | 3 | PM | 2,000 | 1,367 | 1,500 | 23,300 | 3.0 | 46 | ||||||||||||||||||||||||||||||||||||||
| U.S. 3 | Chelmsford | 31-32 | 3 | PM | 2,000 | 1,050 | 1,500 | 1,575 | 18,000 | 2.0 | 40 | |||||||||||||||||||||||||||||||||||||
| U.S. 3 | Billerica | 28-29 | 3 | PM | 2,033 | 1,067 | 1,533 | 1,600 | 18,700 | 2.5 | 58 | |||||||||||||||||||||||||||||||||||||
| U.S. 3 | Billerica | 28-27 | 3 | AM | 2,067 | 1,017 | 1,567 | 1,525 | 18,500 | 3.0 | 42 | |||||||||||||||||||||||||||||||||||||
| I-90 | Weston | 14-13 | 3 | PM | 2,067 | 1,600 | 1,567 | 24,300 | 3.0 | 42 | ||||||||||||||||||||||||||||||||||||||
| I-90 | Newton | 16-17 | 3 | AM | 2,000 | 1,817 | 1,500 | 24,300 | 2.5 | 26 | ||||||||||||||||||||||||||||||||||||||
| I-90 | Newton | 17-16 | 3 | PM | 2,000 | 1,733 | 1,500 | 23,700 | 3.0 | 36 | ||||||||||||||||||||||||||||||||||||||
| Route 128 Components | ||||||||||||||||||||||||||||||||||||||||||||||||
| north end | south end | SB | NB | |||||||||||||||||||||||||||||||||||||||||||||
| I-95 (N) | I-93 (N) | 38-37 | 3 | AM | 2,067 | 1,175 | 1,567 | 1,567 | 27,800 | 4.0 | 26 | |||||||||||||||||||||||||||||||||||||
| I-95 (N) | I-93 (N) | 38-39 | 3 | PM | 1,833 | 2,067 | 1,567 | 26,700 | 3.5 | 50 | ||||||||||||||||||||||||||||||||||||||
| I-93 (N) | U.S. 3 | 34-33 | 4 | AM | 1,938 | 1,575 | 1,563 | 25,000 | 3.0 | 38 | ||||||||||||||||||||||||||||||||||||||
| I-93 (N) | U.S. 3 | 33-34 | 4 | PM | 1,638 | 1,975 | 1,600 | 25,500 | 3.5 | 46 | ||||||||||||||||||||||||||||||||||||||
| U.S. 3 | MA 2 | 32-31 | 4 | AM | 1,975 | 1,825 | 1,600 | 24,000 | 2.5 | 20 | ||||||||||||||||||||||||||||||||||||||
| U.S. 3 | MA 2 | 31-32 | 4 | PM | 1,800 | 1,963 | 1,588 | 25,100 | 3.5 | 28 | ||||||||||||||||||||||||||||||||||||||
| MA 2 | I- 90 | 28-27 | 4 | AM | 2,225 | 1,825 | 1,850 | 26,000 | 3.0 | 28 | ||||||||||||||||||||||||||||||||||||||
| MA 2 | I- 90 | 26-25 | 4 | PM | 2,025 | 1,825 | 1,650 | 26,000 | 4.0 | 42 | ||||||||||||||||||||||||||||||||||||||
| I- 90 | I-95 (S) | 19-20 | 3.5 | AM | 1,886 | 2,314 | 1,886 | 26,900 | 4.0 | 44 | ||||||||||||||||||||||||||||||||||||||
| I- 90 | I-95 (S) | 20-19 | 3.5 | PM | 2,000 | 1,914 | 1,571 | 26,900 | 4.0 | 36 | ||||||||||||||||||||||||||||||||||||||
| I-95 (S) | MA 24 | 4-3 | 3.5 | AM | 1,686 | 2,229 | 1,800 | 27,700 | 4.0 | 30 | ||||||||||||||||||||||||||||||||||||||
| I-95 (S) | MA 24 | 3-4 | 3.5 | PM | 2,057 | 1,771 | 1,629 | 27,700 | 5.0 | 34 | ||||||||||||||||||||||||||||||||||||||
| MA 24 | MA 3 | 5-4 | 4 | PM | 1,675 | 1,950 | 1,575 | 27,000 | 3.0 | 42 | ||||||||||||||||||||||||||||||||||||||
| Peak direction is shaded. | ||||||||||||||||||||||||||||||||||||||||||||||||
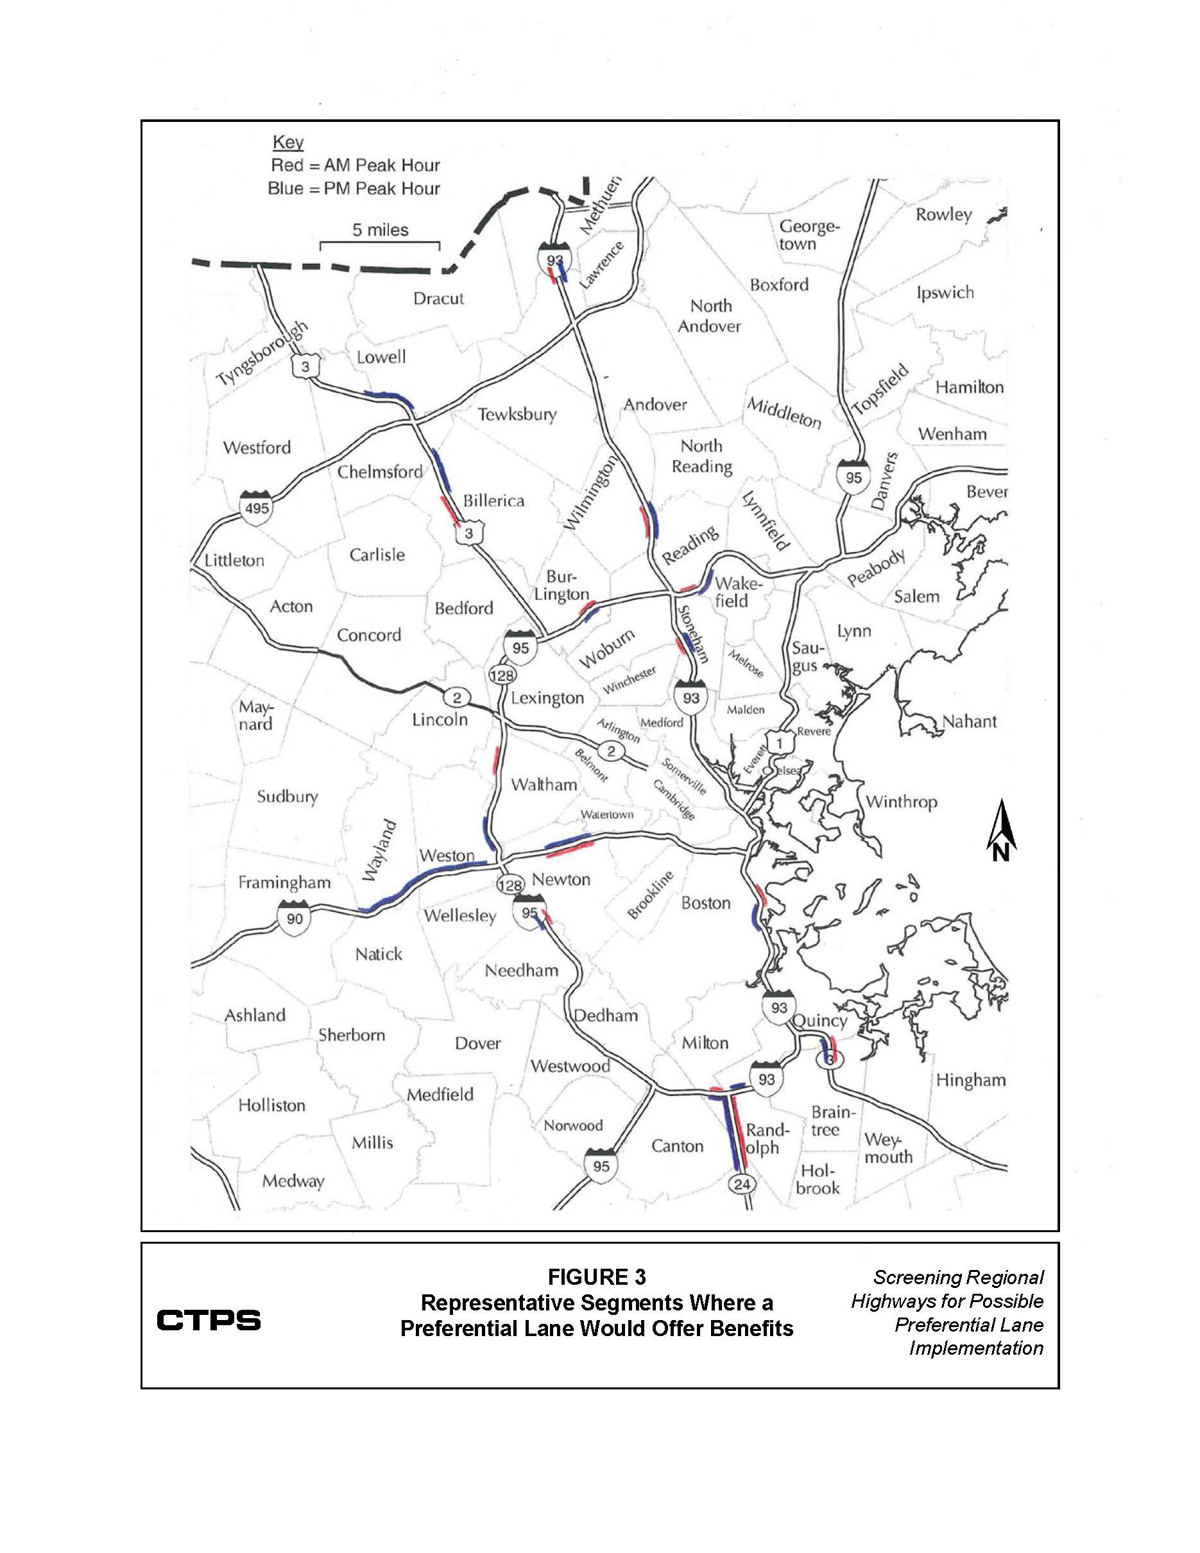
All Route 128 circumferential components are included on this list, while none of the I-495 components met the criteria for inclusion. The peak direction for the Route 128 segments is indicated by shading. For the radial components, all AM peak segments are toward Boston, and all PM peak segments are away from Boston.
The capacity test outcomes are also summarized in Table 9. Peak direction traffic with a preferential lane always equals or exceeds 1,500 vehicles per lane with existing traffic, which implies that preferential-lane users would have an advantage over traffic in the general-purpose lanes. Any segment where a contraflow lane is feasible shows the volume per lane in the off-peak direction if a zipper lane were taken for peak direction use. In every instance, this volume is less than the original peak direction volume, which has been used as the zipper lane feasibility cutoff point.
The study began with a group of 82 of the most heavily used express highway segments in eastern Massachusetts, representing 41 express highway system components during both the AM and PM peak periods. The 31 segments emerging from the screening process depicted on Figure 3 show a strong north-south complex of congestion extending from New Hampshire to Randolph primarily along I-93, Route 128, and several connecting highway segments.
The representative segments were used to compare express highway system components from the entire region, but at this point the analysis begins to concern itself with the entire component represented by each selected segment. Problem congestion on a component is not usually confined to the representative segment. Also, the development of a successful preferential lane hinges upon such practical matters as workable configurations at end points, good locations for entry/exit sections, and connections with other express highway components at major interchanges.
The candidate components emerging from the initial screen are shown graphically in Figure 4. In this section each candidate component is discussed individually, with a special emphasis on proposed improvements to the component or related parts of the express highway system. This is important because envisioned improvements or reconstruction still early enough in the planning process can be designed to anticipate the possibility of a useful preferential lane being implemented at some point. Also, changes and improvements to the express highway system can influence the expected user benefits of a preferential lane, and need to be considered in this phase of the evaluation.
This review of individual components follows roughly the segments as listed in Table 9. The discussion will also suggest which segments within each component would logically be included within an extended regional preferential lane system. This suggested system will be described primarily by its extent and connectivity. Specific design features may be generally described, but a more complete planning and design analysis will not be undertaken until a later planning effort. Also, while the purpose of this study is to identify preferential lane opportunities, instances will be identified where adding a general-purpose lane is a more straightforward solution to congestion in a given segment.
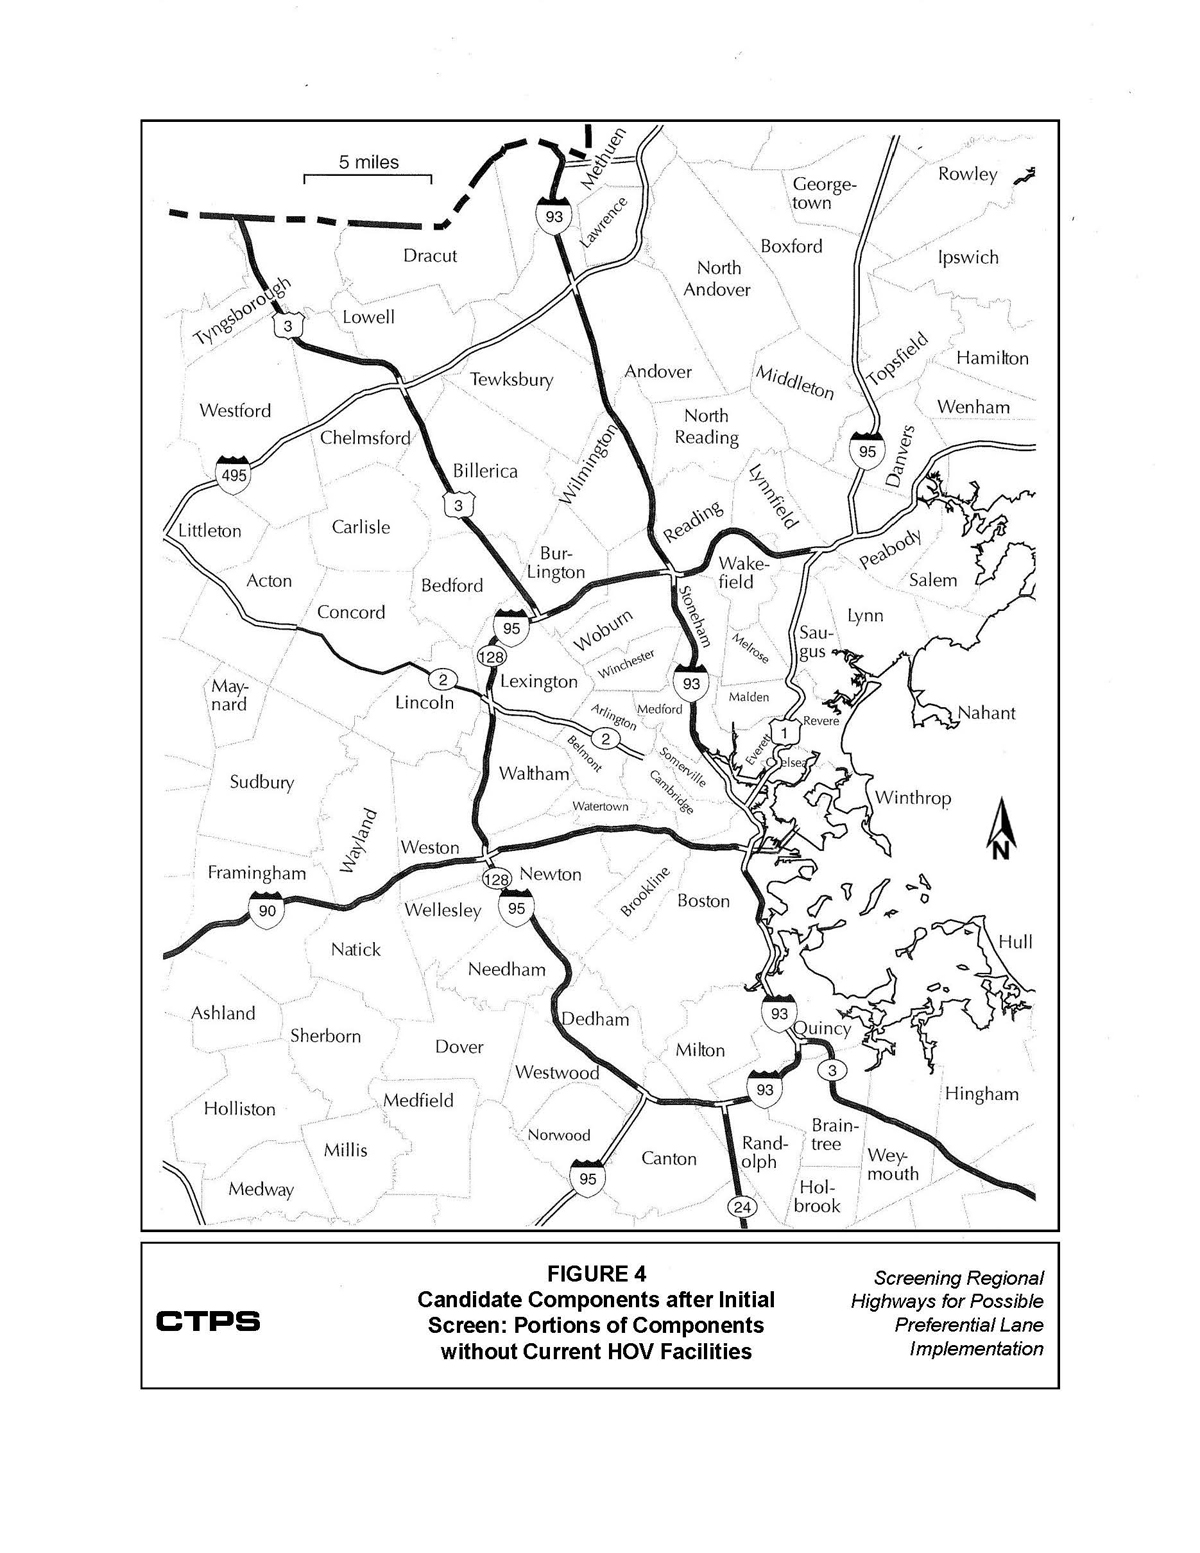
The I-93 external radial component extends from the New Hampshire state line to I-495 and has four intermediate interchanges. There are three lanes in each direction at the state line, which is supplemented by collector-distributor (CD) lanes in each direction serving the two northernmost interchanges at the limited-access Route 213 and the nearby Interchange 47 at Pelham Street. At the southern merge of the CD lanes into the main barrels, the three-lane main barrels are supplemented during peak periods by allowed use of the breakdown lanes. This three-lane-plus-managed-lane configuration continues south past the end of the component at I-495 and two interchanges into the next component, widening into a full four lanes in each direction south of Interchange 42, Dascomb Road.
The representative segment of this external radial is between interchanges 46 and 45 where I-93 crosses the Merrimack River between Methuen and Andover. The nearest bridge to this I-93 crossing is Route 28 in downtown Lawrence, over two miles away. Consequently, this segment also functions much as a major urban arterial, with a sizeable amount of local traffic crossing the Merrimack River. Congestion in this segment is particularly severe during the PM peak, as northbound traffic trying to exit at Interchange 46 to Routes 110 and 113 backs up onto the interstate. The mixing of heavy exiting and through traffic reduces travel speeds in this segment to 22 mph, a condition that would not be improved by upgrading the managed lane.
A major widening of I-93 in New Hampshire is currently underway: in southern New Hampshire, the four-lane section north of Interchange 1 is presently being widened to six lanes. When U.S. 3 was widened from four to six lanes ten years ago, traffic growth increased on U.S. 3 and paused on I-93. Widening I-93 in New Hampshire would be expected to attract some of this traffic back to I-93.
Another planned improvement is reconstruction of the problematic Interchange 46. The new design will be a partial cloverleaf, allowing two northbound exit ramps to accommodate the 2,000 northbound vehicles per hour exiting during the PM peak. Despite planned traffic signals on Routes 110 and 113, ramp queuing back to the main barrels should be mostly eliminated.
A logical northern terminus of a reversible preferential lane in the I-93 median might be at the southern end of the collector-distributor lane system, over two miles north of Interchange 46. Currently, this segment north of Interchange 46 has three lanes in each direction, with the breakdown lane used in the peak direction. This would allow the robust CD-plus-main-barrel lane system to connect with an increased-capacity main-barrel-plus-preferential-lane system. Implementing a preferential lane here would increase capacity even in a minimal configuration of three general traffic lanes and no breakdown lane use, since 1,500 vehicles per hour in the peak direction in the preferential lane would still represent an expansion in capacity compared with current use of the breakdown lane. In this minimal configuration, relative benefits for preferential-lane users would be substantial, while there would still be some benefits for users in the general-purpose lanes.
It is important to consider, however, the potential benefits of a preferential lane if I-93 were to be upgraded to four full lanes each direction. The benefit calculations in Table 9 are based on 3.5 lanes during peak periods, an approximation of current conditions with use of the breakdown lane. With four full lanes, the general-purpose lanes in the representative segment south of Interchange 46 would carry 1,525 vehicles per hour during the AM peak, assuming current traffic. This implies a preferential lane advantage that would only be increased by the expanded capacity in the representative segment and also by I-93 widening in New Hampshire. During the PM peak hour, current traffic is 7,400, or 1,480 per lane. The added general-purpose and preferential lane capacity in Massachusetts and New Hampshire would easily be expected to increase the PM peak hour to well above 7,500, thereby making the fifth, preferential lane advantageous at its 1,500-vehicle limit.
These capacity scenarios are all dependent on use of the I-93 bridge over the Merrimack River. The bridge is currently configured as a flat deck, about 138 feet from curb to curb with a concrete median. It currently operates with three lanes in each direction plus the managed lanes. In this configuration it has width to spare and could accommodate four lanes and breakdown lanes in each direction if the highway were improved north and south of the bridge. A reversible preferential lane could also be accommodated with four lanes in each direction if the breakdown lanes on the bridge were given up, and the preferential lane were reduced to 20 feet from a more customary 24 feet.
The analysis of the I-93 external radial indicates that the benefit of implementing a preferential lane can be realized independently of any program to upgrade the managed lanes to full fourth lanes. This will also be found to be the case on the I-93 outer radial south of I-495. As part of the planned widening of I-93 in New Hampshire, there has been some consideration of implementing a high-quality bus service between Manchester, New Hampshire, and Boston. One option being evaluated is referred to as “bus-on-shoulder.” The reversible preferential lanes suggested in this study with use limited to no more than 1,500 vehicles per hour would allow buses to operate at the speed limit. If bus-on-shoulder were implemented on I-93 in New Hampshire, intercity and other buses would easily be able to gain entry to a preferential lane beginning south of the Route 213 CD system.
Any envisioned plans for widening I-93 would have important consequences for design of a future preferential lane system. These potential consequences need to be considered whether the entire managed lane system is being upgraded, both in the external radial and outer radial components, or an individual interchange is being constructed or reconstructed. The placement of bridge supports and abutments is of obvious concern if a reversible lane in the median is envisioned for the future. Upgrading the managed lanes to full-function fourth lanes with standard breakdown lanes can also impact future reversible lane construction, especially if a portion of the median is incorporated into the widened main barrels.
The I-93 outer radial component extends from I-495 to the I-95/Route 128 inner circumferential highway. The managed lanes become full fourth lanes south of Dascomb Road/Interchange 42, and the representative segment is in the eight-lane section between interchanges 39 and 38 in Wilmington, two interchanges north of I-95/Route 128. In the managed lane section north of Interchange 41, I-93 has about one-eighth less peak hour traffic than it does between Interchanges 39 and 38, so the vehicles per lane is about the same, assuming a practical capacity of a half lane for the managed lane.
A new interchange, referred to as the “Tri-Town” interchange, is planned for the I-93 stretch between Dascomb Road and Route 125. This interchange would be located approximately where Andover, Tewksbury, and Wilmington meet, and would offer a high level of service to a well-defined group of industrial parcels in the immediate area. Designs for the Tri-Town interchange assume upgrading the managed lanes to full fourth lanes north to Dascomb Road. The upgrade of the managed lanes could be expected to relieve congestion somewhat on this one segment, which would be partially offset by additional traffic generated by improved access to the Tri-Town site.
The Tri-Town interchange will require construction of one or more viaduct structures above the widened I-93. The placement of bridge supports will determine the types of preferential lane options available for future implementation, at least over the lifetime of the bridge.
The I-93 outer radial component ends at its junction with three of the other most heavily traveled express highway components in the region. The I-93/I-95 interchange in Woburn is the busiest interchange in New England, carrying over 375,000 vehicles per day. Several connecting ramps experience severe peak period congestion, and active planning is underway to improve the function of this key interchange. The currently preferred proposals would add or expand selected ramps, but would not require reconstruction of the I-93 overpass. The I-93 overpass over I-95 is over 160 feet wide and should be able to accommodate a preferential lane connecting the I-93 (north) outer and inner radial components.
For the purposes of this study, the northside I-93 inner radial component extends from the I‑93/I‑95 interchange in Woburn to the beginning of the southbound HOV lane at the Medford/Somerville line just south of Exit 20 to Mystic Avenue. Interstate 93 has four lanes in each direction throughout this section of roadway, and the representative segment is between interchanges 36 and 35 in Stoneham, south of Montvale Avenue.
While no improvements or modifications to this component are currently envisioned, it is noteworthy that this express highway component was the site of the recently completed bridge replacement project, referred to as the “Fast 14” because of the innovative compressed-in-time construction techniques employed. Seven I-93 overpasses in this area were considered to be a total of fourteen bridges, seven in each direction. Each weekend a zipper lane was set up to combine both directions of traffic into one four-lane barrel, two lanes each way. This allowed expedited bridge replacement to take place at a pace of one bridge per weekend.
The successful Fast 14 project has two implications for this study. The highway capacity analysis suggests that a zipper lane should not be implemented in this component because the peak period traffic flows are not sufficiently imbalanced and the off-peak direction would be too severely impacted. Were traffic flows to change or different feasibility standards be adopted, the Fast 14 project demonstrated that a zipper lane could be operated in this area (although weekend traffic patterns needed to adapt significantly). This type of moveable barrier system requires the availability of sections of highway with geometry allowing for barrier machine setup and traffic crossover operations, and the project showed operational feasibility in this area.
Secondly, the seven reconstructed overpass pairs are now new, and any major reconstruction in the near term would likely be largely unwarranted. Implementation of a reversible lane situated between the two main barrels would likely entail developing a design that utilizes to the fullest extent possible the bridges in their recently rebuilt configuration.
The Boston Region express highway system does not at this time have an extensive system of preferential lanes. Those currently in use are located either on or connected to I-93 in Boston or in the immediately adjoining municipalities to the north and south. All are operated today as HOV lanes with a 2+ occupant eligibility requirement. Each of these facilities was either built or improved as part of the CA/T Project. This study assumes retention or expansion of each of these existing facilities as part of any long-term preferential lane strategy.
The southbound HOV lane on I-93 in Somerville and the Charlestown neighborhood of Boston was opened in 1974 shortly after the section of I-93 between Medford and the old elevated Central Artery was opened. The lane was lengthened twice, and by 1979 the HOV lane entrance was near Sullivan Square in Charlestown. It extended south to the junction with U.S. 1 coming from the Tobin Bridge. At that point two lanes of I-93 general traffic joined with the HOV lane and two lanes of U.S. 1 traffic, all of which combined into three general-purpose lanes, crossed over the Charles River, and continued onto the elevated Central Artery and the connecting ramps to and from Storrow Drive. Indeed, the constrained Charles River Crossing was one of the reasons for the CA/T Project as well as the related Central Artery-North Area (CANA) Project.
In conjunction with the construction of the CA/T Project, the I-93 (north) HOV lane was improved in two ways. It was extended northwards and now begins at the Medford/Somerville line, more than a mile before its earlier entrance at Sullivan Square. At the south end, the lane now ends immediately before the Zakim Bridge, and HOV lane traffic flows into its own general-traffic lane rather than needing to merge. This lane is restricted to 2+ occupant HOVs between 6 and 10 AM weekdays, and is available to general traffic at other times.
There are no HOV facilities within the CA/T tunnel system. In addition to widening the main barrels of I-93, the CA/T Project reduced or eliminated traffic weaving by the design and placement of on- and off-ramps throughout the project area. This study does not consider any preferential lane options for the underground portions of I-93.
South of the underground portion of I-93, the CA/T Project built several new HOV facilities. An adjoining pair of HOV lanes extends from Kneeland Street and the South Station bus terminal south about a mile through the South End neighborhood of Boston, at which point these lanes join with an eight-lane section of the pre-existing Southeast Expressway. In addition, vehicles using this facility in either direction can turn onto an HOV lane which travels under the Fort Point Channel and merges with the main travel lanes at the entrance to the Ted Williams Tunnel. A westbound HOV-only exit from I-90 under the Fort Point Channel leads to the South Station bus terminal and is used almost exclusively by buses. All these facilities are presently restricted to 2+ occupant HOVs at all times.
The southside I-93 inner radial component extends from I-90—the Massachusetts Turnpike—to the Braintree Split, a section of express highway commonly known for the most part as the Southeast Expressway. This component divides into three parts for the purposes of preferential lane planning. At its northern end is the pair of HOV lanes extending about a mile south of the Turnpike, which were built as part of the CA/T Project. These HOV lanes join with an eight-lane section of pre-existing Southeast Expressway that extends roughly two miles from the South Bay area south of downtown Boston to the Savin Hill neighborhood in Dorchester.
At Savin Hill the roadway meets a second HOV facility: the peak period contraflow zipper lane through Dorchester, Milton, and Quincy. The zipper lane allows a fifth lane in the peak direction during the AM and PM peaks. This lane is limited to 2+ occupant HOVs, and the Southeast Expressway reverts to four lanes in each direction during off-peak periods. The representative segments of this component are located at Columbia Road, Interchange 15, near the midpoint of the two-mile gap between the two HOV subsystems.
Adding some kind of preferential lane to connect the two existing HOV facilities of this component has long been viewed as an intuitively attractive improvement that could benefit one of the most congested sections of highway in the region. The CTPS report, Improving the Southeast Expressway: A Conceptual Plan (February 2012), presents at a planning level of detail an approach to completing the preferential lane system of this component. The South Coast Rail study, being undertaken by MassDOT, will also present some options for completing this HOV system, as well as an option to provide a bus lane connecting the Southeast Expressway to Route 24. Both of these studies assume continued operation of the moveable-barrier zipper lane.
At Braintree the Southeast Expressway joins two important regional expressway system components, the outer radial Route 3 to the South Shore, and the southernmost component of the Route 128/I-95/I-93 circumferential highway. Route 3 has three lanes in each direction for the first three segments south of the Braintree split, and has two fully-built lanes and a managed lane each way between interchanges 16 in Weymouth and 12 in Pembroke. It is mostly two lanes each way south of Pembroke.
The representative segment of Route 3 is between interchanges 19 and 17 in Braintree—the Burgin Parkway and Union Street interchanges—and is adjacent to the Red Line and Old Colony tracks. Widening the Route 3 right-of-way in this area could necessitate a combination of rail line relocation, residential land taking, and wetlands encroachment, as well as overpass reconstruction.
A number of studies have been undertaken by the Boston MPO and MassDOT to identify possible improvements to this northernmost section of Route 3, as well as the Braintree split ramp system. The CTPS report, I-93/Southeast Expressway/Route 3 (Braintree Split) Operational Assessment and Potential Improvements (March 2006), developed a number of traffic engineering and infrastructure improvements that taken together would meaningfully improve performance of this highway nexus.
One element of these proposed improvements would be to convert the breakdown lanes between interchanges 19 and 17 to travel lanes that would function as auxiliary lanes while adding much needed capacity in this area. This improvement could be done within the existing right-of-way, and MassDOT is currently developing plans to implement this lane addition. Such planning entails some reconstruction of the roadway drainage system.
The static highway capacity analysis used in this study suggests that were there to be four lanes in each direction between Burgin Parkway and Union Street, this would offer sufficient capacity during both the AM and PM peak periods. The additional lanes would be an important improvement, especially by allowing more northbound traffic to enter at Union Street during the AM peak and better accommodate the 18% of traffic destined for the Burgin Parkway exit, which includes vehicles destined for the Quincy Adams Red Line station parking garage.
Unfortunately, much of the traffic in this segment during the AM peak period is in a slow moving queue waiting to enter the Southeast Expressway. Adding a fourth lane would serve this queue solely as storage, and not meaningfully shorten the time required to reach the southern entrance of the Southeast Expressway zipper lane.
A contraflow zipper lane might be set up during the AM peak only, allowing five inbound lanes and three outbound lanes. This fifth, preferential lane would allow eligible vehicles to bypass the queue, allowing considerable time savings to vehicles meeting the entrance criteria. The northbound zipper lane entrance would be located where highway geometry allows barrier machine setup and traffic crossover operations.
A zipper lane is not recommended for the PM peak. After widening from three to four lanes approaching Union Street from the north, adding a fifth, preferential lane would result in 1,280 vehicles per lane, assuming current volumes, and would not offer any advantage to preferential-lane users. South of Union Street, adding a fourth, preferential lane would offer an advantage to preferential-lane users, but the reduction of PM inbound lanes from three to two in this segment would not be acceptable. If a crossover and operations area were set up to operate an AM zipper lane, these facilities could also be utilized during the PM if circumstances changed.
Implementation of a zipper lane on Route 3 would be accompanied by improvements to the connecting ramps in the Braintree Split. Any barrier machine operations area at the north end should be designed to allow vehicles to move freely either to the Southeast Expressway zipper lane or toward the west on the Route 128/I-95/I-93 circumferential route.
The circumferential corridor component connecting with the Southeast Expressway at the Braintree Split is actually designated as I-93. I-93 is a major north-south highway for most of its length, but at this point it travels in an east-west direction about six miles to its origin at a junction with I-95 in Canton. About half way to I-95, I-93 meets Route 24 at a T-configured interchange that is the northern terminus of Route 24 in Randolph. The traffic statistics for the representative segment appear on the bottom line in Table 9, but this circumferential component is discussed here as the next component in the closely-associated I-93 Group.
The component between the Braintree Split and Route 24 has four lanes in each direction, and there is land within the right-of-way to utilize if considering a preferential lane. A challenge is that both interchanges have T-configurations, and the main travel barrels approaching both interchanges from all three travel directions split the main barrel between the two directional choices, both of which carry substantial volumes of traffic at all time periods. One cannot assume that a useful preferential lane in this area will simply be a barrier-separated lane adjacent to the existing left lanes.
The congestion problems in this component are more serious than suggested by the initial screen, and some preferential lane implementation in this component clearly merits consideration. Because of the design of the two interchanges and the need for users of these lanes to also use the Southeast Expressway zipper lane facility, a preferential lane concept in this area will likely involve the addition of lanes within the Braintree Split and possibly one or more short viaducts. Similar improvements are probably required at the Route 24 interchange.
The 2006 Braintree Split CTPS report recommended consideration of a fifth westbound general-purpose lane in this area, and MassDOT has broadened the analysis to include consideration of fully-separated collector-distributor lanes. The South Coast Rail study is evaluating a bus-only lane in the I-93 median and viaducts to cross the two interchanges as well as to serve the Logan Express terminal off Route 37 in Braintree.
The last I-93 Group component is on Route 24, and the representative segment is immediately south of I-93. This component has three lanes and a grass median between I-93 and I-495. A reversible preferential lane would provide user benefits for at least some portion of this component. A bus-only option in this area is being evaluated by the South Coast Rail study.
Three segments of U.S. 3 appear in Table 9 and represent both of its components. U.S. 3 has an external component extending from New Hampshire to I-495 that has one congested segment outbound to be considered for a preferential lane during the PM peak period. Its other Massachusetts component extends from I-495 to Route 128 and has both an AM and a PM segment being evaluated. U.S. 3 ends at Route 128 as a partially built cloverleaf. When the highway first was built in the 1950s it was planned to extend inside Route 128, but that extension was later cancelled.
The original configuration of U.S. 3 had two lanes in each direction. Between the years 2000 and 2005, U.S. 3 in Massachusetts was completely rebuilt, including all bridges, to a minimum of three lanes in each direction. There was a fourth lane each way in the segment south of the Lowell Connector, and a pair of two-lane CDs serving all the ramps for I-495 and Route 110, Interchanges 30 and 31 in Chelmsford. U.S. 3 in New Hampshire is a toll road, the Everett Turnpike, and it was widened to three lanes in each direction in the 1990s. These improvements to U.S. 3 resulted in a pause in traffic growth on I-93. Possible improvements to I-93 could be expected to slow traffic growth on U.S. 3, at least temporarily.
The U.S. 3 external radial extends from I-495 to the New Hampshire state line. Problem congestion was identified during the PM peak in the northbound segment between Route 110, Interchange 31, and Route 4 at the Drum Hill Rotary, Interchange 32. This is the segment in which the two-lane CD ramp ends, delivering all its traffic into the three main barrel lanes.
The easiest solution to this congestion would be to simply add a fourth lane between the CD merge and the Drum Hill exit. Stedman Street crosses over U.S. 3 in this segment and the new bridge abutments are spaced to allow the addition of a fourth lane, as is the case throughout the U.S. 3 reconstruction. Given that this instance of congestion is isolated, a limited lane addition seems to be more appropriate than implementing a preferential lane.
South of I-495, the U.S. 3 outer radial component has a representative segment with problem congestion in each direction emanating north and south from Interchange 28, Treble Cove Road. Traffic entering southbound at Treble Cove Road in the AM peak hour results in problem congestion conditions for this component, as does northbound traffic entering here in the PM peak.
The reconstructed bridges can accommodate a fourth lane in each direction, but the newly constructed bridge supports in the median would preclude adding a reversible lane in the median unless these new bridges were to be rebuilt yet again. A zipper lane would be compatible with the current bridge designs and would offer a traffic flow benefit with an acceptable impact on roadway segments where a lane would be lost.
Zipper lanes, however, have certain drawbacks such as operating costs and, usually, limited lane width. If this component were to be configured for zipper lane operation, the roadway surface might be widened to allow a wider zipper lane to be set up with a breakdown lane. Given the relative isolation of these segments, and the drawbacks of zipper lanes, this component is not being recommended for inclusion in a regional preferential lane system at this time. If congestion in this component is considered a serious problem in the future, widening to four lanes in each direction or implementing a zipper lane would be options.
The outer radial component of I-90, the Massachusetts Turnpike, extends east from I-495, Interchange 11A, to the Weston toll plazas, Interchanges 14 and 15 at Route 128. The representative segment of this component is the easternmost segment between Interchange 13 connecting with Route 30 and serving Natick and Framingham, and the Weston toll plazas.
The segment west of the Weston tolls has congestion problems both in the AM and PM peaks. The AM peak inbound segment was not selected as a candidate preferential lane location in the initial screen because it would merely have added a lane of storage to the slow moving queue approaching the Weston toll plazas, and would not have increased the overall capacity of the component. Implementing a reversible preferential lane for the PM outbound peak would make the reversible lane available for use during the AM inbound peak. This option is discussed below.
The simplest solution for westbound PM peak congestion would be to extend the four-lane section all the way to Interchange 13. There are already four westbound lanes for about a third of the distance to Interchange 13. Land is available to extend the four-lane section, and some of the bridges can already accept a fourth lane. Were a reversible preferential lane to be built in this segment, it would require more widening than just adding a single fourth lane and would necessitate reconstruction of almost all the bridges.
The ramp system at the Weston toll plazas is extensive. Interchange 15 is the eastern toll barrier of the Turnpike, allowing traffic to go to and from the Turnpike Extension, which extends inside of Route 128. A pair of ramps connects with the main barrels more than one-half mile west of Interchange 15 and brings traffic to the associated Interchange 14, which serves traffic to and from Route 128. Traffic volumes using these two interchanges are roughly equivalent, and any reversible lane should have an entry/exit section allowing access to Interchange 14.
Ideally, a reversible lane could extend east from the Interchange 14 entry/exit section all the way to the main barrel tolls. This would allow AM inbound preferential lane traffic to bypass the queue approaching the barrier tolls at the entrance to the Turnpike Extension. Clearly, there could be no cash transactions permitted in the preferential lane. There would then be three classes of vehicles served at this toll plaza: cash users, Fast Lane users, and “Faster Lane” users. While this might present some interesting business possibilities to MassDOT, it is beyond the scope of this study. Also, with growth of transponder use and technological advances in open-road tolling, it is hoped that the problem of toll plaza-related queuing will gradually solve itself. While the potential for a successful preferential lane stretching west from the Weston toll plaza is acknowledged here, in light of the operational uncertainties and evident costs, it will not be brought forward as an element of a regional preferential lane system.
On the Turnpike Extension, the representative segment is between Interchange 16 at West Newton—the first interchange east of Weston—and Interchange 17 at Newton Corner. In this inner radial component, there is problem congestion both in the AM inbound and the PM outbound. Traffic in the off-peak direction is so strong that contraflow zipper lanes should not be considered. Adding a reversible lane in this segment would add much-needed capacity while allowing full connectivity at Weston and requiring no modification of toll operations. Unfortunately, there is very little land in the corridor that could be utilized for any type of improvement.
The challenges of this segment are apparent over its two-mile length. At points it has only three lanes in each direction without a breakdown lane. For most of its length there is a breakdown lane only on one side. Only for short distances are there breakdown lanes on both sides. Physical impediments to widening the highway include the Worcester/Framingham MBTA commuter rail line, several tall earth retaining walls, abutting commercial properties, virtually all bridge abutments, and a supermarket constructed as an air rights development.
Valuable improvements to this segment could include completion of a uniform set of breakdown lanes, adding general-purpose lanes, or implementation of a reversible preferential lane. Each of these options would require significant widening of the highway, and would entail significant expense and the resolution of important institutional issues. Because of the cost and difficulty of such improvements, this component will not be brought forward as an element of a regional preferential lane system.
Between Newton Corner and Interchanges 18, 19, and 20 at Allston, the Turnpike Extension is four lanes in each direction. The eastbound entrance from Newton Corner adds a lane, and one westbound lane drops at the Newton Corner exit. The westbound exit ramp has two lanes, but the intersection at the top of the ramp cannot accommodate PM peak traffic volumes, and a queue forms which extends back into the main barrel traffic lanes, causing severe congestion for all westbound traffic. A westbound entrance at Newton Corner into the three-lane segment further exacerbates congestion both east and west of Newton Corner.
Inbound during the PM peak period, traffic east of Newton Corner is sufficiently light that one of the four inbound lanes could be borrowed for use as a fifth, preferential outbound lane. The barrier-transfer machine and crossover area would need to be located to the west of the Newton Corner exit to allow preferential-lane users to bypass the exiting queue. It would also need to allow a full three eastbound lanes during the PM peak throughout the Newton Corner segments, and would entail significant reconfiguration of I-90 in the vicinity of Newton Corner. Given the probable construction impacts at Newton Corner, a zipper lane east of Newton Corner is not being proposed as an element of a regional preferential lane system, although its potential benefits are acknowledged.
All the components of the Route 128/I-95/I-93 inner circumferential corridor were brought forward from the initial screen to be considered in this step of the evaluation. These components, showing the AM or PM peak conditions on their representative segments, are shown in the lower part of Table 9 and are arranged from north to south. The southernmost component between Route 24 and the Southeast Expressway has already been discussed at part of the I-93 Group.
The first circumferential component listed in Table 9 is between I-95 (north) and I-93 (north). The southern end of this component is the I-93/I-95 interchange in Woburn, the most heavily traveled interchange in the region. Designated as Interchange 37 on I-95, this component connects with the I-93 outer and inner radial components, and flows into the next circumferential component between I-93 and U.S. 3 (north). Significant improvements to the I-93/I-95 interchange are in the planning stage, and aspects of these improvements related to development of an I-93 preferential lane system were discussed earlier.
The planned improvements to the I-93/I-95 interchange include adding lanes in this component east of the improved interchange. The three-lane southbound segment between Interchange 38, Route 28, and I-93 would be widened to four lanes. This segment already has four lanes in the northbound direction, and a fourth lane is planned for the next two segments to Interchange 40 at Route 129. The southbound segment and the first of the two northbound segments proposed for widening are the representative segments for this component, and appear in Table 9.
These proposed lane additions are considered integral to the I-93/I-95 interchange improvement effort, and would be undertaken as early action items in all alternatives currently under evaluation. The bridges of this component were designed in their most recent reconstruction to accept a fourth lane in each direction, which facilitates widening on a segment-by-segment basis as traffic conditions warrant.
After the currently proposed lane additions are implemented, there will still be congestion on the remaining three-lane segments. Adding a reversible preferential lane in the remaining three-lane segments would entail bridge modification and land acquisition, and would result in only a modest advantage to the preferential lane user given present traffic conditions. In view of the planned lane additions and the current bridge configurations, incremental lane additions in this part of Route 128 are considered preferable, and this component will be removed from consideration for preferential lane implementation.
Between the I-93/I-95 interchange in Woburn and the interchange with Route 24 at the southern end of the I-93 Group in Randolph, the Route 128/I-95/I-93 circumferential highway divides into five components. Peak period traffic is heavy in both directions on each of these five components, and a zipper lane or any other plan that sets up a preferential lane by reducing general-purpose capacity in the opposite direction should not be considered.
There are currently four lanes in each direction on this highway between I-93 and Route 9, south of I-90. Between Route 9 and Route 24, there are three lanes in each direction with use of the breakdown lanes allowed in both directions during peak periods. All of these managed lanes are currently being upgraded to fully-built fourth lanes together with newly constructed breakdown lanes. This study assumes four lanes to be the practical maximum for an express highway main barrel, with the exception of preferential lane entry/exit sections.
Another characteristic of these five circumferential components is that the maximum congestion travel direction on each representative segment results from regional travel patterns rather than the simpler radial pattern of an AM inbound peak and a PM outbound peak. This study looks primarily at the potential benefits of implementing a reversible preferential lane in the direction with the most severe congestion. It is possible, however, that a two-way pair of preferential lanes, such as were constructed on I-93 at the southernmost section of the CA/T Project, could offer meaningful benefits to traffic in the less congested direction of a component as well.
The component between I-93 (north) and U.S. 3 (north) —five-plus miles long—does have a pronounced daily directional pattern. During the AM peak, there is significantly more traffic southbound than northbound. During the PM peak northbound traffic is heavier. A reversible preferential lane in this component would provide valuable added capacity. As shown in Table 9, traffic in the general-purpose lanes would be reduced during the AM and PM peaks to 1,563 and 1,600 vehicles per hour per lane respectively, assuming current traffic levels. These numbers would increase due to both short-term regional traffic adjustment and long-term regional traffic growth. Users of the preferential lane capped at 1,500 vehicles per hour per lane would realize a significant and increasing travel advantage.
Implementing this improvement would not be easy. Building a reversible lane centered on the existing median would require complete reconstruction of the highway and expansion of more than five miles of right-of-way. The entry/exit sections would be simple ten-lane highway sections, but their construction would still entail major rebuilding. Most of the abutting property is commercial. At one point there is residential property on one side of the highway, and a small street on the other. At another point there is residential property on both sides of the highway. Mitigating the reconstruction and right-of-way challenges somewhat, the main barrels are at the same elevation, which simplifies reconstructing the median and associated bridges to accommodate the reversible lane. Also, the directly abutting commercial property is often just parking.
The preferential lane itself would be designed so that optimally positioned entry/exit sections could allow connection to intersecting express highways. A potential north entry/exit to/from the preferential lane would be of sufficient distance from the improved I‑93/I-95 interchange to allow use of all interchange ramps by preferential-lane users. As such, the preferential lane would not interfere with the design or construction of the interchange or associated improvements.
This component should be considered for inclusion as part of a long-range regional preferential lane system. A full cost-benefit analysis is beyond the scope of this study, but a few preliminary observations are appropriate. First, congestion is severe on this section of highway and can be expected to gradually worsen. A reversible preferential lane would improve travel for general-purpose traffic, allow free-flow conditions for preferential-lane users, and allow for future growth. Second, this is arguably the last plausible expansion of this highway, although requiring some taking of private land at the edge of the current right-of-way. Finally, cost-effective suburb-to-suburb shared ride or minibus services have long eluded public and private providers. Highway paths that offer a travel time advantage could serve as backbones for such services.
The next component in the Route 128 corridor comprises three segments extending south 4.5 miles to Route 2. As is the case with its neighboring component to the north, AM peak congestion is greater in the southbound direction, and PM congestion is greater northbound. The northernmost segment between U.S. 3 and Interchange 31, Routes 4 and 225, is the representative segment for both the AM and PM peaks.
As shown in Table 9, peak direction traffic volumes and preferential traffic advantages are similar in this segment compared with its northerly neighbor. Traffic is heavier in the opposite direction in this component, however, and some weaker direction congestion is experienced. With current traffic volumes, congestion in the weaker direction is not severe enough to justify a two-way preferential lane system, and this study does not recommend two-way preferential lanes at any location. Building a reversible preferential lane would require widening the right-of-way, and were such a step to be taken, a larger widening to accommodate a two-way system in anticipation of future growth could be considered.
This component is recommended for inclusion in a regional preferential lane system for the same reasons as its northerly neighbor. It would provide significant benefits to both preferential-lane users and general traffic, it is the last road widening that might practically be envisioned, and it could offer a high level of service to shared-ride and minibus operators. Another advantage of recommending a preferential lane for this component is that it could be designed, and probably built, in conjunction with its preferential lanes in neighboring components, thereby offering users a more complete preferential lane system.
Because this component is so short, it might best be served with only one entry/exit section, located perhaps in its central segment of the three segments. The central segment is the longest of the three, stretching over two miles from Interchange 31, Routes 4 and 225, to Interchange 30, Route 2A. Reversible lanes would then be constructed to the north and south from this ten-lane entry/exit section, and would extend through the interchanges with routes U.S. 3 to the north and Route 2 to the south. Traffic on Route 128 using both U.S. 3 and Route 2 would need to use the general-purpose lanes. The destinations available to vehicles entering at Route 2 and using the preferential lane northbound would be beyond U.S. 3, and would depend on the eventual system design. Conversely, the destinations available to vehicles entering at U.S. 3 and using the preferential lane southbound would be beyond Route 2. The placement of preferential lane entry/exit sections is outside the scope of this study, but this component illustrates one of the planning issues that would be addressed in any follow-on study.
As Route 128 enters the next component immediately south of Route 2, southbound AM peak traffic is still greater than northbound traffic. Between 7 and 8 AM, 7,250 vehicles on Route 128 approach Interchange 29 with Route 2 from the north over all four lanes. At Route 2 there is a net increase of 1,150 vehicles during that hour, and an additional 500 vehicles join at Interchange 28, Trapelo Road, making a total of 8,900 vehicles per hour, or 2,225 per hour per lane. This is the highest vehicles-per-hour-per-lane figure for a four-lane segment that appears in Table 9.
At Interchange 27, serving Winter Street and Totten Pond Road, 1,700 vehicles exit southbound each hour between 7 AM and 9 AM. This part of Waltham has one of the highest concentrations of regional employment outside of downtown Boston, for which Interchange 27 provides the connection to the regional express highway system.
A preferential lane from the north could extend past Route 2 and Trapelo Road and then enter a ten-lane entry/exit section. The southbound rightmost lane would drop at Interchange 27, with a corresponding fifth lane being added in the northbound direction. Route 128 would continue south under Interchange 27 in its current eight-lane configuration. This would allow commuters entering Route 128 north of Route 2A, including those from U.S. 3 and I-93, to use all or part of the preferential lane system on their daily commute to and from one of the numerous employers served by Interchange 27.
Interchange 27 serves as a type of midpoint to the Route 128/I-95/I-93 corridor. As shown in Figure 3, the heaviest traffic for both the AM and PM peak hours takes place in the southbound direction. Southbound and northbound traffic are roughly equal over the entire day, but the southbound direction experiences sharper hourly peaks during both the AM and PM peak periods. During the PM peak hour, 1,400 vehicles enter southbound at Interchange 27, and there is a net increase of about 100 vehicles per hour at Interchange 26, U.S. 20. The segment between U.S. 20 and I-90, Interchange 25, is the representative PM segment for this component, with 8,100 total vehicles per hour, or 2,025 vehicles per hour per lane.
Figure 3 does not highlight the less severe northbound peak segments, but their locations illustrate regional travel patterns. During the AM peak hour, there are 8,200 vehicles traveling north from I-90, and 1,700 of these, mostly commuters, exit at Interchange 27. During the PM peak hour, there are 7,800 northbound vehicles at Trapelo Road, 1,450 of which entered at Interchange 27, completing the commuter travel loop from residential areas to the north.
There is problem congestion between I-90 and Interchange 27 in the AM peak northbound and the PM peak southbound. The volume of traffic connecting with I-90, the design of the I-90/I-95 interchange, nearby ramps to and from local roads, and the managed lane capacity reduction in the next component to the south all contribute to problem congestion at this location. Concepts that would alleviate this congestion are currently under consideration. A CTPS memorandum from June 2011, “Low-Cost Improvements to Bottleneck Locations,” includes a plan to improve northbound AM traffic flow at the I-90/I-95 interchange.
Southbound PM traffic congestion should also lessen when the construction project to upgrade the managed lanes south of Route 9 to fully-built fourth lanes is completed. Route 128 continues as four lanes in each direction to Route 9, about two miles south of I-90, at which point only three lanes plus a managed lane are available during peak periods. A southbound queue forms behind this point of capacity reduction each afternoon. Another opportunity for reducing PM congestion may result from improvements in electronic tolling at I-90 Interchange 14, the toll plaza serving traffic entering the Turnpike from Route 128.
This study recommends that a preferential lane be considered in this component only north of Interchange 27. A preferential lane at this location would offer significant user benefits, appears to have manageable construction impacts, and would fit as a critical element into a more extensive regional system, offering peak period free-flow travel between New Hampshire/ Merrimack Valley and a well-defined employment center in Waltham. This would include improved access to intermediate locations.
In contrast, the problem in the southern part of this component is more localized, focusing on the two segments between Interchange 27 and I-90. The individual improvements currently underway or envisioned would, taken together, improve traffic flow in this area. Adding the capacity of a reversible preferential lane would provide useful additional capacity in a congested corridor, but at the cost of difficult highway reconstruction. Continued smaller-scale roadway improvements such as selective widening appear to be more appropriate in this area.
This is the longest component of the Route 128 corridor, extending 12 miles from I‑90 to Interchange 13 in Canton, at which point I-95 splits off from the circumferential corridor and continues south to Providence, Rhode Island. The northernmost two miles have four lanes in each direction. The 10 miles between Route 9 and I-95 (south) have three lanes each direction, with use of the breakdown lanes permitted during peak periods in both directions. The three-lane sections are currently being upgraded to include fully-built fourth lanes in each direction. As part of these improvements, a new interchange is planned at Kendrick Street, between interchanges 18 and 19 in Needham.
The representative segment is the northernmost of the segments currently using managed lanes, between Interchange 20, Route 9, and Interchange 19, Highland Avenue. This segment has the highest vehicles per lane for the AM peak hour in the northbound direction, and the highest for the PM peak hour in the southbound direction. Using the approximation of a managed lane capacity being one-half that of a fully-built lane, this segment carries 2,314 vehicles per lane northbound during the AM peak hour, the highest volume per hour per lane that appears in Table 9. The same calculation shows 2,000 vehicles per lane southbound during the PM peak hour.
Table 9 shows the benefit of a preferential lane, assuming current traffic volumes and the existing highway configuration. In this instance, moving 1,500 vehicles per hour into a northbound preferential lane during the AM peak would result in 1,886 vehicles per general-purpose lane, assuming continued use of the managed lane. This would be a significant improvement over 2,314 vehicles per lane, but the 1,500 preferential-lane users would enjoy a considerable advantage. During the PM peak, moving 1,500 vehicles per hour into the preferential lane southbound would result in 1,571 vehicles per general-purpose lane, still offering an advantage to preferential-lane users.
The completion of the fully-built fourth lanes in both directions changes these calculations significantly. During the AM peak hour there would be 2,025 vehicles per northbound lane without a preferential lane. With a preferential lane there would be 1,650 vehicles per general-purpose lane and preferential-lane users would still realize a significant advantage. During the PM peak hour there would be 1,750 vehicles per southbound lane without a preferential lane. The availability of a southbound preferential lane during the PM peak would serve only to divide southbound traffic over five lanes with 1,400 vehicles per lane, and preferential-lane users would realize no advantage.
With completion of the fully-built fourth lanes and implementation of a reversible preferential lane, preferential-lane users traveling northbound during the AM peak would realize an advantage over the four general-purpose lanes from Interchange 16, Route 109 in Dedham, all the way to I-90, a distance of just under eight miles. Southbound preferential-lane users during the PM peak would have no advantage over the general-purpose lanes for the entire 12-mile distance between I-90 and the interchange with I-95 (south) assuming current traffic levels.
The fact that a reversible preferential lane in this component would meet the preferential lane benefit criterion in one direction but not in the other does not necessarily disqualify this section of highway from inclusion in the recommended set of projects. Long-term traffic growth would be expected to increase the benefits in the northbound direction during the AM peak, and eventually result in southbound benefits during the PM peak.
Construction of a reversible lane in the median of this component would encounter a range of issues ranging from straightforward to challenging. Interestingly, the Norfolk County jail, located in the median in Dedham, would not present a problem. Modifying bridges being reconstructed as part of the current improvements would be possible, though this would understandably be viewed negatively. The most difficult section to reconstruct would be the existing eight-lane section between I-90 and Route 9, which is either next to or within the Charles River Reservation for a majority of its length. This reconstruction would also entail major redesign of the complex of ramps serving Route 16, Grove Street, and I-90, interchanges 21 through 24.
The principal drawback to implementing a reversible preferential lane in this component is envisioning its role in a regional preferential lane system. The construction of any reversible preferential lane is not only a major undertaking, but also represents an important change in how the regional expressway system is organized. The underlying logic of the change should be apparent.
The underlying logic is not clear here, and the anticipated PM southbound condition best illustrates the problem. In the component immediately to the north, there is a congestion problem southbound during the PM peak between U.S. 20 and the entrance to I-90. If a preferential lane were built in this segment immediately north of I-90 which extended south of I-90, southbound users would realize an advantage only in the first segment. South of I-90 the general-purpose lanes would have the same number of vehicles per lane as the preferential lane, and there would be no incentive to form a carpool, pay a toll, or perhaps take a new bus service. The fact that these two preferential lane sections would not work well together during the PM peak actually serves to eliminate both elements from inclusion in an envisioned regional system.
The case for a preferential lane is clearer during the northbound AM peak. North of Interchange 16, Route 109, there are currently 7,850 northbound vehicles during the AM peak hour using the available lanes. The northbound lanes add vehicles at each interchange until reaching the four-lane section north of Route 9, at which point there are 8,200 vehicles during the peak hour using the four fully-built lanes. This volume of traffic continues until Interchange 27 at Winter Street/Totten Pond Road, a commuter destination. This stretch currently has 2,050 vehicles per hour per lane, a number that would be reduced to 1,625 vehicles per lane if 1,500 vehicles could be moved to a northbound preferential lane.
This study acknowledges the potential benefit that a preferential lane could bring to northbound traffic in this area during the AM peak. Reconstruction of this section of highway to incorporate a reversible preferential lane is not being recommended, however, for several reasons. The first issue is the absence of southbound PM benefits south of I-90. Second, adding a reversible lane would force the reconstruction and most likely the reconfiguration of the numerous closely-spaced ramps immediately north and south of I-90. Proposing a change of this magnitude, especially in an area bordered by several conservation and recreation land uses, could be considered beyond the scope of this study. Also, more limited improvements in this corridor, such as locations described in the June 2011 memorandum “Low Cost Improvements to Bottleneck Location,” may prove to be more appropriate.
The southernmost component of the western arc of the Route 128 circumferential system is also the southernmost part of I-93. Near the point where Dedham, Westwood, and Canton meet, I-95 meets the beginning of I-93, at which point I-95 leaves the circumferential corridor and heads south towards Providence, Rhode Island. From its start at this location, I-93 goes east to meet Route 3 at the Braintree Split, and then turns north, becoming the Southeast Expressway. Between I-95 (south) and the Braintree Split, I-93 comprises two components, the first between I-95 (south) and Route 24, and the second between Route 24 and the Braintree Split. The second component was discussed earlier as part of the closely associated I-93 group of components.
There are currently three lanes in each direction with peak period use of managed lanes in both directions between I-95 (south) and Route 24. The managed lanes are currently being upgraded to fully-built fourth lanes. The component is less than three miles in length and has only three segments, being intersected by Route 138 at Interchange 2 and Ponkapoag Trail at Interchange 3.
The representative segment is between Ponkapoag Trail and Route 24. Ponkapoag Trail is not a major interchange, but it is used much more heavily in the direction of Route 24 than in the direction of I-95 and Route 138. As can be seen in Figure 3, the AM peak direction is northbound, towards the western circumferential arc. Much of this AM traffic is from Route 24, but some also comes from Route 3 (south) and passes through the Braintree Split to travel on the circumferential highway. In the PM the peak flow is reversed, with traffic from the circumferential corridor turning southbound on Route 24, or continuing through the Braintree Split to Route 3 (south).
With managed lanes, a preferential lane would provide benefits during both the AM and PM peaks. With completion of the fully-built fourth lanes, however, preferential-lane users would realize an advantage only during the AM peak northbound, but not during the PM peak southbound. Because benefits would be limited to one direction, a reversible preferential lane for the length of this component is not recommended here.
The heavier traffic between Ponkapoag Trail and Route 24 does, however, present an interesting opportunity to provide preferential lane advantages. The I‑93/Route 24 interchange has a T-configuration, and one or more preferential lanes are envisioned to pass through this interchange connecting peak period traffic flows between the Braintree Split and Route 24. The design of preferential lanes passing through this interchange should incorporate an option of splitting into two branches. These branches would connect with I-93 immediately east of the Ponkapoag Trail interchange, allowing eligible vehicles traveling east from I-95 and Route 138 convenient entry to the I-93 Group preferential lane system, either towards the Braintree Split or to Route 24.
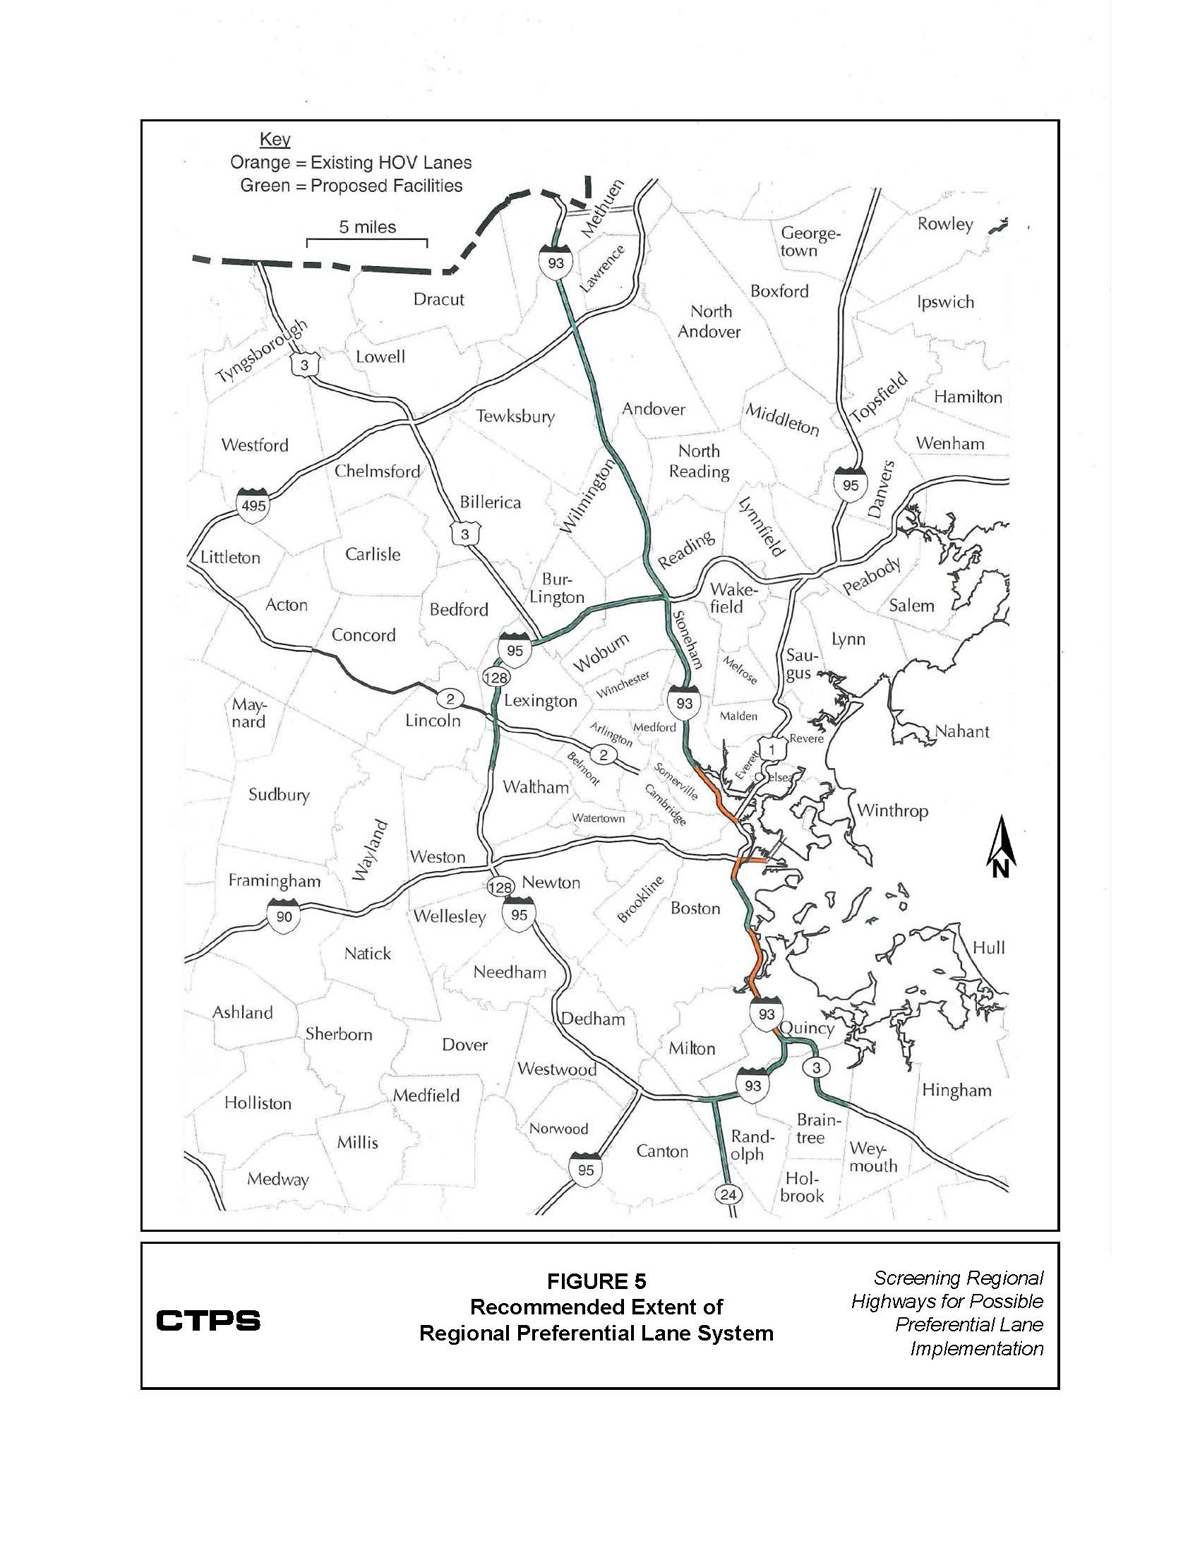
The sections of express highway recommended in the component-by-component analysis for inclusion in a regional preferential lane system are shown in Figure 5. The proposed new preferential lanes use the existing HOV lanes as the nucleus of a regional system. The proposed system extends far beyond this nucleus, however, but only to the extent that a preferential lane is a viable improvement. It is also anticipated that the parts of the system will reinforce each other and function much as a single system, with each part enhancing the user benefits in the system parts with which it connects.
Over most of the proposed system shown in Figure 5, traffic is so heavy that even with the addition of a preferential lane accommodating 1,500 vehicles per hour, the vehicles per hour per lane in the general-purpose lanes would be even higher, resulting in an incentive for drivers to meet the requirements of preferential lane use. At only a few points does traffic fall below this threshold, and these several instances are within extensively congested components. In addition, these calculations are based on current traffic volumes, and any traffic growth, whether it represents a long-term regional trend or a shorter-term adaptation to new capacity, will increase the benefit that preferential-lane users can realize.
Another characteristic of the proposed system is that no capacity is removed in order to provide for a preferential lane. In only one instance, Route 3 (south) in Braintree, is a contraflow “zipper” lane even considered, and then only after a lane is added in each direction.
Construction issues such as costs, land takings, and environmental impacts are only touched upon in this analysis. It was the intent of this study to err on the side of inclusiveness; to consider projects to be feasible even if required reconstruction is clearly extensive. Only in the most constrained situations, such as the Turnpike Extension between West Newton and Newton Corner, were construction impacts considered so great that a recommendation was withheld. Further investigation may determine that in certain locations with strong traffic growth trends and manageable construction costs, preferential lane implementations that were not recommended in this study should be considered. Conversely, in some recommended locations, construction expenses may prove to significantly exceed potential benefit.
The next step in considering a regional preferential lane system would be to develop a set of specific planning-level proposals. As part of this, the placement of entry/exit sections is of critical importance in determining the usefulness of a preferential lane. Any required bridge reconstruction or modification needs to be identified, as well as any insufficiently wide right-of-way. When specific locations are identified for potential projects, micro-simulation analysis supported by regional travel demand modeling would probably be desirable.
The era of rapid traffic growth may now be in the past for express highways that are now substantially full, such as I-93, the Southeast Expressway and Route 128. It is reasonable, however, to expect some level of steady regional travel growth, in both auto and other modes, in response to gradual demographic growth and economic expansion. If the regional expressway system is to have a role in accommodating future travel growth, a regional preferential lane system may provide a valuable new backbone of added capacity.
WSK/wsk